Fluorescence detection is emerging as a powerful tool with wide applications in life sciences. Fluorescent molecules are sensitive to the environment e.g. temperature, pH, polarity, oxidation state and the proximity of quenching groups which can alter quantum yield or wavelength of emitted light. Fluorescence allows in situ studies including binding of ligands such as a drug or hormone to a receptor, measurement of concentration of metabolites, study of structure, orientation, fluidity and distances between molecules. The technique is inherently sensitive, so that single molecules have been routinely detected in research laboratories. Yet in practical situations, where complex samples of biological origin must be used, such as in proteomics or clinical medicine the presence of interfering background makes fluorescence detection more difficult and the need arises for the fluorescence signals to be amplified. Fortunately a physical nanoscale phenomenon exists which enables such amplification [
1]. It is particularly pronounced in close proximity to metal nanostructures and it has a sharp distance dependence, which is ideally suited to monitor biorecognition reactions. The process manifests itself by enhancement of the quantum yield and reduced fluorescence lifetimes [
2]. Earlier fluorescence amplification studies were carried out by using silver colloids immobilized on the glass surface, light-deposited and electroplated silver, roughened silver electrodes as well as nanolithograhically produced structures [
3-
5]. Much of the recent work was carried out with silver islands deposited by the reduction of silver citrate method [
6]. In this paper we review a suite of our earlier published and unpublished studies aimed at developing practical protocols for the detection of low abundance proteins in biological samples. To achieve improved sensitivity, these protocols need to be modified by the application of metal nanostructures to ensure high and/or spatially homogenous fluorescence enhancement.
Our first effort [
7] focused on developing the understanding of reasons for high fluorescence amplification in silver fractals, highly nonuniform metal nanostructures which have, so far, shown the highest values of enhancement, over × 100 [
8,
9]. The structures were prepared by a well established method by placing two pieces of silver foil about 25 mm apart between two microscope slides and filling the gap with deionized water (pH 6.4). A direct current of 100 mA was passed between two silver foil electrodes for 20 min. We used two types of fluorescent monolayers, one was FITC labeled HSA and rabbit-antirabbit IgG conjugate. It should be noted that in the HSA-FITC complex the fluorophore is close to the optimal distance for fluorescence enhancement while the second monolayer can be easily compared with literature. Binding of FITC-HSA to the surfaces took place by incubating the surfaces in a 10 μM FITC-HSA solution overnight at 4 °C, followed by rinsing with buffer. The deposition of IgG monolayers required a broadly similar procedure as FITC-HAS. However, to remove the unbound materials by rinsing with buffer, the surface needed to be blocked and the conjugate labeled with the fluorophore Rhodamine Red-X.
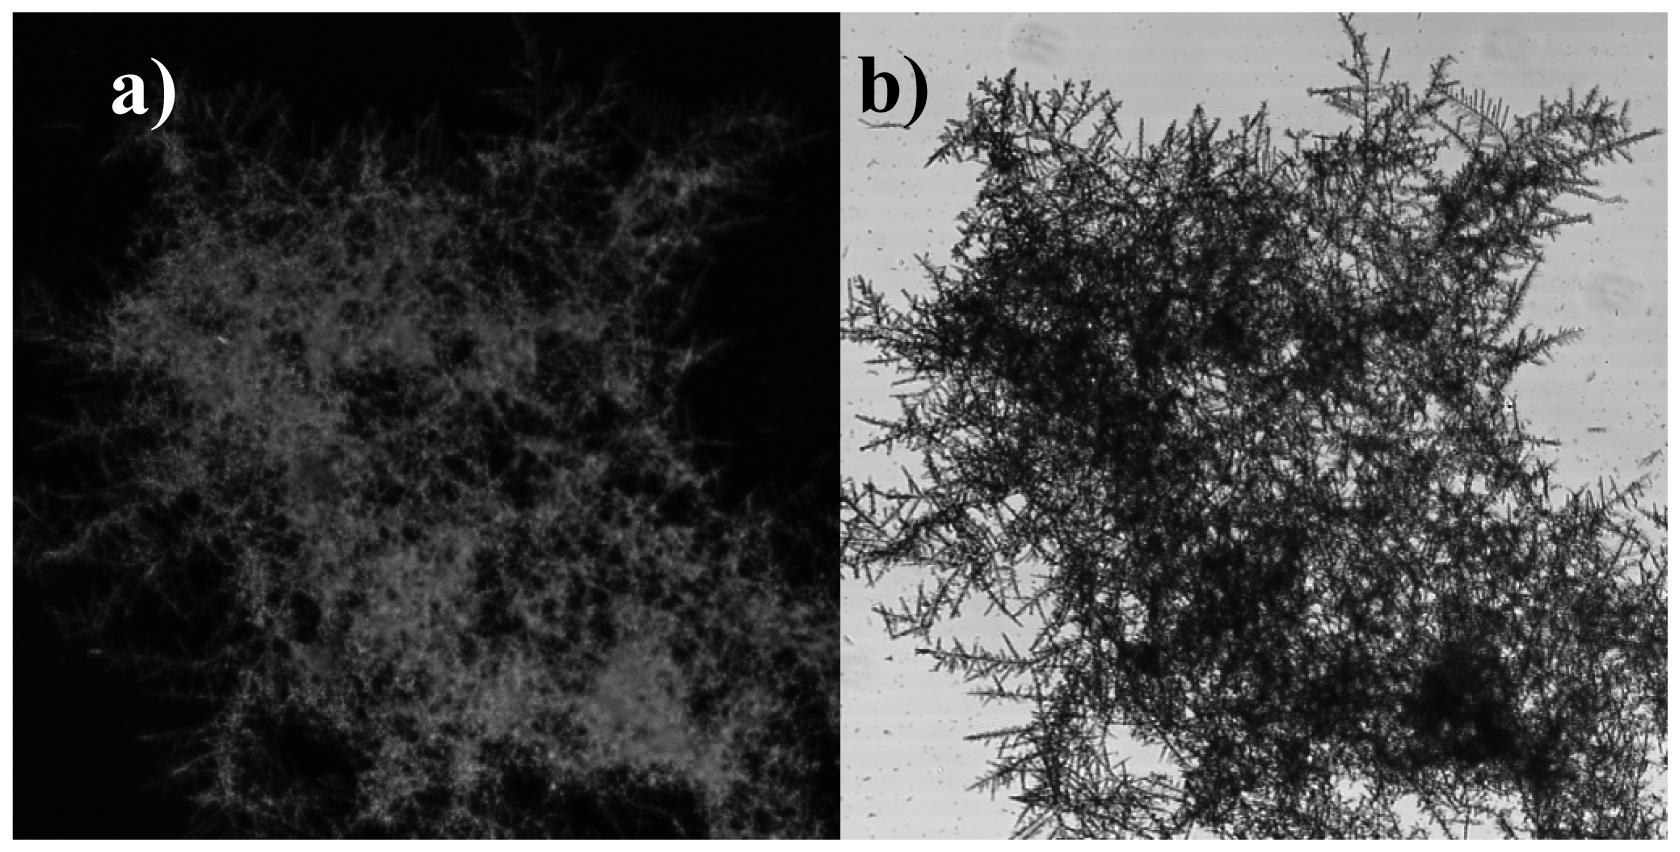
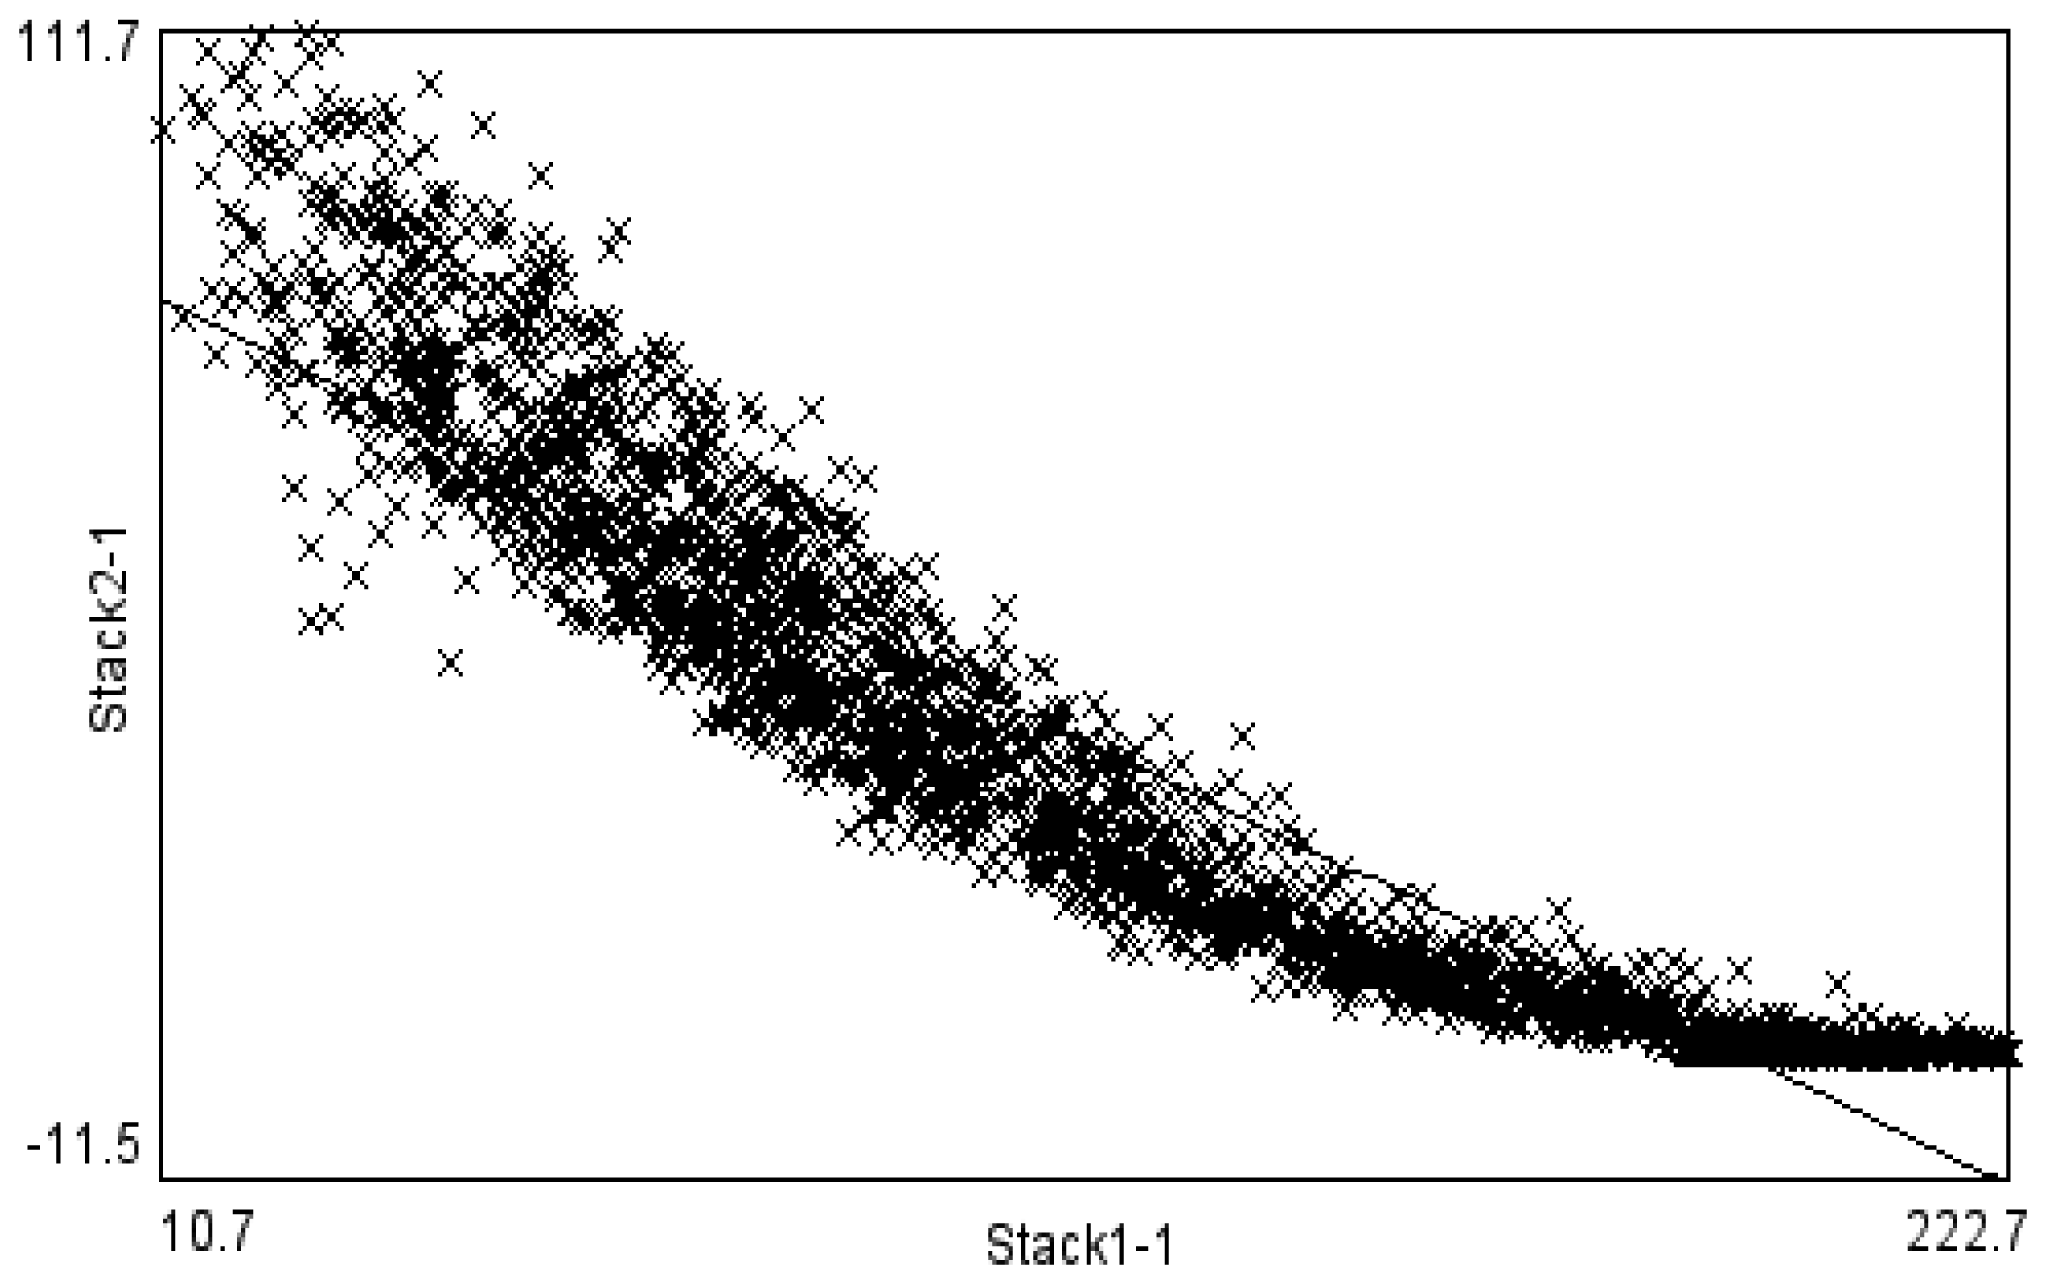
These structures were first examined in a laser scanning microscope and also in transmission as shown in
Figure 1a and 1b. These two images were found to be highly correlated (
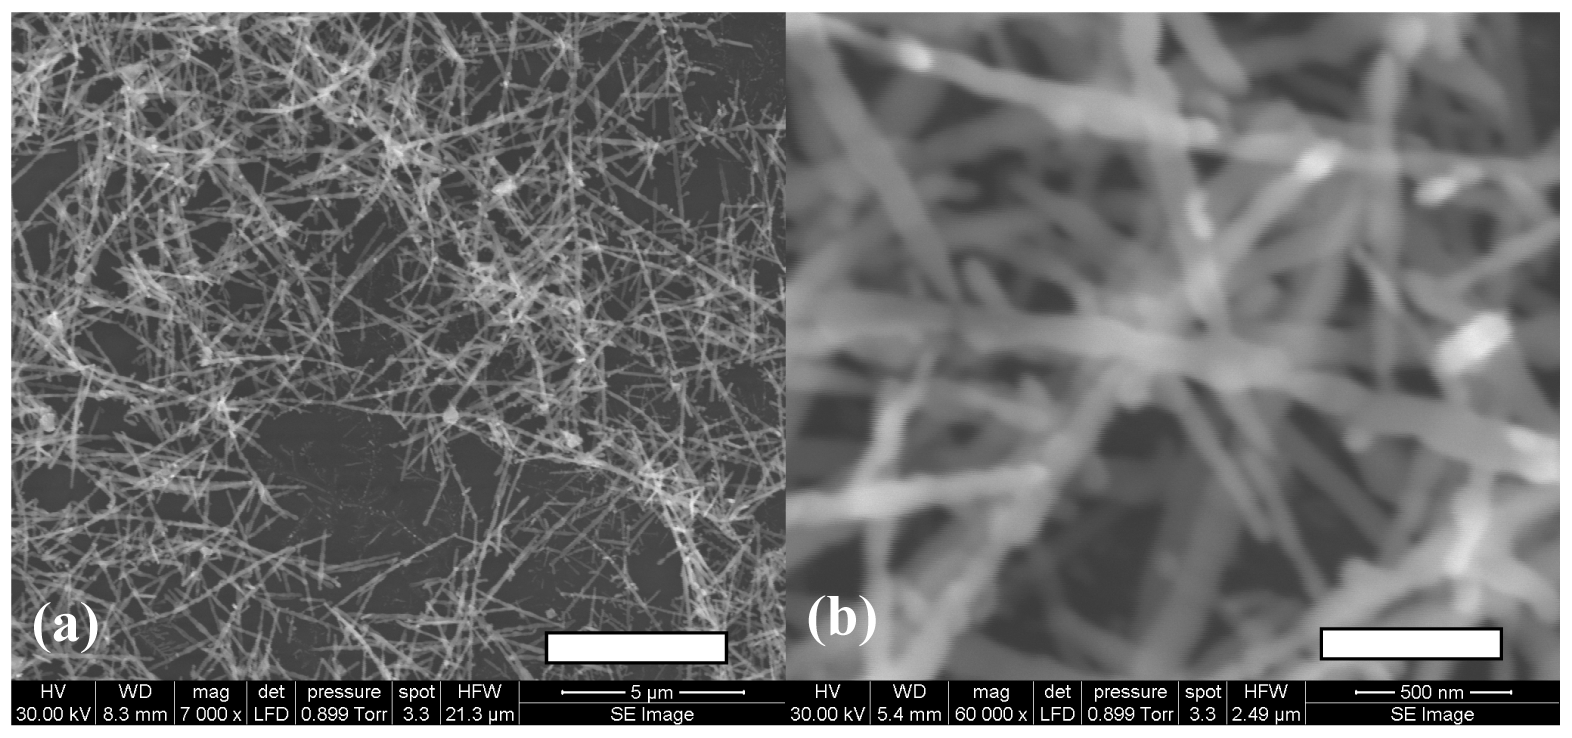
Figure 2), with brighter regions in close correspondence to the thicker regions. A higher magnification SEM image shown in
Figure 3 revealed that the structures had loose nanowire architecture with an arrangement of silver nanowires several micrometers in length and similar radius of approximately 50-100 nm in diameter. In such structures the surface area is proportional to thickness of the deposit and thus a possible reason for high fluorescence signals could be simple structure geometry and not fluorescence amplification.
To identify the actual cause we carried out fluorescence lifetime imaging of fluorescent monolayers deposited within the silver structures. We focused on two regions: a thin region with dense but visibly discontinuous branches and a thick region which under the optical microscope appeared to contain a dense and continuous silver layer. As a control we used a region outside of the structure where no apparent silver could be observed. The fluorescence decay curves collected in each pixel could be satisfactorily fitted using a model with two decay times t
1 and t
2, from which an average value is calculated using the weighting a
1 and a
2 for each of the decay components. The results clearly indicate that average fluorescence lifetime for the fluorophores deposited over the silver is significantly reduced, from about 1.6 ns to less than 0.194 ns in thin areas and about 0.155 ns in thick areas. Such strong decrease of the fluorescence lifetime is consistent with the effect of fluorescence amplification in the proximity of metals. Moreover, the spatial correlation analysis of long and short decay components for the examined samples revealed that they are also correlated. The lifetimes become smaller near the locations where the deposit thickness increases. The reduction in lifetime coupled with increase in fluorescence intensity (
Figure 1) is explained by an increase in the radiative decay rate which has been reported in the proximity of metal surfaces. These effects are explained by coupled excitation in the nanowires close to a given fluorophore, which are likely to extend over a micrometer distances. The nanowires also promote fluorescence amplification in other ways as with their high aspect ratio and sharp tips act as antennas for the radiating fluorophores. In conclusion the silver nanowire system exhibits high fluorescence amplification due to a combination of several effects [
21]. First, there is a contribution to amplification due to simple proximity to metal. Secondly, the metal has a very high surface area due to its special architecture. Thirdly, it has the ability to enhance excitation and/or emission due to the presence of sharp metal tips. Finally the nanowires themselves and also the fact that they are closely coupled enhance the ability of fluorophores to radiate out. All these effects take place simultaneously and this is how very high amplification can be achieved.
The understanding of the various effects and the role they play in fluorescence amplification makes it possible to design highly sophisticated structures which could be more relevant for proteomics than the highly nonuniform silver fractals. Thus we turned our attention to colloid nanoparticles, widely studied before, although their amplification was limited, especially in liquid phase [
10]. We commenced this study with gold colloids produced using a standard Frens method [
11]. Such colloids can also be obtained from commercial suppliers, and they can be deposited over large areas with very good uniformity, however these colloids are comparatively small and the earlier study of silver nanowires clearly suggested that the size of the radiating particle plays a critical role. Additionally, the literature clearly shows that silver is a better choice of metal for fluorescence amplification than gold, due to its fortuitous frequency dependence of its complex dielectric constant. These two ideas have been brought together by using silver-coated gold colloids in our work [
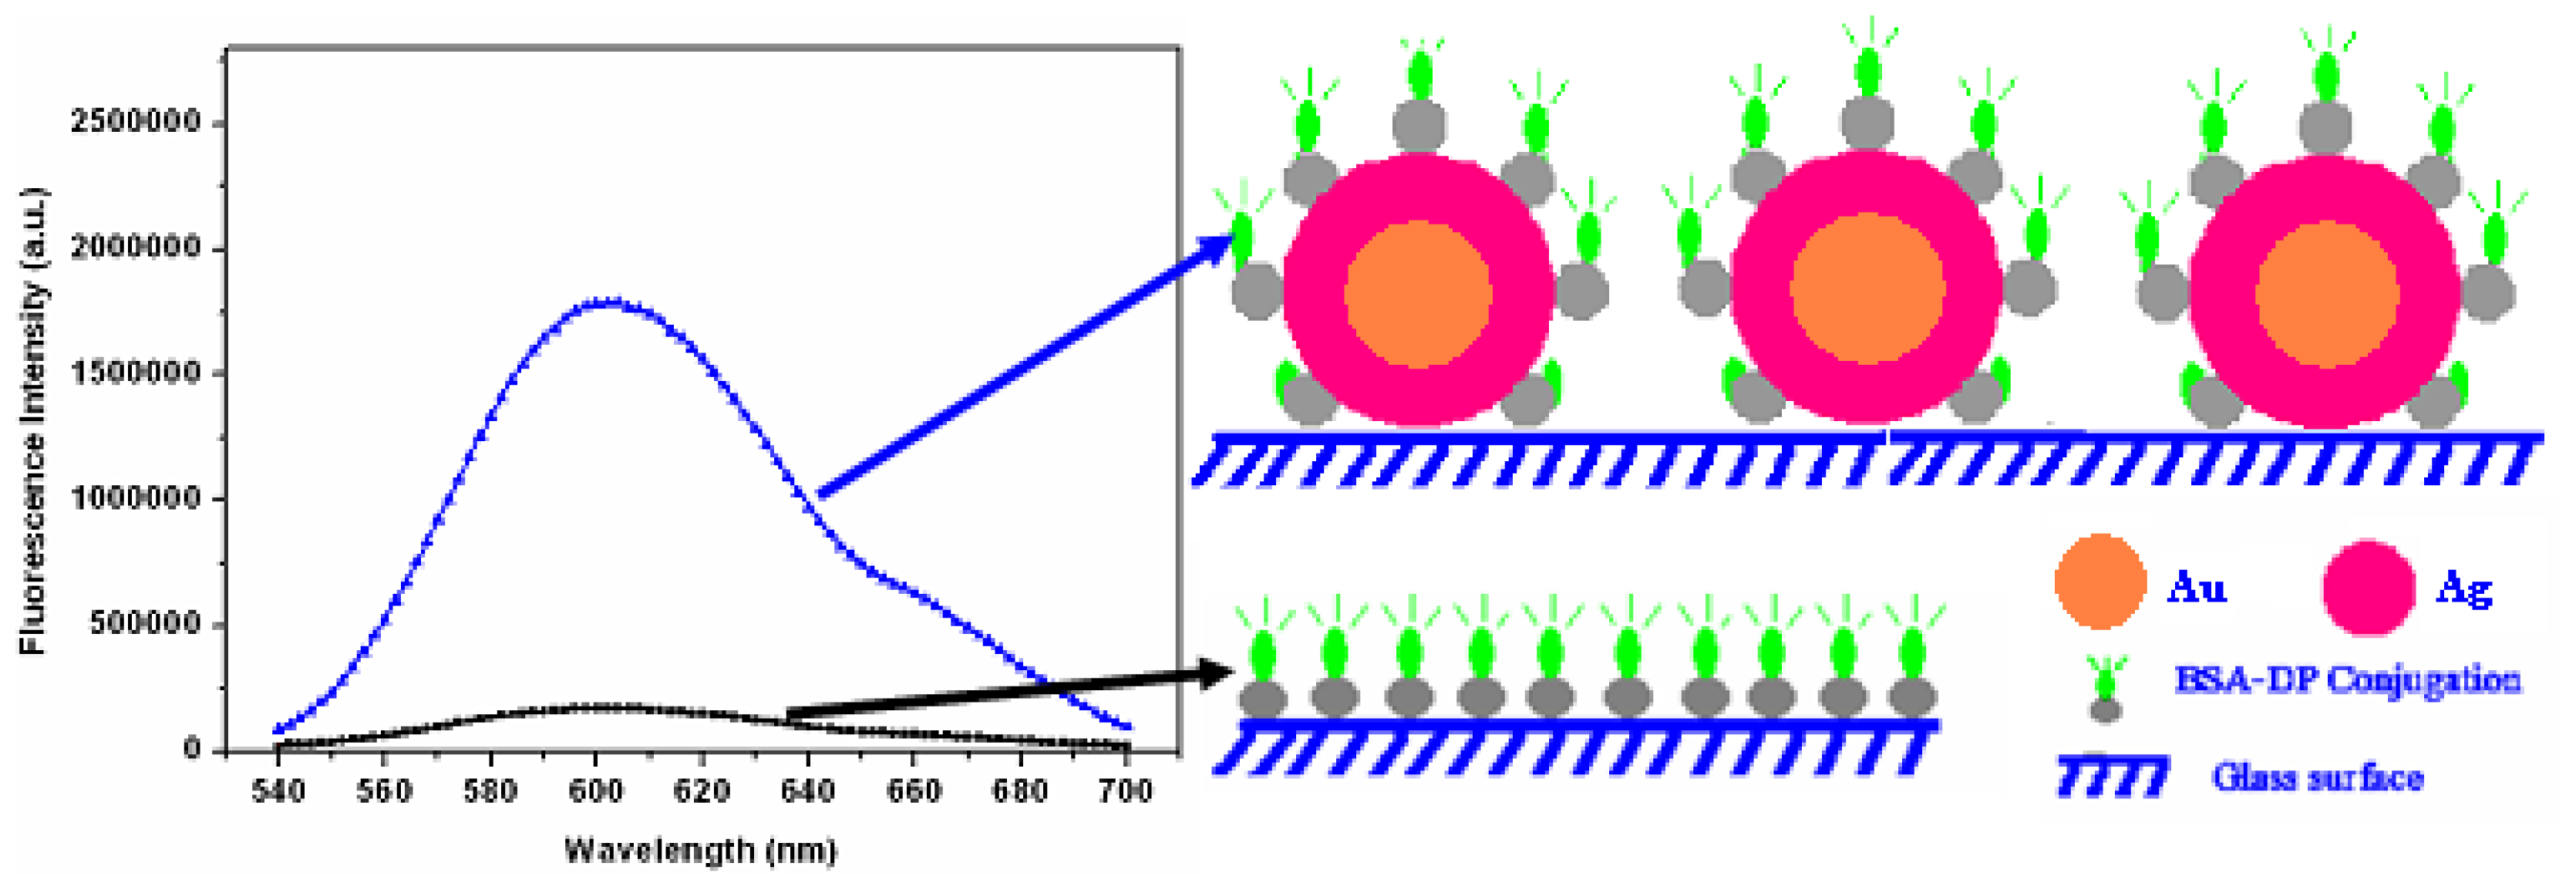
12] where a simple method has been developed for the deposition of uniform silver-coated nanoparticles on glass substrates, with a homogeneous distribution. The basic strategy for fluorescence enhancement is illustrated in
Figure 4. The fluorescence intensities of fluorophores on metallic surfaces were measured as well as the glass surface as a control. The enhancement factor was determined based on the ratio of fluorescence intensity on metallic surface to the same quantity measured on glass surface.
The homogeneous deposition of nanoparticles requires derivatisation of the glass slide by organosilane, APTMS, by immersing it into 10 mM methanolic solution. In this technique, APTMS is first chemically bonded to hydroxyl groups on the glass substrate surface. The amino-functional groups present in APTMS facilitate the attachment of gold nanoparticles. After 2 hours, the substrate was removed and rinsed with CH
3OH to remove unbound monomers from the surface. Prior to derivatization with Au colloid, the glass substrate was rinsed thoroughly with water; it was then immersed in the Au colloid solution to form a monolayer of Au nanoparticles on glass surface. Depending on time and concentration of the Au colloid solution, Au nanoparticle layers with various inter-particle distances were formed on the glass surface. A final rinse with water and drying with N
2 concluded the derivatization process. The colloids after deposition on glass were coated with silver by using a commercial silver enhancing kit from Sigma Aldrich. The interaction between silver ions and the reducing agent, which is silver nitrate and hydroquinone respectively, is described by the following reaction:
When the Au colloids are placed in a solution containing reducing molecules, for example, hydroquinone – Hq, and silver ions, they attract both the reducing molecules and silver ions [
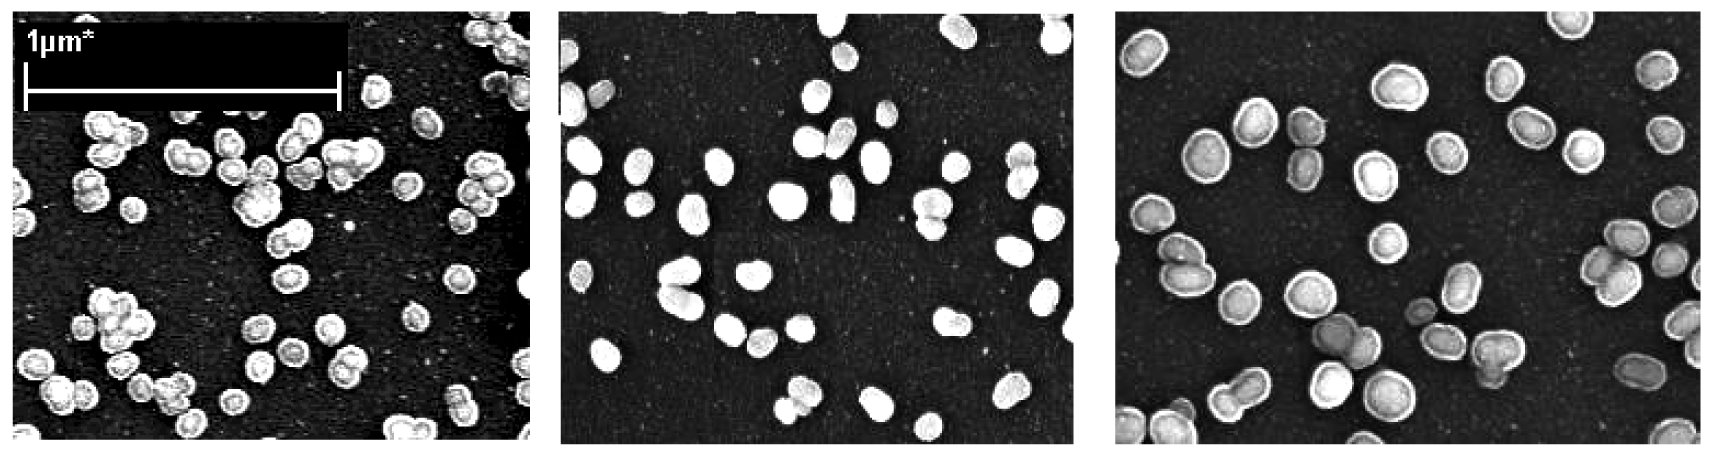
13]. After attaching to the Au crystal, the Hq molecule releases two electrons into the valence cloud of the Au crystal lattice. These extra electrons eventually cause two silver ions to be included in the growing deposit by reducing them to metallic silver atoms. At the same time, hydroquinone molecules are oxidized to quinine and physically released from the growing crystal. The scanning electron micrographs (
Figure 5) show not only the size but also the surface morphology of the Au-core Ag-shell nanoparticle. They were approximately spherical, especially at short silver enhancing times. Upon close examination, the formed nanoparticles reveal a more complex shape, especially at longer silver enhancing times. The average particle sizes, with 1 minute and 3 minutes silver enhancing time were about 19 nm and 47 nm respectively.
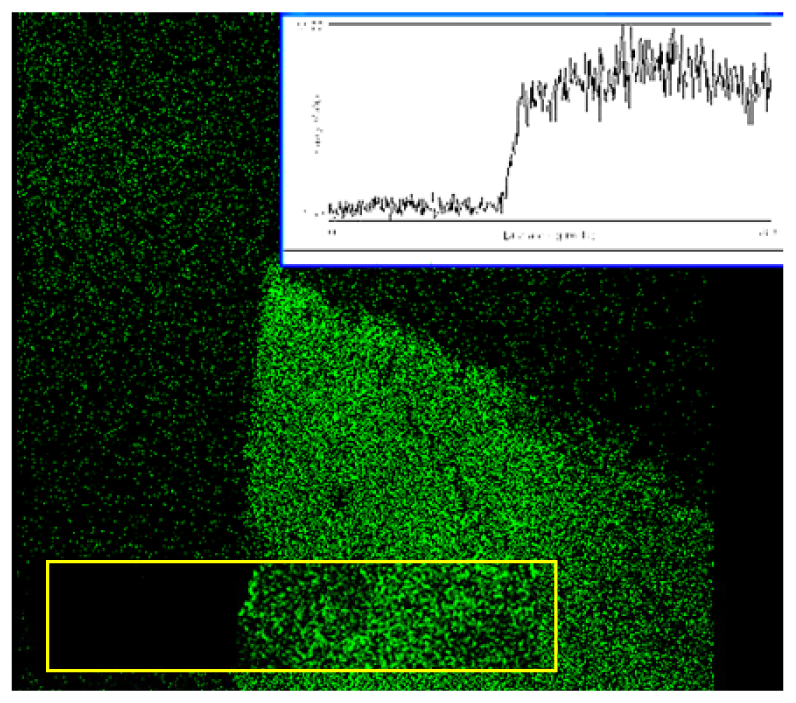
Fluorescence enhancement was investigated using monolayers of FITC-conjugated Human Serum Albumin (FITC-HSA). The enhancement factor was determined as the ratio of fluorescence intensity on silvered surface to the fluorescence intensity on glass surface, given both surfaces are known to have complete monolayer coverage. The enhancement factor for the silvered sample with 3 minutes silver enhancing time is over 10. This observed increase of fluorescence intensity can be underpinned by geometrical effects such as an increased surface area. We have accounted for such geometrical factors by calculating the total radiant flux emitted by the fluorophore layer covering our nanostructures, thus proving that these play an insignificant role. Good spatial homogeneity of the enhancement factor is shown in
Figure 6.
While this work represented progress towards practically useful amplifying substrates we were conscious of some drawbacks of silver. Silvered surfaces perform well when stored in water and used within few days after preparation. However, such surfaces deteriorate after long storage times and are prone to oxidation, so their shelf-life is limited. Upon exposure to air at higher temperatures used, for example to deactivate biological molecules' accelerates the oxidation process. In contrast, gold surfaces resist oxidation much better and remain stable for many months after preparation. As indicated earlier, gold based substrates using Au colloids can be produced with well-controlled and homogenous coverage. However, earlier authors were able to achieve very limited fluorescence enhancement by using gold, in the order of 3 only [
14]. Our earlier studies clearly indicated that one of the key reasons was small size of these colloids, and the fact that in suspension the nanoparticles tend to be isolated, so aggregation conducive to forming regions of local electromagnetic field enhancement is absent.
We have therefore attempted to produce gold colloids with increased size and higher density coverage so that some degree of aggregation and collective plasmonic effects such as inter-particle coupling become possible [
15]. In our study, in addition to the widely used fluorophore-FITC, a newly developed fluorophore Deep Purple was also used. The active compound of Deep Purple, epicocconone, is a heterocyclic natural product from the fungus
Epicoccum nigrum that fluoresces weakly in the green (520 nm). This fluorescence intensity shifts to red (610 nm) with a concomitant increase in quantum yield to 0.2 in the presence of a protein [
16]. Deep Purple has been widely used in proteomics in applications such as 1D/2D gel electrophoresis and electro-blots and in live cell imaging. In this study the preparation of various sizes Au colloids was carrid out in the following fashion., 100 ml of 0.01% HAuCl
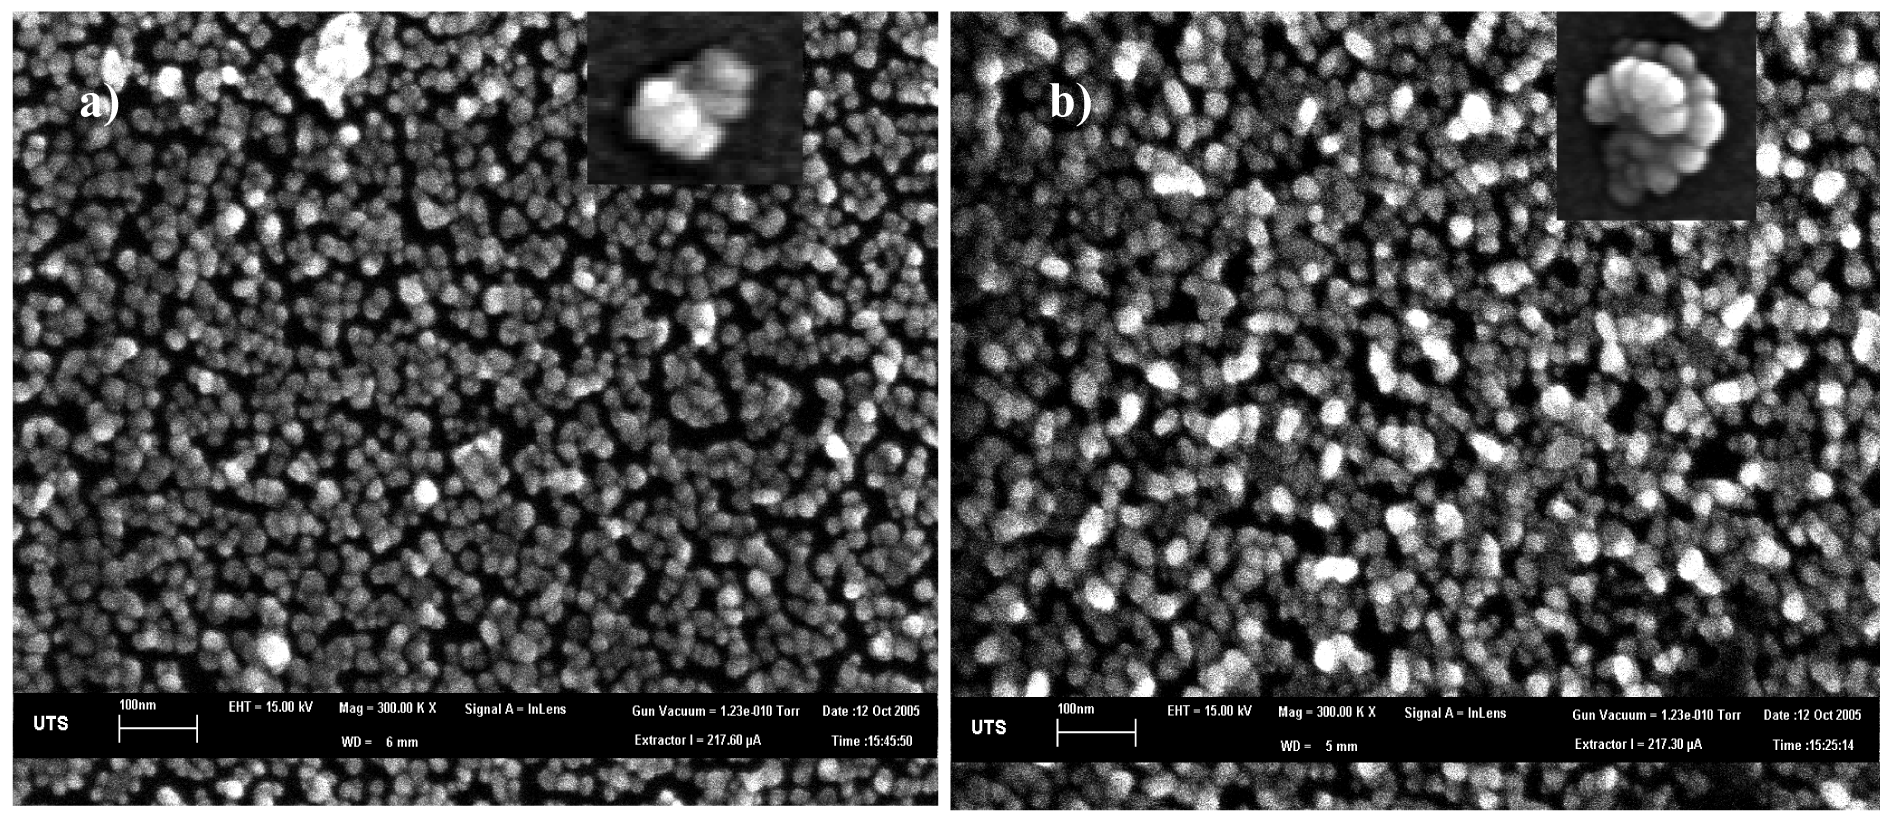
4 was brought to a rolling boil with vigorous stirring in a 500 mL three-neck round-bottom flask with a condenser. 1 mL, 0.75 mL, and 0.5 mL of 38.8 mM sodium citrate was rapidly added to the vortex of the solution, respectively, to produce different sizes of Au colloid. Boiling was continued for about 10 minutes before the heating mantle was removed with vigorous stirring until the solution reached room temperature. The resulting colloidal solution was characterized by UV-visible spectroscopy. Scanning electron microscopy (
Figure 7) showed the particles have an average size of 80 ± 7 nm and 118 ± 11 nm, and 162 ± 17 nm, respectively.
For nanoparticle deposition, we employed the established technique of self assembly of Au colloids on glass surfaces [
17]. The APTMS-modified glass slides were incubated in Au colloid solutions for 2 and 24 hours, respectively, producing two groups of slides. Two types of samples were prepared, with large inter-particle distance and hence little or no inter-particle coupling and small inter-particle distance producing effective inter-particle coupling. After 2 hours incubation time the layers showed the inter-particle distances are about 310 nm, 480 nm, 550 nm for the respective sizes of Au colloid, as obtained from the by nanoparticle densities observed on the SEM images. As the center-to-center spacings are more than 2-3 times the particle size, in this group of slides the inter-particle coupling is practically absent [
18]. In contrast, for the samples with 24 hours incubation time, individual particles in the self-assembled layer have small inter-particle distances (55 nm, 96 nm, and 67 nm) which lead to effective coupling as the electromagnetic interaction is stronger. The fluorescent enhancement was investigated by forming a monolayer of FITC-conjugated human serum albumin (FITC-HSA) and Deep Purple-conjugated bovine serum albumin (DP-BSA) both on gold nanoparticle covered glass surface as well as on bare glass surface as a control, respectively. The enhancement factor (E
t) was determined as the ratio of fluorescence intensity on metallic surface to fluorescence intensity on glass based on the fluorescence spectra.
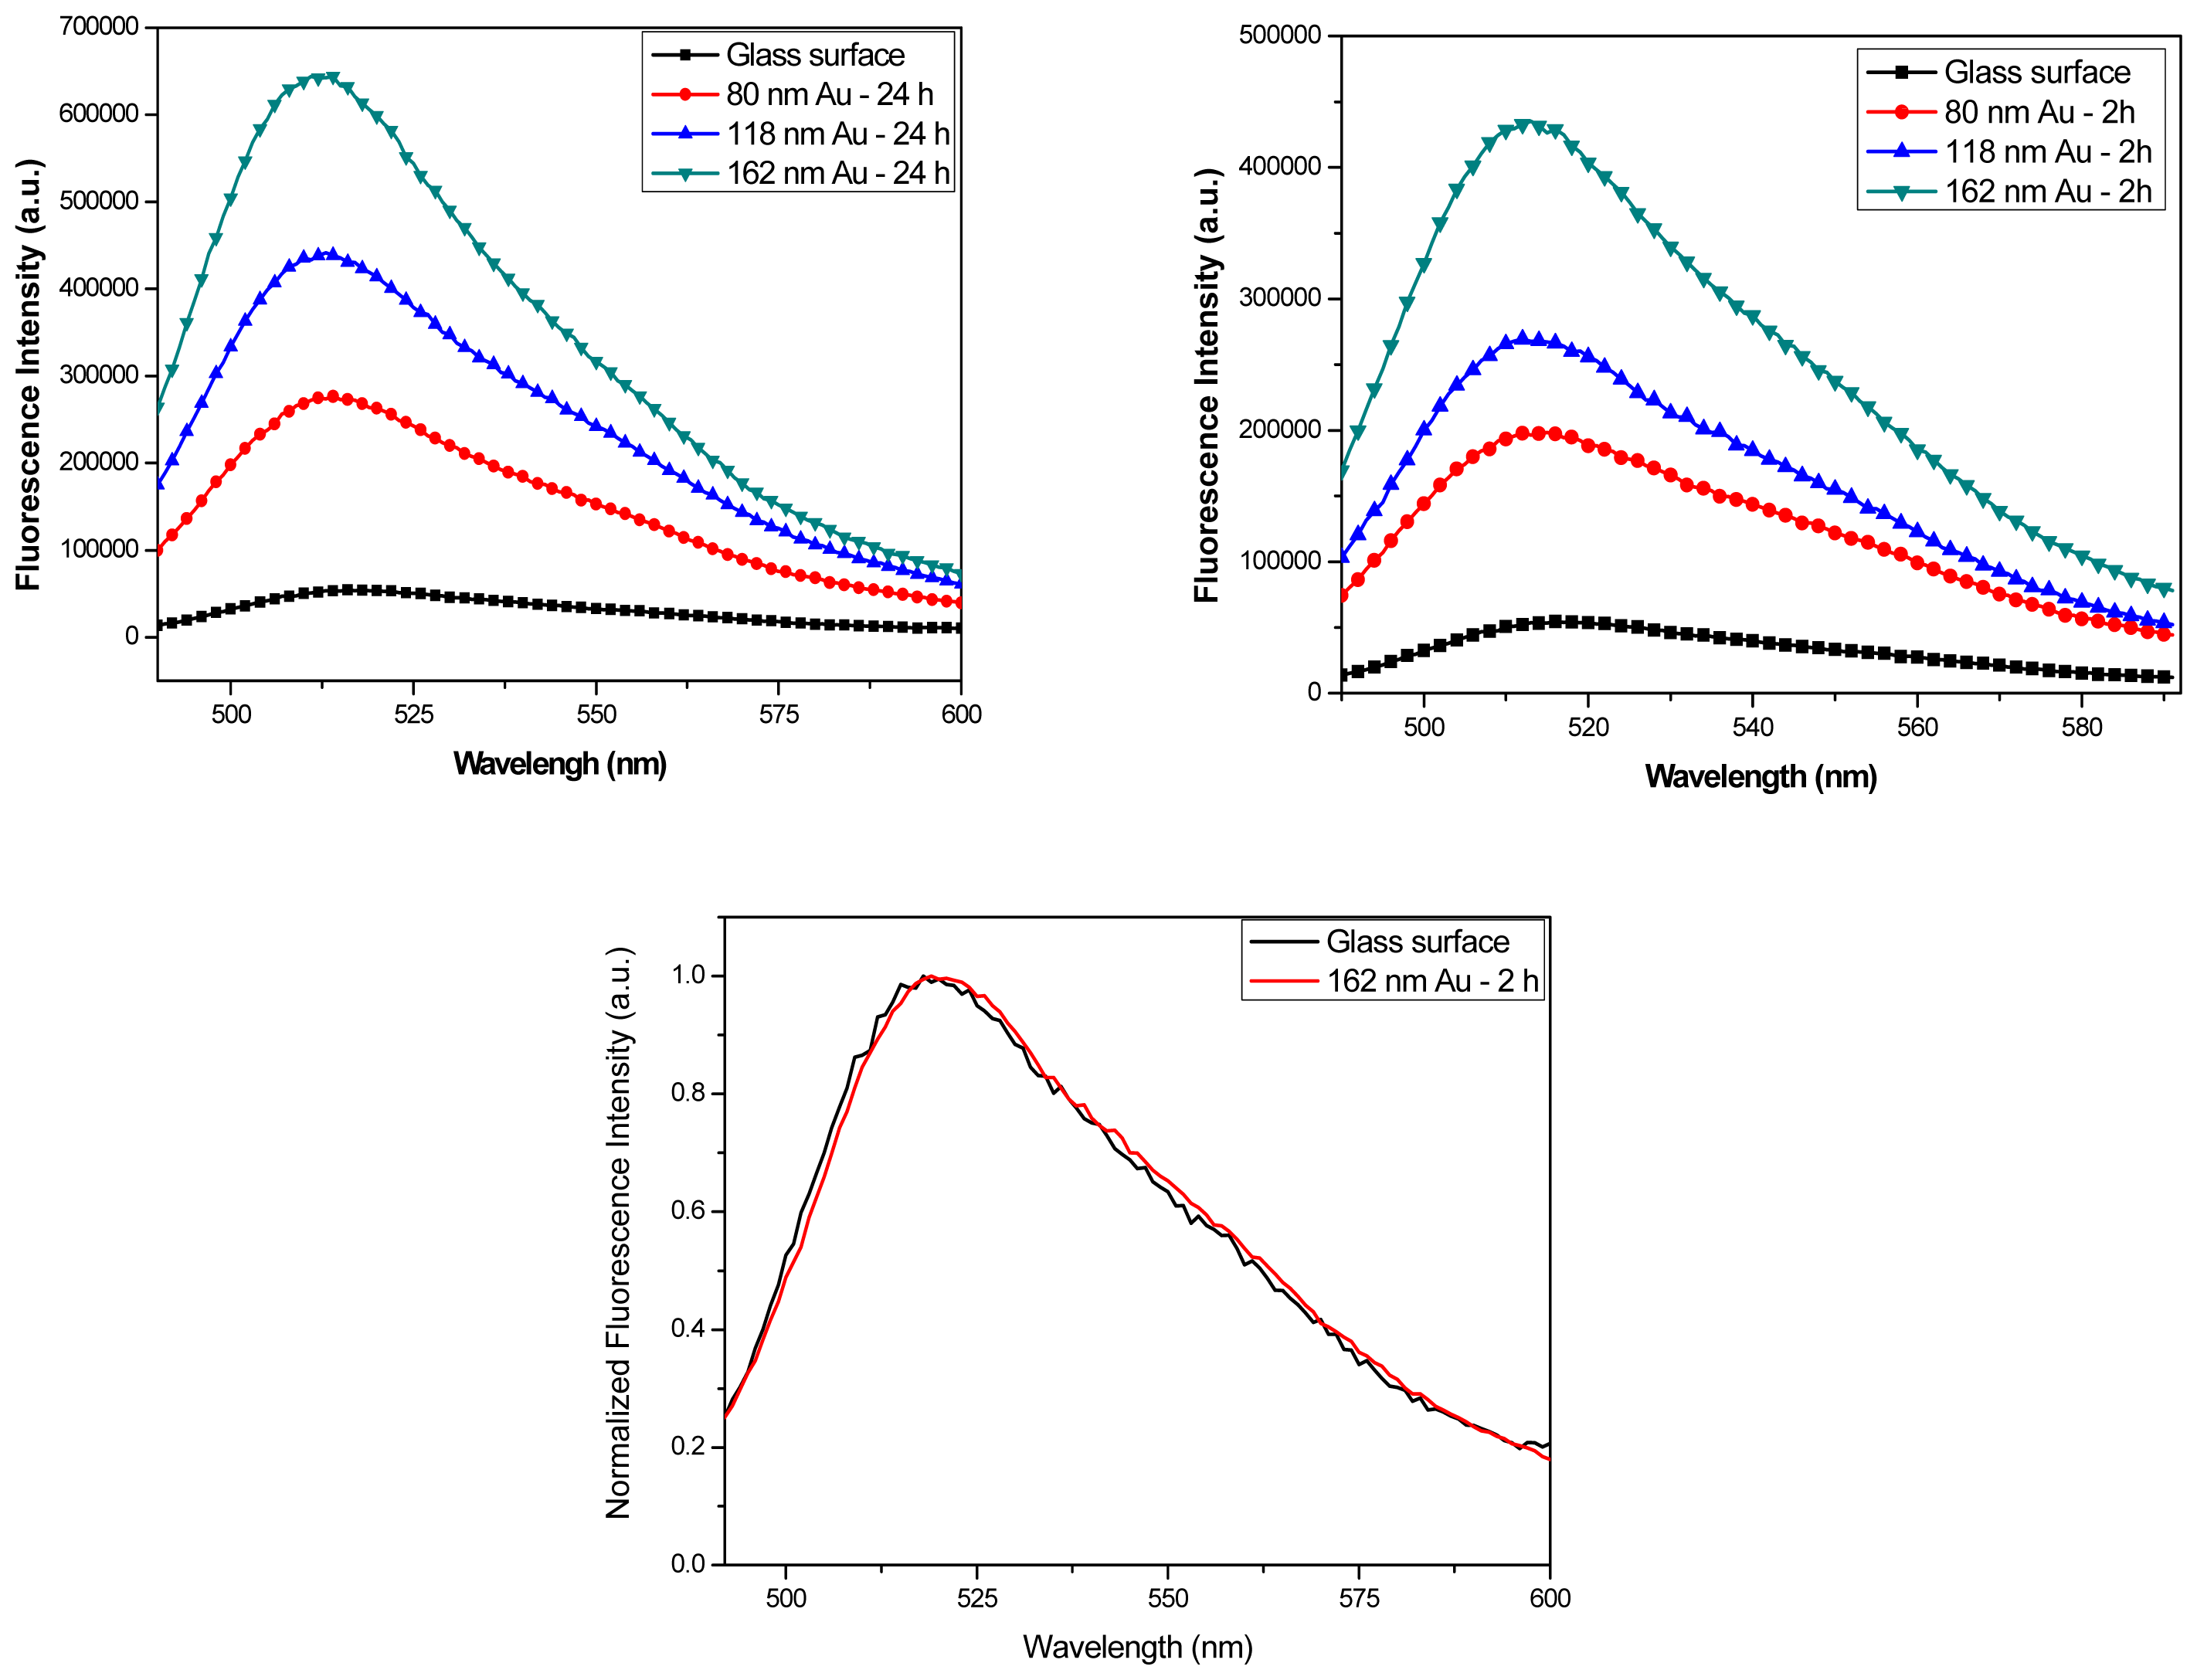
Figure 8a and 8b show the fluorescence spectra from FITC-HSA monolayers on samples with 2 hours and 24 hours incubation. The data were taken for each size Au colloids monolayers, as well as for a control sample with a clean glass surface. The enhancement factors as obtained from these spectra for the samples with 2 hours incubation time are 3.8, 5.0, and 5.9 for 80 nm, 118 nm, and 162 nm Au colloid respectively and there was little variation between different spots on the surface. After 24 hours incubation where inter-particle distances are much lower, the fluorescence enhancement factors significantly increase to 5.3, 8.1, and 11.8 for 80 nm, 118 nm, and 162 nm Au colloids, respectively.
Figure 8c shows the normalized emission intensities of FITC-HSA on glass and on gold colloid-coated surface, indicating that the spectral characteristics of FITC are unchanged. These results demonstrate that the fluorescence intensities were increased on the colloid-coated surface and the enhancement values decreased in samples with low density of Au colloids, both of which are in good agreement with earlier reference [
1,
19,
20].
The fluorescence lifetime measurements were also carried out on the self-assembled monolayer of DP-BSA both on a metallic surface and a glass surface as a control. These data reveal high and varying values of fluorescence enhancement factor and strong variations of fluorophore lifetime which depend on inter-particle distance and particle size, discussed in detail in [
15]. The origin of large enhancement observed for appropriate size nanoparticles with optimized inter-particle distance is attributed to the effect of an increased excitation rate from the local field enhanced by the interaction of incident light with the nanoparticles and higher quantum yield from an increase of the intrinsic decay rate of the fluorophore [
1].
In summary we presented here the developments of practical fluorescence amplifying substrates which show homogeneous and strongly enhanced fluorescence. The development was informed by the understanding of complicated and multiple reasons for fluorescence enhancement. In the case of silver nanowires they had a highly extended surface area available for the deposition of the fluorescent monolayer. The nanowires have sharp tips acting as antennas which also improves the ability of metal structures to interact with electromagnetic radiation [
21]. However one of the important mechanisms for fluorescence enhancement in such structures was wire-to wire plasmon coupling extending over large, micrometre scale regions. Similar effects were observed in large size gold colloids where the dense coverage the closeness of nanoparticles produced locally enhanced electric field and facilitated the radiating out of fluorescence. Such structures are capable of the fluorescence enhancement factor of over 15. The obtained results indicate that and the awareness of factors which influence dipole-dipole coupling radiative scattering provide an effective way to engineer fluorescence amplification.
