Article

Development and Electrochemical Investigations of an EIS- (Electrolyte-Insulator-Semiconductor) based Biosensor for Cyanide Detection

1
Aachen University of Applied Sciences, Jülich Campus, Institute of Nano- and Biotechnologies, Ginsterweg 1, 52428 Jülich, Germany
2
Research Centre Jülich, Institute of Bio- and Nanosystems (IBN-2), 52428 Jülich, Germany
3
Philipps-University Marburg, Institute of Pharmaceutical Chemistry, Marbacher Weg 6, 35037 Marburg, Germany
4
Aachen University of Applied Sciences, Jülich Campus, Ginsterweg 1, 52428 Jülich,Germany
5
ALA Analytical Laboratory GmbH, Charlottenstraße 14, 52070 Aachen, Germany
*
Author to whom correspondence should be addressed.
Sensors 2007, 7(8), 1415-1426; https://doi.org/10.3390/s7081415
Submission received: 16 July 2007 / Accepted: 3 August 2007 / Published: 3 August 2007

Abstract

:
A cyanide biosensor based on a pH-sensitive p-doped electrolyte-insulator-semiconductor (EIS) structure with an immobilised enzyme (cyanidase) is realised at the laboratory scale. The immobilisation of the cyanidase is performed in two distinct steps: first, the covalent coupling of cyanidase to an N-hydroxysuccinimide- (NHS) activated Sepharose™ gel and then, the physical entrapment of NHS-activated Sepharose™ with the immobilised cyanidase in a dialysis membrane onto the EIS structure. The immobilisation of the cyanidase to the NHS-activated Sepharose™ is studied by means of gel electrophoresis measurements and investigations using an ammonia- (NH3) selective electrode. For the electrochemical characterisation of the cyanide biosensor, capacitance/voltage and constant capacitance measurements, respectively, have been carried out. A differential measurement procedure is presented to evaluate the cyanide concentration-dependent biosensor signals.

1. Introduction

Cyanide and its derivates are widely used in industrial mining and metal plating industry. Besides, many medical and food plants are toxic for human beings because of their (high) content of cyanogenic glycosides. Already a few mg/kg human weight (average lethal dose: 1.5 mg/kg human weight) can lead to death. Hereby, the enzyme cytochrome C oxidase, which is responsible for the cell-respiration cycle, is reversibly inhibited by cyanide so that the aerobic respiration of cells shifts to anaerobic conditions resulting in their acidification. The decreased carbon dioxide generation and oxygen uptake potential lead to a reduced buffer potential of the blood. The pH value of the blood decreases resulting in a slowed down glycolysis by inhibition of phosphofructocinase ending in a metabolic disaster, e.g. the cardiac arrest and apnoea. Due to their high requirement of oxygen, the nervous system, heart and lung are most affected by cyanide [1-4].
In nature, cyanogenic glycosides, from which cyanide can be liberated by enzymatic hydrolysis, can be found in more than 2500 plant species, e.g. bitter almonds, corn, wheat, rice, legumes, stone fruits and roots. On the one hand, cyanogenic glycosides act as natural protection mechanism of plants against insects, fungi, etc.. On the other hand, a wrong preparation or consumption of these plants can cause poisoning. Especially in developing countries, the root Cassava, containing a high amount of cyanogenic glycosides, often causes chronic poisoning [3,5-7]. Aside, cyanide is still (illegally) used for fishing in Asia, affecting the underwater environment as well as persons [8]. Due to its high affinity to metal components, cyanide is also often applied for the extraction of gold and/or silver in metal-, electroplating-, agricultural- and pharmaceutical industries. Since cyanide attains as industrial waste or by-product, ecological damage and accidents [9,10] must be minimised and thus, the direct and fast determination of cyanide in small amounts is of increasing interest.
For the detection of cyanide, different methods have been reported in literature: colorimetric methods such as the so-called König reaction or by means of methyl violet [11-14], amperometric detection of cyanide utilising an enzyme-based biosensor or by means of a flow-injection system together with an ammonium-selective electrode [3,15-17], sensing gaseous hydrogen cyanide employing an embedded piezoresistive microcantilever or a purge system [18,19], and the potentiometric determination of cyanide by means of a cyanide-ion selective electrode (ISE) [20-23]. The major drawbacks of all these analytical methods are, however, their insufficient possibility of miniaturisation and/or their difficult handling. Consequently, there is still a lack in miniaturisied analytical (bio-)sensor systems for independent “in field” measurements of cyanide.
Therefore, in this work, the development and electrochemical characterisation of a miniaturisable silicon-based cyanide biosensor is presented. Both the immobilisation of the enzyme cyanidase on top of a capacitive EIS field-effect structure and the biosensor performance will be discussed. In order to improve the reliability and accuracy of the cyanide biosensor, a differential measurement procedure/set-up is suggested.

2. Experimental Section

The cyanide biosensor consists of a pH-sensitive EIS structure with immobilised enzyme cyanidase [EC 3.5.5.1]:
Cyanidase has been obtained by including the gene sequence of cyanidase from Pseudomonas stutzeri [9,24] in a plasmide along with a six-fold histidine tag at the N-terminus of the protein. The plasmide has been transformed into Escherichia coli BL21. This strain has been used for expression of cyanidase. After growing the bacteria in lysogeny broth medium, they have been disrupted using lysozyme and sonification. Cyanidase has then been purified via the histidine-tag on a nickel ion-loaded HiTrap Chelating HP column (Amersham Biosciences) and stripped off the column with 60 mM sodium phosphate buffer (pH 7.5, 150 mM NaCl + 200 mM imidazole).
For the EIS structure, a p-doped (boron) 3” single-crystal silicon wafer (Wacker-Chemitronic) with <100>-orientation, specific resistance 1-10 Ωcm and thickness of 356-406 μm has been used. By means of thermal dry oxidation, a 30 nm thick SiO2 layer has been grown on the silicon substrate as insulating layer. To realise the pH-sensitive Ta2O5 layer onto the SiO2 layer, a 25 nm thick Ta layer has been evaporated by means of a physical vapour deposition process that is subsequently oxidised to a 50 nm thick Ta2O5 layer. As rear-side contact, 300 nm Al has been evaporated and treated by a rapid thermal annealing process. Finally, the wafer has been cut into single 10 mm*10 mm chips. For more process details, see elsewhere [25].
Onto the Ta2O5 layer of the EIS chip, ∼24 mg of covalently coupled cyanidase to NHS-activated Sepharose™ (4 Fast Flow, Amersham Biosciences) has been physically immobilised under a dialysis membrane (moleculare weight cut off 1200-1400, pore diameter 25 Å, Servapor™ 44144, Serva Electrophoresis). This entrapment method has been chosen in order to increase the enzyme activity on the EIS sensor chip. The covalent immobilisation of the cyanidase to NHS-activated Sepharose™ has been performed at 4 °C for 20-25 hours: NHS-activated Sepharose™ has been filled into a column with 35 μm filter pore size (MoBiTec GmbH) for the immobilisation and activated by 1 mM HCl for 5 min. After equilibration with 60 mM sodium phosphate buffer (pH 8.0, 200 mM NaCl) for 1 min, cyanidase has been coupled to the NHS-activated Sepharose™ in a closed circuit system from the cyanidase solution. The “cyanidase gel” has been stored in 150 mM sodium phosphate buffer (pH 7.0, 200 mM NaCl + 0.2% NaN3) at 4 °C.
The amount of the covalently immobilised cyanidase has been determined by means of the sodium dodecylsulfate polyacrylamide gel electrophoresis (SDS-PAGE) and a gel scanner (CS-9001 PC, SHIMADZU). To denaturise first the enzyme, each sample that has been taken regularly during the immobilisation process from the immobilisation solution, has been diluted with 247 μl SDS-buffer (0.01 M trishydroxymethylaminomethane (TRIS)/HCl, pH 8.0, 0.001 M disodium-ethylene diamine tetraacetic acide (Na2-EDTA), 25 g/l SDS, 5 vol-% 2-mercaptoethanol) and heated in a water bath for 5 min. In order to mark the front, 10 μl of bromophenyl blue solution has been added to each sample. Then, the samples as well as the protein-molecular weight marker Roti-Mark standard (Carl Roth GmbH & Co. KG) have been applied to the gel (PhastGel Homogeneus 12.5, Amersham Biosiences) and the proteins have been separated by gel electrophoresis at 6 mA and 15 °C from 0 V up to 200 V (PhastSystem, Pharmacia LKB Biotechnology). The gel has been developed by means of silver stain and evaluated quantitatively by means of a gel scanner determining the absorption at λ= 550 nm.
The measurements of the enzyme activity of the “cyanidase gel” have been performed by means of a NH3-sensitive ISE (PY-102, Sartorius AG) in 60 mM sodium phosphate buffer (pH 8.0, 150 mM NaCl) at 30 °C in order to keep the conditions for the optimal activity of cyanidase. The calibration of the electrode has been done in standard ammonia solutions (60 mM sodium phosphate buffer (pH 8.0, 150 mM NaCl)) at 30 °C from 10−5 M to 10−2 M.
For the electrochemical sensor characterisation, the cyanide biosensor has been mounted into a Plexiglas measuring cell in contact with the analyte solution together with a silver/silver chloride (Ag/AgCl) double-junction reference electrode (Metrohm AG). The biosensor measurements have been performed with an impedance analyzer Im5d (Zahner Elektronik) in the capacitance/voltage (C/V) and constant capacitance (ConCap) mode, respectively. For all measurements, an a.c. voltage with an amplitude of 20 mV and a frequency of 120 Hz has been chosen. A detailed description of the C/V and ConCap mode is given, e.g. in [26,27]. Freshly prepared cyanide standards (5 mM sodium phosphate buffer (pH 8.0, 150 mM NaCl)) from 10−6 M to 10−2 M as well as pH buffer solutions (pH 3 to pH 11, Titrifix, Merck KGaA) were used in order to determine the substrate specifications of the biosensor and the pH behaviour of the transducer structure, respectively.

3. Results and Discussion

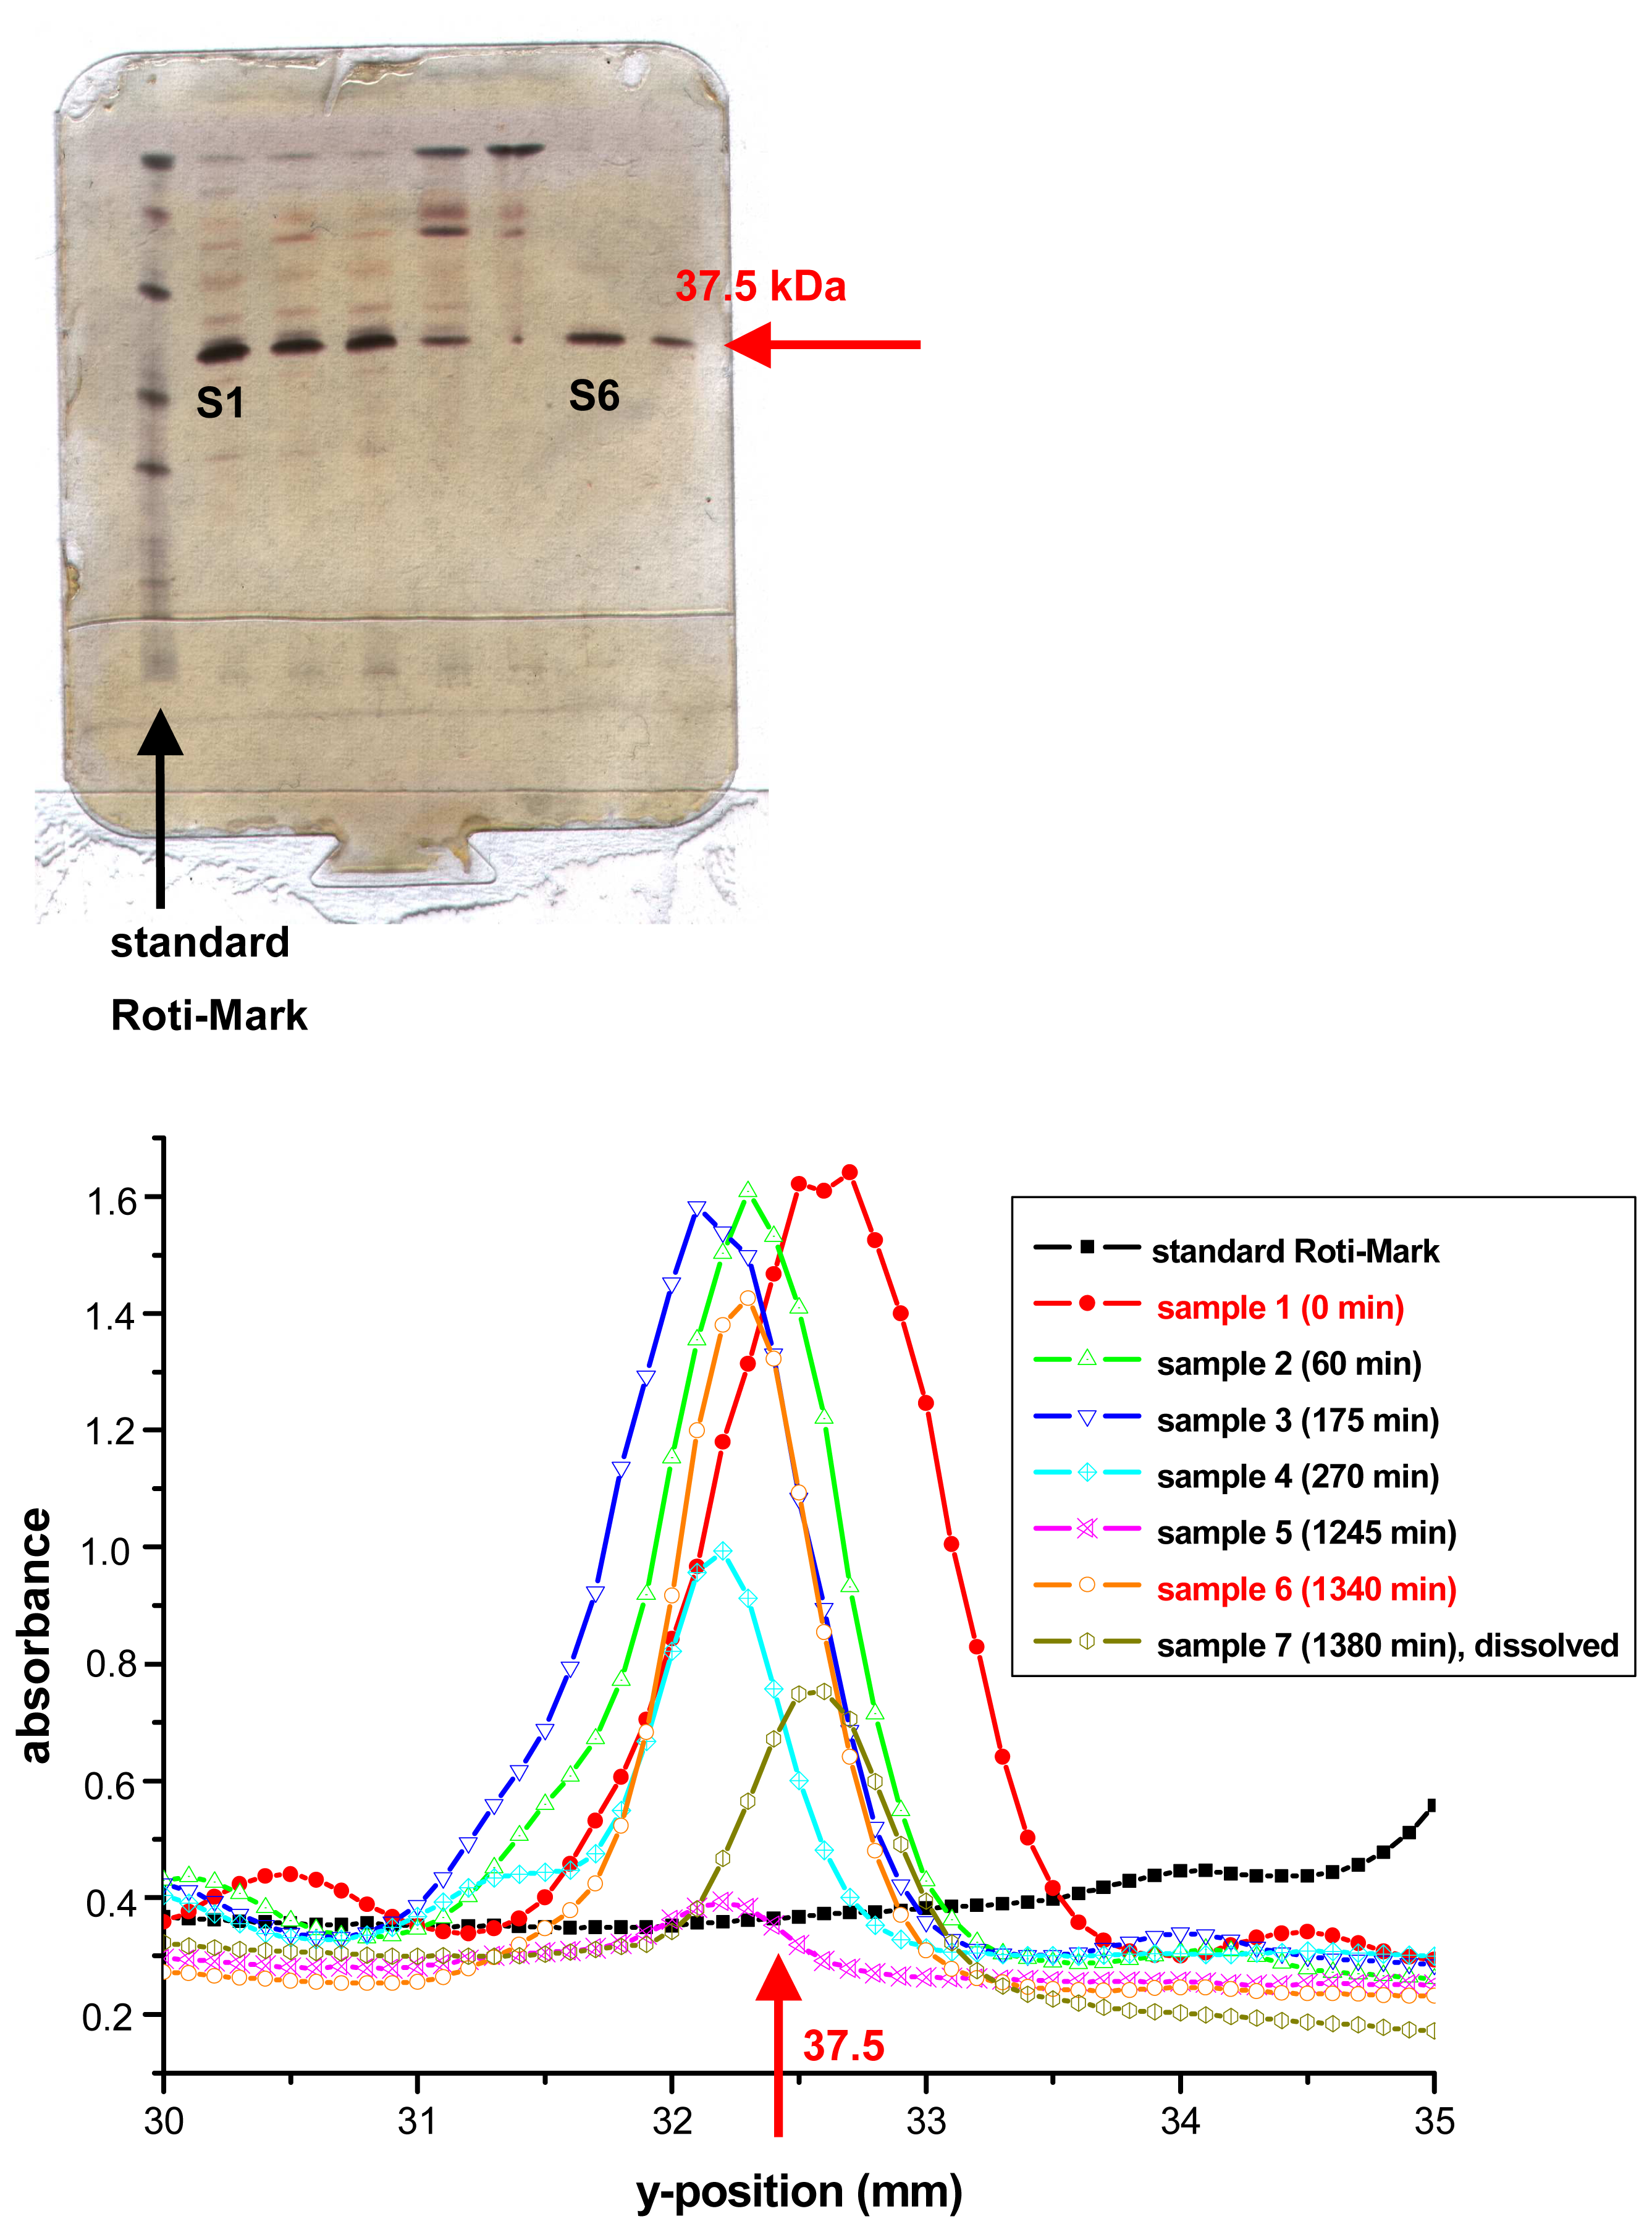
3.1. Immobilisation of cyanidase to NHS-activated Sepharose™

In order to evaluate the covalent immobilisation procedure of the cyanidase on the NHS-activated Sepharose™, samples of the circulating cyanidase solution during the immobilisation have been investigated by means of the SDS-PAGE with silver stain afterwards. The quantitative determination of the immobilised cyanidase has been calculated from the decreasing peak area at 37.5 kDa that corresponds to the molecular mass of cyanidase [24].
Figure 1 (top) shows a photograph of the gel including standard proteins and the quantitative evaluation by means of a gel scan (bottom). As can be seen from the figure, the width of the band at 37.5 kDa has been reduced from sample S1 at the beginning of the immobilisation procedure to sample S7 at the end of the immobilisation process. Calculations of the peak area at 37.5 kDa have resulted in an amount of 11 mg (originally 27 mg) of cyanidase that has been covalently coupled to 2 ml of NHS-activated Sepharose™ (“cyanidase gel”) (comparison between sample S1 and sample S6) after an immobilisation time of 22 h and 20 min. The investigations also exhibit that the enzyme is not completely homogenously distributed in buffer solution (see e.g., sample S4 and sample S5). Nonetheless, a decreasing band width with increasing immobilisation time has been found that underlines the bonding of the cyanidase to the NHS-activated Sepharose™.
The activity of the immobilised cyanidase to NHS-activated Sepharose™ has been qualitatively tested by means of NH3 determination with an ammonia-sensitive ISE. In general, calibration measurements with an NH3-sensitive ISE result in a decreased output signal (voltage) with increasing ammonia concentration. In the presented experiment, the NH3-sensitve ISE was placed together with 100 μl “cyanidase gel” in a baker glass with 10 ml buffer solution. By successively adding a certain amount of potassium cyanide salt to the test sample, the ISE signal has been shifted towards smaller output signals, which corresponds to an active behaviour of the immobilised enzyme.

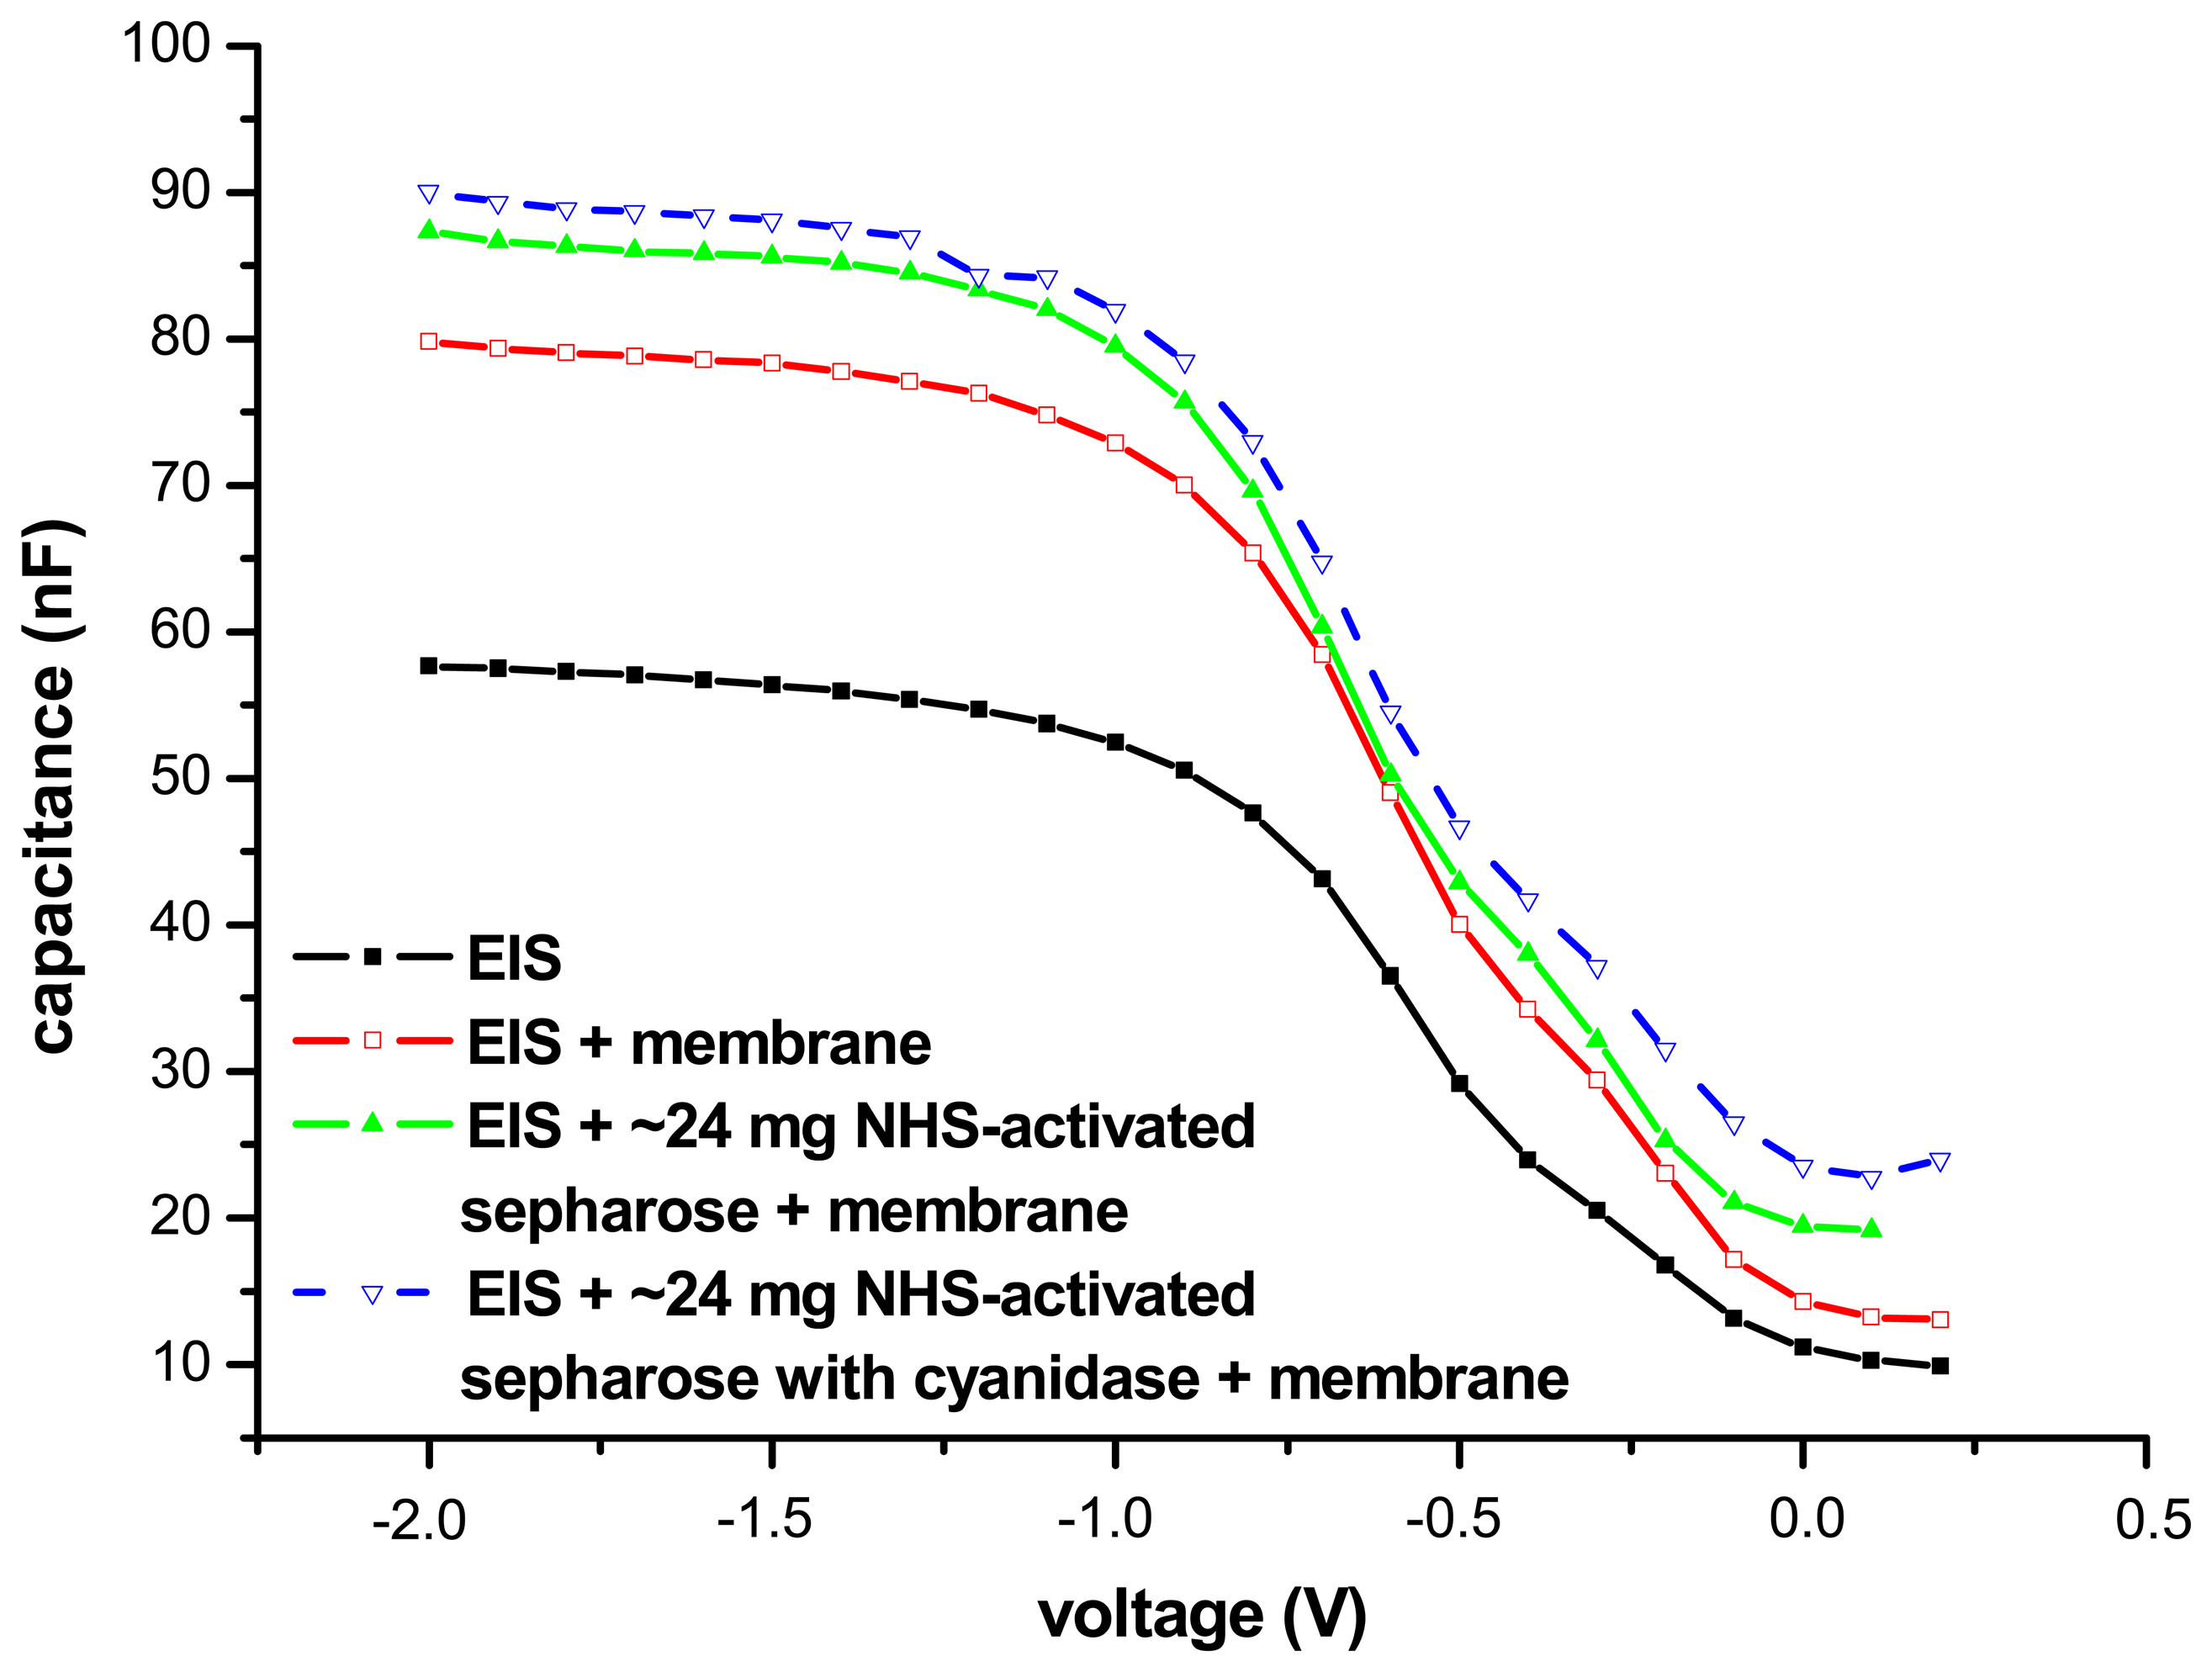
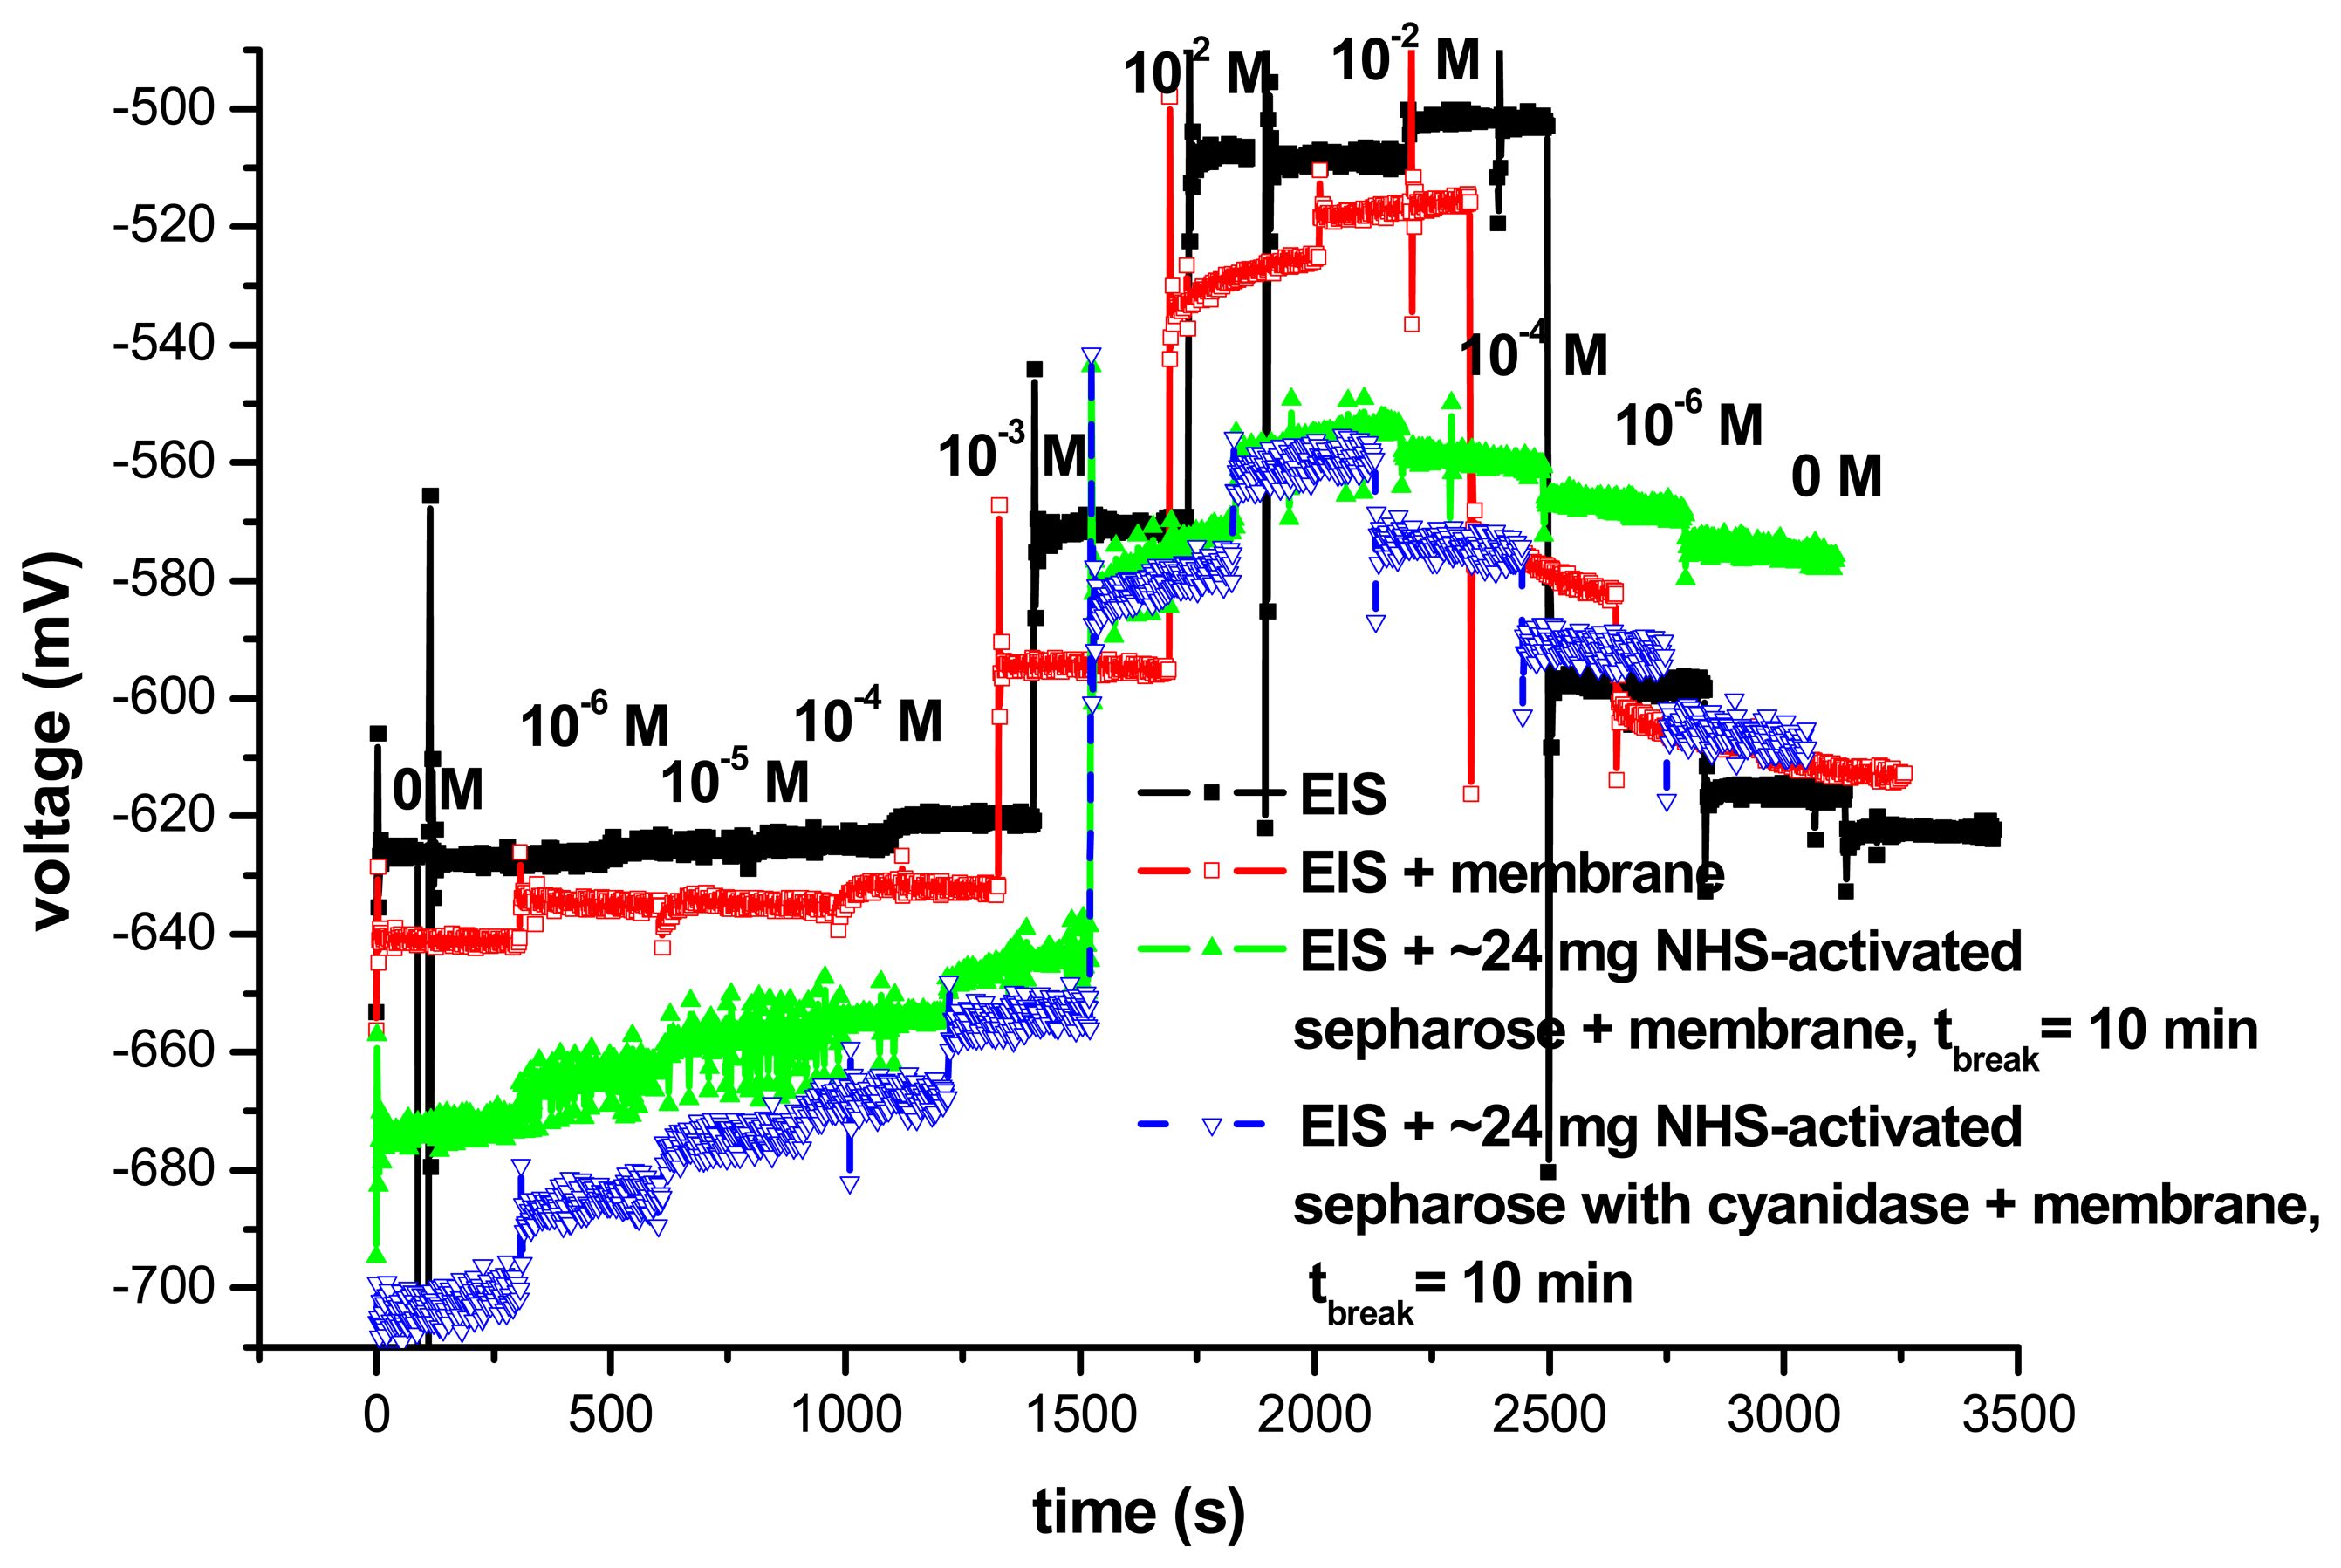
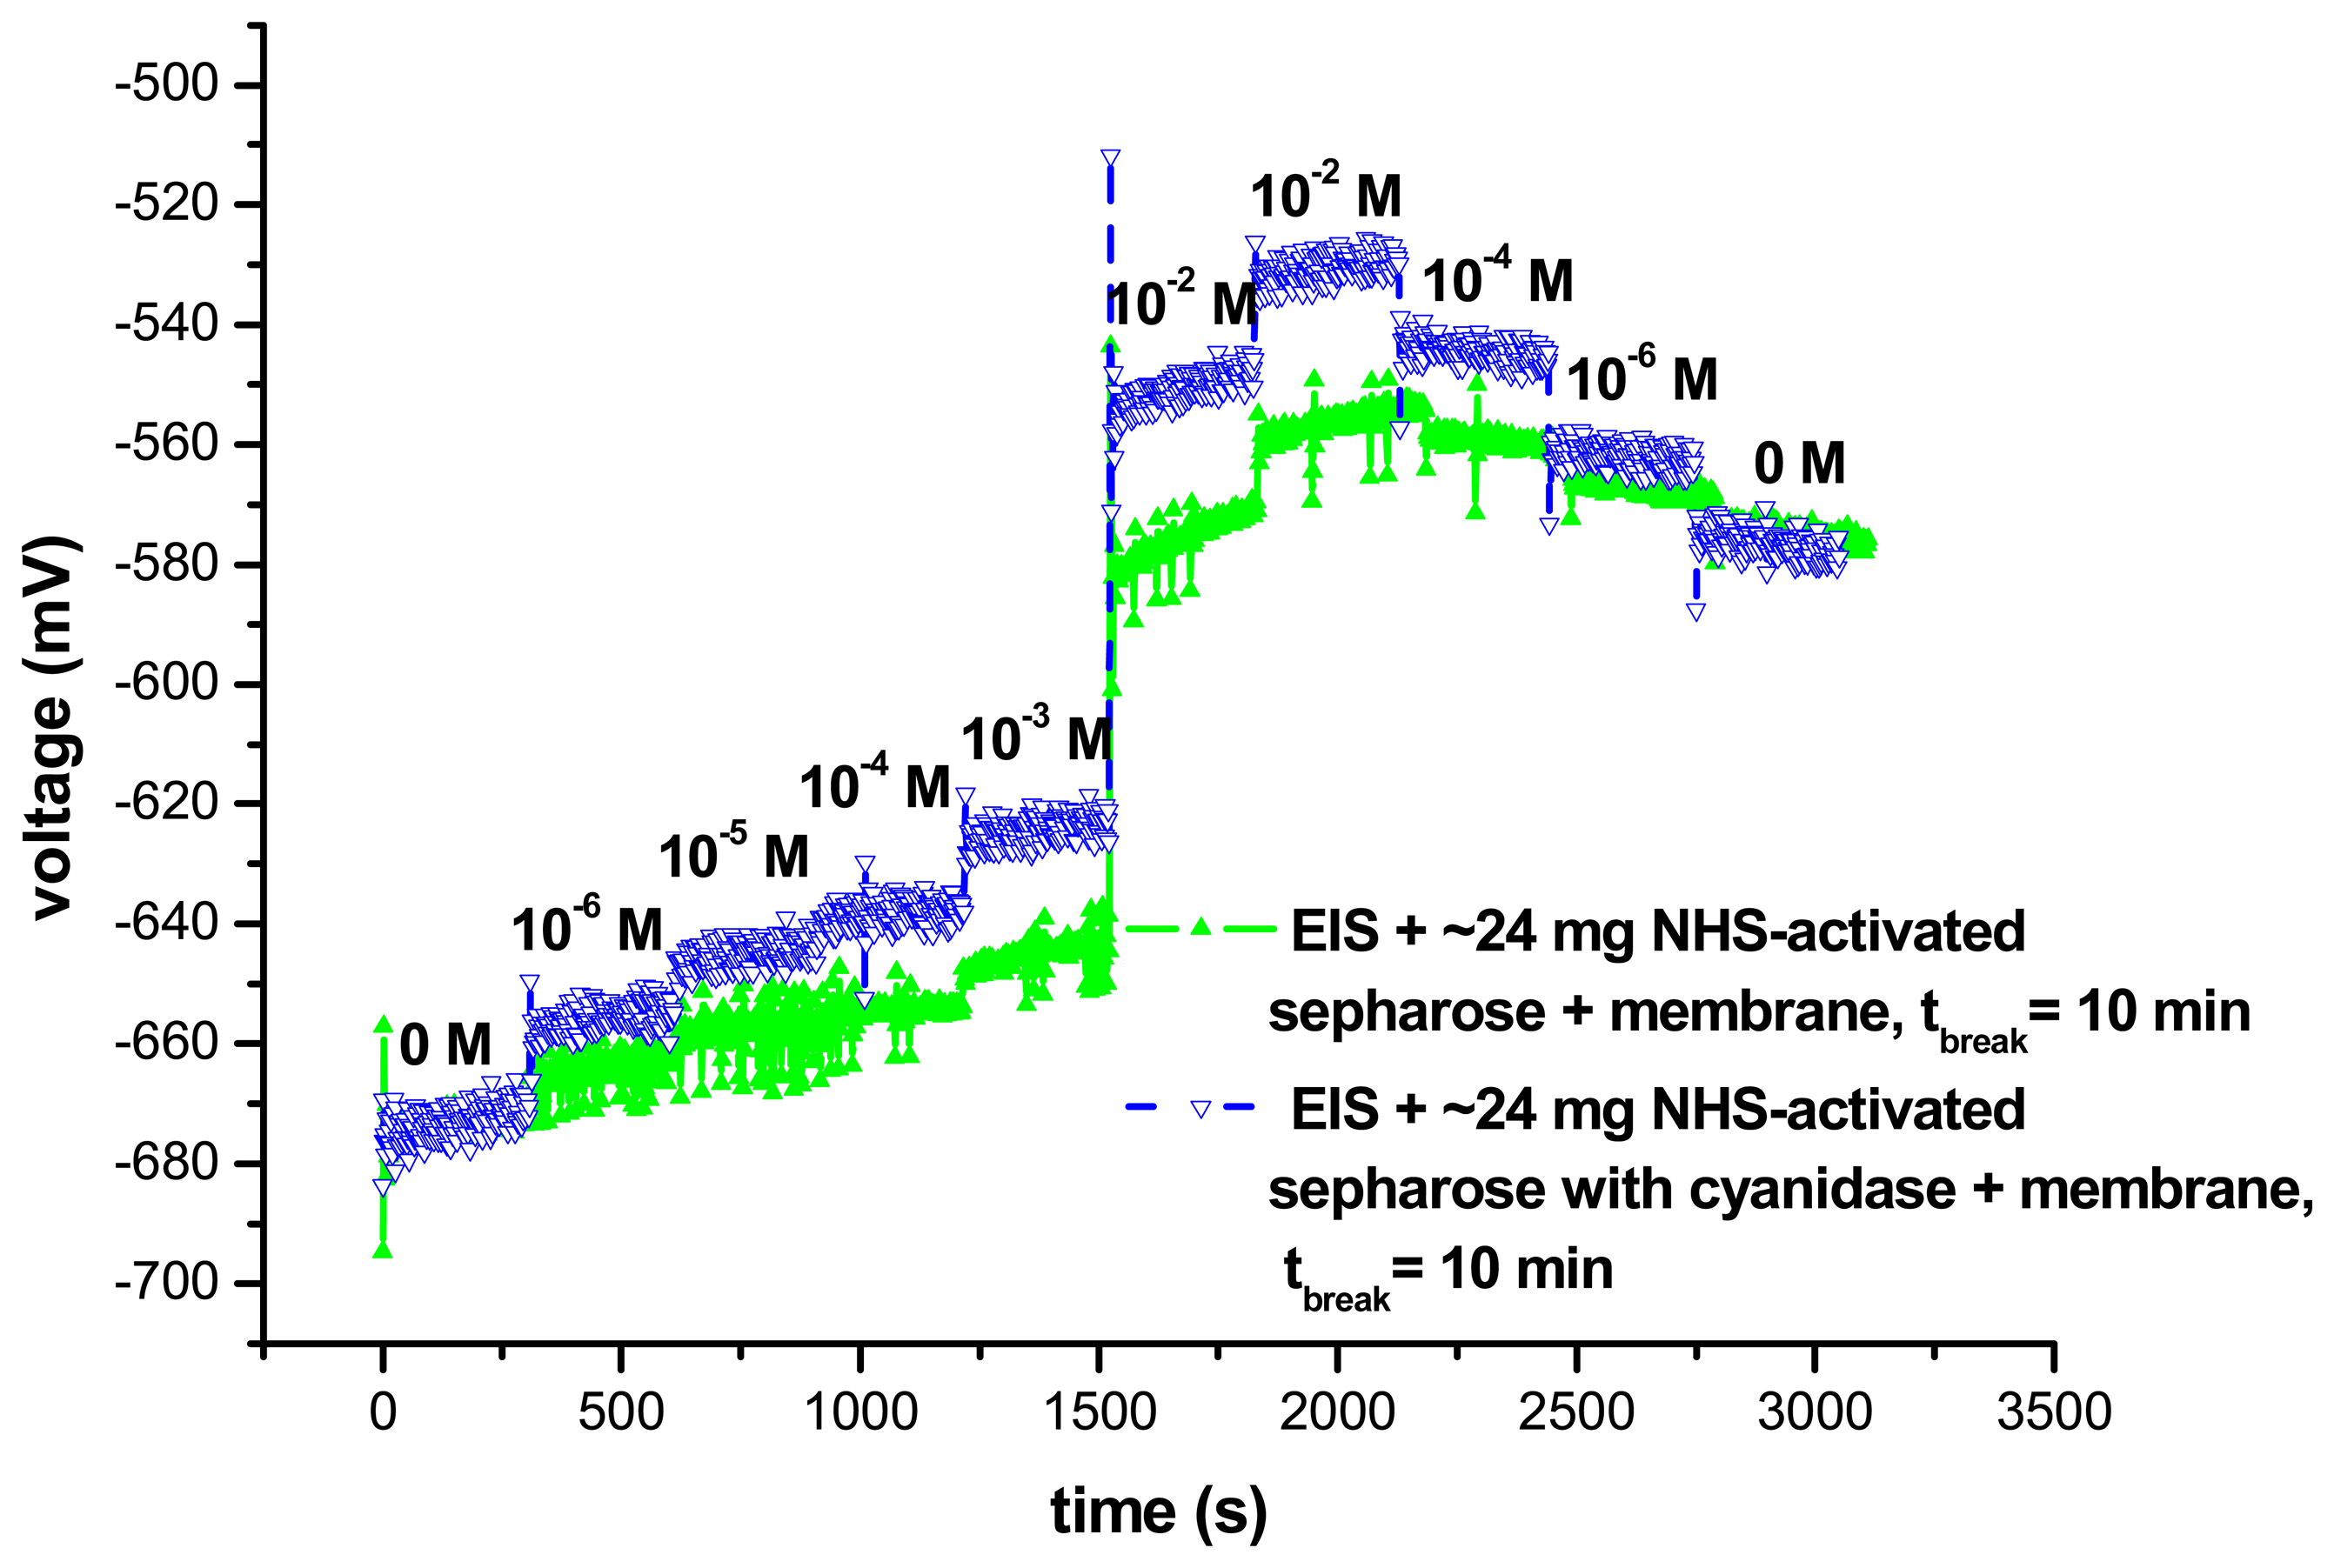
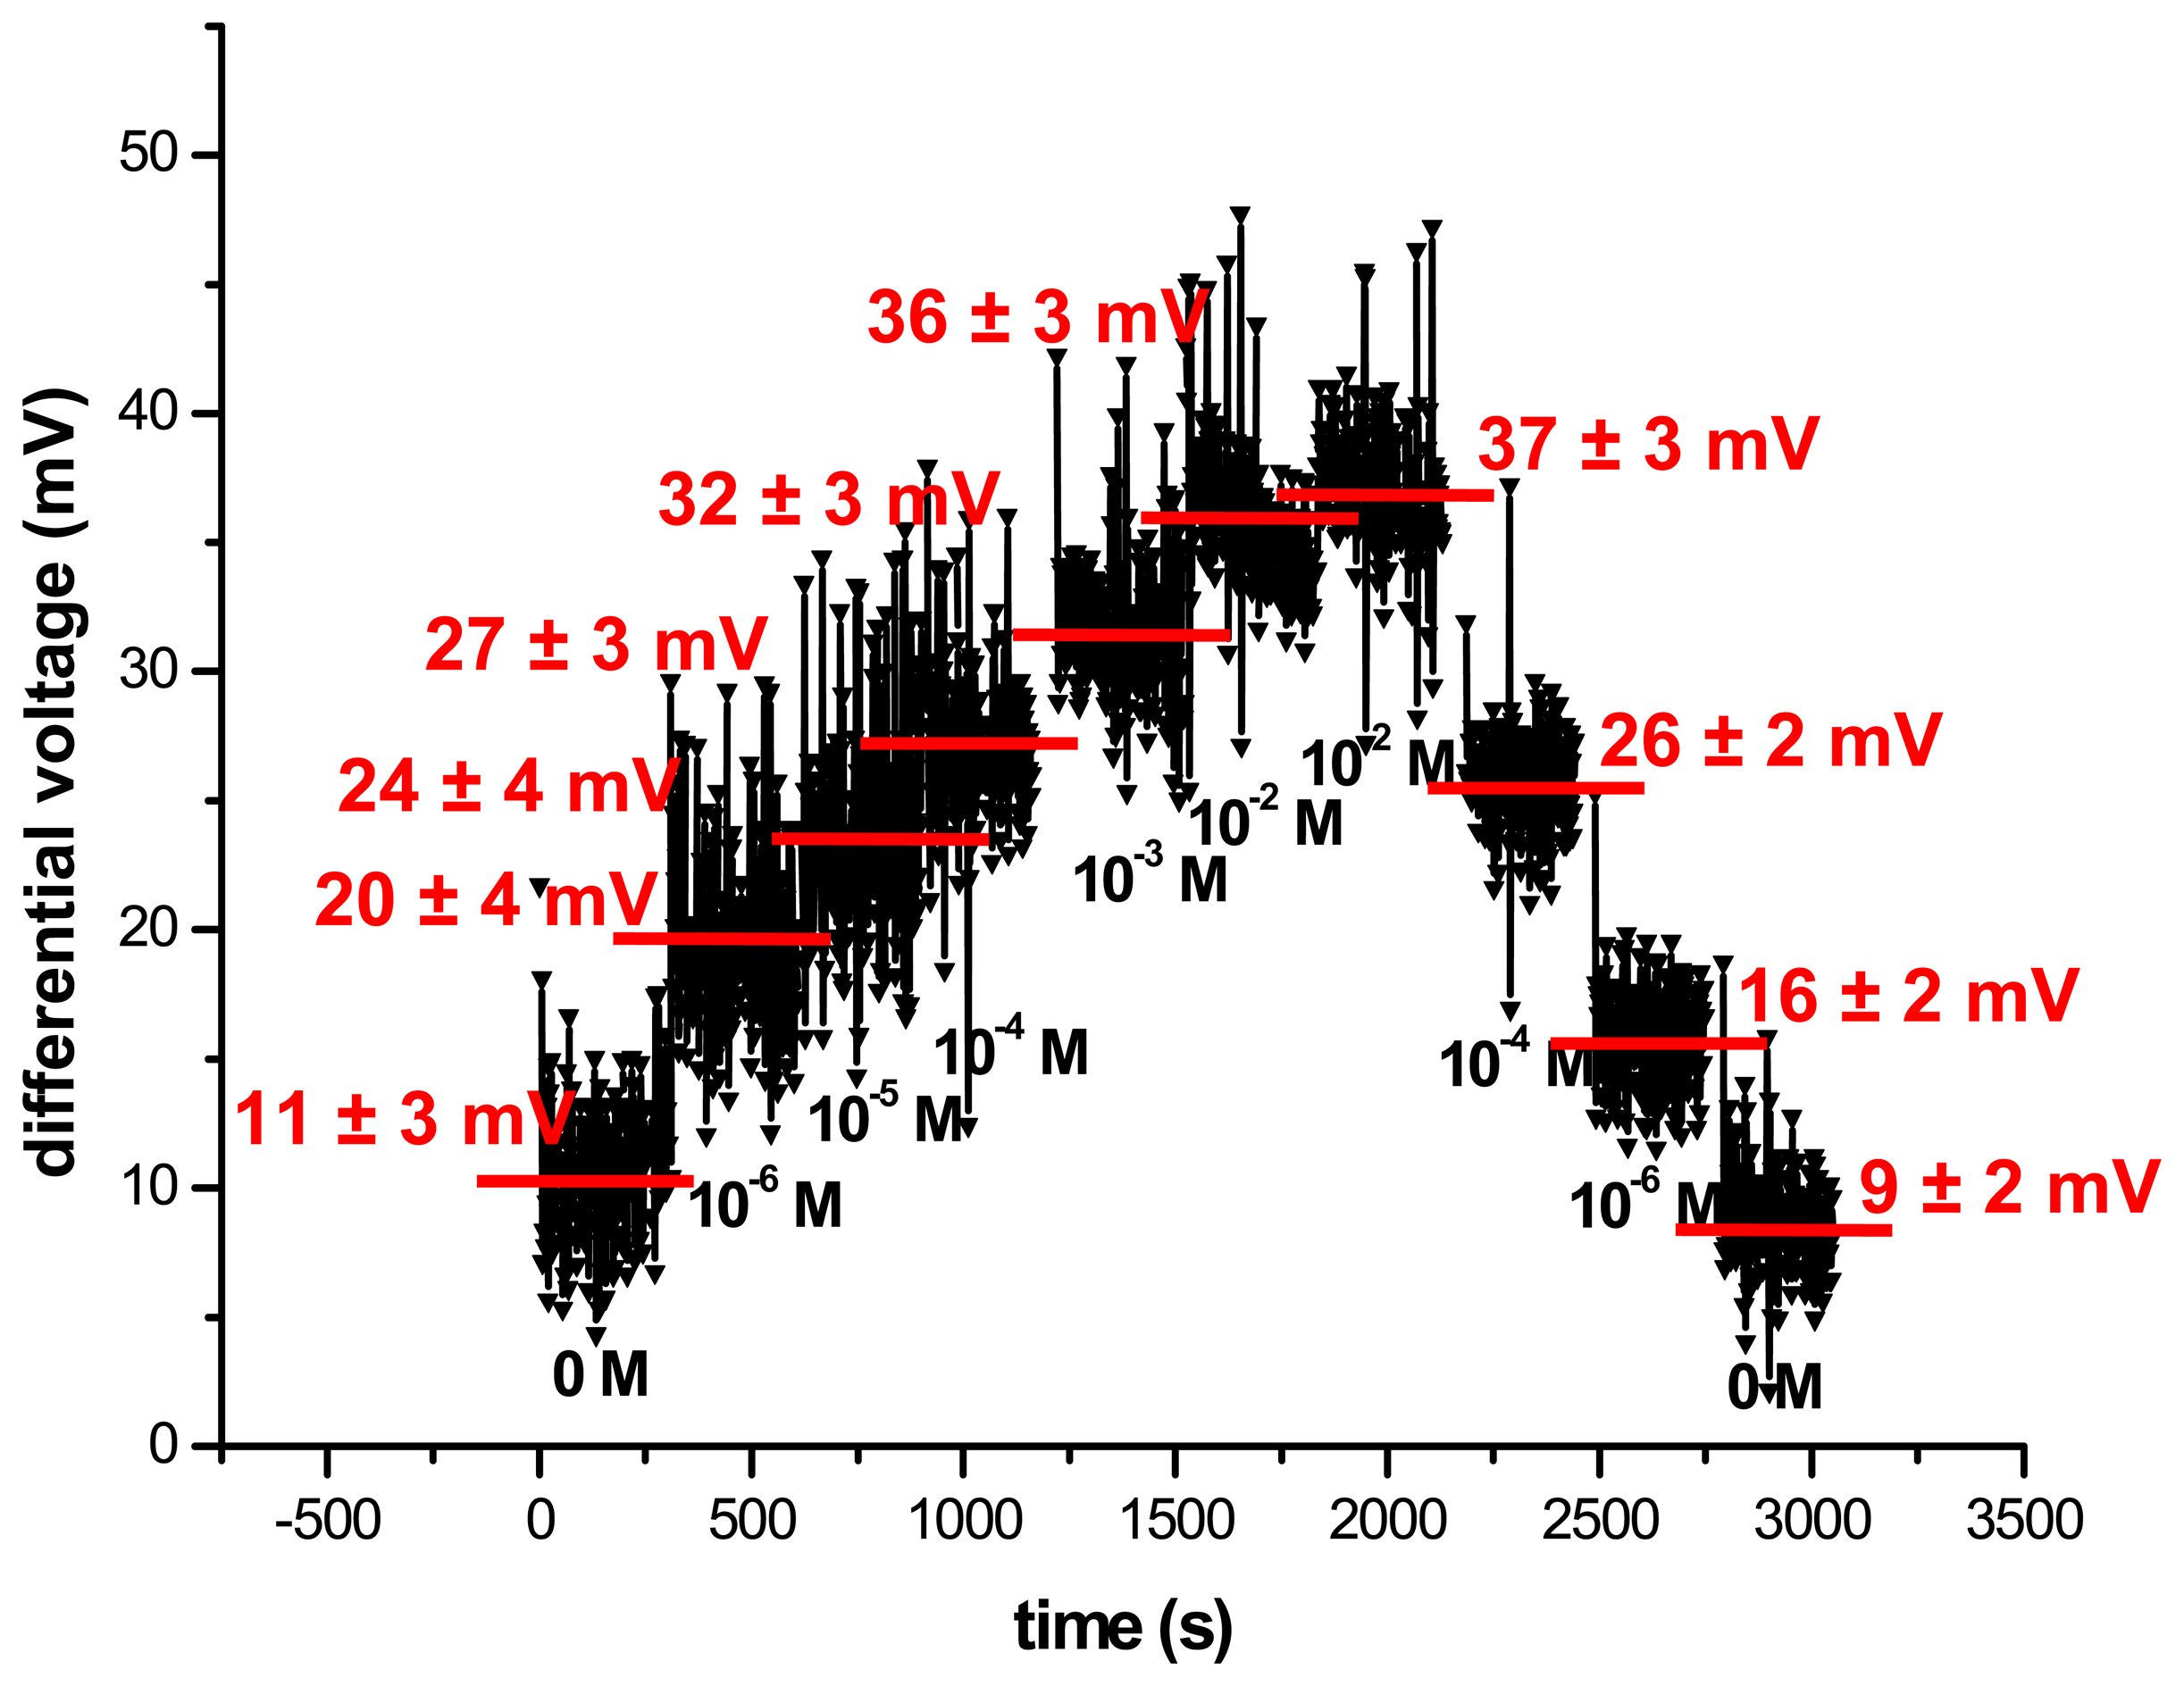
3.2. Electrochemical characterisation of the cyanide biosensor

To systematically investigate the influence of the “cyanidase gel” and dialysis membrane onto the curve behaviour of the EIS structure and to determine the working point for the subsequent ConCap measurements, the different EIS sensor set-ups (EIS sensor bare; EIS sensor with dialysis membrane; EIS sensor with dialysis membrane and NHS-activated Sepharose™ without immobilised cyanidase; EIS sensor with dialysis membrane and NHS-activated Sepharose™ with immobilised cyanidase) have been operated in the C/V mode. The total capacitance of a bare EIS structure can be simplified by a series connection of the two insulator capacitances (here, SiO2 and Ta2O5 layer) and the space-charge capacitance. In figure 2, all C/V curves show a typical behaviour of a p-type EIS structure that can be distinguished into three regions: accumulation, depletion and inversion [27]. The difference in the maximum capacitance values can be explained due to the varying active sensor area, depending on the respective sensor configuration.
For the ConCap measurements, working points at 60% of the maximum capacitance (flat-band condition) have been determined, which correspond to 38.4 nF, 53.0 nF, 59.1 nF and 62.7 nF, respectively, for the bare EIS sensor, the EIS sensor with dialysis membrane, the EIS sensor with NHS-activated Sepharose™ and dialysis membrane without immobilised cyanidase, and the EIS sensor with “cyanidase gel” and dialysis membrane.
In the ConCap mode, the surface-potential change due to a varying analyte concentration (e.g., pH value) can be directly recorded with the help of a feed-back control voltage, which serves as sensor output signal [26,27]. ConCap measurements of bare EIS structures have demonstrated a nearly Nernstian pH sensitivity [24].
Figure 3 shows a typical ConCap cycle of the bare EIS sensor in comparison to the EIS sensor with dialysis membrane, the EIS sensor with dialysis membrane and NHS-activated Sepharose™ without immobilised cyanidase and the EIS sensor with dialysis membrane and NHS-activated Sepharose™ with immobilised cyanidase EIS sensor in different KCN solutions (0 M to 10−2 M). For all sensor set-ups with increasing KCN concentration the voltage signal raises, too. For higher cyanide concentrations (> 10−4 M), the sensor signals shift noticeably to higher voltage values because the buffer's capacity gets exhausted due to its very small buffer molarity of 5 mM. The pH shift can be described by the chemical dynamic equilibrium of KCN in solution:
KCN + H 2 O K + + CN + H 2 O K + + HCN + OH
The higher the KCN concentration, the more hydroxide ions are released into the analyte solution and the higher is the pH value. For KCN concentrations < 10−4 M, only a slight increase of the voltage signal in the order of several millivolts has been observed.
For higher cyanide concentrations (10−3 M to 10−2 M), a potential shift of about 70 mV has been achieved that corresponds to a pH change from originally pH 8.5 to pH 9.5. At the same time, the “intrinsic” properties of the different sensor set-ups (average pH sensitivity) show a distinct variation. The pH sensitivity has decreased from about 56 mV/pH for the bare EIS sensor, to 52 mV/pH and approximately 43 mV/pH for the EIS sensor with dialysis membrane and the EIS sensor with dialysis membrane and NHS-acitvated Sepharose™ without and with immobilised cyanidase and dialysis membrane, respectively. Thus, the dialysis membrane has only a slight effect on the sensor's signal behaviour, whereas the additionally applied NHS-activated Sepharose™ without and with cyanidase has reduced the sensor signal about 23%. This might be due to a limited diffusion of the analyte through the NHS-activated Sepharose™ and paritially “blocked” pH-sensitive sites of the Ta2O5 layer. The response time has prolonged from originated 1-3 s for the bare EIS structure to about 10 min for the EIS sensor with dialysis membrane and cyanidase gel. The increased response time can be explained by a raising diffusion time of the analyte to reach the pH-sensitive transducer surface. The ConCap measurements with NHS-activated Sepharose™ have shown relatively high noise which might be probably explained due to dynamic interactions of the analyte with both the pH-sensitive transducer surface and the NHS-activated Sepharose™.
To determine the biosensor signal that is originally from the catalytic reaction of the enzyme cyanidase, the ConCap measurement of the cyanide biosensor has been compared to an identical EIS sensor chip but without immobilised enzyme (see fig. 4).
The pH shift that is derived from the enzymatic reaction is described in eq. 2 (conversion of hydrogen cyanide to ammonia and formic acid by cyanidase) [28]. In the diagram, both ConCap curves have been normalised to their starting voltage values at a cyanide-free test sample. As can be seen, the resulting output voltage signals of the EIS sensor set-up with immobilised cyanidase has been distinctly higher than the ConCap signal recorded with the same EIS sensor set-up but without enzyme. This is due to the additional catalytic conversion cyanide by cyanidase.
HCN + 2 H 2 O cyanidase HCOOH + HNH 3
The differential voltage from both EIS sensor set-ups has been calculated in figure 5. An average differential voltage shift of about 4 mV/pCN with increased KCN concentration has been found. Calculations of pH values for a homogeneous system with cyanidase in KCN solutions result in an only slight pH shift to higher pH values in comparison to an identical system but without enzyme. These calculations have been performed assuming equilibrium conditions in aqueous solutions at room temperature. In the performed experiment, sensor signals have been observed as expected from the calculations. The even somewhat higher pH shift can be explained by a time-dependent effect due to the catalytic reaction in immediate vicinity of the sensor surface and thus, by a generated concentration gradient of the reaction products. This interpretation has been supported by means of additional experiments using micro pH electrode in KCN buffer solutions containing cyanidase.
These results are in contrast to former findings using a similar experimental set-up [17]. In these investigations, a pH shift of the sensor towards lower pH was observed, which was explained by enzymatically formed formic acid. However, this reaction is only possible, if the by-product ammonia can either pass the dialysis membrane faster than formic acid or ammonia is chemically trapped. The second possibility is more likely because immobilisation of cyanidase to NHS-activated Sepharose™ was carried out over a shorter time in these experiments resulting in succinic acid functions after hydrolysis of free binding sides of the NHS-activated Sepharose™. This succinic acid functions might trap the enzymatically formed ammonia. The same effect can be gained if a second, ammonia consuming enzyme like an ammonia transferase is added to the system.

4. Conclusions

A biosensor set-up for the detection of cyanide that is based on a pH-sensitive EIS structure in combination with the enzyme cyanidase has been realised. The experiment showed that about 5.5 mg of cyanidase could be covalently coupled to 1 ml NHS-activated Sepharose™ yielding a still active enzyme. The electrochemical behaviour of the cyanide biosensor has been studied by means of C/V and ConCap measurements. Here, the influence of the immobilised “cyanidase gel” and dialysis membrane onto the intrinsic pH behaviour of the EIS transducer structure as well as the biosensor performance towards cyanide have been investigated. By applying a differential measurement procedure consisting of a sensor with and a sensor without enzyme, an average cyanide sensitivity of about 4 mV/pCN in the concentration range from 10−6 M to 10−2 M could be found. The resulting sensor signal can be explained by the catalytic conversion of cyanide to ammonia and formic acid by means of the enzyme cyanidase. Future work will deal with further optimisation of the biosensor set-up (sensitivity, stability, detection limit) and application of the developed biosensor set-up to real test samples.

Acknowledgments

The authors gratefully thank the Bundesministerium für Bildung und Forschung (supported BMBF-project: “SAFE”) for the financial support and M. L. Heng, A. R. Kunchamwar, K. Adels and A. Poghossian for technical support and valuable discussions.

References

  1. Marquardt, H.; Schäfer, S. G. Lehrbuch der Toxikologie; Spektrum Akademischer Verlag: Heidelberg Berlin, 1997; pp. 555–565. [Google Scholar]
  2. U.S. Department of health and human services, public health service, agency for toxic substances and disease registry. Toxicological profile for cyanide. 2006.
  3. Mak, K. K. W.; Law, A. W. C.; Tokuda, S.; Yanase, H.; Renneberg, R. Application of cyanide hydrolase from klebsiella sp. in a biosensor system for detection of low-lewel cyanide. Appl. Microbiol. Biotechnol. 2005, 67, 631–636. [Google Scholar]
  4. Badugu, R.; Lakowicz, J. R.; Geddes, C. D. Enhanced fluorescence cyanide detection at physiologically lethal levels: reduced ICT-based signal transduction. J. Am. Chem. Soc. 2005, 127, 3635–3641. [Google Scholar]
  5. Jones, D. A. Why are so many food plants cyanogenic? Phytochemistry 1997, 47(2), 155–162. [Google Scholar]
  6. Keusgen, M. Biosensors: new approaches in drug discovery. Naturwissenschaften 2002, 89, 433–444. [Google Scholar]
  7. Yeoh, H.-H.; Tatsuma, T.; Oyama, N. Monitoring the cyanogenic potential of cassava: the trend towards biosensor development. Trends Anal. Chem. 1998, 17(4), 234–240. [Google Scholar]
  8. Mak, K. K. W.; Yanase, H.; Renneberg, R. Cyanide fishing and cyanide detection in coral reef fish using chemical tests and biosensors. Biosens. Bioelectron. 2005, 20, 2581–2593. [Google Scholar]
  9. Watanabe, A.; Yano, K.; Ikebukuro, K.; Karube, I. Cyanide hydrolysis in a cyanide-degrading bacterium, pseudomonas stutzeri AK61, by cyanidase. Microbiology 1998, 144, 1677–1682. [Google Scholar]
  10. Von Tümpling, W. Schäden durch Cyanide im Flusswasser. Chemie 2006, 4, 67–67. [Google Scholar]
  11. Aldridge, W. N. A new method for the estimation of micro quantities of cyanide and thiocyanide. Analyst 1944, 69, 262–265. [Google Scholar]
  12. Epstein, J. Estimation of microquantities of cyanide. Anal. Chem. 1947, 19(4), 272–274. [Google Scholar]
  13. Lundquist, P.; Sörbo, B. Rapid determination of toxic cyanide concentration in blood. Clin. Chem. 1989, 35(4), 617–619. [Google Scholar]
  14. Afkhami, A.; Sarlak, N. A novel cyanide sensing phase based on immobilization of methyl violet on triacetylcellulose membrane. Sens. Actuators B 2007, 122, 437–441. [Google Scholar]
  15. Shan, D.; Mousty, C.; Cosnier, S. Subnanomolar cyanide detection at polyphenol oxidase/clay biosensors. Anal. Chem. 2004, 76, 178–183. [Google Scholar]
  16. Weinberg, H. S.; Cook, S. J. Segmented flow injection, UV digestion, and amperometric detection for the determination of total cyanide in wastewater treatment plant effluents. Anal. Chem. 2002, 74, 6055–6063. [Google Scholar]
  17. Keusgen, M.; Kloock, J. P.; Knobbe, D.-T.; Jünger, M.; Krest, I.; Goldbach, M.; Klein, W.; Schöning, M. J. Direct determination of cyanides by potentiometric biosensors. Sens. Actuators B 2004, 103, 380–385. [Google Scholar]
  18. Porter, T. L.; Vail, T. L.; Eastman, M. P.; Stewart, R.; Reed, J.; Venedam, R.; Delinger, W. A solid-state sensor platform for the detection of hydrogen cyanide gas. Sens. Actuators B 2007, 123, 313–317. [Google Scholar]
  19. Hachiya, H.; Ito, S.; Fushinuki, Y.; Masadome, T.; Asano, Y.; Imato, T. Continuous monitoring for cyanide in waste water with a galvanic hydrogen cyanide sensor using a purge system. Talanta 1999, 48, 997–1004. [Google Scholar]
  20. Hofton, M. Continuous determination of free cyanide in effluents using Ag2S-ISE. Environ. Sci. Technol. 1976, 10(3), 277–280. [Google Scholar]
  21. Ipatov, A.; Ivanov, M.; Makarychev-Mikhailov, S.; Kolodnikov, V.; Legin, A.; Vlasov, Y. Determination of cyanide using flow-injection multisensor system. Talanta 2002, 58, 1071–1076. [Google Scholar]
  22. Neshkova, M. T.; Pancheva, E. M.; Pashova, V. A new generation of CN sensing silver chalcogenide-selective membranes for FIA application I. Flow-injection detector for CN based on thin Ag2+dSe1-xTex electropolated membrane. Sens. Actuators B 2006, 119, 625–631. [Google Scholar]
  23. Volotovsky, V.; Kim, N. Cyanide determination by an ISFET-based peroxidase biosensor. Biosens. Bioelectron. 1998, 13, 1029–1033. [Google Scholar]
  24. Watanabe, A.; Yano, K.; Ikebukuro, K.; Karube, I. Cloning and expression of a gene encoding cyanidase from pseudomonas stutzeri AK61. Appl. Microbiol. Biotechnol. 1998, 50, 93–97. [Google Scholar]
  25. Schöning, M. J.; Brinkmann, D.; Rolka, D.; Demuth, C.; Poghossian, A. CIP (cleaning-in-place) suitable “non-glass” pH sensor based on Ta2O5-gate EIS structure. Sens. Actuators B 2005, 111-112, 423–429. [Google Scholar]
  26. Poghossian, A.; Thust, M.; Schroth, P.; Steffen, A.; Lüth, H.; Schöning, M. J. Penicillin detection by means of silicon-based field-effect structures. Sens. Mater. 2001, 13(4), 207–223. [Google Scholar]
  27. Poghossian, A.; Schöning, M. J. Silicon-based chemical and biological field-effect sensors. In Encyclopedia of Sensors; Grimes, C. A., Dickey, E. C., Pishko, M. V., Eds.; American Scientific Publishers, Stevenson Ranch: USA, 2006; Vol. 9, pp. 463–534. [Google Scholar]
  28. Ingvorsen, K.; Hojer-Pedersen, B.; Godtfredsen, S. E. Novel cyanide-hydrolyzing enzyme from alcaligenes xylosoxidans subsp. denitrificans. Appl. Environ. Microbiol. 1991, 57, 1783–1789. [Google Scholar]
Figure 1. PhastGel Homogeneus 12.5 with silver stain (top) and dedicated gel scan in vertical direction (bottom) at y-position of 37.5 kDa in order to evaluate the immobilisation process of cyanidase to NHS-activated Sepharose™: sample S1 belongs to t = 0 h and sample S6 to t = 22 h 20 min.
Sensors 07 01415f1
Figure 2. C/V curves of the field-effect-based EIS sensor. The influence of both the immobilised “cyanidase gel” and the dialysis membrane onto the C/V curve behaviour is shown (bare EIS sensor; EIS sensor with dialysis membrane; EIS sensor with dialysis membrane and NHS-activated Sepharose™ without immobilised cyanidase; EIS sensor with dialysis membrane and NHS-activated Sepharose™ with immobilised cyanidase).
Sensors 07 01415f2
Figure 3. ConCap measurement of the field-effect-based EIS sensor. The influence of both the immobilised “cyanidase gel” and the dialysis membrane onto the biosensor signal is shown (bare EIS sensor; EIS sensor with dialysis membrane; EIS sensor with dialysis membrane and NHS-activated Sepharose™ without immobilised cyanidase; EIS sensor with dialysis membrane and NHS-activated Sepharose™ with immobilised cyanidase). Measurement concentration ranges from 0 M to 10−2 M KCN.
Sensors 07 01415f3
Figure 4. ConCap measurement of the cyanide biosensor (EIS sensor with dialysis membrane and NHS-activated Sepharose™ with immobilised cyanidase) compared to a ConCap curve of an EIS sensor with dialysis membrane and NHS-activated Sepharose™ but without immobilised cyanidase. Both measurement curves are normalised to the starting voltage value at 0 M in the beginning of the measurement cycle. Measurement concentration ranges from 0 M to 10−2 M KCN.
Sensors 07 01415f4
Figure 5. Differential output signal of the biosensor set-up calculated from normalised ConCap measurements. The EIS sensor with dialysis membrane and NHS-activated Sepharose™ with immobilised cyanidase is compared to a ConCap curve of an EIS sensor with dialysis membrane and NHS-activated Sepharose™ without immobilised cyanidase. Measurement concentration ranges from 0 M to 10−2 M KCN.
Sensors 07 01415f5

