1. Introduction
Hydropower is one of the world's most important renewable, non-carbon-based energy resources. In the United States, hydropower currently provides about 10% of the nation's electricity and accounts for nearly 75% of the electricity generated from renewable sources [
1]. However, hydropower production causes negative impacts to fish that live in or migrate through impounded river systems. Fish passing through dams may be injured or killed when they are exposed to severe hydraulic conditions. Injury mechanisms include rapid and extreme pressure changes, shear stress, turbulence, strike, cavitation, and grinding [
2,
3]. In addition, in the Columbia and Snake rivers hydropower system and many else where, hydroturbines are nearing the end of their operational life expectancy. Before rehabilitating or replacing these turbines, new designs for runners and other portions of the turbine system are being considered. Therefore, in the Pacific Northwest and elsewhere, improved survival rates and reduced injury rates for fish passing through turbines are being sought through changes in hydroturbine design and operation [
4].
To design or operate hydroelectric facilities for maximum power generation and minimum ecological impact, it is critical to understand the nature of hydraulic conditions or physical stresses to which fish are exposed when they pass through complex hydraulic environments and to identify the locations and operations where conditions are severe enough to injure or kill fish [
5–
7]. Development of an autonomous sensor package termed Sensor Fish was initiated in 1997 to measure conditions that occur in situ and assist in deriving biological specifications for “fish-friendly” turbine design and operation.
Since initial development, the Sensor Fish has undergone numerous design changes to improve its function and extend the range of its use [
8]. The most recent and ambitious changes to the Sensor Fish design involved a major overhall of hardware and software:
Added three rotation sensors (rate gyros) to measure 3-dimensional rotational velocities to provide full six-degree-of-freedom measurement capability.
Modified placement of sensors for better performance.
Increased sampling frequency from 200 Hz to 2,000 Hz to allow more accurate capture of rapid changes of motion and pressure that occur during passage through hydroelectric turbines and other fish passage alternatives.
Added more non-volatile internal memory for data storage and increased reliability.
Increased the dynamic ranges of acceleration, temperature, and pressure sensors.
Improved software for hardware access and data communications.
Selected pressure sensors with smaller external opening and greater sensitivity.
Since its development in 2005, the 6DOF Sensor Fish device has been successfully deployed in many fish passage studies and evolved to be a major tool for characterizing hydraulic conditions during fish passage in the United States [
9].
2. Governing equations
During the design process, a general formulation was derived for the coordinate systems, equations of motion, and force and moment relationships necessary to simulate the 6DOF movement of an underwater body [
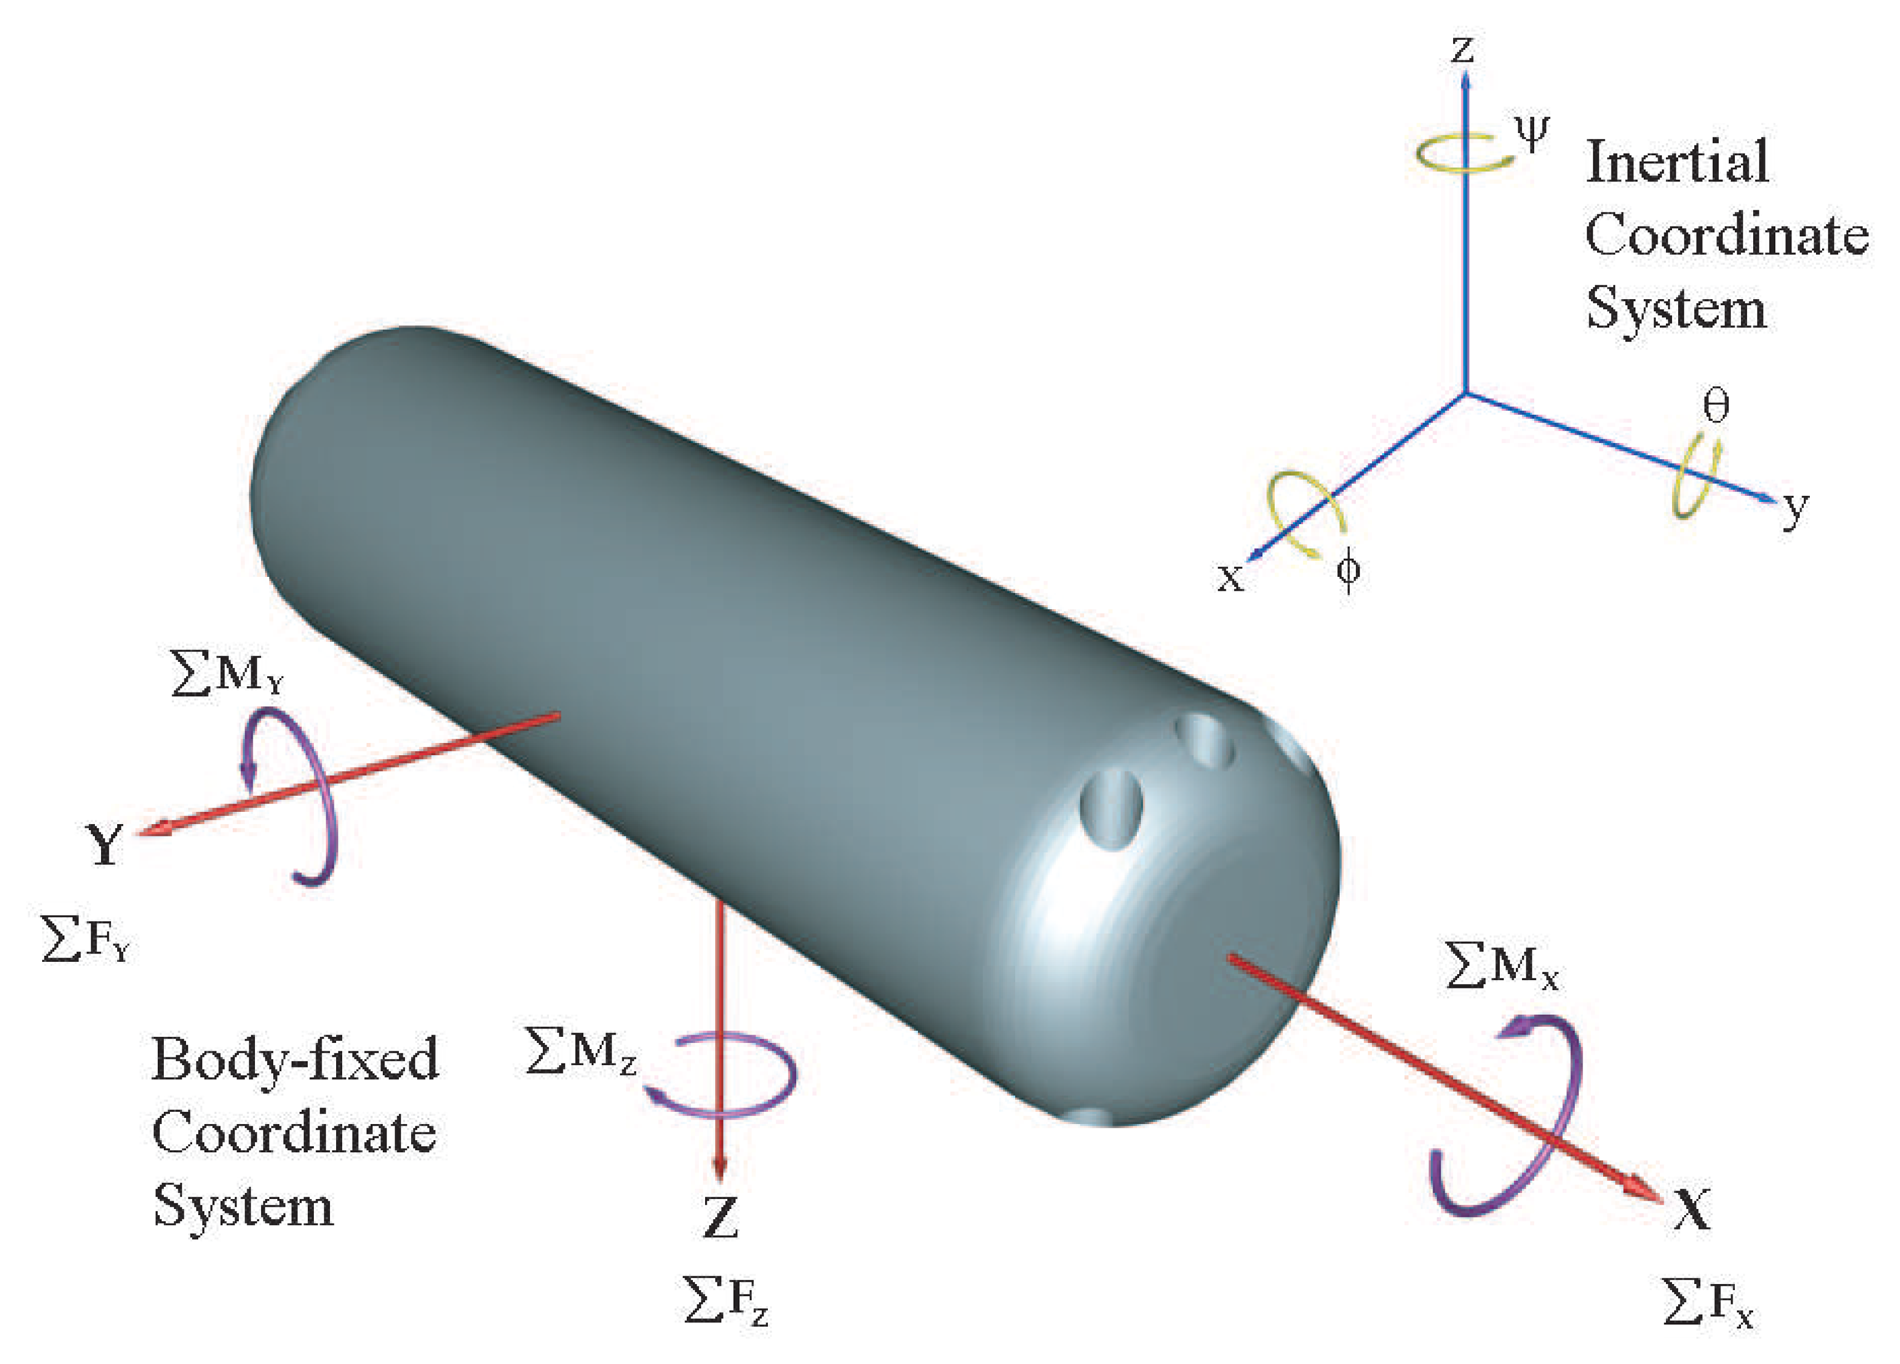
10]. For simplification, the Sensor Fish device was assumed to be a rigid and axisymmetric body.
“Body-fixed coordinate system (frame)” and “inertial coordinate system (frame)” are used with conventional aerodynamics definitions in the current investigation (
Figure 1). The origin of the body-fixed coordinate system is located at the center of buoyancy (center of geometry). (
x, y, z) and (
ϕ, θ, ψ) are the position and orientation of Sensor Fish with respect to the inertial coordinate system. Suppose Q is the corresponding homogeneous transformation, then
where (
u, v, w)
T and (
ẋ,
ẏ,
ż)
T are the translational velocities of Sensor Fish with respect to the body-fixed coordinate system and the inertial coordinate system, respectively.
To overcome the singularity associated with the use of Euler angles (sometimes referred to as “gimbal-lock”) [
11], the quaternion representation for rigid body rotation is introduced.
Let four parameters
ϵ1,
ϵ2,
ϵ3, and
ϵ4 form the components of the quaternion
ϵ. The related transformation matrix
Q in terms of quaternion components is given by
The time derivative of the quaternion is related to the rotational velocities in the body-fixed frame,
where
t is the time. Refer to [
12] or [
13] for more details about quaternion representation.
Because most of the external forces and moments exerted on the Sensor Fish are represented in the body-fixed system, all the governing equations of motion are written in the body-fixed system as well. The terms are defined as
where (
xg, yg, zg) is the center of mass in the body-fixed frame– that is, the offset of the center of mass with respect to the center of buoyancy– because the origin of the body-fixed frame is defined at the center of buoyancy; ∑
F and ∑ M are the total force and moment exerted on the body; and all the components and operations are with respect to the body-fixed frame.
For a rigid body in a water flow field, the total forces and moments are
where
FHS and
MHS are hydrostatic forces and moments;
FL and
ML are body lift forces and moments;
FD and
MD are body hydrodynamic drag forces and moments; and
FA and
MA are the corresponding forces and moments of added mass. All these components can be expressed as functions of
ϵ, Ω,
v, and
r.
Newton's second law is used to relate the external forces to linear acceleration:
Similarly, Euler's equation is used to relate the external moments to rotational motion of the rigid body,
where
m is the mass of the rigid body and
is the inertial tensor, in which (
Ixx,
Iyy,
Izz) are the moments of inertia and the other components are usually referred to as the products of inertia.
Equation (6) is substituted into
Equations (7) and
(8) together with
Equations (1) and
(3) to obtain the governing equations of motion, which consist of 13 first-order nonlinear differential equations with 13 unknown variables [
10].
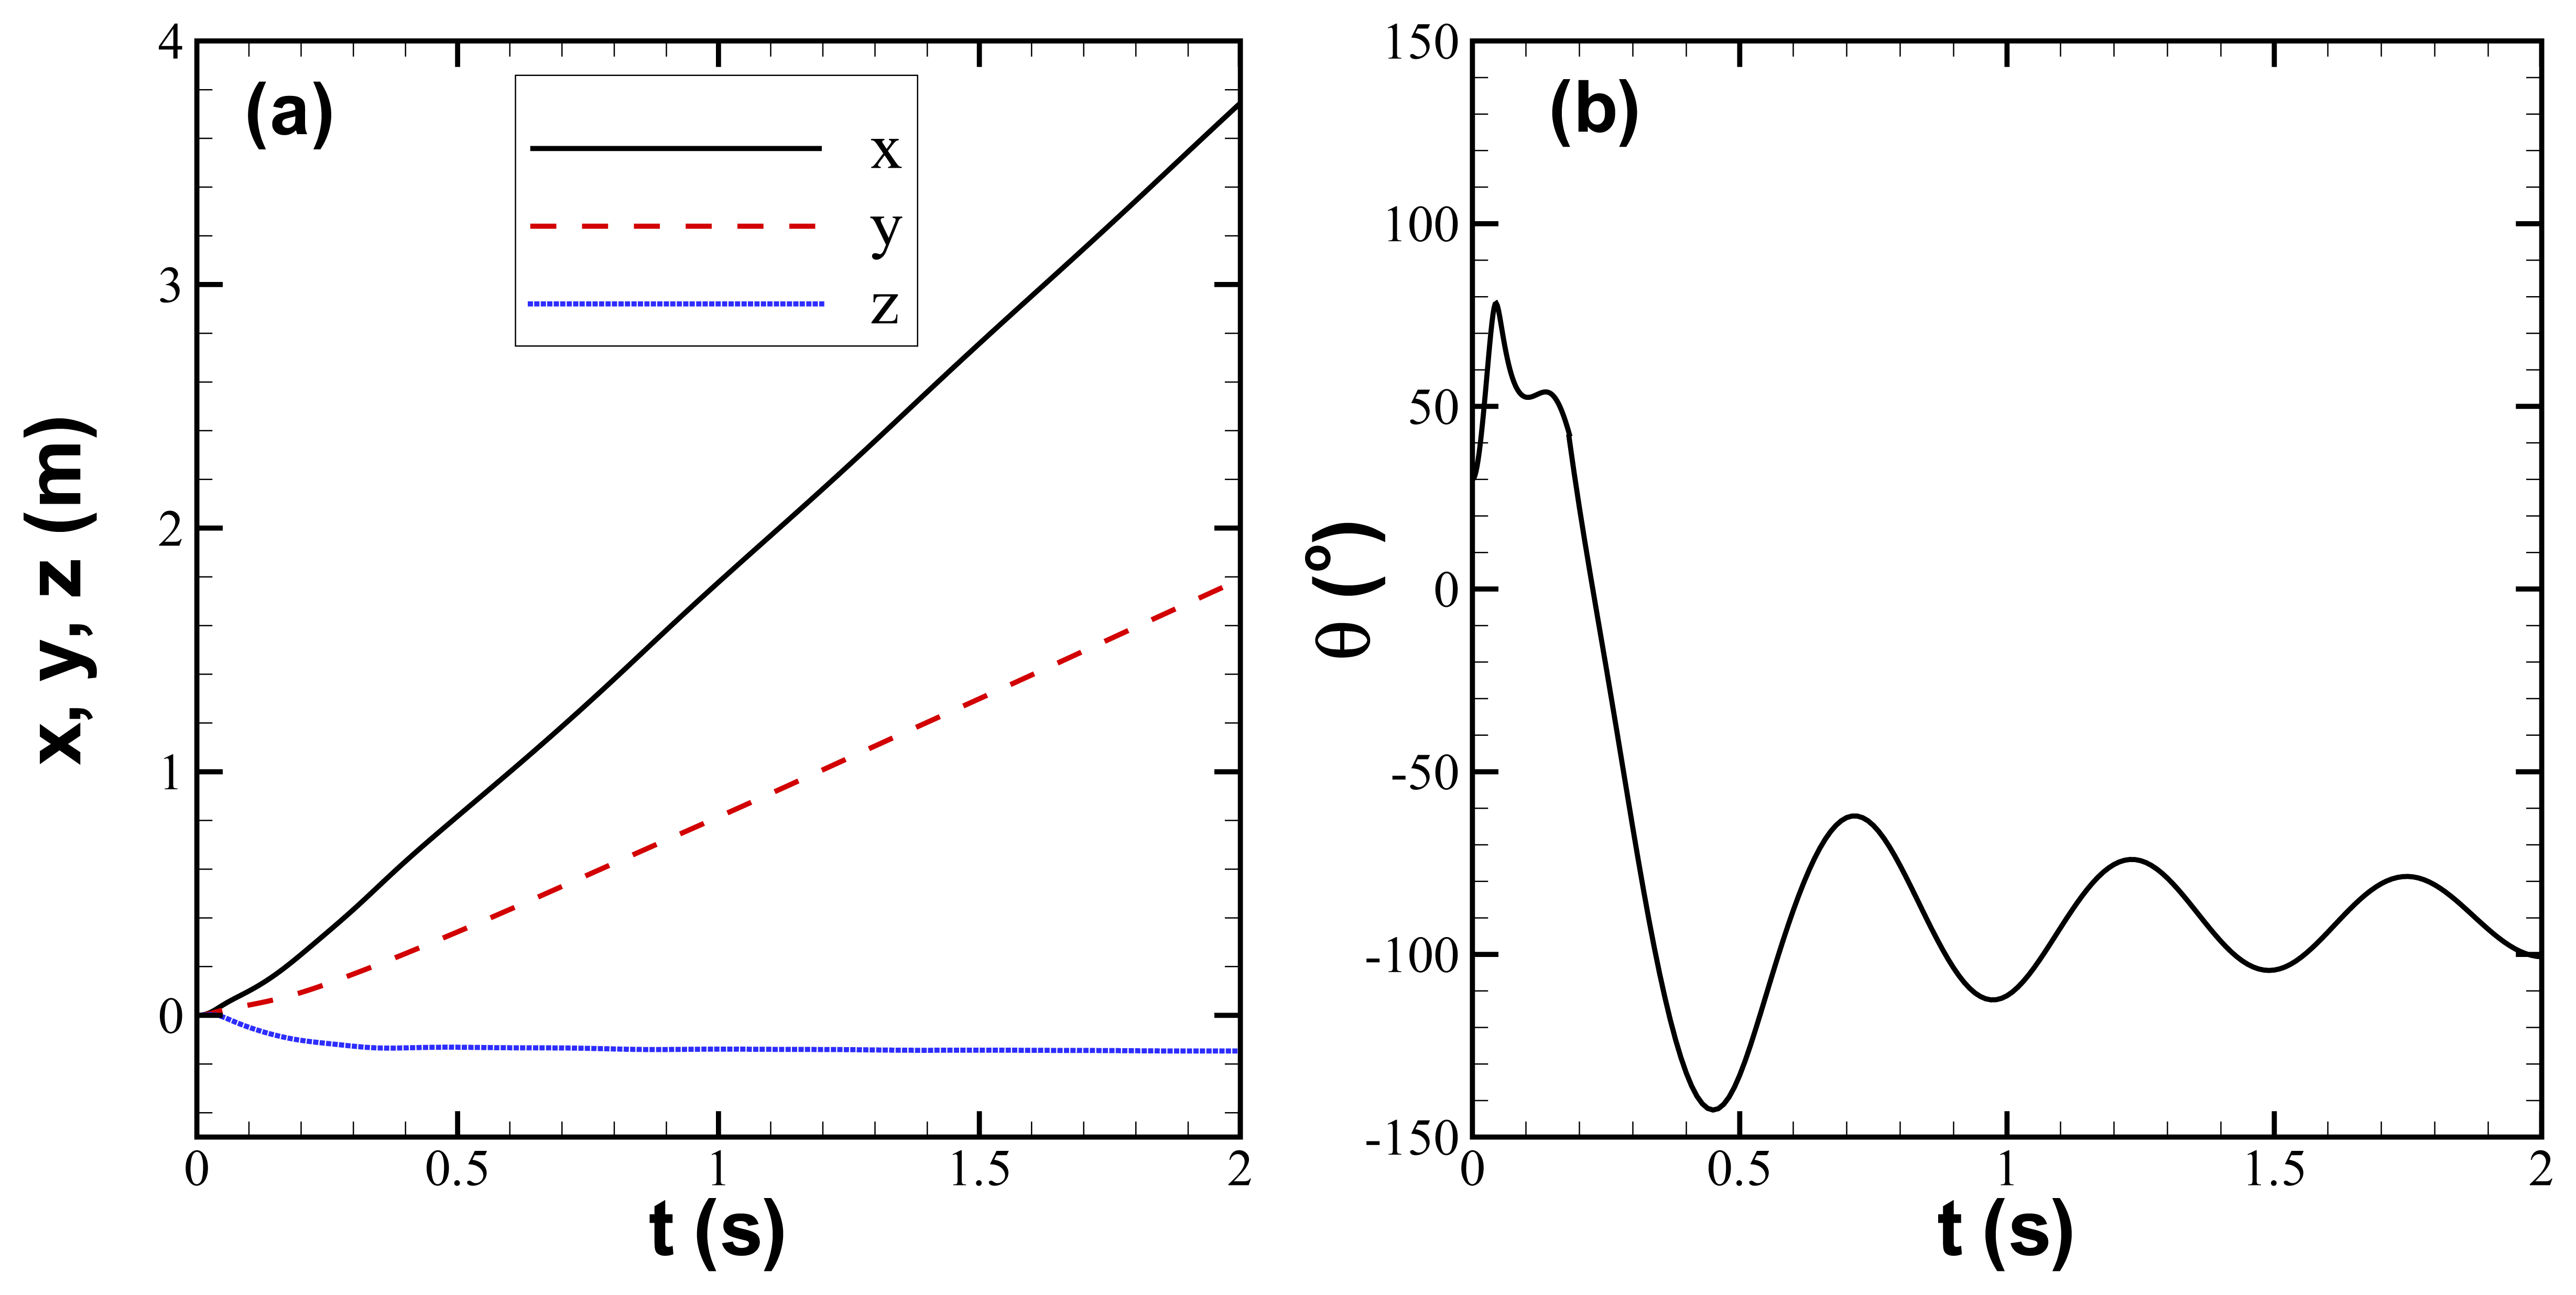
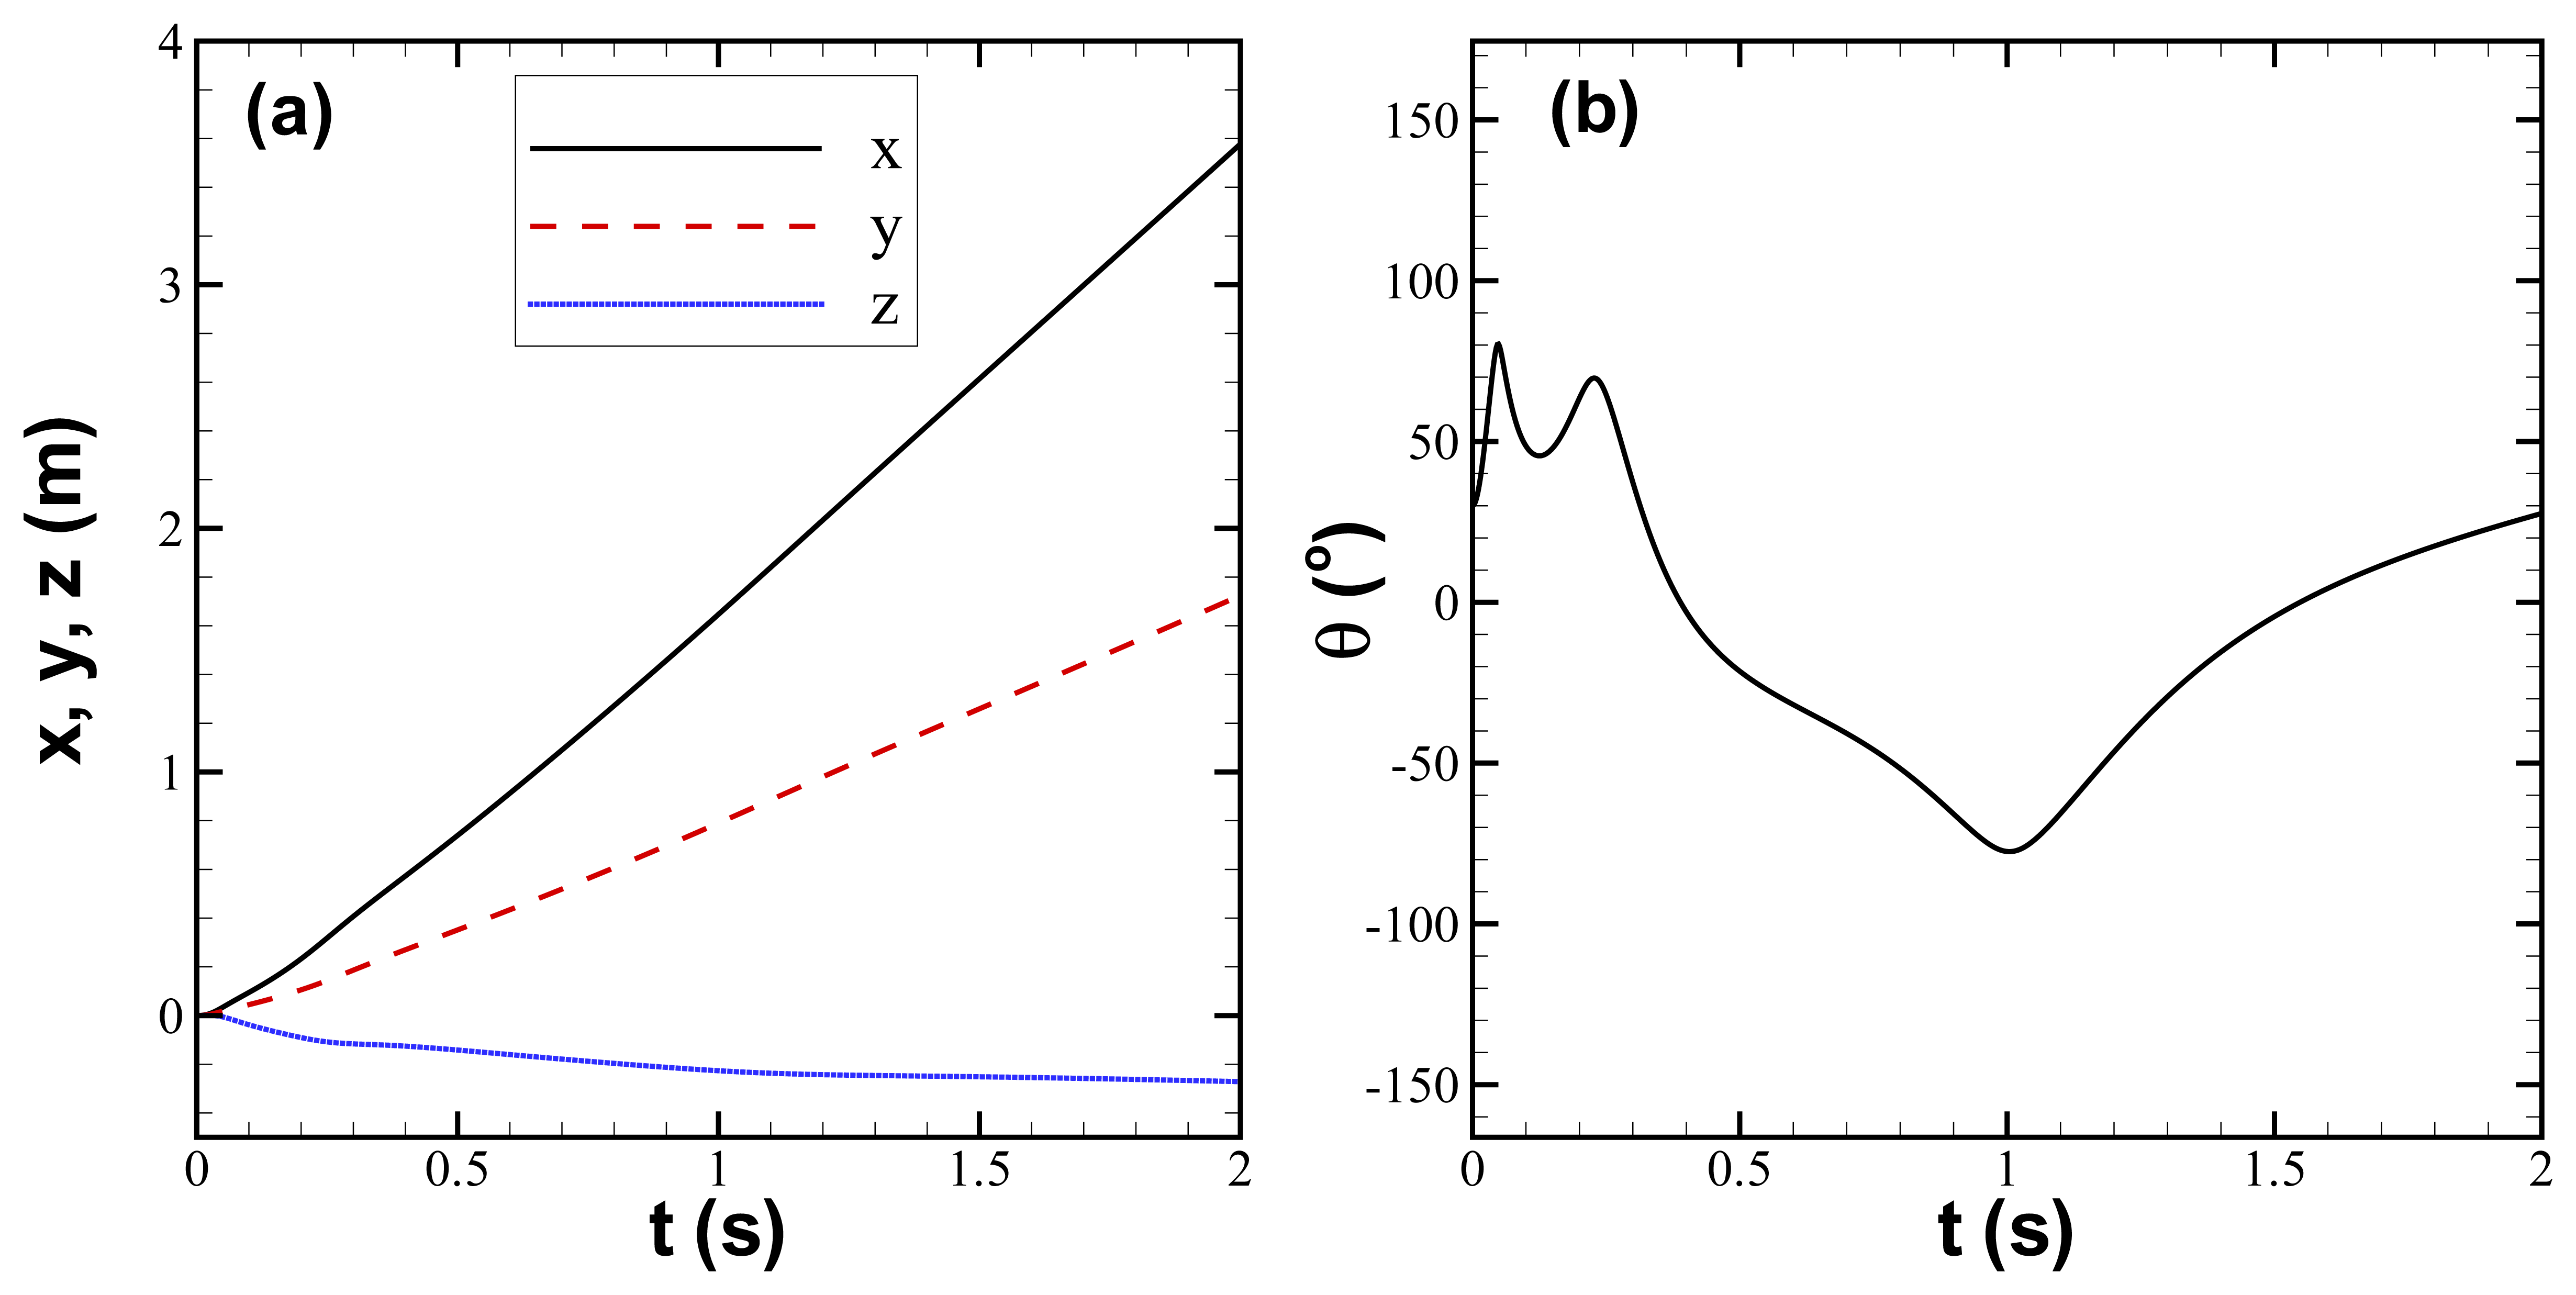
These equations are then simulated to understand the design implications of instrument selection and placement within the body of the device. For example, suppose the length and diameter of Sensor Fish are 10 and 2 cm, respectively. Sensor Fish is initially stationary and neutrally buoyant, and its initial quaternion values are
The ambient flow is a two-dimensional uniform flow field (
Vx = 2 m/s,
Vy = 1 m/s). Case 1 (
Figure 2) has a 2-cm offset between the mass center and the geometric center of Sensor Fish, and Case 2 (
Figure 3) has no offset. The equations of motion are solved by an explicit Runge-Kutta (4,5) formula, the Dormand-Prince pair [
14].
Figures 2 and
3 show that an offset of the center of mass leads to an increase in Sensor Fish rotation.
3. Sensor Fish instrumentation and calibration
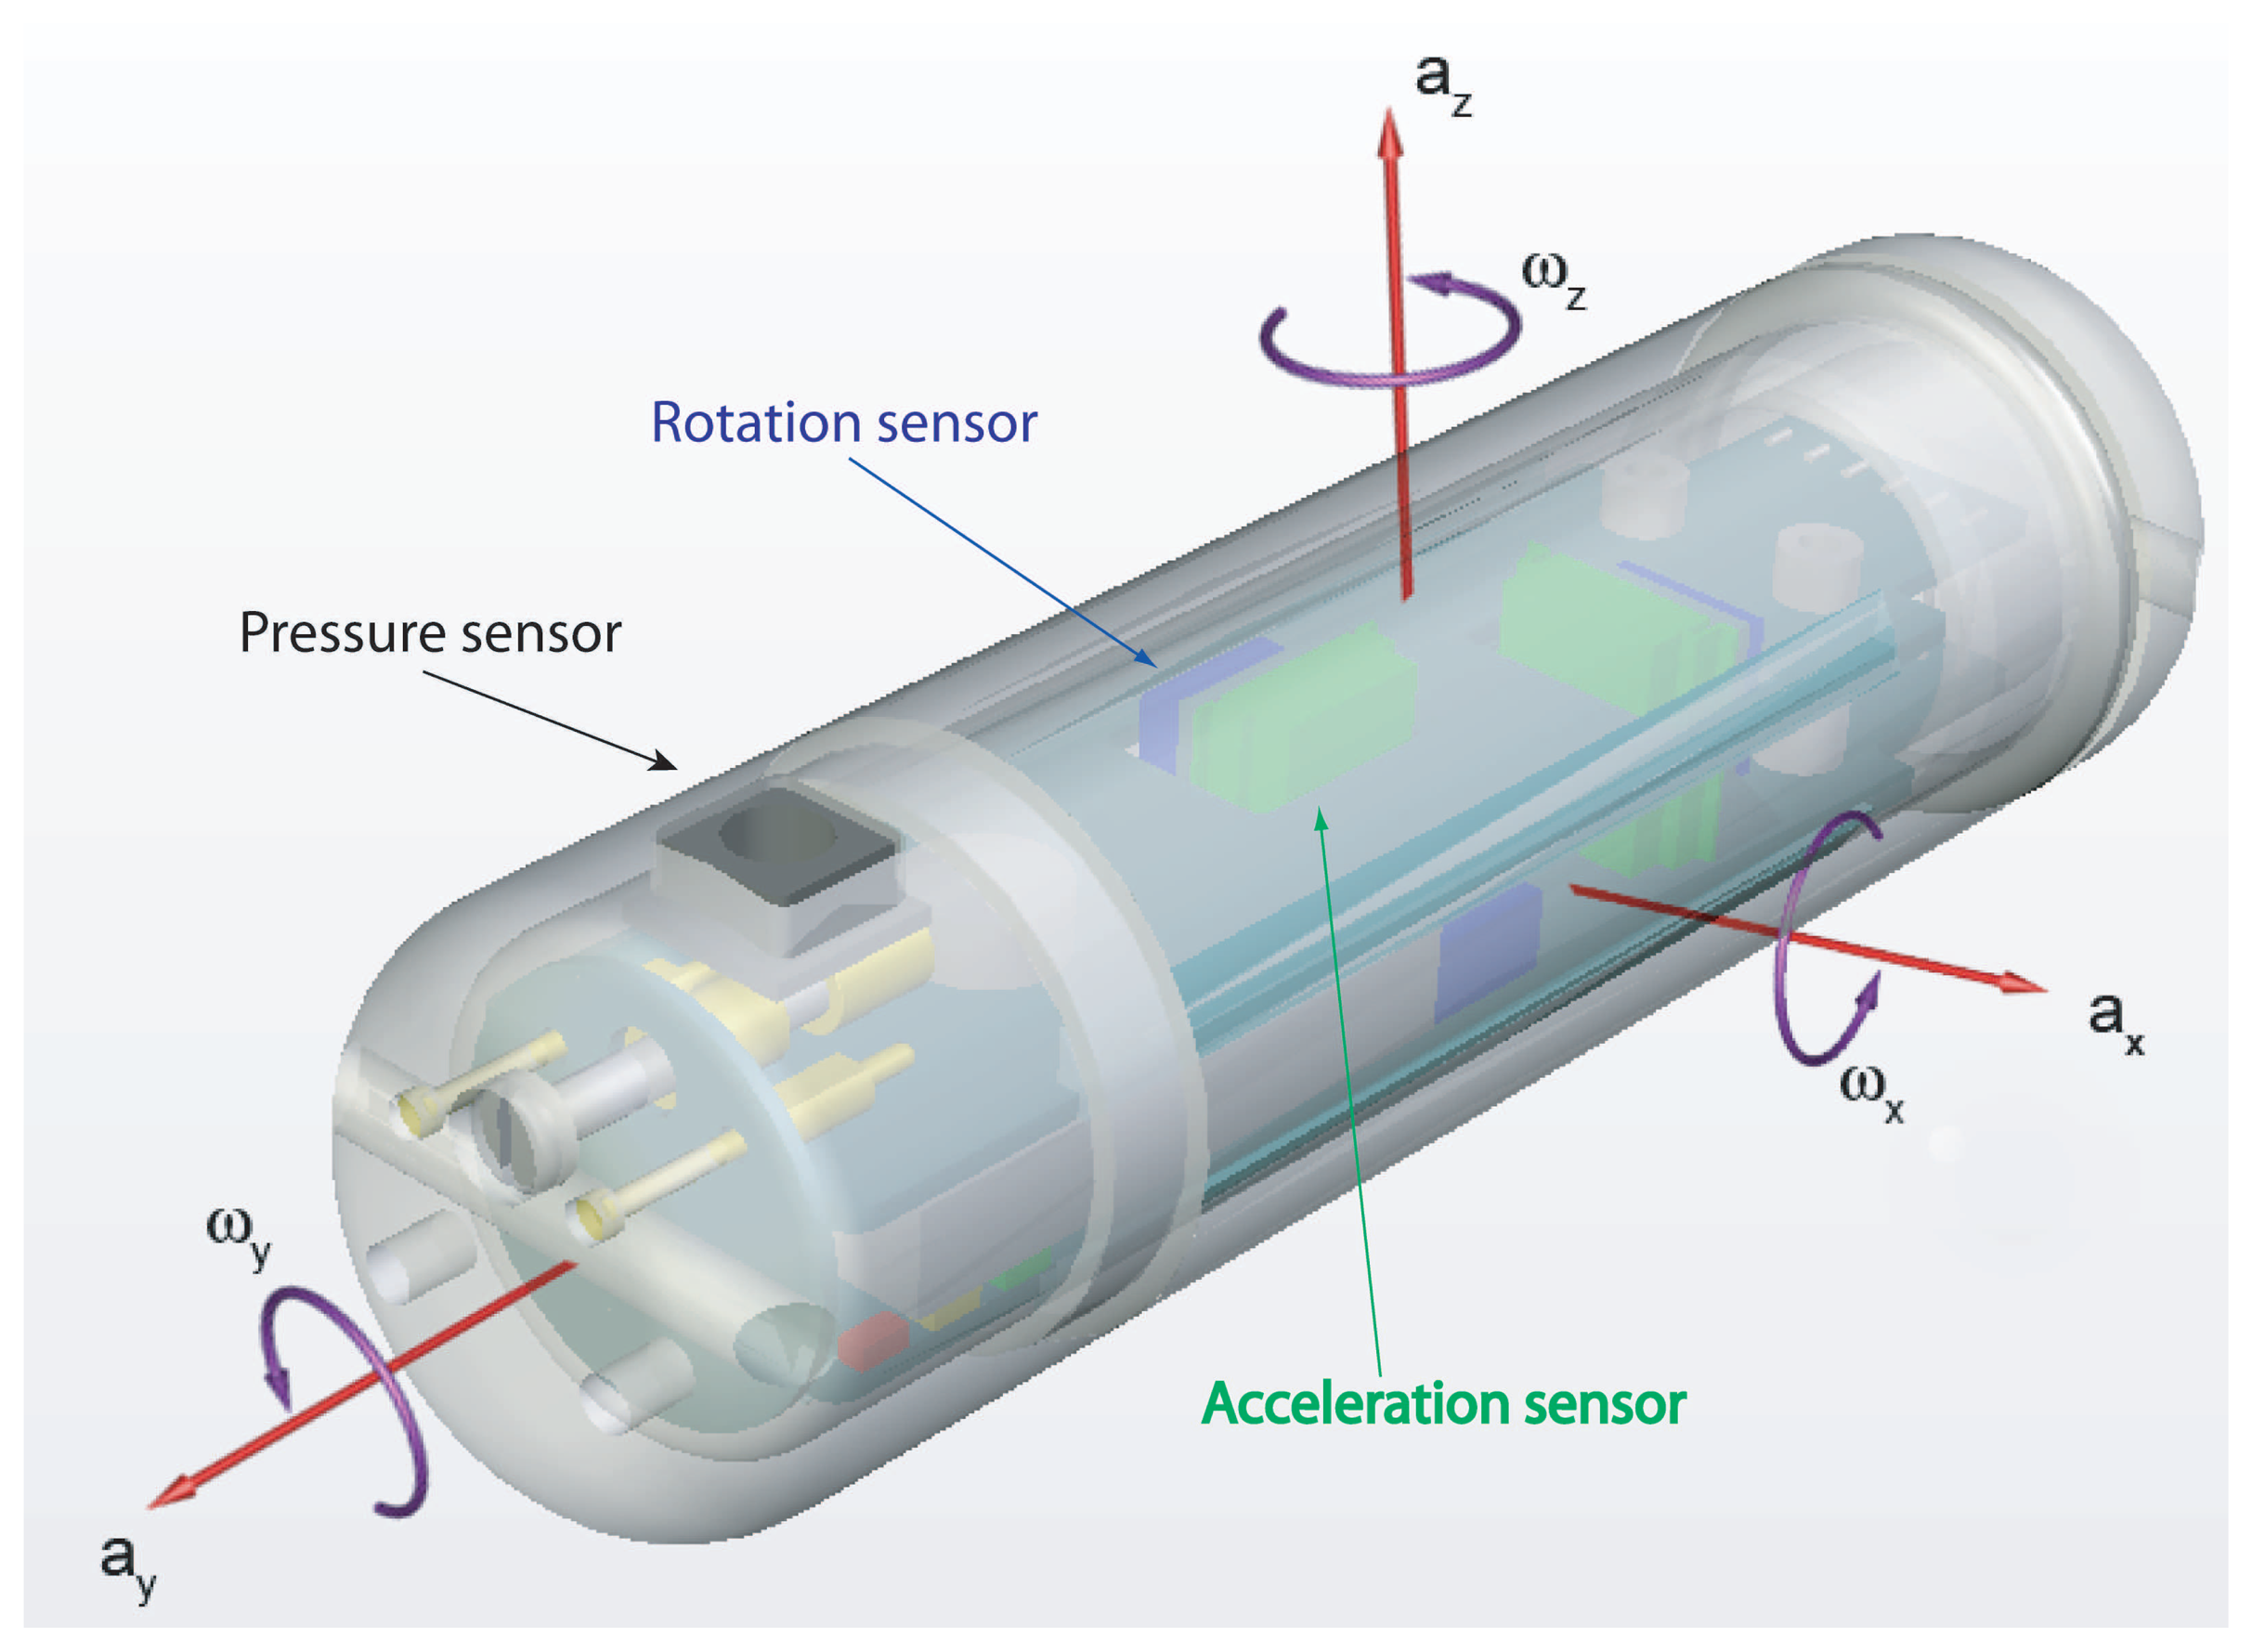
The Sensor Fish housing is constructed of clear polycarbonate plastic (
Figure 4). It is 24.5 mm in diameter and 90 mm in length, weighs about 43 g, and is neutrally buoyant, with the geometry center and the mass center overlapped. The size and density are similar to those of a yearling salmon smolt. Its sensor package consists of three rotation sensors, three acceleration sensors, a pressure sensor, and an internal temperature sensor.
3.1. Acceleration
Three accelerometers (Motorola MMA1210D) are orthogonally placed at the center of Sensor Fish housing to measure three-dimensional acceleration. The accelerometers are silicon capacitive, surface-micromachined, and feature integral signal conditioning, a 4-pole low-pass filter and linear output. The sensors have an operating acceleration range of 112.5 g and high-powered shock survivability with a 1,500 g overload rating. Before assembly, all sensors are tested for linear acceleration sensibility and transverse sensitivity.
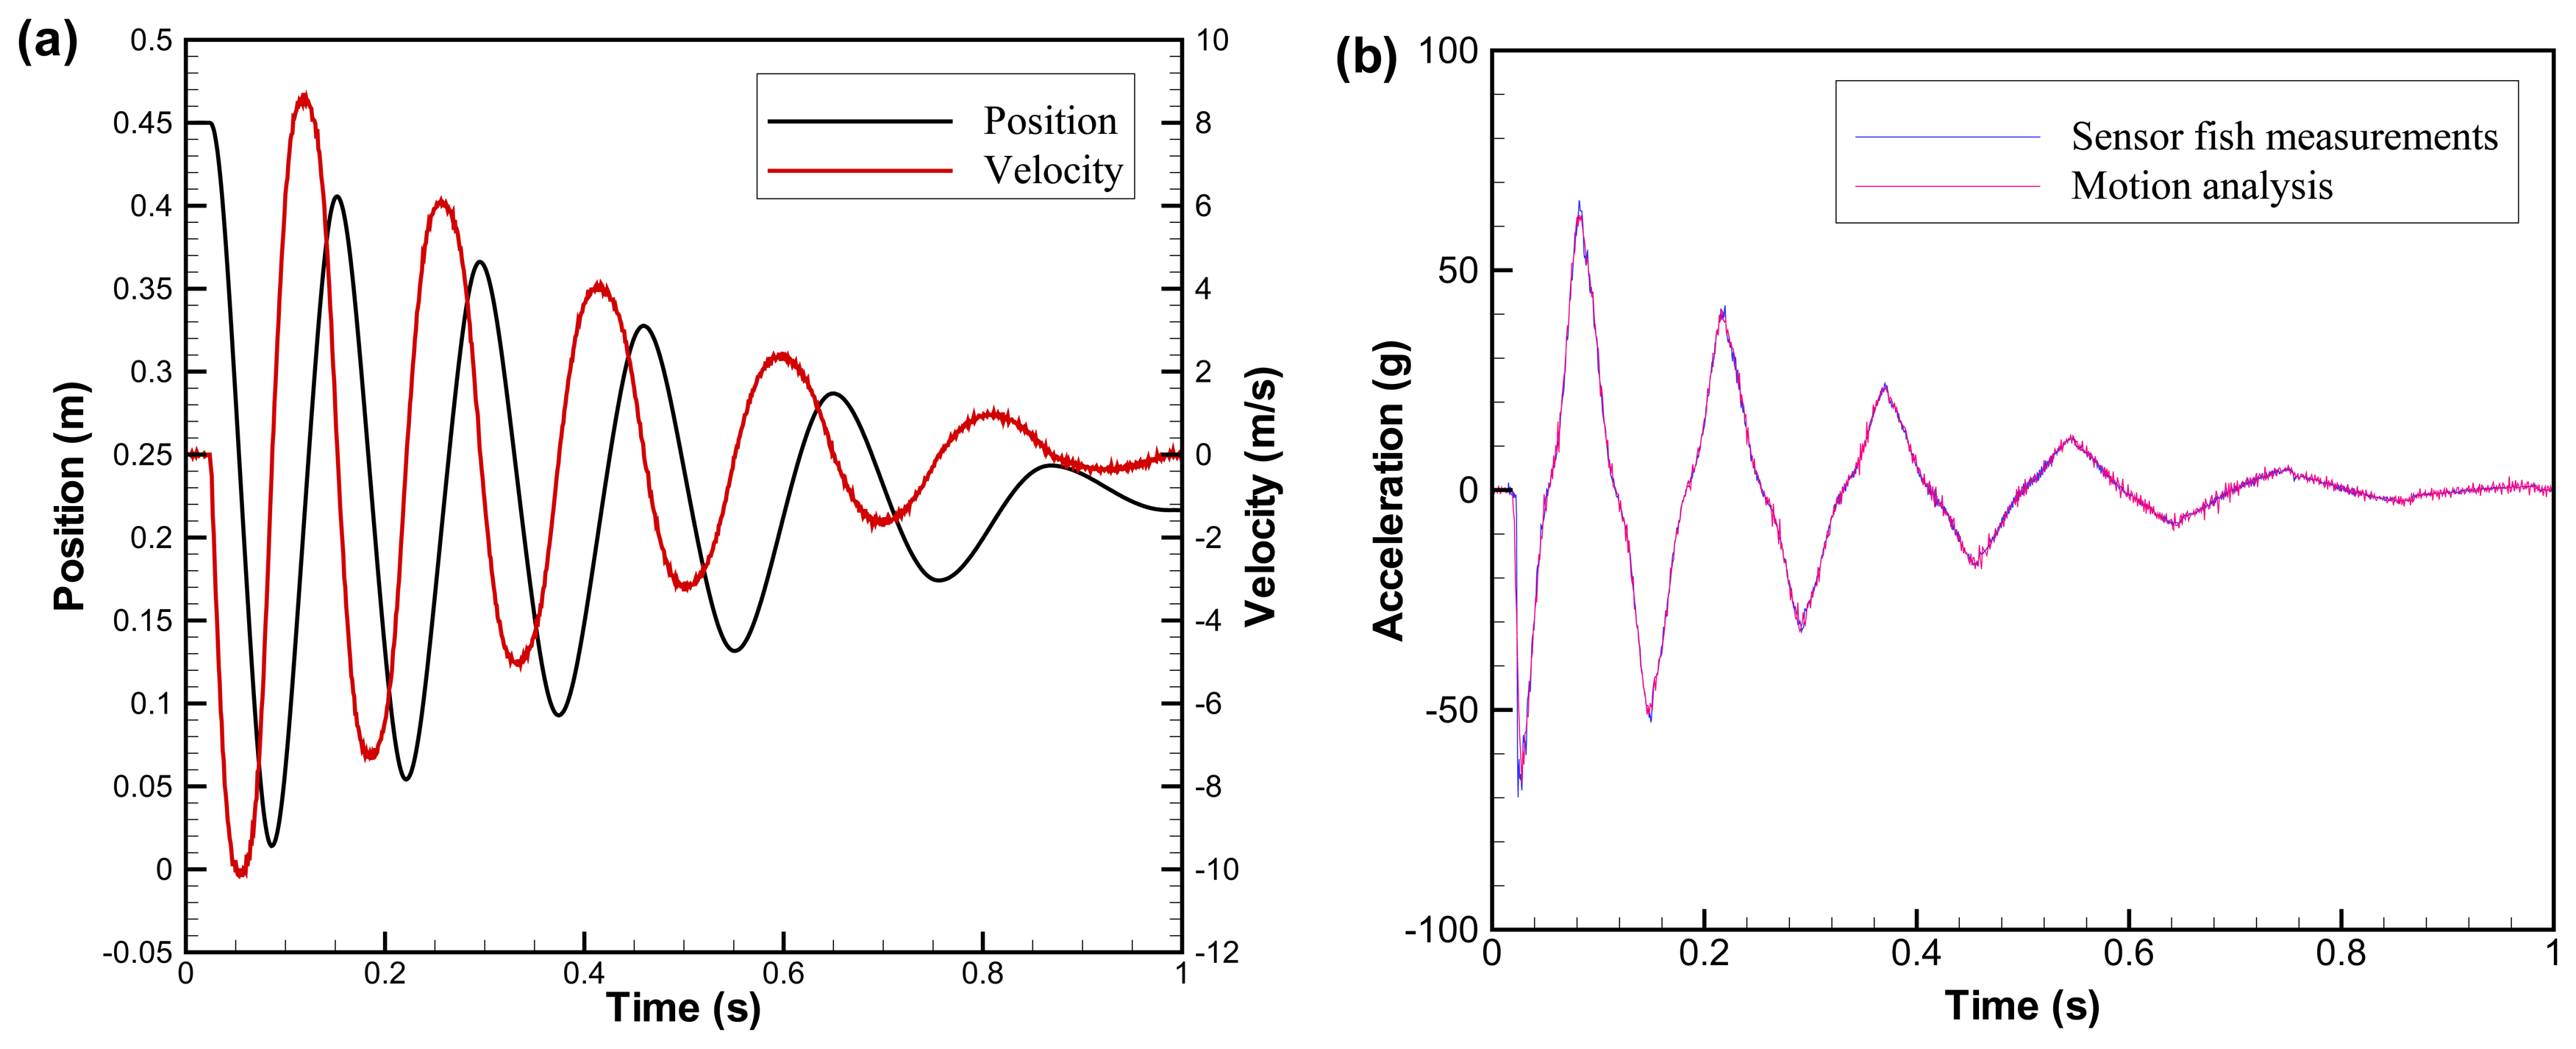
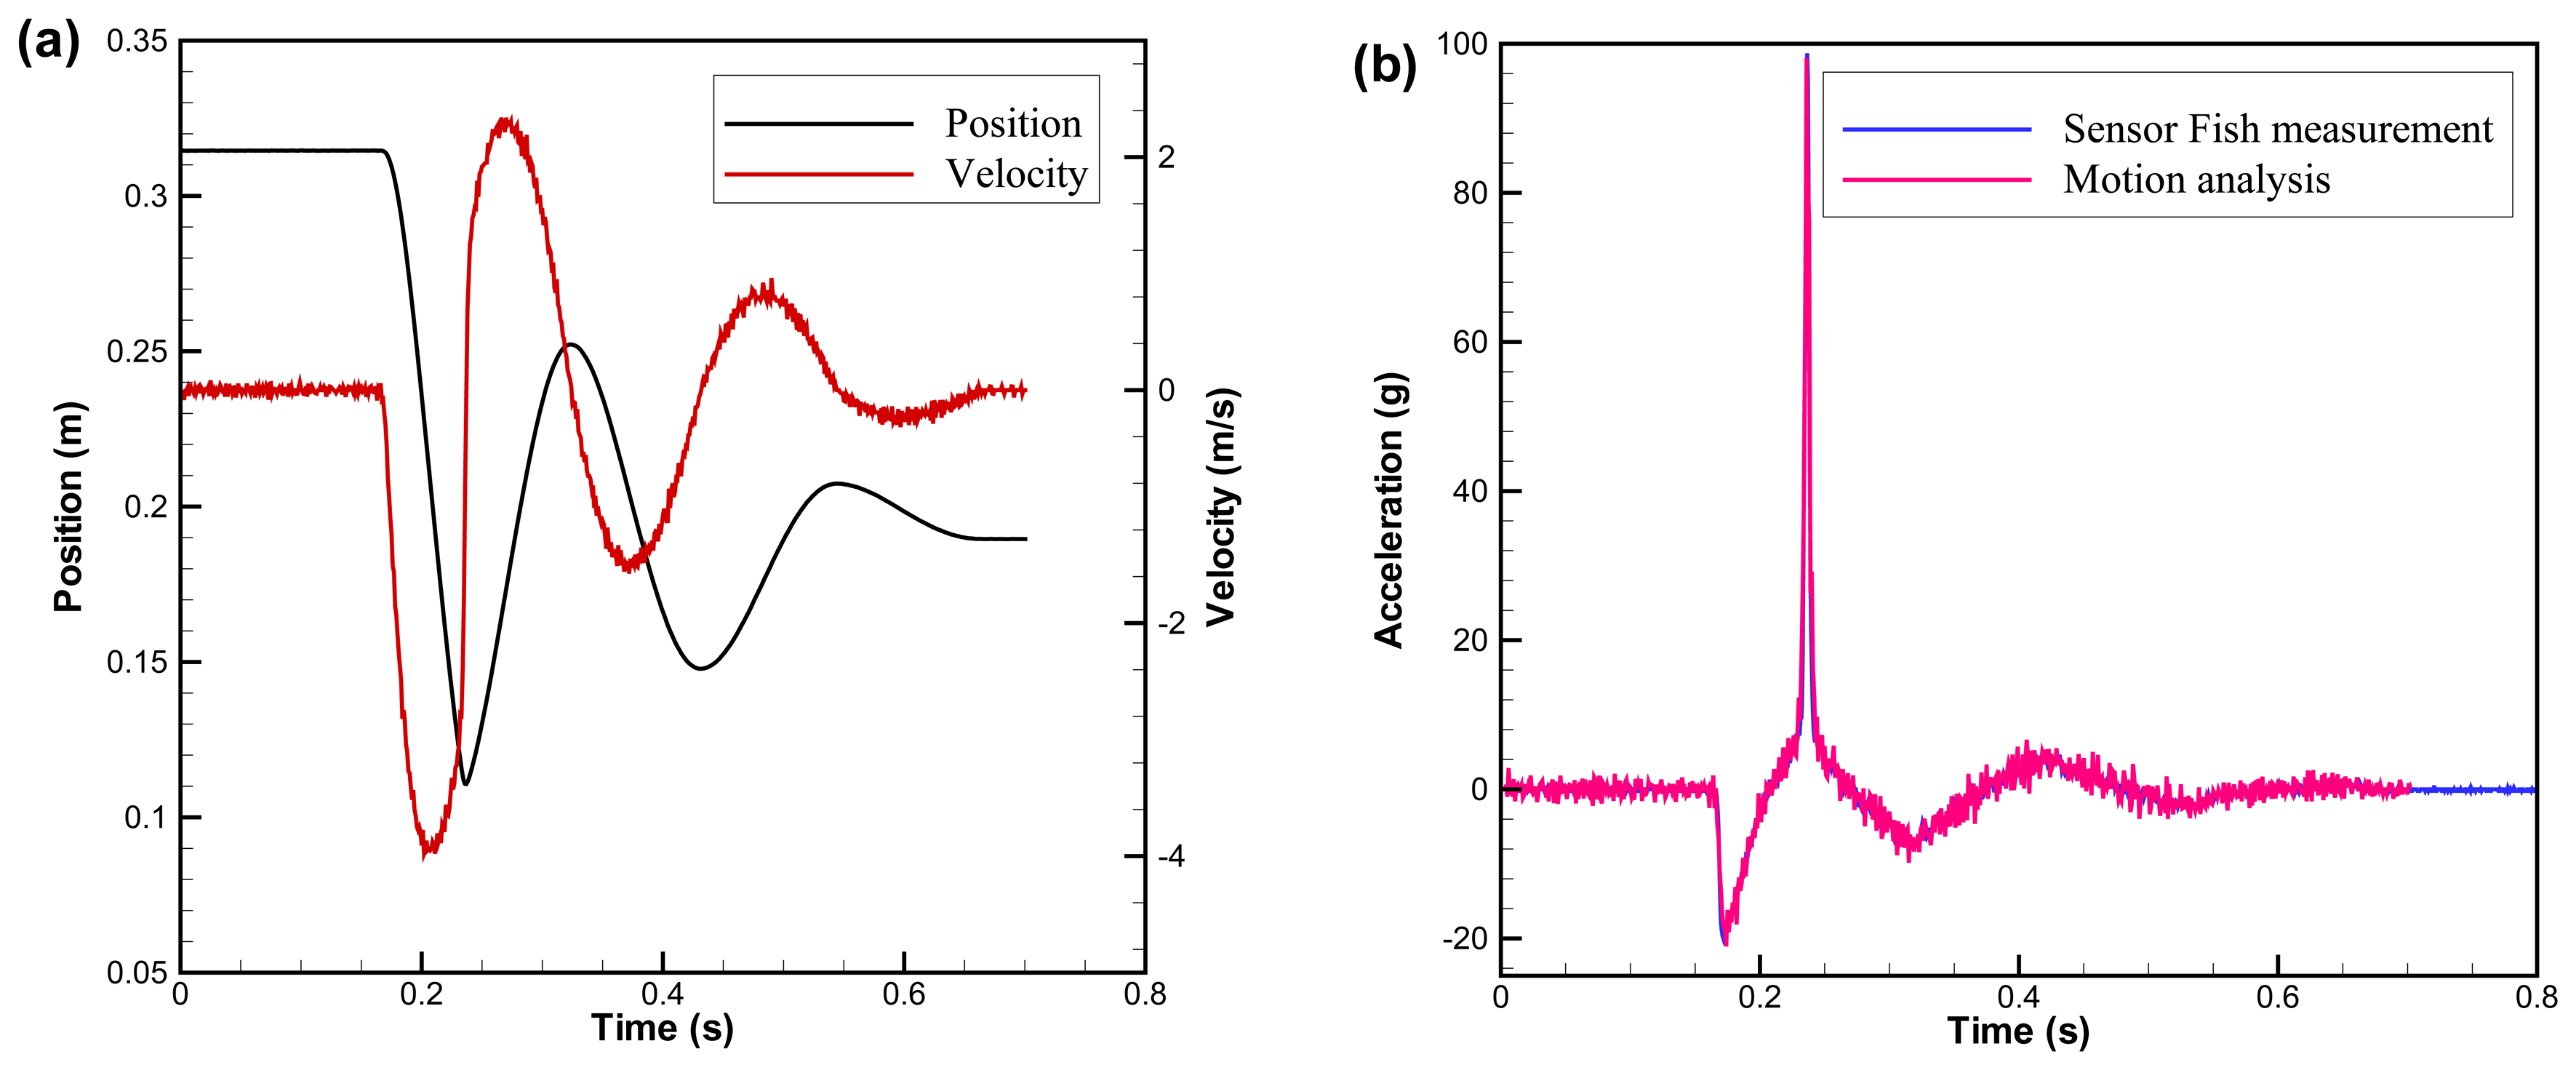
After assembly, acceleration measurements of Sensor Fish were calibrated in a linear acceleration test track in conjunction with high speed videography. The test track also had a built-in potentiometer that gives the positions of the sensors. Sensor Fish movement was recorded also using a digital high-speed camera (Photron PCI FastCAM 1280; Photron USA, Inc., San Diego, Calif.) equipped with a 50-mm lens. The camera is capable of a 500 frame-per-second frame rate at a resolution of 1,280 × 1,024 pixels and up to 16,000 frame-per-second at a reduced resolution. Trajectories of the sensors were obtained using a motion-tracking software package (Visual Fusion 4.2; Boeing-SVS Inc., Albuquerque, New Mexico). Velocity was then computed by numerical differentiation of the measured position trajectories. Acceleration was computed by numerical differentiation of the velocity time histories. Each axis of the tri-axial accelerometer set was individually checked under two different accelerating mechanisms: the unforced spring-mass-damper system and the collision system. For the unforced spring-mass-damper system, the Sensor Fish mounting plate was pulled to a certain displacement. After the accelerometers were activated, the mounting plate was released and set in motion. It moved with a progressively decreasing amplitude and eventually stopped moving due to damping (
Figure 5a). The measurements by the accelerometers were almost identical to those by motion analysis, both in wave form and acceleration magnitude (
Figure 5b). For the collision system, a stopper was installed in the linear motion and collided with the moving sensor fish, which simulated the collision between the Sensor Fish and hydraulic structures in the field. Because of the impact from the stopper, the Sensor Fish experienced a sudden change of velocity (
Figure 6a), leading to a large acceleration magnitude. The collision process was captured accurately by the Sensor Fish (
Figure 6b). The relative errors of linear acceleration measurements were determined to be less than 5%.
3.2. Rotation
Three surface micro-machined angular rate sensors ADXRS300 (Analog Devices, Inc., Norwood, MA, USA) are added to the sensor package of the 6DOF Sensor Fish. They are installed orthogonally at the center of Sensor Fish housing. These sensors are based on the Coriolis Effect, under which an extra force termed the Coriolis force is added to the equations of motion in a rotating reference frame. An electrical signal is produced by sensing the Coriolis force. The resulting signal is then amplified and demodulated to produce the voltage signal output. The ADXRS300 sensors have an original full-scale dynamic range of 300 degree/s and an increased full-scale measurement range of 1,500 degree/s with the addition of an external resistor. The sensor weighs about 1 g, measures 7.0 × 7.0 × 3.0 mm, and has a powered shock survivability of 2,000-g load.
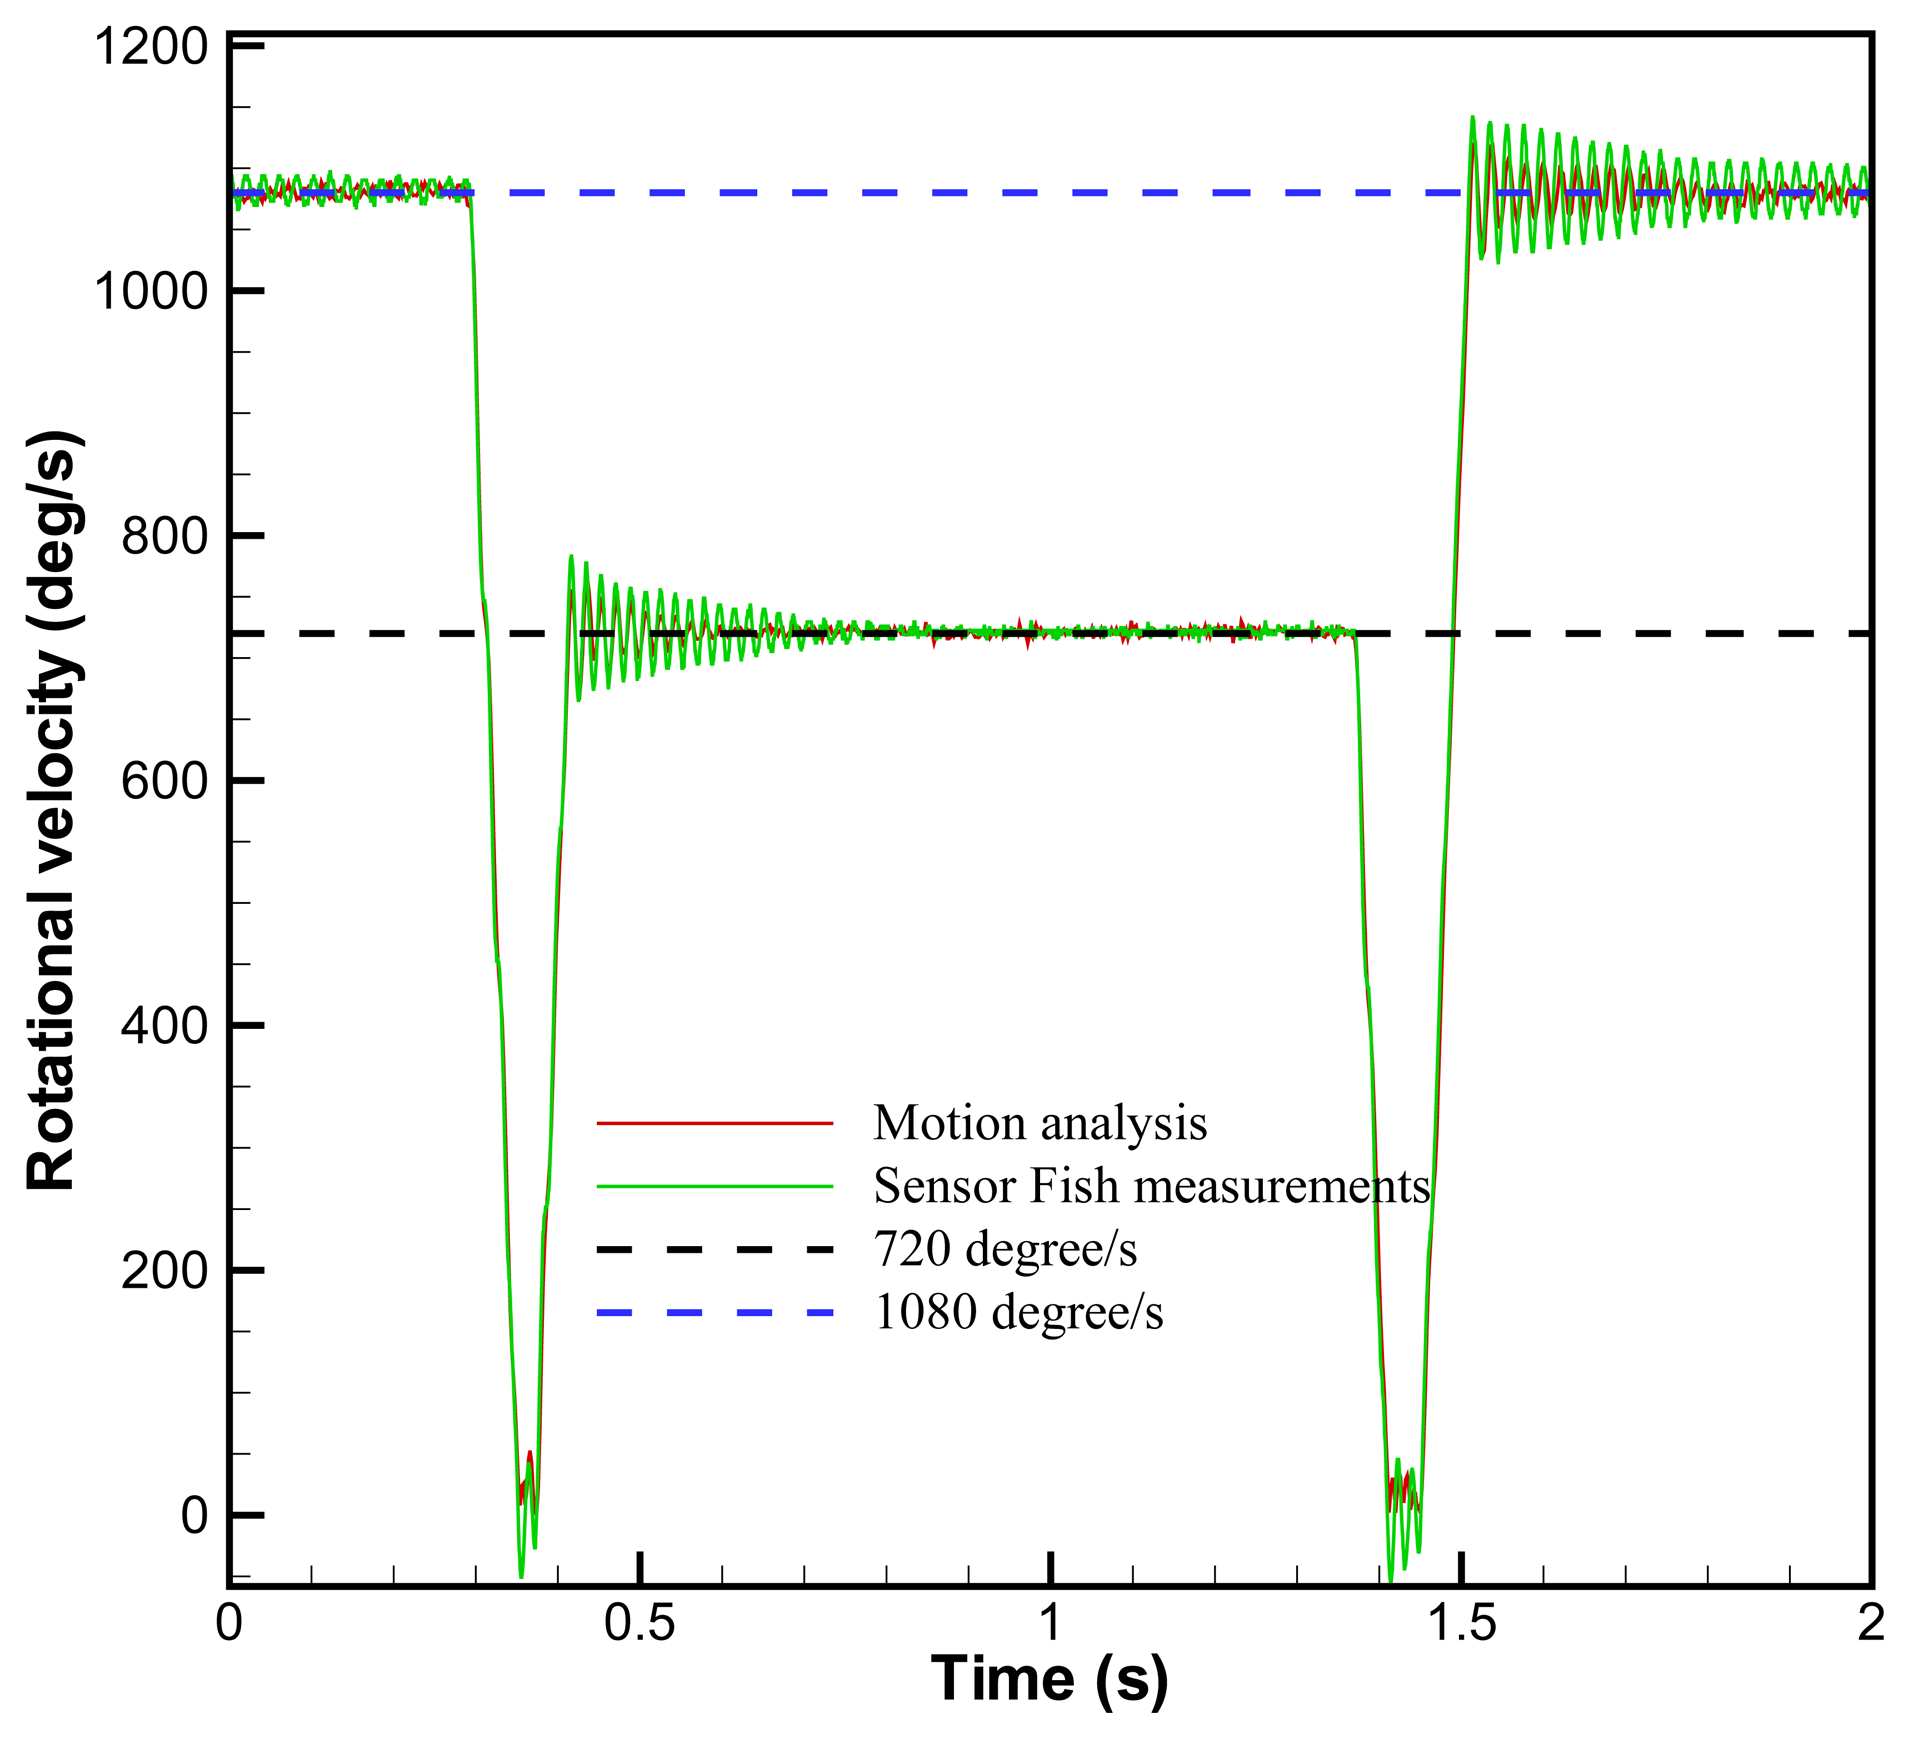
All the sensors were calibrated in a rotation test fixture, which is programmable and controlled by a computer. All three axes were calibrated individually by mounting the sensor in the fixture with one axis parallel to the rotational axis of the fixture. The rotating motions and trajectories of the sensors were obtained with the high-speed digital camera and motion analysis used for calibrating the linear accelerometers. A time history of the angle relative to the rotating axis was computed from the trajectory. The angular velocity was then obtained by numerically differentiating the time history of the angle relative to the rotating axis. The calibration was conducted in two modes: constant rotation and variable rotation. In the variable rotation mode, the rotational velocity of the fixture was controlled to alternate between 1,080 and 720 degree/s (
Figure 7). The relative error of rotational velocity measurements was determined to be less than 5% by comparing the sensor measurements with the results of the motion analysis and the fixture readings.
3.3. Pressure
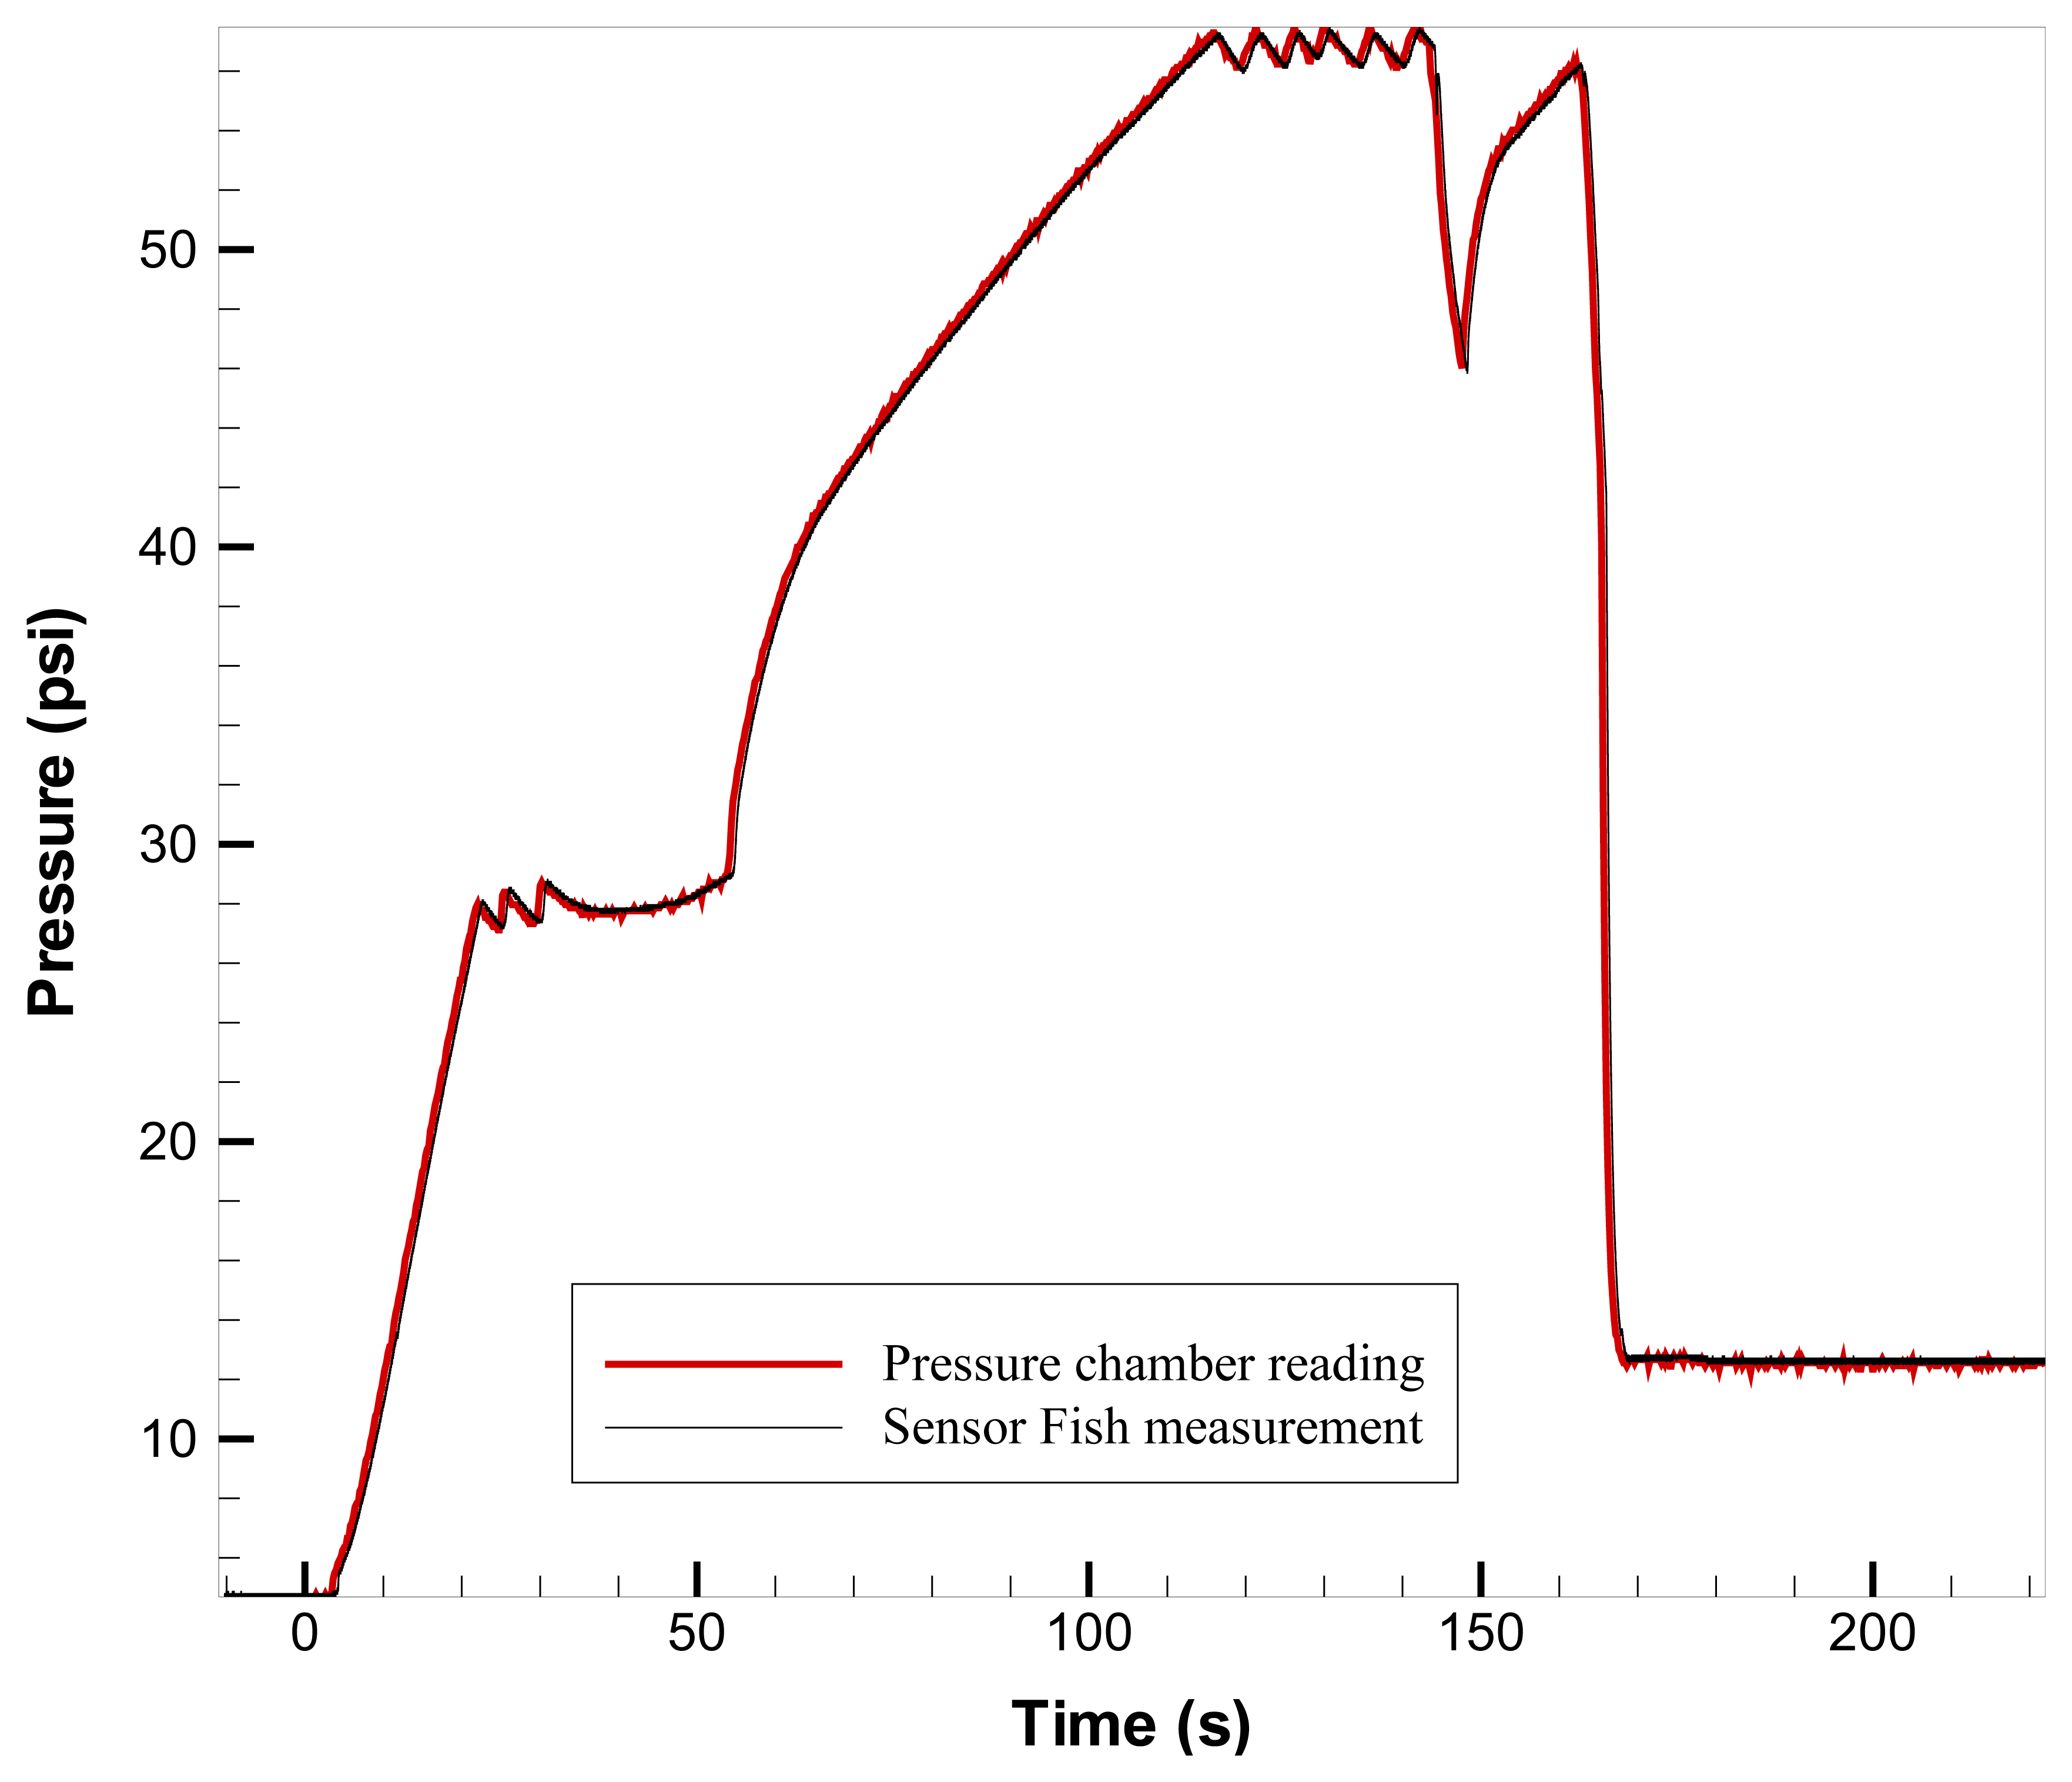
A pressure sensor (MSI 1451 or 1471) was embedded flush in the Sensor Fish housing. The MSI sensor is a piezoresistive silicon pressure sensor packaged in a surface mount configuration. Before they were mounted in the Sensor Fish housing, all sensors were calibrated using a Fluke Model 717 100G pressure calibrator and Fluke Model 700PA6 absolute pressure module (Fluke Corporation, Everett, WA, USA). The pressure sensor has a measurement range of 0-100 psia and a resolution of 0.1 psi with the use of a 10-bit A/D converter, which is built into the microcontroller chip. After the complete Sensor Fish device was built, its pressure sensor measurement was evaluated by placing the device in a rapid decompression testing chamber (hyperbaric chamber) in the laboratory. The chamber is programmed to simulate pressure time history, with pressure range and rate of change similar to turbine or spill passage.
The pressure data acquired by the Sensor Fish during the exposure were compared to the pressure data file that controls the chamber pressure exciter and were measured by another pressure sensor located in the chamber (
Figure 8). Multiple tests with different exposure histories and temperatures were conducted to confirm there was no effect of the assembly process or drift from different pressure exposures. It was found that there was a small offset for individual Sensor Fish. However, the offset is constant and temperature-independent. By subtracting the offset during the data converting process, the accuracy of the pressure sensor was determined to be within ±0.2 psi.
4. Data acquisition and analysis
4.1. Data acquisition
The Sensor Fish was designed to move passively as a near neutrally buoyant object through severe hydraulic environments. The Sensor Fish does not behave like a live fish nor does it have structures that emulate the more sensitive features of live fish, such as eyes or opercula. Therefore, linkage between the output of the Sensor Fish and injuries to live fish requires concurrent observations of injury to live test fish or some other means to interpret accelerometer output within the context of fish injury.
For retrieval after passage during field studies, the Sensor Fish is equipped with a micro-radio transmitter (Advanced Telemetry Systems, Isanti, Minn, USA) and HI-Z balloon tags (Normandeau Associates Inc. Bedford, N.H., USA) identical to those used for live test fish [
15]. The balloon tags contain a capsule filled with a chemical that produces gas when activated with water. Initiation of gas production is inhibited until the capsule material surrounding the gas-producing chemical dissolves, a process that takes approximately 3 minutes. The balloons inflate sufficiently within a few minutes of release to bring the Sensor Fish to the surface for recovery, while a typical passage through a turbine or spillway lasts less than 1 minute. Location of the Sensor Fish in the tailrace is aided by a directional radio receiver antenna to locate the micro-radio transmitter attached to the Sensor Fish. In addition to the measurements sensors, the Sensor Fish electronics consist of rechargeable batteries, a power supply, an analog-to-digital converter, memory, and communication components. The digital samples acquired during passage are stored in a nonvolatile memory. The memory is accessed after the Sensor Fish is recovered, and the acquired data are downloaded via wireless infrared link to a computer for processing and analysis.
4.2. Data Analysis
Sensor Fish datasets consist of time histories of pressure, acceleration (x, y, and z axes), angular motion (pitch, roll, and yaw), temperature, time, and battery status. The time histories extend from the time of release through the period of data acquisition programmed prior to release of the Sensor Fish. Pressure samples are used to estimate the depth of the Sensor Fish (when hydrostatic pressure conditions can be assumed) and other hydraulic phenomena, while accelerometer and rate gyro output is used to measure the Sensor Fish response to turbulence, strike, and scraping.
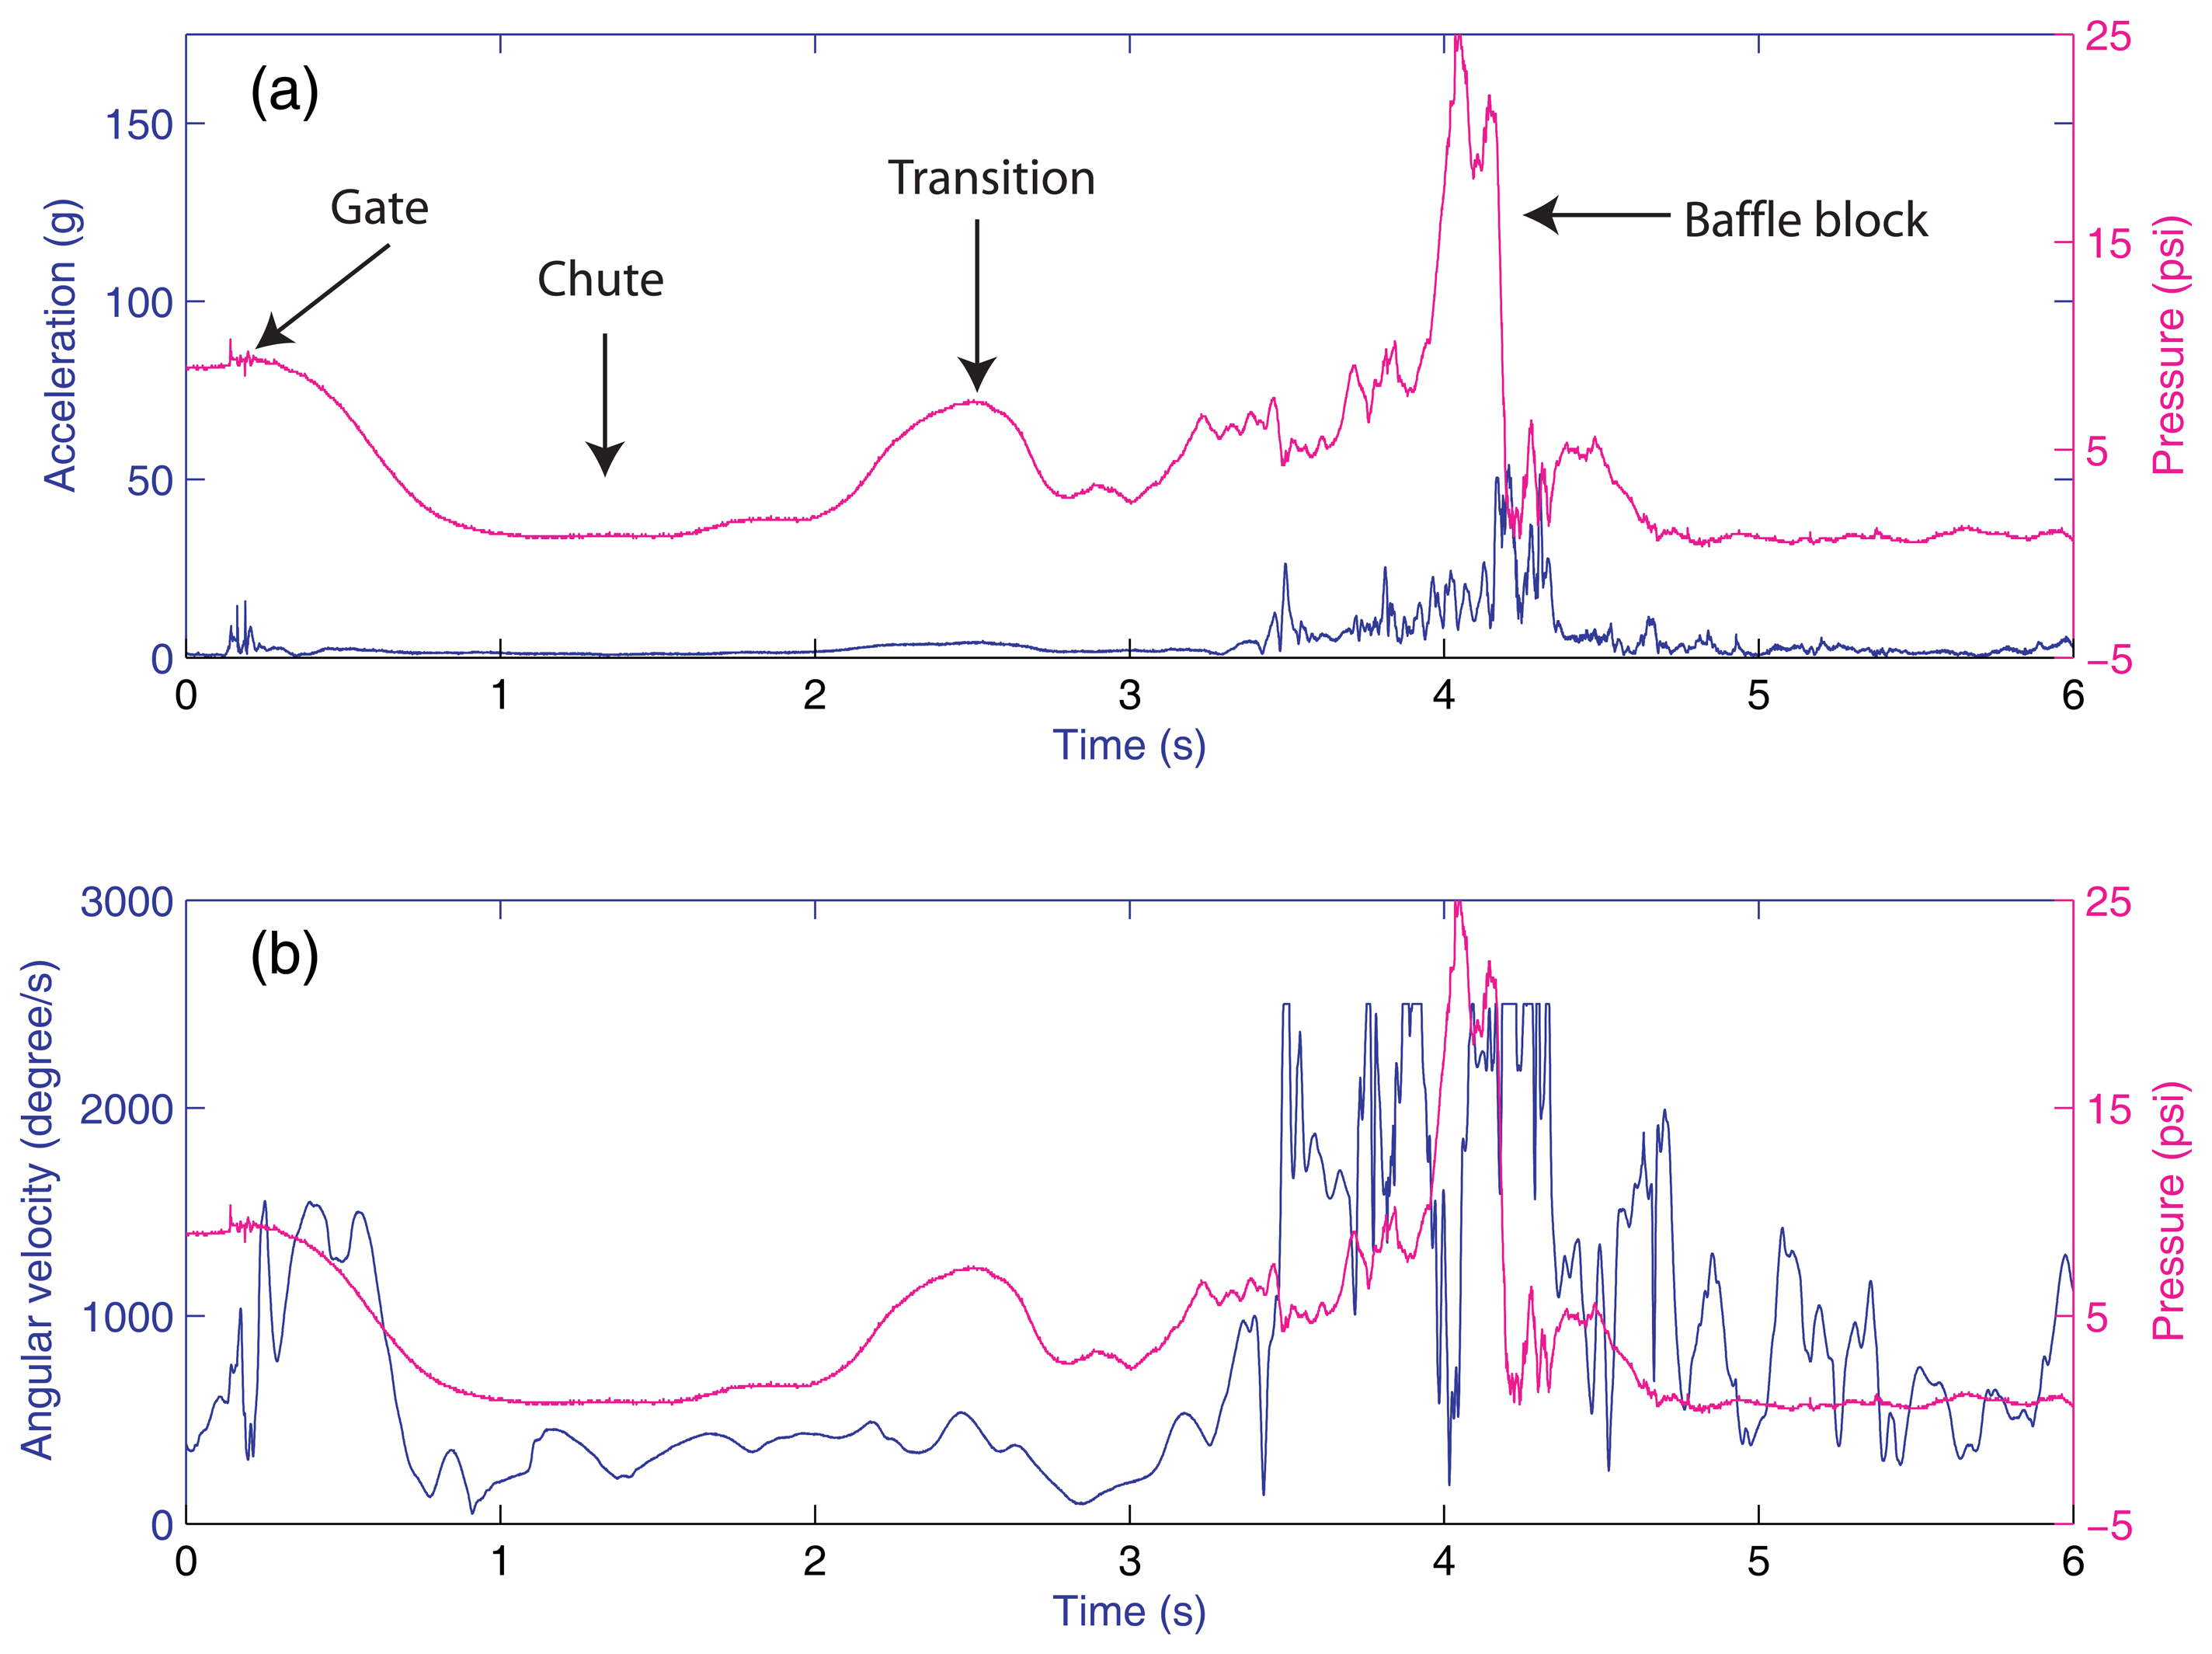
Sensor Fish pressure measurements are analyzed also to identify characteristic signatures to divide into segments corresponding to particular locations (zones) that extend from Sensor Fish injection to the end of the particular passage. For a typical Sensor Fish released in the middle of a spillbay, readily identifiable are the time of passage from the injection pipe exit into the forebay, passage under the tainter gate, time in the spillway chute, transition to the tailrace, and passage in the tailrace (
Figure 9). These distinctive signature events are used to estimate the probable location and time of collision or shear exposure events and timing information for integration with Computational Fluid Dynamics (CFD) simulation results. In this study, we found that there was an increase of acceleration and angular velocity when the Sensor Fish passed under the tainter gate. The passage was smooth with very small acceleration and angular velocity in the spillbay chute until it entered the tailwater and was close to the baffle blocks. In the tailrace immediately after the spillway, both the acceleration and angular velocity increased significantly because of the turbulent nature in this flow region.
For a turbine passage, these distinctive features include the time of passage from the injection pipe exit into the turbine intake, through the stay vane-wicket gate cascade, through the runner and runner wake, and through the draft tube.
Figure 10 shows a typical example of Sensor Fish measurements obtained while passing through a turbine. In the intake region, the Sensor Fish was traveling with very low rotational velocity and sustained no additional acceleration. In the turbine runner region, pressure plunged from 60 psi to 12 psi in half a second, and the Sensor Fish experienced a sudden increase of acceleration. In addition, due to the complex flow features in this region, the Sensor Fish was forced to tumble or spin well into the first part of the draft tube region.
When Sensor Fish are in contact with solid structures or impacted by turbulent shear, high-amplitude impulses occur in the acceleration and rotational velocity time histories. If the acceleration reaches a certain threshold, the exposure is counted as a significant exposure event.
The identification of an event as collision or shear is based on the different characteristics of acceleration and rotational velocities during the significant exposure event. Observations of Sensor Fish response in a laboratory flume show that a collision event creates a much narrower peak in acceleration and rotational velocity than does a shear event. In this study, peak duration is defined as the duration of acceleration within 70% of the peak value, and collision and shear events are distinguished by the following criteria: 1) the significant event is a collision event when peak duration is less than 0.0075 second (
Figure 11(a)); 2) the significant event is a shear event when peak duration is longer than 0.0075 second (
Figure 11(b)). Pressure and rotational measurements are then used for validation of the classification (
Figure 11(c) and (d)).
4.3. Application for high flow spillway passage at The Dalles Dam
The Dalles Dam is located at river kilometer 306 on the mainstem Columbia River. The dam consists of a navigation lock, a 22-unit powerhouse, a 23-bay spillway, and fish passage facilities. Each spillway bay is 15.2 m wide and controlled with a tainter gate, under which water plunges approximately 20 m into the stilling basin. Despite several years of spillway research, the survival rate of juvenile salmonids that pass through the spillway at The Dalles Dam is still lower than the survival rates at other mainstem Columbia River dams. In 2006, a study conducted by Normandeau Associates [
16] released 362 and 360 live test fish at Bay 4 and Bay 6, respectively. They concluded that fish released from Bay 4 sustained higher injury rates than fish from Bay 6 and the survival rate at Bay 6 was higher than that at Bay 4.
In a concurrent study performed by Pacific Northwest National Laboratory, 25 and 31 Sensor Fish releases were conducted under the same conditions at Bay 4 and Bay 6, respectively. It usually took only a few seconds for a Sensor Fish to travel from the entry point to the baffle block in the stilling basin (
Figure 9). An acceleration threshold of 95 g was selected as the definition of severe events from previous laboratory investigations [
7]. During passage from the entry point to the baffle blocks, 40% of Sensor Fish released into Bay 4 experienced at least one severe event, while only 16% in Bay 6 had at least one severe event. Therefore, Sensor Fish released from Bay 6 had smoother passage than those released from Bay 4, which is consistent with the findings of the live fish study.
5. Conclusion
The 6DOF Sensor Fish is an autonomous device developed to better understand the physical conditions fish experience during passage through hydroturbines and other dam passage alternatives. It provides in situ measurements of 3-dimensional accelerations, 3-dimensional rotational velocities, pressure, and temperature at a sample frequency of 2000 Hz. The relative errors of both the linear acceleration and angular velocity measurements were determined to be less than 5% by comparing the sensor measurements with the results of motion analysis and test fixture readings. The accuracy of the pressure measurement was determined to be within ±0.2 psi from laboratory acceptance tests. Acceleration and rotation velocity increase drastically when Sensor Fish are in contact with solid structures or impacted by turbulent shear. An exposure is defined as a significant event when the acceleration reaches certain predefined thresholds. The identification of this significant event as a collision between Sensor Fish and solid structure or shear caused by turbulence is based on the different characteristic of acceleration and rotation velocities during the exposure event. Laboratory observations of Sensor Fish response show that a collision event creates a much narrower peak in acceleration and rotational velocity than does a shear event. Just as information gathered from crash test dummies can affect automobile design with the installation of protective designs to lessen or prevent human injury, having Sensor Fish data to quantify accelerations, rotations, and pressure changes helps identify fish injury mechanisms such as strike, turbulent shear, pressure, and inertial effects. The device also provides information on non-lethal exposures such as stunning or signs of vestibular disruption that increase fish risk of predation by birds and piscivorous fish following passage.


