Article

Classification of Mixtures of Odorants from Livestock Buildings by a Sensor Array (an Electronic Tongue)

by
Nawaf Abu-Khalaf
and
Jens Jørgen Lønsmann Iversen
*
Department of Biochemistry and Molecular Biology, University of Southern Denmark, Campusvej 55, DK-5230 Odense M, Denmark
*
Author to whom correspondence should be addressed.
Sensors 2007, 7(1), 129-143; https://doi.org/10.3390/s7010129
Submission received: 10 October 2006 / Accepted: 26 January 2007 / Published: 29 January 2007

Abstract

:
An electronic tongue comprising different numbers of electrodes was able to classify test mixtures of key odorants characteristic of bioscrubbers of livestock buildings (n-butyrate, iso-valerate, phenolate, p-cresolate, skatole and ammonium). The classification of model solutions indicates that the electronic tongue has a promising potential as an online sensor for characterization of odorants in livestock buildings. Back propagation artificial neural network was used for classification. The average classification rate was above 80% in all cases. A limited, but sufficient number of electrodes were selected by average classification rate and relative entropy. The sufficient number of electrodes decreased standard deviation and relative standard deviation compared to the full electrode array.

1. Introduction

The odour emission from livestock buildings in intensive farming is causing many environmental and health problems [1]. Biological methods, which are environmentally friendly, are the preferred techniques for reducing emission of odours from livestock buildings. The bioscrubber is one of the biological methods and comprises an absorption column, in which the polluted air stream from the livestock building is washed by water droplets, and a bioreactor, which cleans and recycles the washing water coming from the absorption column [2].
Characterization of odorants, in absorption column or in bioreactor, is necessary in the optimization of the bioscrubber. It was recently observed that an electronic tongue (ET) has a high potential as an on-line sensor for odorants [3]. ET is an analytical instrument containing an array of electrodes, with partial specificity for different components in liquids in addition to an appropriate pattern recognition or multivariate calibration tool for identification and quantification of even complex liquid mixtures [4,5]. Recently, ET was used to classify different types of wine and water [6] and four molds and one yeast [7].
Electronic noses (ENs) and ETs are based on the same concept. However, ENs are used for gas analysis and ETs are used for liquid analysis [8]. In bioscrubbers, odorants are absorbed by water droplets and then sent to bioreactors for removal. Due to this concept, ET was used for characterization of solutions containing odorants [3].
The pH is an important control variable in the bioscrubber for two reasons. pH affects the transfer of odorants from the gas to the liquid phase in the absorption column, and it also affects the microbes in the bioreactor. The optimum pH in the bioreactor is in the range of 4 to 8 [9]. However, most microbial growth occurs near neutral pH [10].
The objective of this communication is to use an ET to classify different test mixtures of key odorants (i.e. model solutions). Our investigation further supports the idea of using ET for other applications, i.e. to replace taste panels for characterization of hazardous solutions (e.g. pharmaceutical applications) [11]. In a previous communication [3] we described the calibration of ET.
In livestock buildings, there are huge numbers of odorants [12]. A representative selection of these odorants, called key odorants, was used in this study. The key odorants were selected to represent a variety of chemical groups and were n-butyrate (n-butanoate), iso-valerate, phenolate, p-cresolate, skatole and ammonium. ET was used to classify four test mixtures of key odorants, i.e. two test mixtures of key odorants at two different acidities (i.e. pH 6 and 8). Moreover, ET was used to classify six different test mixtures of key odorants that were prepared to give the maximum representation of a variety of chemical groups at pH 6.

2. Experimental

2.1. Sensor array, i.e. the electronic tongue (ET)

A custom made prototype ET was purchased from Analytical Systems, Ltd., St. Petersburg – Russia. It consists of 14 potentiometric electrodes. Eleven polymer (PVC) plasticized membrane electrodes (no. 1-11), two chalcogenide glass electrodes (no. 12-13) and one wire electrode (no. 14). The electrodes were numbered in order to identify the individual electrodes that were sufficient for the classification. A pH glass electrode and a conventional Ag/AgCl reference electrode were included in the ET. Potentiometric measurements were performed using a high-input impedance multichannel voltmeter connected to a PC for data acquisition.

2.2. Test mixtures of key odorants

The concentrations of odorants in air samples from livestock buildings were investigated by many researchers. O'Neil and Philips [13] and Schiffman et al. [12] reviewed concentration intervals which are used as the main reference for the minimum and maximum concentrations of these odorants. Odorants are transferred to the liquid phase in the bioscrubber. The equivalent equilibrium concentrations of key odorants in water were calculated by using the dimensionless air-water partition coefficient (KAW) [14]. Stock solutions of different concentrations were prepared separately for each key odorant in the test mixtures. More details can be found in Abu-Khalaf and Iversen [3].

2.3. Experimental design

Five groups of experiments were carried out separately. Data from the first four groups of experiments were also used for calibration of the ET [3]. The first test mixture of key odorants contained: n-butyrate, iso-valerate, phenolate, skatole and ammonium. In the second test mixture, ammonium was replaced with p-cresolate. Ammonium and p-cresol were chosen because of their importance as part of the odour problems in livestock buildings [15,16]. At pH 6, deionised water was solvent. At pH 8, a buffer of KH2PO4 (3.7 × 10⁻³ M) and Na2HPO4 (78 × 10-3 M) was solvent. Each group of experiments comprised 50 measurements in triplicates (i.e. three different measurement cycles for each mixture). The intervals of concentrations of each odorant were subdivided into seven intervals, to get as many combinations as possible in the test mixtures. The total number of measurements was 600. Details of test mixtures are shown in Table 1.
In the fifth experiment, test mixtures of key odorants were prepared to give maximum representation of a variety chemical groups, i.e. volatile fatty acids (VFAs) mixed with phenols, VFAs mixed with skatole, VFAs mixed with ammonium, etc. The test mixtures were diluted in deionised water after which the acidity was adjusted to pH 6 with NaOH or HCl. After this adjustment, the pH remained constant throughout the experiment. Each combination of the test mixtures was subjected to 15 measurements in triplicates, a total of 270 measurements (Table 2). The interval of concentrations was divided into five subsets, which were chosen from the seven intervals used in the previous four experiments.
In each group of experiments the test mixtures were measured in random order. Microsoft office Excel 2000 (Microsoft Corporation, USA) software was used to randomize the concentrations levels (seven levels in the first four groups of experiments and five levels in the fifth) in each group of experiments, using a randomization and uniform distribution function [3].
The ET was submerged in the test mixture of key odorants in a 100 ml Teflon container with a magnetic stirrer. Five minutes were sufficient for electrodes to reach stable potential in all cases. Electrodes were washed with deionised water several times between measurements, until they reached a steady potential. It was suggested that washing of electrodes is one of the solutions to avoid drift problems of electrodes in ET [17].

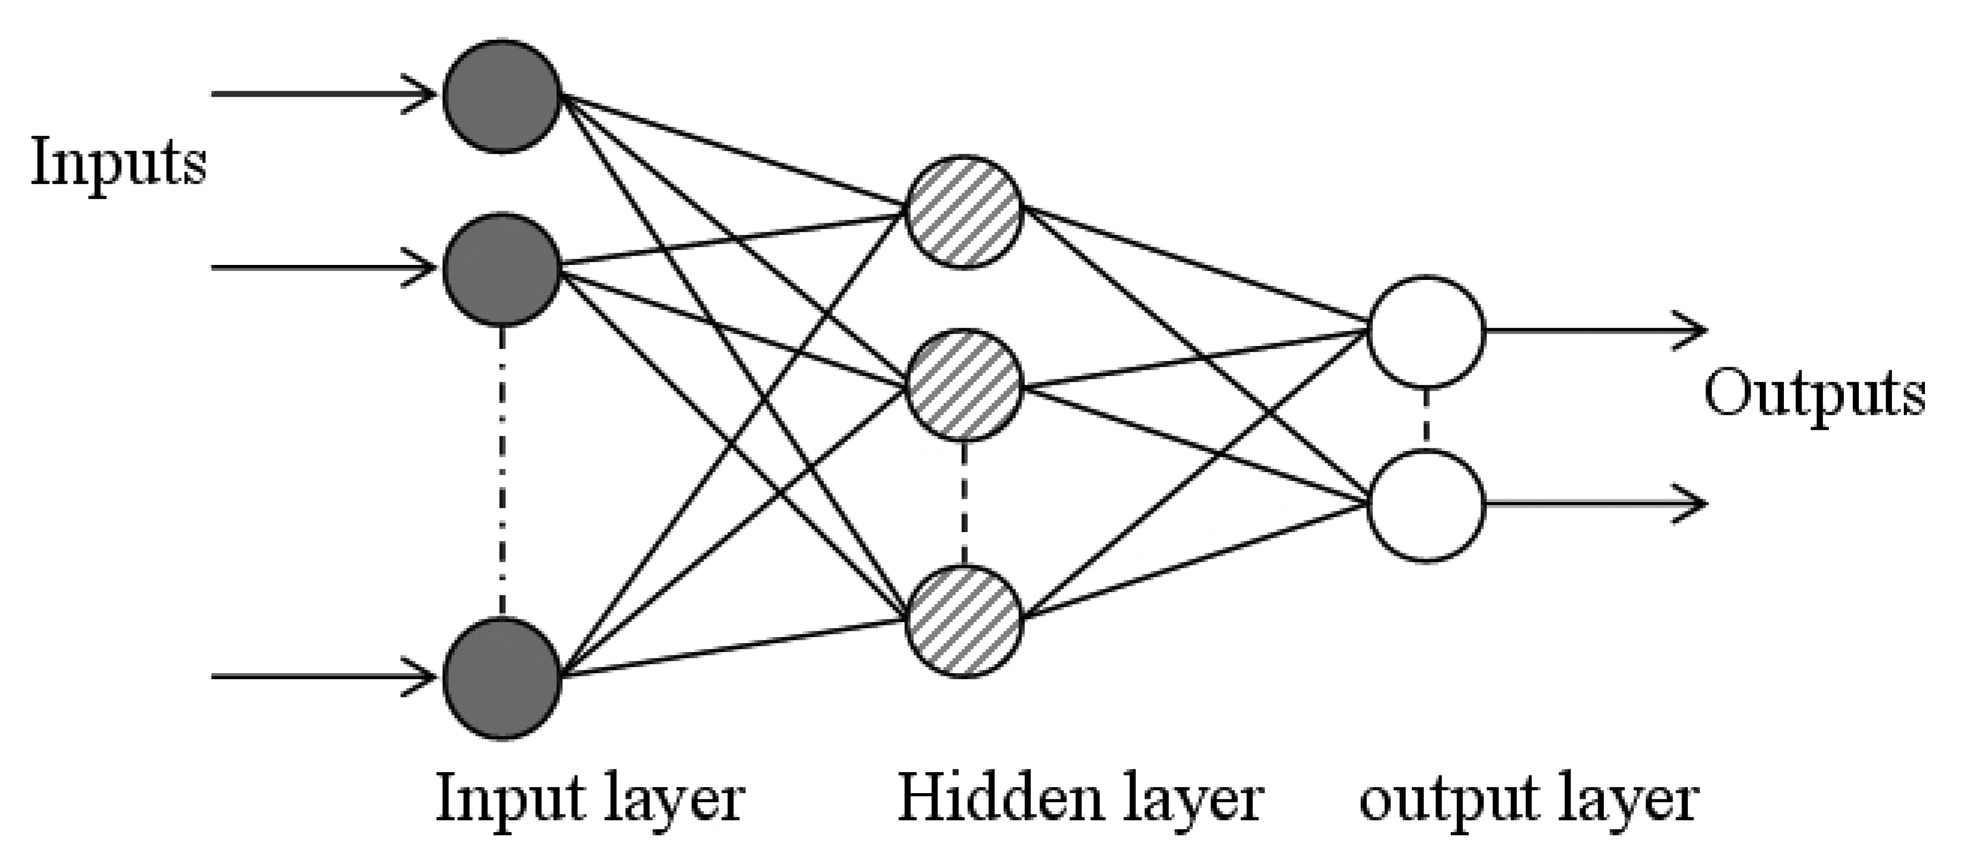
2.4. Back propagation artificial neural networks

One of the most widely used artificial neural networks is back propagation artificial neural network (BPNN), which is also called feed forward network. It comprises many processing elements, i.e. nodes, which are arranged in layers: an input layer, an output layer, and one or more layers in between, called hidden layers. A schematic diagram of BPNN with one hidden layer is shown in Fig. 1.
A neural network software ‘Predict’ (v. 3.13, NeuralWare, Pittsburgh, USA), which uses BPNN and works in the framework of Microsoft Excel, was used in this study. The models in the program contain one hidden layer with different numbers of nodes, which results in a stable model [18]. Models have direct connections between input and output nodes. This enables the program to evaluate the need for a hidden layer. Moreover, models employ an adaptive gradient learning rule. A weight decay method is employed to reduce overfitting. In classification problems, the software employs hyperbolic tangent and softmax transfer functions in hidden and output layers, respectively. The use of the default parameters of ‘Predict’ software is recommended [19]. The default parameters and mathematical explanation of the functions are beyond the scope of this communication but they are described elsewhere [20].
In the present study, classification (supervised networks) of test mixtures of key odorants was carried out. The input (independent variable) was the electrode signals, and the correlated output (dependent variable) was the class of test mixture.
The classification rate for each test mixture of key odorants and the average classification rate (ACR) were found. The average classification rate is the average of classification rates of all classes. The values of the classification rate and the ACR are shown directly in the software, and there is no need for any calculations.
In each case of classification, the data were divided into train, test and validation sets. There is little agreement among researchers about the number of samples in training set for BPNN analysis. Basheer and Hajmeer [21] concluded that there are no mathematical rules for solving this problem. However, Daspagne and Massart [18] suggested that the number of samples in the training set should be at least twice the total number of weights in the BPNN topography. The latter recommendation was followed in this study.
Each measurement in triplicates was treated as one sample. This triplicate was used either in train, in test or in validation set. Data were centred and scaled before classification, so each variable contributes equally in the analysis [22].
A higher ACR and a lower relative entropy are the most important factors for classification problems using ‘Predict’ software [23]. The relative entropy is an internal measurement in the ‘Predict’ classification model. It measures the shared information between probability distributions. The higher this value is, the more similar the probability distributions are.
All electrodes were examined for their individual contribution to classification of test mixtures of key odorants. The goal was to achieve the highest ACR and the lowest relative entropy with the minimum number of electrodes for further classification processes. Initially all electrodes (i.e. 14 electrodes) were investigated for classification, and ACR and relative entropy were determined. By analysing the outputs of many combinations of a decreased number of electrodes, and after at least 20 trials, it was observed that eight electrodes were sufficient for classifying all test mixtures of key odorants without influencing negatively ACR and relative entropy. The total number of electrodes in the ET was reduced without any loss of analytical information. This was done before in many applications of ET, e.g. Auger et al. [24] and Soderstrom et al. [7].

3. Results and discussion

3.1. Classification of test mixtures of key odorants at pH 6

The data of each test mixture of key odorants were split into train, test and validation sets. The number of different samples was 30, 10 and 10 (i.e. 90, 30 and 30 including triplicates), respectively for each test mixture of key odorants. The BPNN used 8, 4, 2 (i.e. 8 neurons in input layer, 4 neurons in hidden layer and 2 neurons in output layer). The eight neurons in input layer represented the number of electrodes, and the two neurons in the output layer represented the two classes of the test mixtures. Electrodes no. 1, 2, 5, 6, 7, 8, 9, 11 were sufficient. The classification rate for the validation set of the test mixtures of key odorants containing ammonium and test mixtures of key odorants containing p-cresolate was 80% and 97%, respectively. The ACR was 88%.

3.2. Classification of test mixtures of key odorants at pH 8

The data of each test mixture of key odorants were split into train, test and validation sets. The number of different samples was 30, 10 and 10 (i.e. 90, 30 and 30 including triplicates), respectively for each test mixture of key odorants. The BPNN used 8, 0, 2 Electrodes no. 1, 2, 5, 6, 7, 8, 9, 11 were sufficient. The classification rate for the validation set of both test mixtures was 100%, and consequently the ACR was 100%.

3.3. Classification of test mixtures of key odorants containing ammonium at pH 6 and pH 8

The data were split into train, test and validation sets as in the previous experiment. The BPNN used 8, 0, 2 nodes. Electrodes no. 1, 2, 5, 6, 7, 8, 9, 11 were sufficient. The classification rate for the validation set of both test mixtures was 100%, and consequently the ACR was 100%.

3.4. Classification of test mixtures of key odorants containing p-cresol at pH 6 and pH 8

The data were split into train, test and validation sets as in the previous experiment. The BPNN used 8, 0, 2 nodes. Electrodes no. 1, 2, 5, 6, 7, 8, 9, 11 were sufficient. The classification rate for the validation set of both test mixtures was 100%, and consequently the ACR was 100%.
Table 3 shows the classification rates and ACR for the validation sets of the different test mixtures of key odorants. ET signals respond mainly to ions in the test mixtures [7]. The percentage of ionised n-butyric acid, iso-valeric acid, phenol, p-cresol, skatole and ammonium at pH 6 is: 94%, 94%, 0.01%, 0.005%, 0% and 100%, respectively. The percentage of ionised n-butyric acid, iso-valeric acid, phenol, p-cresol, skatole and ammonium at pH 8 is: 100%, 100%, 1%, 0.5%, 0% and 95%, respectively. The results in Table 3 indicate that ET has a promising potential as a sensor for odorants. ET signals contained the fingerprints for each test mixtures of key odorants, which explains the successful classification.

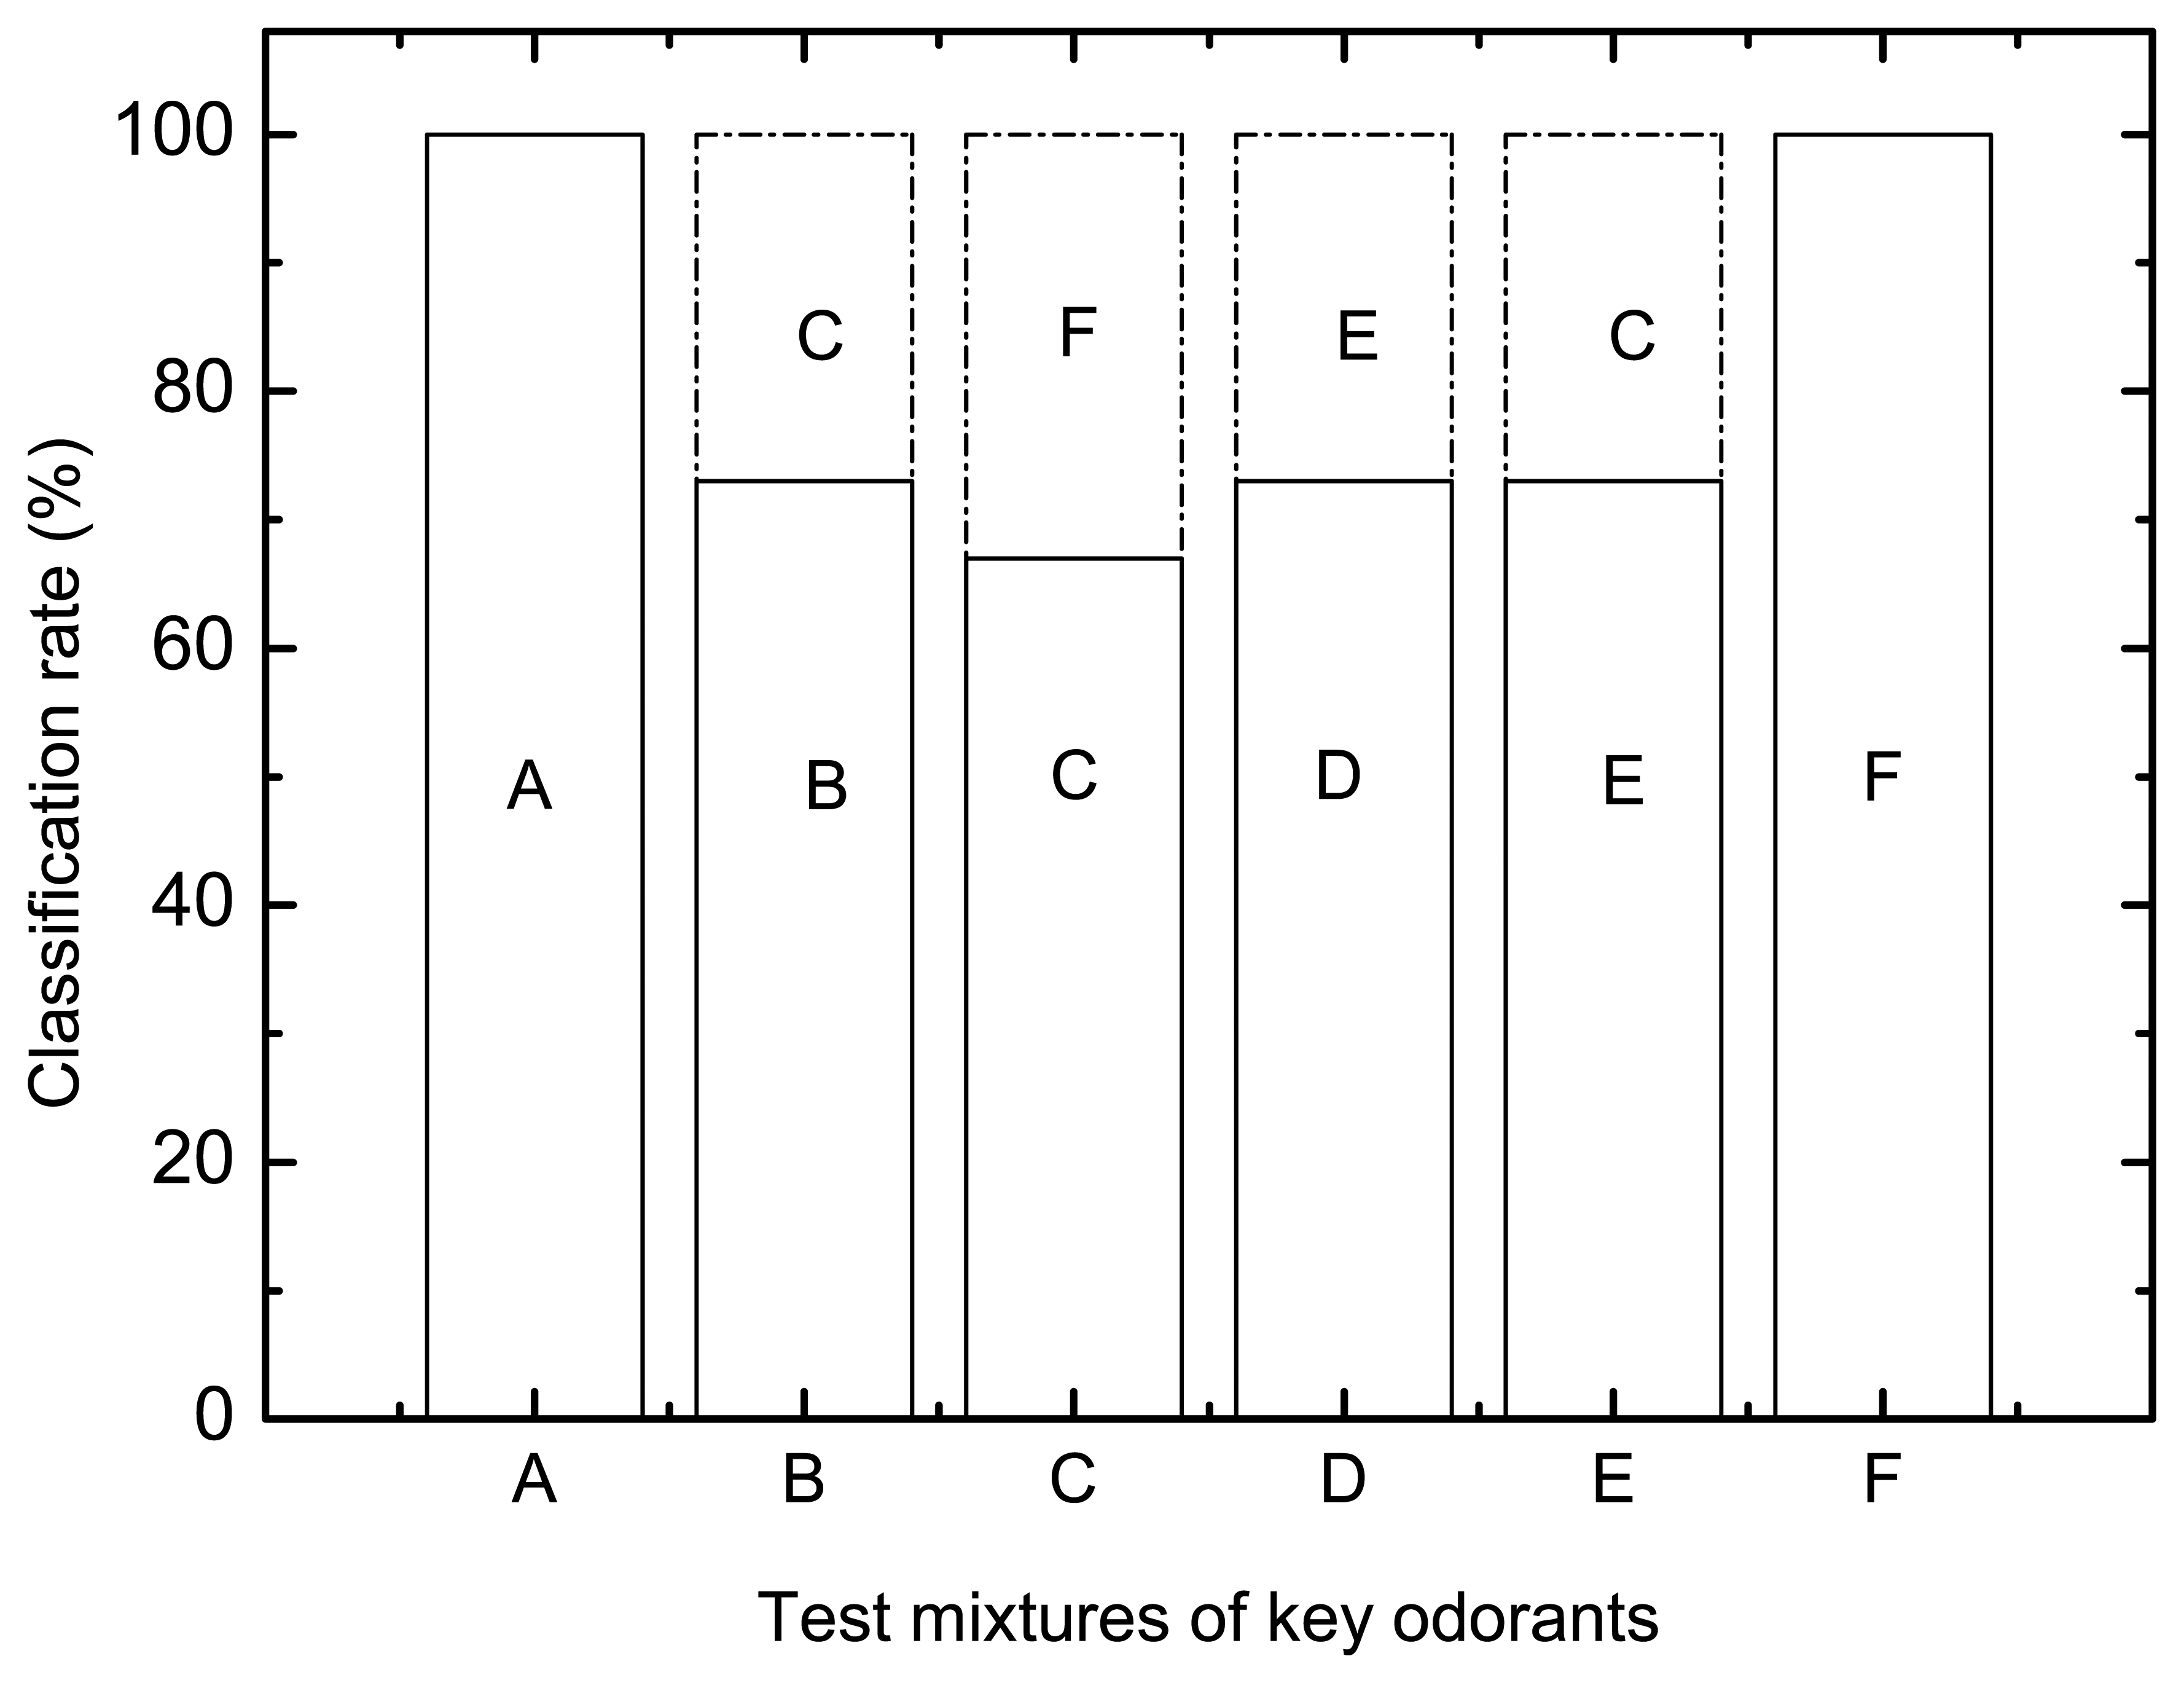
3.5. Classification of test mixtures of key odorants comprising maximum number of combinations of a variety of chemical groups at pH 6

Standard deviation of triplicate measurements in the test mixtures of key odorants shown in Table 2 was between 0 - 3.3 mV and 0.1 - 3.0 mV when electrodes no. 1 - 14 and no. 1, 2, 5, 6, 7, 8, 9, 11 were used, respectively. The RSD was between 0 - 2.3% and 0 - 1.2% when electrodes no. 1 - 14 and no. 1, 2, 5, 6, 7, 8, 9, 11 were used, respectively.
The total number of samples (comprising triplicates) was 90, which is equivalent to 270 measurements, i.e. 6 test mixtures × 15 samples × 3 (triplicates). The data were split into train, test and validation sets. The number of different samples was 42, 18 and 30 (i.e. 126, 54 and 90 including triplicates), respectively. Train, test and validation samples within each class of test mixtures of key odorants were considered. The number of different samples was 7, 3 and 5 (i.e. 21, 9 and 15 including triplicates), respectively. BPNN used 8, 4, 6 nodes. Electrodes no. 1, 2, 5, 6, 7, 8, 9, 11 were sufficient. The classification rates are shown in Fig. 2. Two test mixtures of key odorants having classification rate of 100%, contained VFAs and phenols, or phenols and ammonium, i.e. A and F, respectively. The test mixtures of key odorants that contained VFAs and ammonium, i.e. C, had the lowest classification rate (67%). The ACR for all test mixtures of key odorants was 81%. Most of the test mixtures of key odorants were misclassified as test mixtures C. However the objective of BPNN classification was to get the highest classification rate with lowest entropy. In the case of misclassifications, the test mixtures of key odorants were misclassified to only one different test mixture of key odorants, e.g. C was misclassified as F, and D was misclassified as E. This indicates that the classification model enables us to predict the class of the test mixtures of key odorants with an acceptable inaccuracy, e.g. C is only classified as C or F, and D is only classified as D or E.
When we tested numbers of electrodes that were less than the sufficient 8 electrodes used for classification, ACR decreased in comparison with the full array (14 electrodes), e.g. when electrodes no. 2, 5, 6, 7, 8, 9 were used, the ACR decreased from 81% to 70%.
If pH changed when the test mixtures of key odorants were diluted in deionised water, adjustment of pH to 6 was carried out with NaOH or HCl. After adjustment, pH stayed constant throughout the measurement period. This is expected, since the VFAs in the test mixtures have buffer capacity.
BPNN classification models were superior to linear classification methods, e.g. partial least square – discriminant analysis (PLS-DA) [11]. This was explained by the non-linear response of electrodes [25], which results from interferences between ions in the test mixtures [26]. However, PLS-DA showed a complete agreement with BPNN in some cases. PLS-DA was carried out for classification of the last three test mixtures of key odorants shown in Table 3. In these cases, the two test mixtures were easily separated in the PLS score plots, as shown in Fig. 3, 4 and Fig. 5. Electrodes no. 1, 2, 5, 6, 7, 8, 9, 11 were sufficient.
Eight electrodes were sufficient for classification of all test mixtures of key odorants. Models using these eight electrodes resulted in the highest ACR and lowest entropy in comparison to any other number of electrodes. Also, standard deviation and RSD of triplicate measurements, i.e. repeatability, improved when the number of electrodes was decreased (Table 4).
It is noticed that the standard deviation of triplicate measurements in the mixture of key odorants in phosphate buffer at pH 8 was lower than the standard deviation of triplicate measurements in deionised water at pH 6, i.e. repeatability is higher. This is because the buffered mixture contains higher and stabilized concentrations of ions. Moreover, the standard deviation in the case of test mixtures of key odorants comprising maximum number of combinations of a variety of chemical groups at pH 6 is lower than the other two experiments that were carried out in deionised water (the two test mixtures of odorants containing ammonium or p-cresolate at pH 6 in Table 1). This is because the complexity of the test mixtures, i.e. the number of key odorants, was reduced in the test mixtures of key odorants in this experiment (Table 2).
Comparing the standard deviation and RSD of the sufficient number of electrodes used for calibration [3] and classification (this communication), it is obvious that the sufficient number of electrodes in the ET improved the repeatability in comparison with the ET comprising 14 electrodes (Table 4).
Nine electrodes in total (no. 1, 2, 4, 5, 6, 7, 8, 9, 11) were sufficient for identification, quantification [3] and classification of all test mixtures of key odorants (this communication).

4. Conclusion

A calibrated ET, comprising 8 PVC plasticized cross-sensitive potentiometric electrodes, has successfully classified different test mixtures of key odorants. The ET was able to distinguish between two test mixtures of key odorants at the same pH with classification rates in the range of 88 - 100%. Classification between the same test mixtures of key odorants at different pH was even higher, 100%. Also, ET classified different test mixtures of key odorants comprising a variety of the chemical groups at pH 6. As expected the repeatability of electrodes was better in this case, where the complexity of the mixture was decreased.
The results presented in this study are promising for any further application of ET in livestock buildings. The ability of ET to classify different test mixtures of key odorants with a high performance, makes ET an obvious candidate as an on-line sensor for characterization of odorants in livestock buildings.

Acknowledgments

We acknowledge the Danish Research Agency and the Danish Ministry of Food, Agriculture and Fisheries for their financial support under the research programme ‘Sustainable Technology in Agriculture’. We acknowledge Erling Lund Knudsen for his help in the laboratory. We also acknowledge Dmitry Kirsanov for his help.

References

  1. Schiffman, S. S.; Miller, E. A. S.; Suggs, M. S.; Graham, B. G. The effect of environmental odors emanating from commercial swine operations on the mood of nearby residents. Brain Res. Bull. 1995, 37, 369–375. [Google Scholar]
  2. Revah, S.; Morgan-Sagastume, J. M. Biotechnology for odor and air pollution; Shareefdeen, Z., Singh, A., Eds.; Springer: New York, 2005; Vol. 1, Chapter 3; p. 29. [Google Scholar]
  3. Abu-Khalaf, N.; Iversen, J. J. L. Calibration of a sensor array (an electronic tongue) for identification and quantification of odorants from livestock buildings. Sensors 2007, 7, 103–128. [Google Scholar]
  4. Vlasov, Y.; Legin, A.; Rudnitskaya, A. Electronic tongues and their analytical application -review. Anal. Bioanal. Chem. 2002, 373, 136–146. [Google Scholar]
  5. Legin, A.; Rudnitskaya, A.; Vlasov, Y.; Di Natale, C.; Davide, F.; D' Amico, A. Tasting of beverages using an electronic tongue. Sens. Actuator B-Chem. 1997, 44, 291–296. [Google Scholar]
  6. Legin, A.; Rudnitskaya, A.; Vlasov, Y.; Di Natale, C.; Mazzone, E.; D' Amico, A. Application of electronic tongue for quantitative analysis of mineral water and wine. Electroanalysis 1999, 11, 814–820. [Google Scholar]
  7. Soderstrom, C.; Rudnitskaya, A.; Legin, A.; Krantz-Rulcker, C. Differentiation of four Aspergillus species and one Zygosaccharomyces with two electronic tongues based on different measurement techniques. J. Biotechnol. 2005, 119, 300–308. [Google Scholar]
  8. Winquist, F.; Krantz-Rulcker, C.; Lundstrom, I. Electronic tongues. MRS Bull. 2004, 29, 726–731. [Google Scholar]
  9. Singh, A.; Ward, O. Biotechnology for odor and air pollution; Shareefdeen, Z., Singh, A., Eds.; Springer: New York, 2005; Vol. 1, Chapter 5; p. 101. [Google Scholar]
  10. McNevin, D.; Barford, J. Biofiltration as an odour abatement strategy. Biochem. Eng. J. 2000, 5, 231–242. [Google Scholar]
  11. Legin, A.; Rudnitskaya, A.; Clapham, D.; Seleznev, B.; Lord, K.; Vlasov, Y. Electronic tongue for pharmaceutical analytics: quantification of tastes and masking effects. Anal. Bioanal. Chem. 2004, 380, 36–45. [Google Scholar]
  12. Schiffman, S. S.; Bennett, J. L.; Raymer, J. H. Quantification of odors and odorants from swine operations in North Carolina. Agr. Forest Meteorol. 2001, 108, 123–240. [Google Scholar]
  13. O'Neil, D. H.; Philips, V. R. A review of the control of odor nuisance from livestock buildings: part 3, properties of the odorous substances which have been identified in livestock wastes or in the air around. J. Agr. Eng. Res. 1992, 53, 23–50. [Google Scholar]
  14. Datta, I.; Allen, G. Biotechnology for odor and air pollution; Shareefdeen, Z., Singh, A., Eds.; Springer: New York, 2005; Vol. 1, Chapter 6; p. 126. [Google Scholar]
  15. Arogo, J.; Westerman, P. W.; Heber, A. J. A review of ammonia emissions from confined swine feeding operations. Trans. ASAE 2003, 46, 805–817. [Google Scholar]
  16. Le, P. D.; Aarnink, A. J. A.; Ogink, N. W. M.; Becker, P. M.; Verstegen, M. W. A. Odour from animal production facilities: its relationship to diet. Nutr. Res. Rev. 2005, 18, 3–30. [Google Scholar]
  17. Holmberg, M.; Eriksson, M.; Krantz-Rulcker, C.; Artursson, T.; Winquist, F.; Lloyd-Spetz, A.; Lundstrom, I. 2nd workshop of the second network on artificial olfactory sensing (NOSE II). Sens. Actuator B-Chem. 2004, 110, 213–223. [Google Scholar]
  18. Despagne, F.; Massart, D. L. Neural networks in multivariate calibration. Analyst 1998, 123, 157R–178R. [Google Scholar]
  19. Maier, H. R.; Dandy, G. C. Empirical comparison of various methods for training feed-forward neural networks for salinity forecasting. Water Resour. Res. 1999, 35, 2591–2596. [Google Scholar]
  20. NeuralWare. NeuralWorks Predict, The complete solution for neural data modeling, user guide; NeuralWare Inc.: Pittsburgh, 2003. [Google Scholar]
  21. Basheer, I. A.; Hajmeer, M. Artificial neural networks: fundamentals, computing, design, and application. J. Microbiol. Methods 2000, 43, 3–31. [Google Scholar]
  22. Wold, S.; Sjostrom, M.; Eriksson, L. PLS-regression: a basic tool of chemometrics. Chemom. Intell. Lab. Syst. 2001, 58, 109–130. [Google Scholar]
  23. Copper, J. The use of artificial neural networks for knowledge discovery in bioinformatics. TIBETS 2004, 1, 144–153. [Google Scholar]
  24. Auger, J.; Arnault, I.; Legin, A.; Rudnitskaya, A.; Seleznev, B.; Sparfel, G.; Dore, C. Comparison of gas chromatography-mass spectrometry and electronic tongue analysis for the classification of onions and shallots. Int. J. Environ. Anal. Chem. 2005, 85, 971–980. [Google Scholar]
  25. Vlasov, Y.; Legin, A.; Rudnitskaya, A.; Di Natale, C.; D'Amico, A. Nonspecific sensor arrays (“electronic tongue”) for chemical analysis of liquids (IUPAC Technical Report). Pure Appl. Chem. 2005, 77, 1965–1983. [Google Scholar]
  26. Legin, A.; Kirsanov, D.; Rudnitskaya, A.; Iversen, J. J. L.; Seleznev, B.; Esbensen, K. H.; Mortensen, J.; Houmoller, L. P.; Vlasov, Y. Multicomponent analysis of fermentation growth media using the electronic tongue (ET). Talanta 2004, 64, 766–772. [Google Scholar]
Figure 1. Schematic diagram of back propagation neural network architecture.
Sensors 07 00129f1
Figure 2. Classification rates for validation sets of different test mixtures of key odorants f comprising a variety of chemical groups at pH 6. Average classification rate (ACR) was 81%.
  • fA: VFAs + phenols
  • B: VFAs + skatole
  • C: VFAs + ammonium
  • D: phenols + skatole
  • E: skatole + ammonium
  • F: phenols + ammonium
Sensors 07 00129f2
Figure 3. PLS-1 score plot of all samples in test mixtures of key odorants containing ammonium (to right) and test mixtures of key odorants containing p-cresolate (to left) at pH 8. Full cross validation, PLS-DA was used and eight electrodes were sufficient.
Sensors 07 00129f3
Figure 4. PLS-1 score plot of all samples in test mixtures of key odorants containing ammonium at pH 6 (to right) and at pH 8 (to left). Full cross validation, PLS-DA was used and eight electrodes were sufficient.
Sensors 07 00129f4
Figure 5. PLS-1 score plot of all samples in test mixtures of key odorants containing p-cresolate at pH 6 (to right) and at pH 8 (to left). Full cross validation, PLS-DA was used and eight electrodes were sufficient.
Sensors 07 00129f5
Table 1. Test mixtures of key odorants in four groups of experiments.
Test mixtures of key odorantsOdorants present in test mixturepHInterval of concentrations (M)Number of key odorants in test mixturesNumber of measurements
Containing ammoniumn-butyrate610-7 - 10-35150 (50 in triplicates)
iso-valerate10-7 - 10-4
skatole10-8 - 10-6
phenolate10-7 - 10-5
ammonium10-7 - 10-3

Containing p-cresolaten-butyrate610-7 - 10-35150 (50 in triplicates)
iso-valerate10-7 - 10-4
skatole10-8 - 10-6
phenolate10-7 - 10-5
p-cresolate10-7- 10-5

Containing ammoniumsame as above8same as above5150 (50 in triplicates)

Containing p-cresolatesame as above8same as above5150 (50 in triplicates)
Table 2. Test mixtures of key odorants comprising a variety of chemical groups of selected key odorants at pH 6.
Arbitrary name of test mixtures of key odorantsGroups of key odorants in test mixturespHKey odorants in test mixturesInterval of concentrations (M)Numbers of key odorants in test mixturesNumber of measurements
AVFAs + phenols6n-butyric acid10-6 - 5 × 10-4445 (15 in triplicates)
iso-valeric acid5 × 10-7 - 5 × 10⁻⁵
phenol5 × 10-7 - 10-5
p-cresol5 × 10-7 - 10-5
BVFAs + skatole6n-butyric acid10-6 - 5 × 10-4345 (15 in triplicates)
iso-valeric acid5 × 10-7 - 5 ×10⁻⁵
skatole3 × 10-8 - 5 × 10⁻⁷
CVFAs + ammonium6n-butyric acid10-6 - 5 × 10-4345 (15 in triplicates)
iso-valeric acid5 × 10-7 - 5 × 10⁻⁵
ammonium10-6 - 5 × 10⁻⁴
Dphenols + skatole6phenol5 × 10-7 - 10-5345 (15 in triplicates)
p-cresol5 × 10-7 - 10-5
skatole3 × 10-8 - 5 × 10⁻⁷
Eskatole + ammonium6skatole3 × 10-8 - 5 × 10-7245 (15 in triplicates)
ammonium10-6 - 5 × 10⁻⁴
Fphenols + ammonium6phenol5 × 10-7 - 10-5345 (15 in triplicates)
p-cresol5 × 10-7 - 10-5
ammonium10-6- 5 × 10⁻⁴
Table 3. Classification rates and average classification rate (ACR) for validation sets of test mixtures of key odorants.
Test mixtures of key odorantsContaining ammoniumContaining p-cresolateContaining ammoniumContaining p-cresolate

pH6688

Containing ammonium680%20%
Containing p-cresolate63%97%
ACR88%

Containing ammonium8100%0%
Containing p-cresolate80%100%
ACR100%

Containing ammonium6100%0%
Containing ammonium80%100%
ACR100%

Containing p-cresolate6100%0%
Containing p-cresolate80%100%
ACR100%
Table 4. Standard deviation (StDev) and relative standard deviation (RSD) of triplicate measurements with different number of electrodes used for classification and calibration.
pHTest mixture of key odorantsElectrode no.StDevh (mV)RSDi (%)
6Containing ammonium1 - 140 - 110 - 4.8
1, 2, 5, 6, 7, 8, 9, 110 - 6.60 - 3.4
2, 5, 6, 7, 8, 90 - 5.60 - 3.4*

6Containing p-cresolate1 - 140 - 17.30 - 15.5
1, 2, 5, 6, 7, 8, 9, 110.1 - 6.80 - 3.5
1, 2, 4, 5, 80 - 6.80 - 3.5*

8Containing ammonium1 - 140 - 2.60 - 8.4
1, 2, 5, 6, 7, 8, 9, 110 - 1.60 - 0.7
1, 2, 4, 5, 7, 80 - 1.60 - 0.7*
1, 5, 7, 80 - 1.60 - 0.7*

8Containing p-cresolate1 - 140 - 2.1high j
1 - 11, 140 - 2.10 - 0.9
1, 2, 5, 6, 7, 8, 9, 110 - 1.60 - 0.4
2, 5, 6, 7, 8, 90 - 1.60 - 0.4*

6Test mixtures of key odorants comprising a variety of chemical groups at pH 61 - 140 - 3.30 - 2.3
1, 2, 5, 6, 7, 8, 9, 110.1 - 3.00 - 1.2
hStDev: Standard deviation of triplicate measurements
iRSD: Relative standard deviation of triplicate measurements
jPotential readings and standard deviation were very small, which results in high value of RSD
*Data from Abu-Khalaf and Iversen [3]

