Introduction
Gas chemical sensors respond to the presence of gases. Ideally, one would prefer to use selective sensors, with each sensor responding to the presence of a unique gas. In reality, gas chemical sensors respond to multiple gases. In this case, multiple sensors with different selectivities are necessary to identify the components of a gaseous mixture. When used simultaneously, such a collection of sensors is usual called a sensor array. If a sensor responds to more than one measurand, the response function is no longer uni-variate. If it is not completely known which measurands the sensor responds to and to what extent, it becomes very hard to relate the sensor output to the state of a certain measurand. The described situation is not unusual and the effect is uncertainties in the acquired data. The fact that a sensor is sensitive to more than one measurand is often a drawback, but with the help of mathematics it can sometimes be an advantageous feature. To use a sensor array to detect gases, the response of each sensor to the various gases present must be known. Then, the collective response of the array can be translated into quantitative information about the composition of a mixture of gases. Consequently, an incoming gas stimulates many of the sensors in the array, and produces a characteristic response pattern. These patterns are then further analyzed for the benefit of the specific application.
Many studies have utilized a pattern recognition approach to gas mixture identification. These approaches have been most successful when applied to a classification problem. Classification tasks, designed to determine the identity of gases, are by far the most popular form of analysis. Classification is usually achieved by one of the well established classical algorithms known from the field of pattern recognition such as the k-nearest-neighbours, the shortest Mahalanobis distance, the linear and quadratic discriminant analysis, and the multilayer perceptron [
1]. There are many applications of such algorithms, e.g. for quality evaluation of food products [
2,
3] and in the automobile industry [
4]. For example, Ionescu et al. have achieved a 85.5% success rate for correctly classifying tow gases CO, NO
2 and their mixtures [
5], using a radial basis function neural network. A host of other studies have been done using principle components analysis, including an extension to vapour mixture recognition by Park et al. [
6]. Jurs et al. have reviewed various computational methods used with sensor arrays [
7]. The object of the present study is to demonstrate the configuration and simulation of gas sensor arrays for different scenarios using modular software package. We investigate the ability of a sensor array with five semiconductor gas sensors to determine gas concentrations of CH
4, NH
3, H
2, CO and C
2H
5OH. The sensor signals are artificially produced and the sensors are described by suitable mathematical models. For quantitative analysis a signal evaluate algorithm referred to as matrix method is used to model gas sensor arrays from experimental data. With such an algorithm, one can use a gas sensor array to identify the composition of a mixture of gases. Furthermore, sensor response patterns were fed to principal component analysis (PCA) for qualitative analysis. For the configuration of the simulation software a gas sensor data base was designed.
IGM-software for the simulation of gas sensor arrays
The IGM-software (
Intelligent
Gas
Multi-Sensor System) was developed by the institutes for technical computer science and physics of the University of the German Federal Armed Forces Munich [
8]. The tasks of the IGM-software can be divided into four areas:
Interaction with the user. The input, output and the storage of the results rank among this task area.
Accomplishment of the measuring routines of the sensors and inquiry of sensor signals.
Processing of the sensor signals and computation of the gas concentrations including different evaluation concepts.
Plausibility check of the evaluation results using of knowledge about the measuring scenario and the sensors.
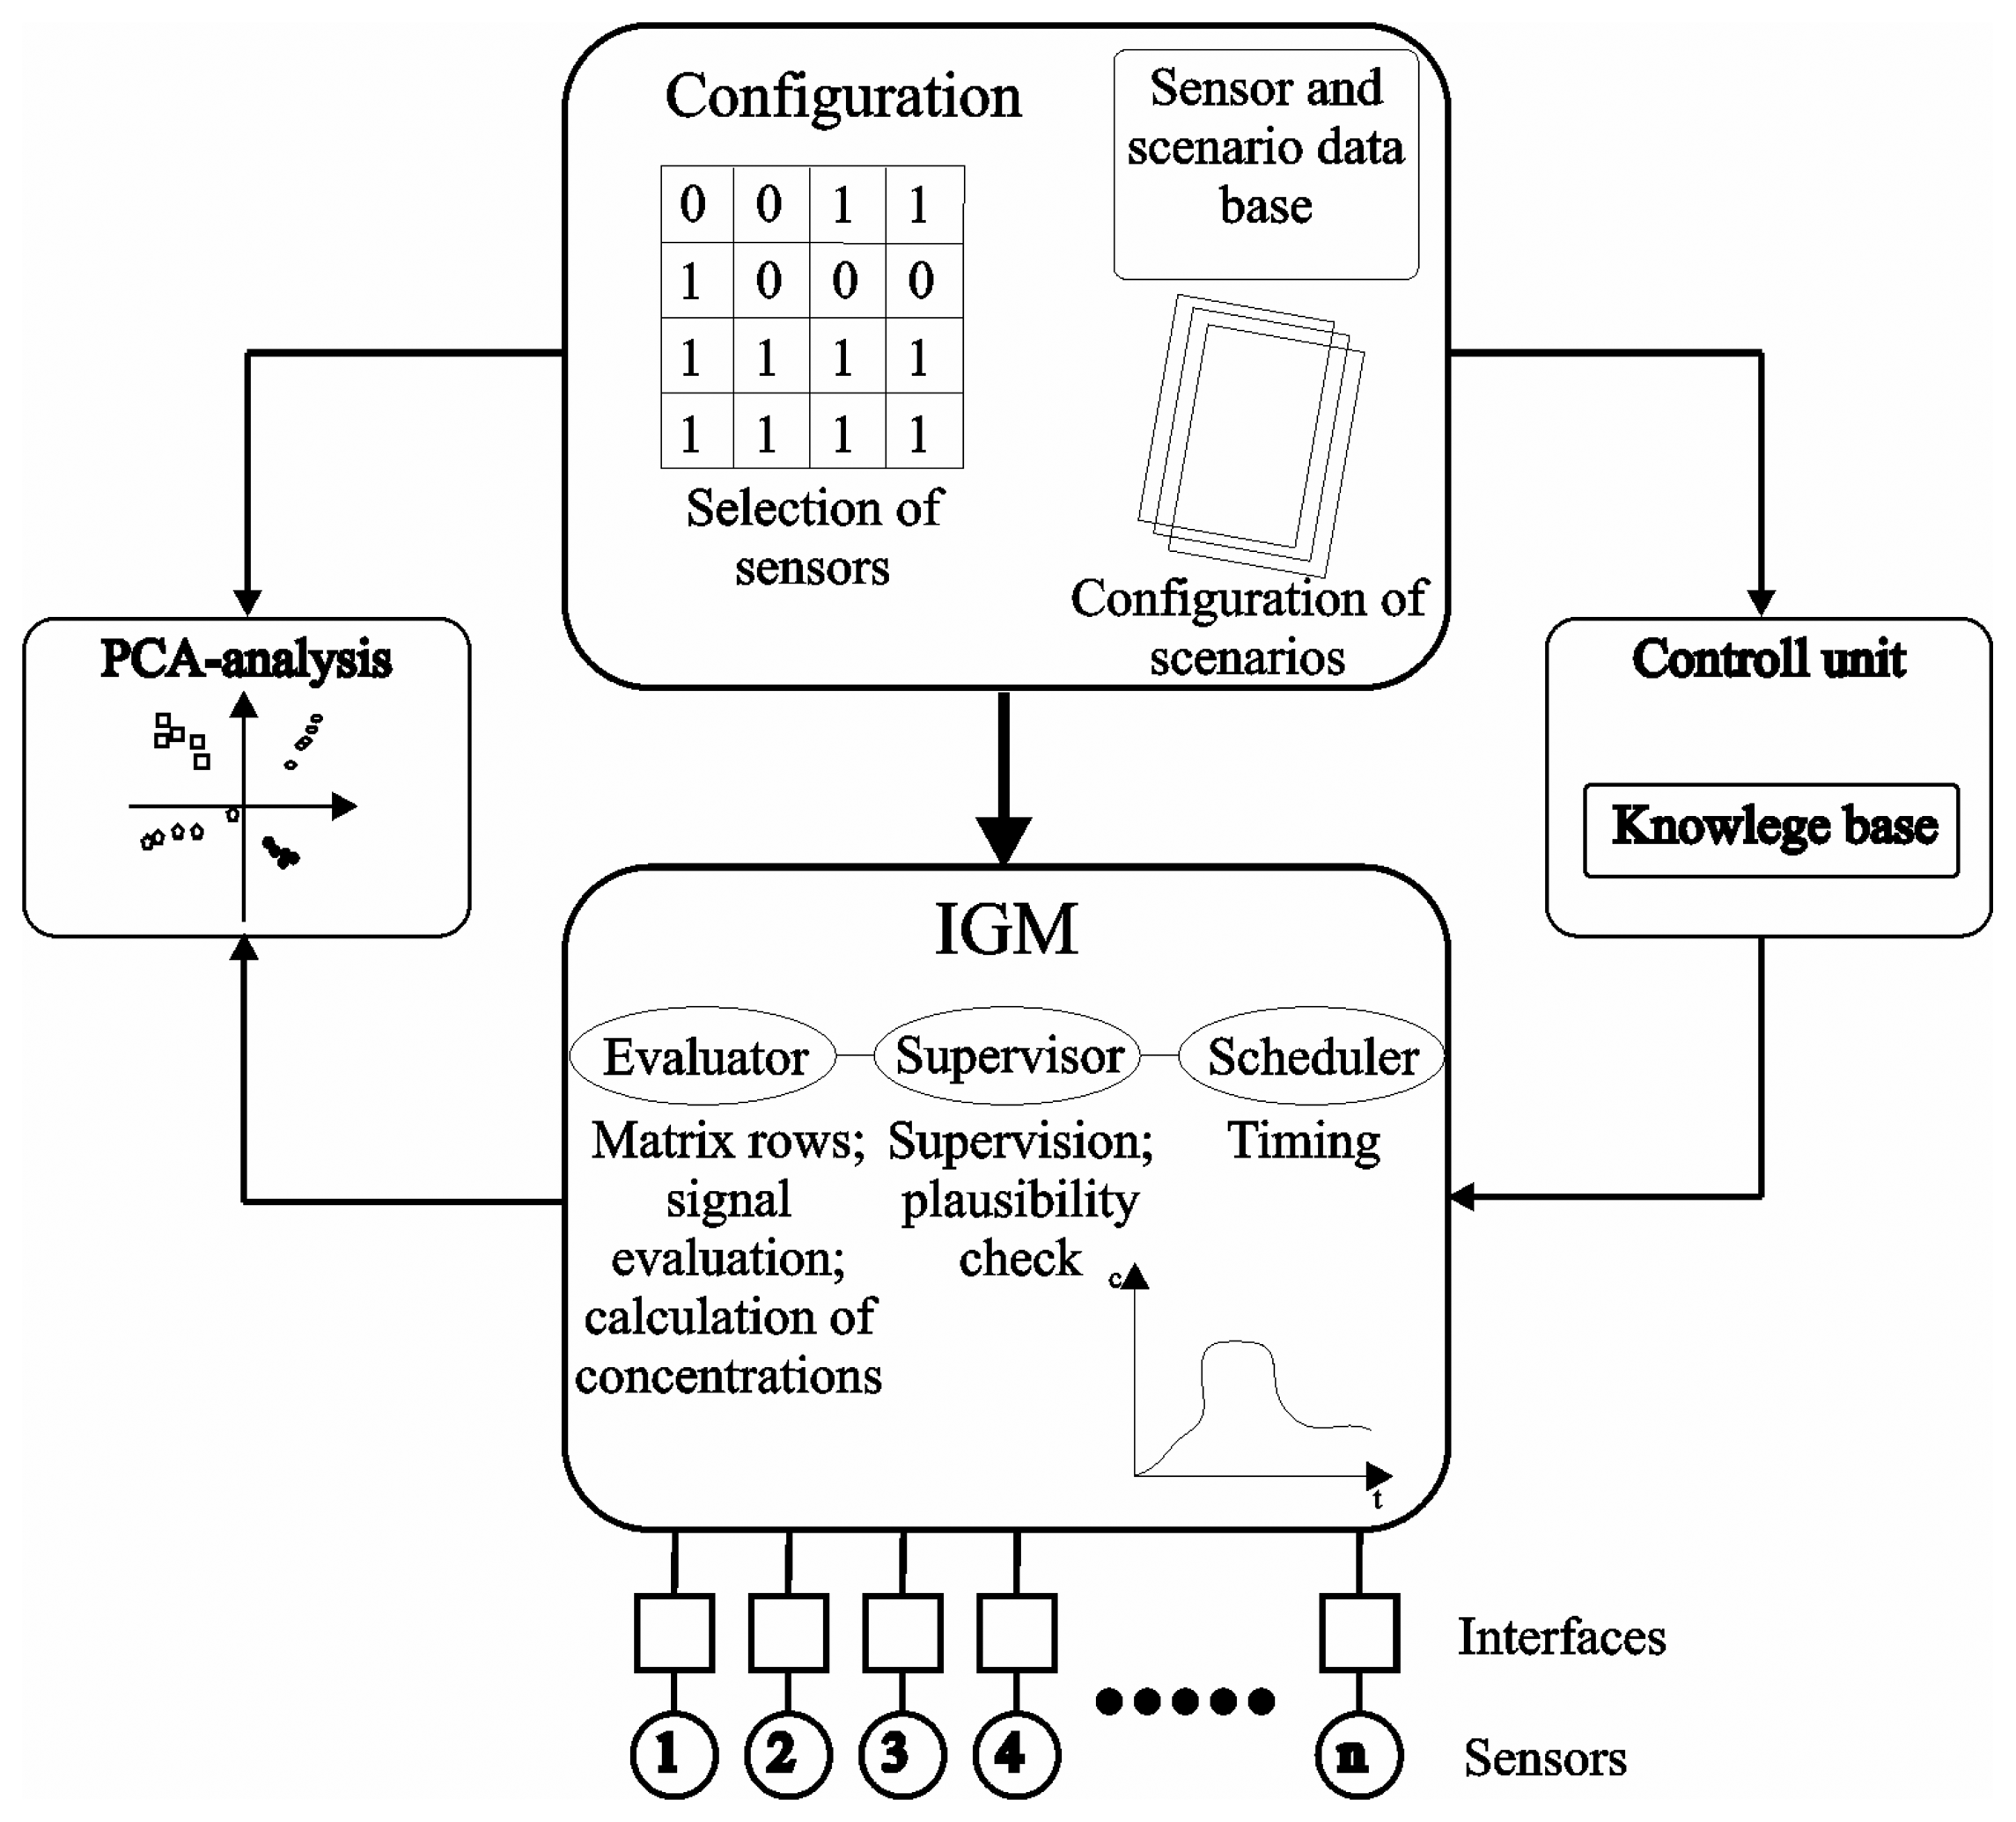
For the IGM-software a modular concept was selected, in order to facilitate the well defining of the task areas above-mentioned from each other (see
Fig. 1). For each task area a module was created, which corresponds to a uniform essential structure and communicates over a defined interface with the other modules. Each module possesses five input ports with queues, in which those by the other modules sent messages arrive and wait for their processing. These messages are data packets. The IGM-software consists of many modules; the most important are represented briefly here:
The software module “scheduler” takes over the temporal controlling of the software. The scheduler takes care that all tasks are executed successively.
The module UI (user interface) is responsible for the inquiry of the keyboard entries as well as for the announcement of the results (gas concentrations, measurand quality and status messages).
The signal evaluation module “evaluator” and the supervision module “supervisor” contain the “intelligent” main item of the IGM software.
For the calculation of the gas concentrations under consideration of cross-sensitivities the module “evaluator” was provided and the module “supervisor” takes over tasks of plausibility control and the consideration of characteristic of the respective measuring scenario.
Fig. 1 points up the structure of the two modules and their interaction in the IGM-operating schedule. Furthermore, the evaluation module is built up modular, i.e. various evaluation methods can be implemented for different sensors; it can be a characteristic curve function, a “matrix-row” or a simple neural network.
The basic structure of the evaluation routine in the module evaluator consists of a simple iterative routine, which calls the evaluation function used according to the available sensors. The matrix method is used thereby as evaluation algorithm.
The module supervisor takes over from configuration module the scenario data and the information about the selected sensors, which it needs for the assessment of the measured values delivered by the evaluation component. With the delivered sensor and scenario data the internal structures of the supervisor are initialized and the start situation of the measuring system and the sensors involved is specified.
The calculated concentrations are stored by the evaluator in the appropriate IDL-data structures (IGM Definition Language), wherefrom the supervisor retrieves them for the plausibility check, before they are passed on to the output module.
Signal evaluation with the matrix method
The matrix method is a new mathematical approach for the evaluation of signals of a gas sensor array [
9]. This method uses functionalities, which calculate gas concentrations from the signals of a sensor array. However, the calculation scheme is built up modular, i.e. for each sensor involved there is a function, which has the sensor signal of this sensor as input and as output the gas concentration of that gas, to which the sensor is main sensitive.
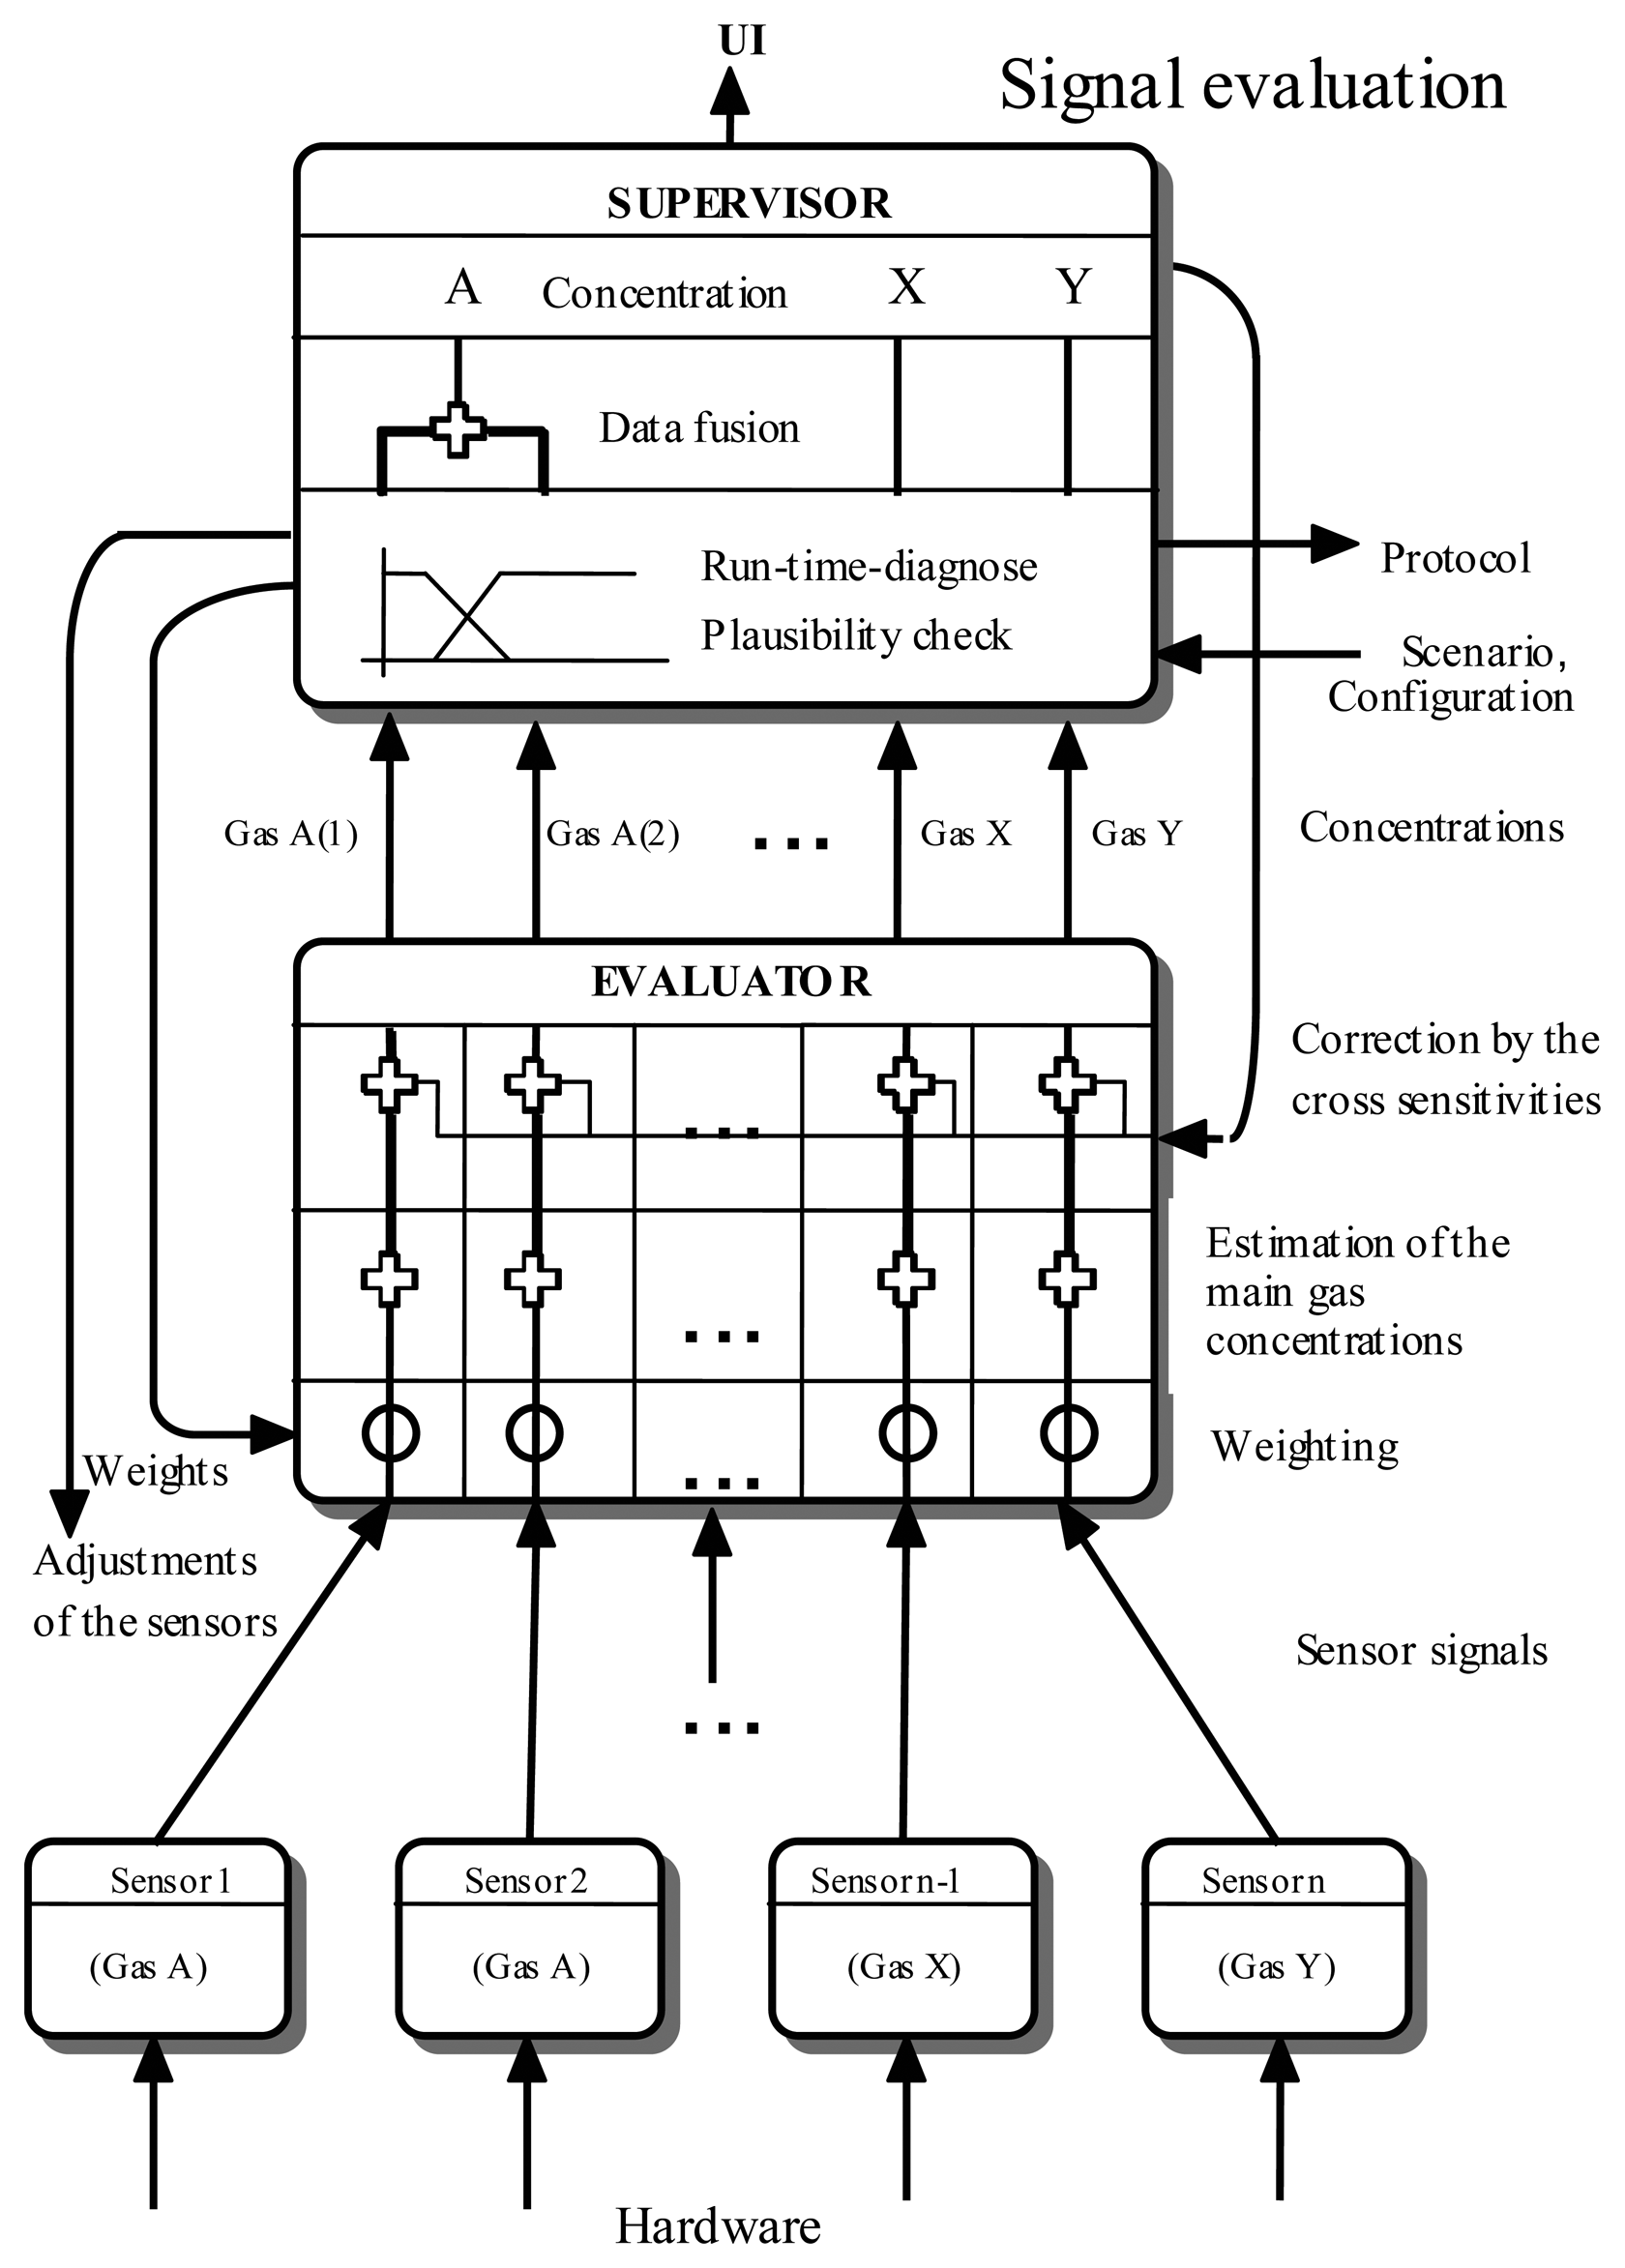
If the sensor has known cross-sensitivities, then these are integrated subject to the concentration of the respective “cross gas” in the function. The method can be represented with the calculation scheme (“matrix”) as shown in
Fig. 2.
One presupposes thus the concentrations of the other gasses for the calculation of the main gas as known. This is possible, if one accomplishes the method iterative, i.e. one takes for each computation step the concentration of cross gases calculated in the previous step. After few computation steps the concentration of all gases involved can be determined with sufficient accuracy. If many sensors are available, which are main sensitive to the same gas, then the data fusion is carried out in the component for plausibility check. If no concentration can be determined for a “cross gas” of a sensor, because no sensor main sensitive for this gas is present in the array, then the respective cross-sensitivity term in the evaluation routine is switched off by the weighting f takes the value 0.
It exists for each gas a main sensitivity H, which uses only the signals of the sensors main sensitive for this gas. Furthermore, there is for each gas thereto switchable additional terms N by means of a flag f, which use the result of the previous iteration step of the respective gas cross-sensitive sensors. In the first iteration step only the main sensitivities are taken into account since there aren't yet concentration values of the gasses, for which the respective sensor is cross-sensitive. With every further iteration step the concentration values are corrected by the influence of the other gasses on the sensor. This happens until the calculated value (within a tolerance interval) is stable.
If the functionality of the cross-sensitivity N consists simply of the multiplication of the gas concentration with a constant k, then the computation for k<0.5 converges after a few iteration steps. The task of the plausibility check is the examination of the compliance with the convergence criteria. As a control instrument the flags are available, with which the additional terms can be weighted or be switched off. An advantage of this method is the fact that the individual rows of the evaluation matrix can be provided by the respective sensor manufacturers independently of each other, since the signals of the cross-sensitive sensors do not come directly into the rows.
It is just as possible to enter for individual sensors a characteristic curve function or a simple neural network. Hence, it follows that the conjunction ⊕ (see
Fig. 2) must not be necessarily additive (in the simplest case however addition or subtraction). For weighting purposes the flag
f can take also other values than 0 or 1.
The presented analysis concept was used for the simulation of an array of five sensors to determine gas concentration of CH4, NH3, H2, CO and C2H5OH. For the matrix method the sensors are described by suitable mathematical models, with which the parameters are determined for the matrix rows.
The system is conceived only for the steady-state operational behaviour of the sensors, therefore the starting conditions affect only the convergence, since the solution is constant for all times and thus the starting situation does not have influence on it. Also the influencing variables such as the drift and the erratic change of the sensitivity do not have influence, since the system is operated in the stationary case. If models are available for the description of the temperature and pressure dependence, then these can be integrated into the matrix-rows of the sensors.
Modelling of sensor characteristic curve for semiconductor gas sensors
Metal-oxide semiconductor gas sensors are suitable for the detection of oxidising and reducing gases, since they react to their presence with a measurable change of their electrical conductivity [
10]. By modelling the reaction of the gas sensors to the measurands is described.
Typically, semiconductor gas sensors react to different gases. Therefore, as a sensor signal the relative conductivity
S(
c) is used [
9,
11]. It corresponds to the resistance value of the sensor under gas influence related to the sensor resistance in pure atmosphere.
where
G0 is the baseline conductance (i.e., in the presence of clean air) and
Gg the steady-state conductance of the sensor in the presence of a given gas or gas mixture. The function (1) applies only at a constant temperature T of the sensor surface. The reaction of gas sensors to the measured gasses can be described by different models, which mostly indicate a power-law for the interrelation between partial pressure and sensor conductance. We examined different available models, evaluated these and developed a new model. For the semiconductor gas sensor Clifford [
12,
13] derived from experimental results an empirical formula which describes the sensor resistance as function of several gas concentrations. This model is described by the power function
Eq. (2):
where
b and
β are the coefficients. The sensor relative conductivity can be defined as a function, which describes the sensor response by various gas concentrations. Accordingly, the gas sensor relative conductivity for tow gases of CH
4 and NH
3 can be expressed as:
where
b,
b1,
β and
β1 are the coefficients;
cm and
ca are the gas concentrations of CH
4 and NH
3, respectively. The concentration of cross-gas NH
3 is a calculated subject to the main sensitivity of the gas sensor, in our case subject to the main CH
4-sensitivity.
Madou and Morrison [
14] employ extensive theoretical considerations concerning the influence of the sensor conductivity by oxygen and reducing gases. At operating temperature, the resistance of semiconductor gas sensors follows also dependent upon gas concentration in the environment air a power-law as shown in
Eq. (4), [
12,
14,
15].
For two gases of CH
4 and NH
3 the model is given by
We developed a logarithmic model of gas sensor response using a relationship between sensor conductance and gas concentrations in a mixture. The sensor relative conductivity can be expressed as:
where
a and
b are the coefficients and the constant 0.5 is used for the defining of the sensor response at the gas concentration of 0 ppm (i.e., in the presence of clean air).
Eq. (6) shows that the sensor resistance or relative conductivity is proportional to the logarithm of the concentration
c. For a gas mixture of CH
4 and NH
3 the mixture gas characteristic equation is then as follows:
where
a0,
a1,
b0 and
b1 are the coefficients. Applying many gas sensors which show different characteristics, the gas concentrations in a gas mixture can be evaluated. The gas sensors used in the present study were five semiconductor gas sensors. The sensors were modelled with the described models above-mentioned.
Figs. 3(a), (b) and (c) show the correlation between the measured and estimated data for the gas mixture of CH
4 and H
2 for a gas sensor using the models of Clifford, Morrison and the logarithmic model, respectively. Measured values are shown by the symbols and the approximation is shown by the solid line. The solid-line approximations connecting the experimental data were obtained from
Eqs. (3),
(5) and
(7) using a least-squares method.
A comparison of the estimations in
Figs. 3(a), (b) and (c) shows that the models of Clifford and Morrison delivered good approximations for gas concentrations from 10 to 1000 ppm; whereas the logarithmic model delivered also good accuracy but for the complete gas concentration range from 0 to 1000 ppm. Therefore, this model was used for the modelling of the five sensor array. The gas concentrations of the gases involved are computed with the matrix method from the signals of the five sensor array, therefore
Eq. (7) can be transposed into a concentration signal as expressed in
Eq. (8):
where
c and
S(
c) are the gas concentration and the sensor signal, respectively.
Simulation of a gas sensor array
Quantitative analysis with IGM-software
The purpose of the use of gas sensor arrays is the exploitation mutual cross-sensitivities for the improvement of the whole result. By existing sensor arrays only the main sensitivities of the sensors are often consulted for the calculation of the gas concentration. With the matrix method the cross-sensitivities of the sensors can be used for the accurate concentration determination of the main sensitivities and consequently, for the improvement of the simulation results (see section 3). Using the model described by
Eq. (6), we determined with an array of five sensors the concentrations of CH
4, NH
3, H
2, CO, and C
2H
5OH as shown in
Fig. 4.
Table 1 shows the involved sensors and the respective cross and main sensitivity.
The models of the individual sensors were created based on single gas and gas mixture measurements. The gas sensors were measured for each individual gas and the gas concentration was varied from 1 to 1000 ppm (measured four times at 1, 10, 100, 1000 ppm). A least-squares method fit of measured data was used for determining the values of coefficients. With the help of these determined coefficients and the created models the matrix rows are formulated, which are converted into C-code for the simulation.
Fig. 4 shows the simulated gas sensor array. The entire display area of the screen is divided into several windows. The configuration of the diagrams and the readouts for check values takes place in the largest window. Messages about the gasses involved, measuring situation, possible measuring errors, gas concentrations and weights are displayed from the sensor operating system in the window “status messages”. Since we do not have the hardware for the build-up and test of the gas sensor array, with which the signals can be queried, the sensor input signals are theoretically “simulated” and were generated with the help of the program Microsoft Excel and stored in the respective files (sensorname.dat files).
Fig. 5 shows the input signals for the gas sensor array. Different input signal profiles were considered, e.g. rising or sloping characteristic curves and a combination of both. The used sensors are differently strongly main and cross-sensitive to the gases and therefore, the calculated respective gas concentrations are differently corrected by the cross sensitivities. While the gas sensors 1470 and 2000 exhibit very strong cross-sensitivities to the gases H
2 and C
2H
5OH, respectively, the sensors 4470, 6470 and SP32 show rather weak cross-sensitivities to their “cross gases”. Therefore, the sensor array is strongly influenced by the gases H
2 and C
2H
5OH and thus, high gas concentrations of the gases CH
4 and CO are estimated.
The calculated gas concentration of the gases involved lie in the behaviour area of the individual sensors. The task of the plausibility check (supervisor) is it to evaluate the reliability of the measured values and the quality condition of the sensors involved due to the sensor signals and the gas concentrations calculated by the estimation component (matrix algorithm) as well as using of stored “expert knowledge” about the sensors and the respective measuring scenario. The areas of meaningful gas concentrations do not have sharp boundary, so that a simple area control is not sufficient.
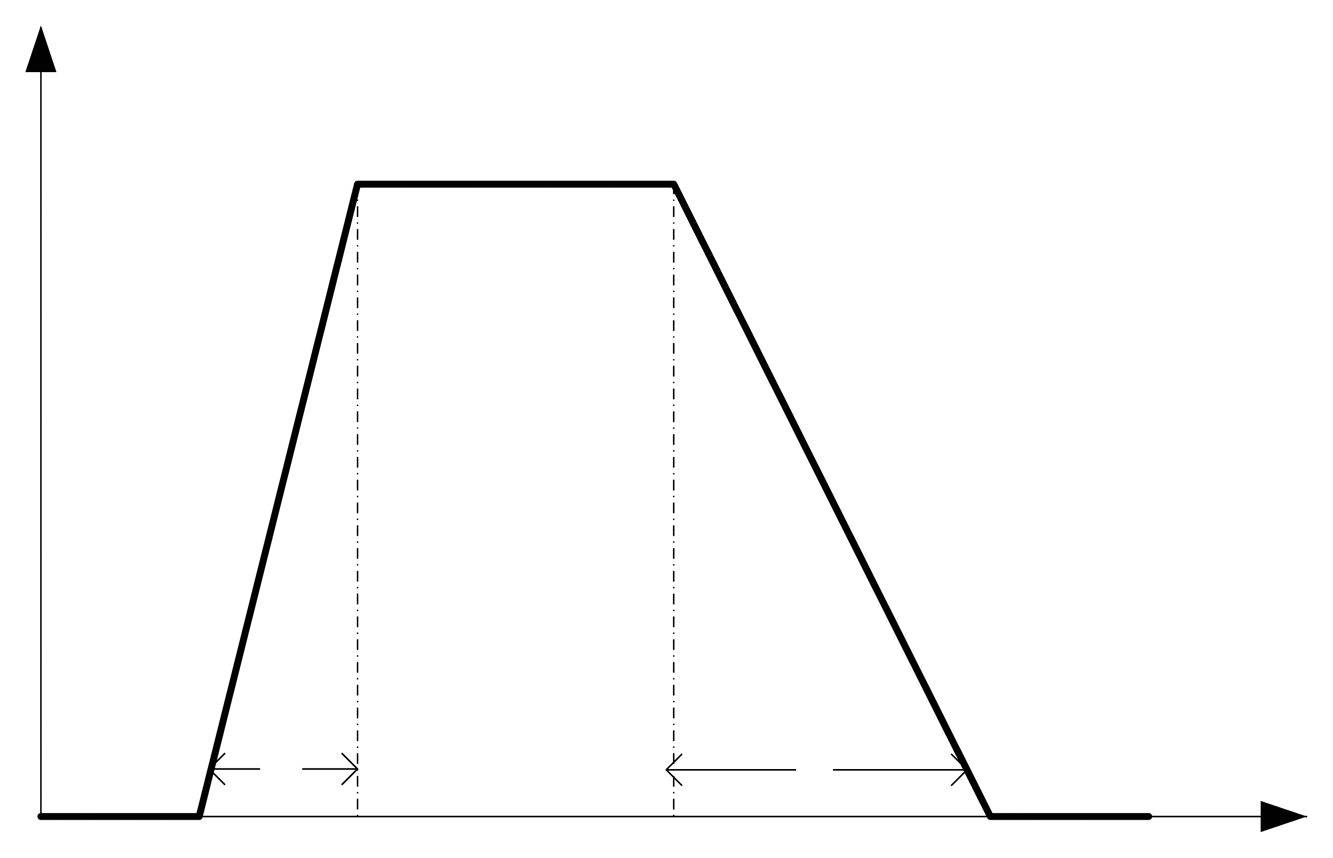
Therefore, the areas of the measured values and gas concentrations to be expected are defined as fuzzy intervals. Fuzzy sets are represented by membership function, e.g. by trapezium function as shown in the
Eq. 9.
Fig. 6 shows the shape of the trapezium function.
The grade of the membership of the measured value in the current fuzzy plausibility interval is a measure for the reliability of the value. In the core area of the respective interval this value is 1 (i.e., this result is completely in the expected area) and at the border area it continuous drops up to the value 0 (to interpret as this result is completely implausible). The quality value determined can be used then to weight the result combined with it in the further processing according to its reliability. The quality of a sensor and the measured and calculated value are not static but are subject to temporal dynamics. The temporal change of the situation of the measured values in the plausibility intervals and the speed of this change can serve as a basis for hypotheses and prognoses with respect to the development of the sensor quality.
Qualitative analysis with Principal Component Analysis (PCA)
Principal Component Analysis (PCA) is the name for a method of mathematical statistics to extract the interesting part of the information of a sensor array and to forget the redundant part of the information. The method presented here is developed by EADS-Company. By means of the PCA-analysis often 95% of the information from a large sensor array can be represented in a two-dimensional diagram. Mathematically, the PCA analysis accomplishes a neat coordinate transformation in the n-dimensional data area (n: the number of sensors). First of the new coordinates (Principal Component 1) is put in such a way that the main part of the variation of the sensor signals lies along this axis. The second coordinate (orthogonal to the first) is put in such a way that as much as possible variation still lies along this axis.
For the gas classification by means of the PCA-analysis the concentrations of the gases (CH
4, NH
3, H
2, CO and C
2H
5OH) estimated by the IGM-software are used for the calculation of the sensitivities of the involved sensors. From the sensitivities a data matrix is generated, with which the principal components are then calculated.
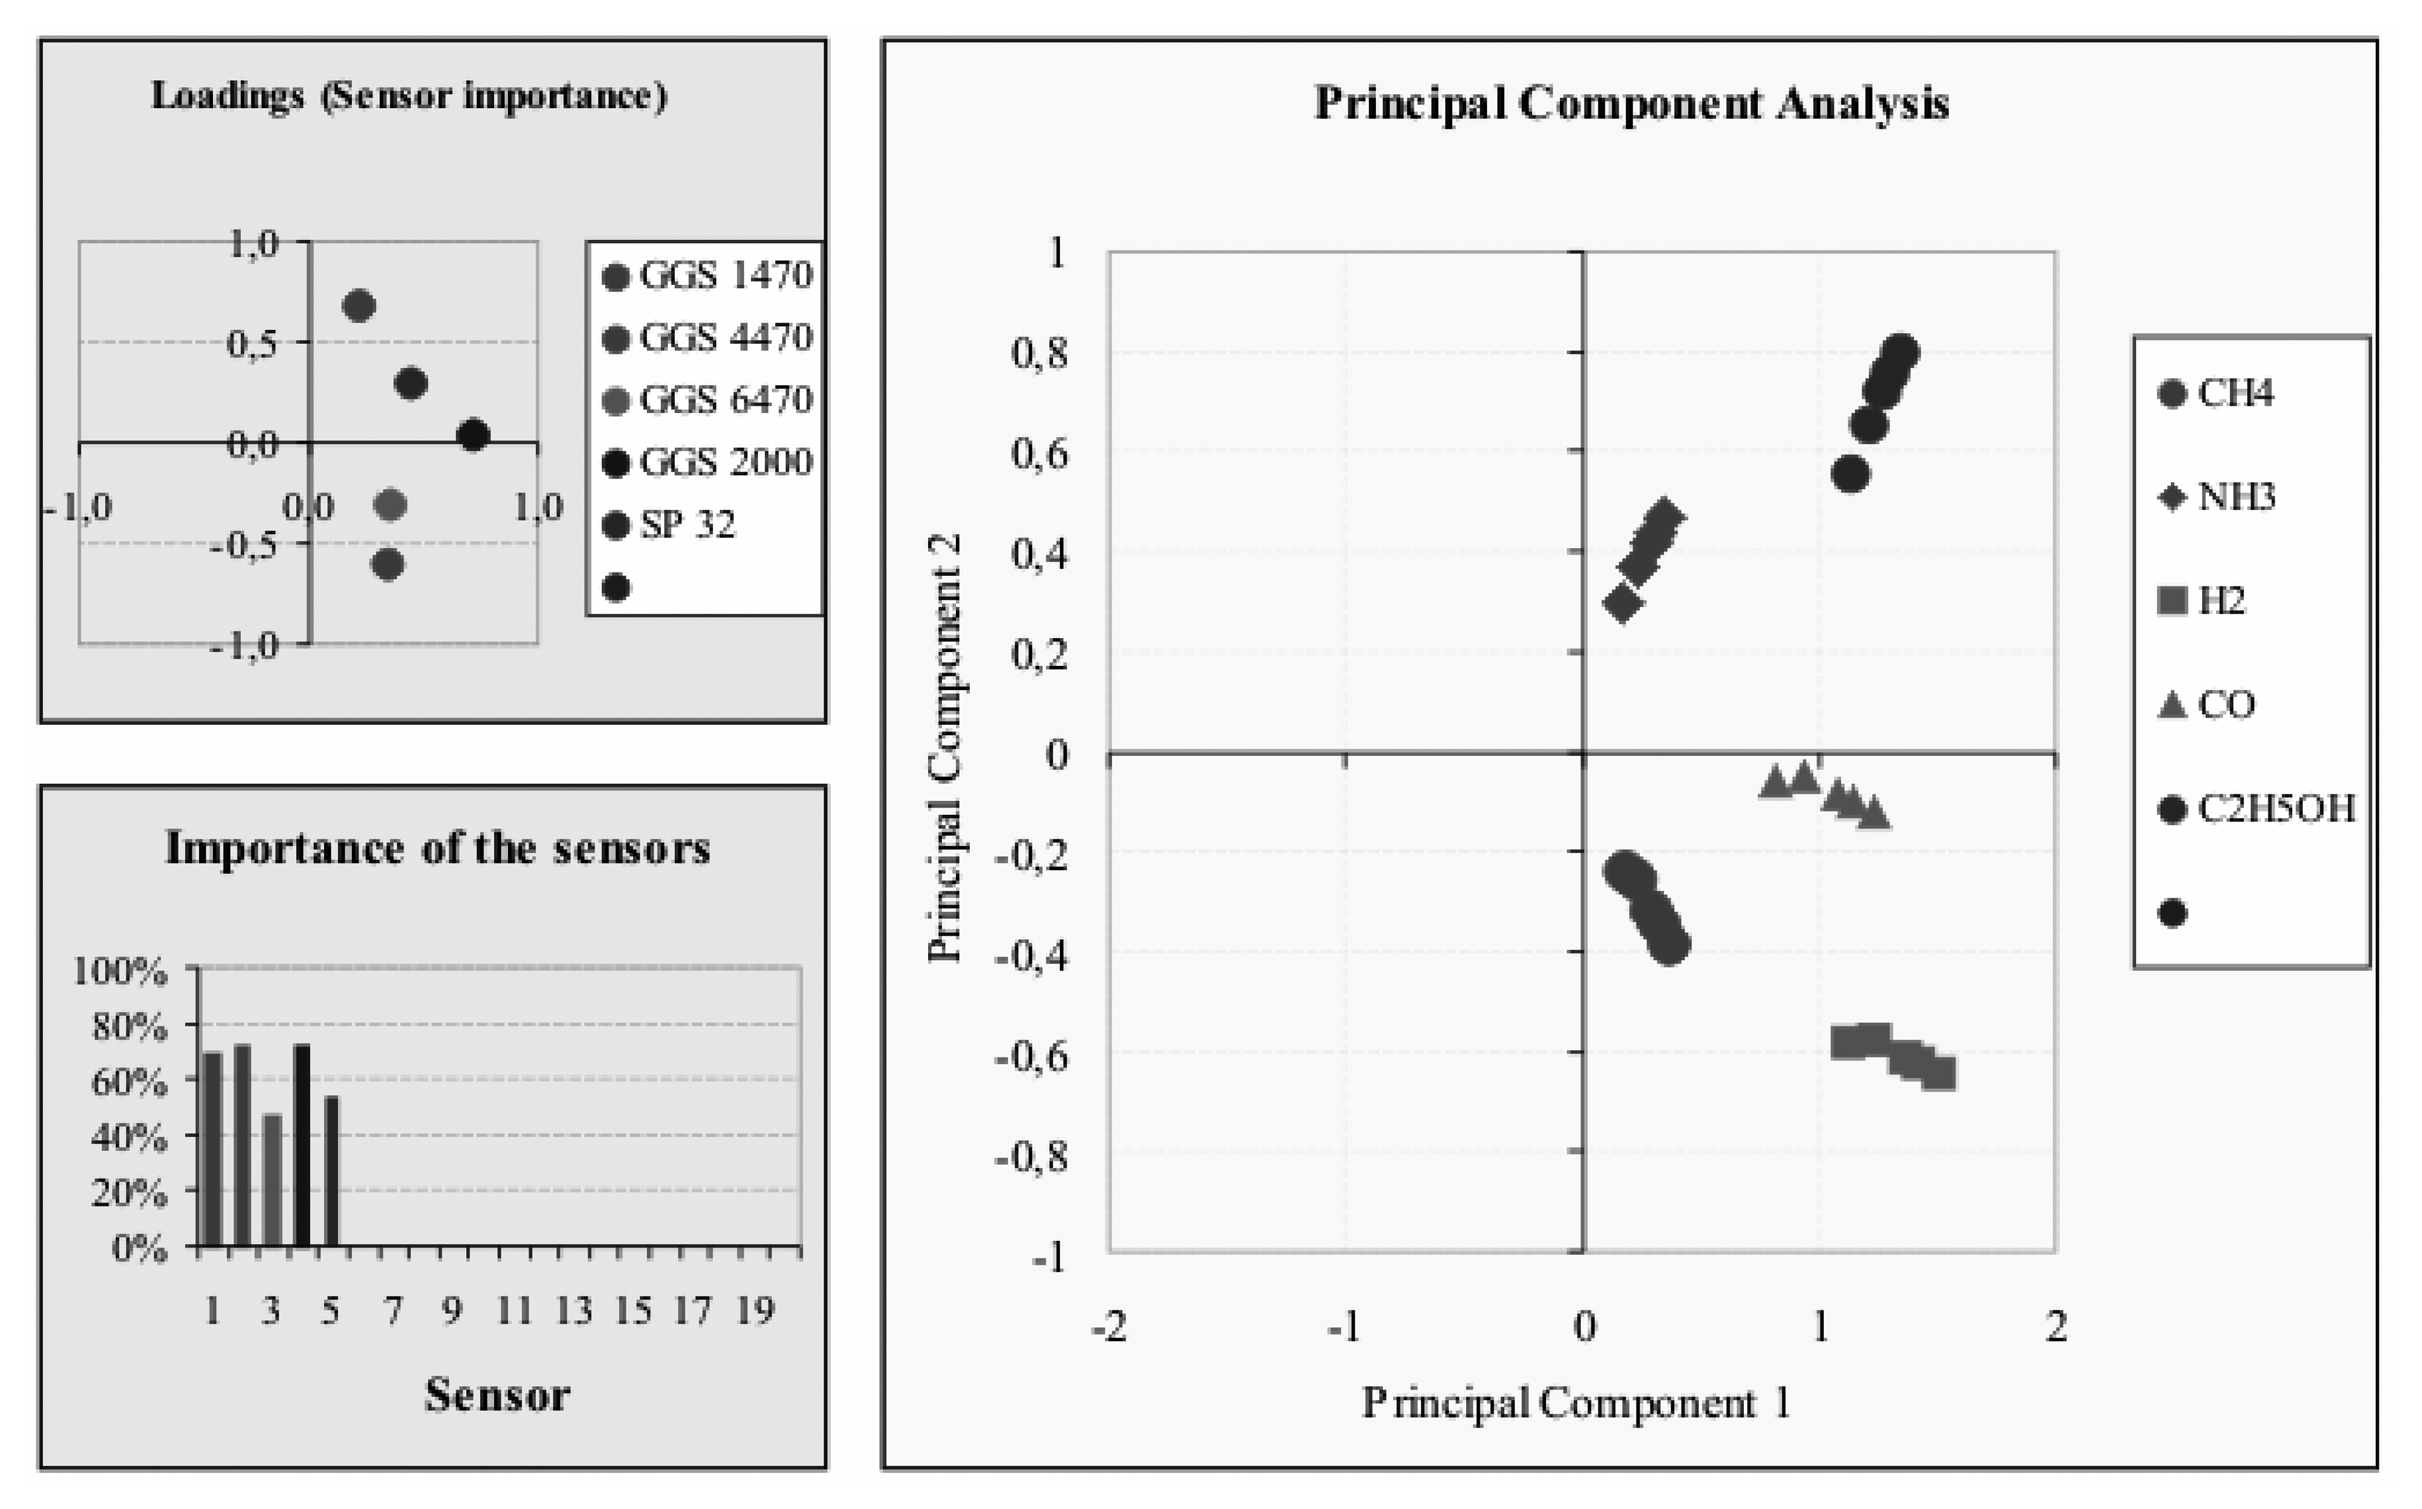
Fig. 7 shows a good separation of the gases detected by the five sensor array. Each gas is present with 5 different concentrations. Since each of the five gases takes a different direction, a good separation is possible.
With the loadings of the principal components it is possible to find out which sensor of the sensor array is best suitable for the discrimination of the gases. When the sensitivities of the sensors are not large enough, then it is possible that the gases are not discriminated correctly, which means that the sensors are too similar in their cross-sensitivities.
Data base for the configuration of gas sensor arrays
A sensor data base was developed, which constructs on a basis of 50–60 semiconductor sensors of different manufacturers. These were modelled by data sheets and integrated into the data base. With this database and the software components IGM and PCA one can generate scenarios for applications, configure sensor arrays for such a scenario and prove their function with the simulation software as shown in
Fig. 8.
The data base consists of extensive internal tables, which contain information for the search, selection and configuration of sensors and scenarios. Furthermore, the model equations for the matrix rows and changes of the source code files can be managed and created by the data base. For the configuration of a sensor array one can enter a scenario and the system searches for sensors for the scenario used and suggests a sensor array, which can possibly be used. For this sensor array the system generates from its data base the matrix rows, which are used for the evaluation of the sensor signals of the array and thus the concentrations of the gases involved are computed. In the next step, the purchase list for the sensors and the algorithm can be used, in order to actually build the array in combination with a off-the-shelf microprocessor for the signal evaluation.
With the implemented knowledge base by the data base and the IGM-simulation software a broad field for special applications opens for the system, which can be used by an engineer's office.
With the combination of the IGM-software, which can determine gas concentrations of a sensor array, and the PCA-analysis, which can make possible a qualitative discrimination between the gases recognized by the array, the user can optimise gas sensor arrays for its applications at the computer before he applies thereto the appropriate hardware. An online Web-based version of the database and the simulation software was designed; with which sensor arrays can be optimised for special applications before they are actually build with the appropriate hardware.
Conclusions
A modular method of modelling gas sensor arrays was presented. The matrix method uses functionalities that calculate gas concentrations from the signals of a sensor array. For each sensor present there is a function that has as input the sensor signal of this sensor and as output the gas concentration of that gas, to which the sensor is main-sensitive. The sensor response equations have been developed using the logarithmic model with two coefficients.
A sensor array of five semiconductor gas sensors was modelled with this method for the determination of the concentration of gases CH4, NH3, H2, CO and C2H5OH. For the simulation of this gas sensor array the IGM-software was used. The IGM-software can configure and simulate with its modular structure such an array. For the calculation of the gas concentrations the module evaluator was provided and the module supervisor takes over tasks of plausibility check for the measuring scenario. The qualitative analysis of the sensor arrays simulated is done using a PCA-analysis.
A gas sensor data base was build for the configuration of the software. With the gas sensor data base and the software components of IGM and PCA a software tool was developed that is suitable for quantitative and qualitative analysis. The field of the use of this tool appears to be very broad. It can be used whenever there is a need to discriminate between different gases, or whenever there is a need to determine concentrations.


