Abstract
Algorithms for QRS detection are fundamental in the ECG interpretive processing chain. They must meet several challenges, such as high reliability, high temporal accuracy, high immunity to noise, and low computational complexity. Unfortunately, the accuracy expressed by missed or redundant events statistics is often the only parameter used to evaluate the detector’s performance. In this paper, we first notice that statistics of true positive detections rely on researchers’ arbitrary selection of time tolerance between QRS detector output and the database reference. Next, we propose a multidimensional algorithm evaluation method and present its use on four example QRS detectors. The dimensions are (a) influence of detection temporal tolerance, tested for values between 8.33 and 164 ms; (b) noise immunity, tested with an ECG signal with an added muscular noise pattern and signal-to-noise ratio to the effect of “no added noise”, 15, 7, 3 dB; and (c) influence of QRS morphology, tested on the six most frequently represented morphology types in the MIT-BIH Arrhythmia Database. The multidimensional evaluation, as proposed in this paper, allows an in-depth comparison of QRS detection algorithms removing the limitations of existing one-dimensional methods. The method enables the assessment of the QRS detection algorithms according to the medical device application area and corresponding requirements of temporal accuracy, immunity to noise, and QRS morphology types. The analysis shows also that, for some algorithms, adding muscular noise to the ECG signal improves algorithm accuracy results.
1. Introduction
QRS detectors are widely used as a front end of various ECG processing chains; consequently, their usage is concerned virtually in any ECG-dedicated software. Moreover, from the signal processing viewpoint, they serve as an interface between a continuous series of samples captured by recording devices and a feature-based algorithm used for classification and detection purposes. Consequently, in several ECG software packages, the QRS detector and preceding filters are the unique procedures involving every sample of the record. Therefore, high accuracy of detection and low computational complexity are of key importance and are usually regarded as primary quality factors. Detection accuracy, however, becomes a less distinctive factor as many modern detectors approach 99.9%.
Mobile and wearable ECG data acquisition systems face an inherent conflict between autonomy time and usability. The time between battery recharge, power consumption, detection accuracy, size, and weight of the device have to be balanced by a compromise. To this end, two important quality aspects appear to produce a reliable estimate of the suitability of a particular QRS detection algorithm to an area of application. The first aspect is the temporal stability of the detection point sequence (that is, its independence from the QRS morphology type). With the QRS detector producing highly accurate detection points, one could avoid recalculations of more precise QRS peak positions and directly input the detection points to procedures such as HRV analysis or shape classifying. The second point is the noise immunity of the detection point sequence, which specifies how much noise (e.g., of muscular origin), present for example in wearable-based in-field ECG measurements, affect the precision of QRS detection and alter the medical findings produced by subsequent diagnostic procedures.
In this paper, we address the problem of the comprehensive evaluation of QRS detection performance using multidimensional criteria, including the temporal tolerance of QRS complex detection, robustness amid noise, and sensitivity to QRS morphology. The proposed methodology enables the selection of the QRS detectors for specific applications, such as clinical data analysis, long-term monitoring with mobile devices and wearables, fast results, or arrhythmia diagnosis. The analysis is demonstrated in the example of four selected QRS detection algorithms implemented in Python according to their specification in the relevant references [1,2,3,4]. The algorithms are tested on the MIT-BIH Arrhythmia Database (MIT-BIH AD) [5] with added muscular noise from the MIT-BIH Noise Stress Test Database (MIT-BIH NSTD) [6]. The tests were conducted on Dell Latitude E6400, Intel Core2Duo P8400, 2.26 GHz, and 4 GB RAM running with Debian 10.13. Implementation of the algorithms, test tools, and data processing were performed in Python 3.7.3. Plots were created in Jupyter Notebook (server v5.7.8 with Python 3.7.3 [GCC 8.3.0]).
The performance analysis shows that the QRS detectors demonstrate different sensitivities to the detection of temporal tolerance. Some algorithms maintain high detection accuracy, even for low values of temporal tolerance of QRS detection. The others exhibit good results only for high values of temporal tolerance (i.e., comparable to the QRS standard duration of 100 ms).
The QRS detection performance under extra noise is in general deteriorated. However, as shown in this paper, for some QRS morphologies, extra noise in the ECG signal can paradoxically improve QRS detection accuracy. This effect resembles the improvement of audio and video data by randomizing the quantization error known as dither [7,8].
The performance of the algorithms depends on QRS morphology, as each algorithm uses different ECG signal filtering methods and signal analysis in subsequent processing blocks. Some QRS morphologies are more problematic than others for each algorithm under analysis. In our tests, V-type QRS morphologies were the most problematic for algorithms under analysis.
2. Related Work
Medical testing procedures are conventionally evaluated based on binary classification by calculating parameters such as TP, FN, FP, and TB. These parameters are also commonly used in the literature for performance evaluation and comparison of QRS detection algorithms [9]. True positive (TP) is the number of correctly detected R peaks, false negative (FN) is the number of omitted R-peaks, false positive (FP) is the number of places wrongly classified as R-peaks, and total beats (TB) is the number of annotated R-peaks in a database record. However, much less attention is paid to temporal detection accuracy. The numerical values of TP, FN, and FP depend on detector temporal tolerance (DTT), defined as the maximum allowed time difference between the algorithm detection points (R-peaks) and the corresponding annotations from the reference database [10]. A variety of temporal tolerance values are used in the literature, ranging from 60 ms to 160 ms, which sometimes results in the comparison of algorithms with different temporal resolutions. The problem of the sensitivity of the accuracy of QRS detection algorithms in the temporal resolution of the detection defined by DTT is examined in [10]. When the algorithm is tested with a certain high value of DTT, relatively distant locations of R-peak detection points and database annotation are successfully paired and counted as TP. Further testing with certain lower DTT values will result in the distance between detection points and database annotation exceeding the DTT value and, consequently, their pairing will be unsuccessful. Database annotation without paired detection points will be counted as FN, and algorithm detection without paired database annotation will be counted as FP. This way, the algorithm’s TP detection for higher values of DTT will be replaced by a pair of FN and FP detections for lower DTT values. As expected, the higher the DTT, the better the numerical results of the TP, FN, and FP. However, the deterioration rate of an algorithm’s accuracy depends on the given QRS detection algorithm. Some algorithms demonstrate slow degradation, while others suffer a quick performance drop with decreasing DTT values [10].
A substantial research effort has been dedicated to examining the robustness of QRS detectors’ performance against noise in ECG signal recordings; [11] reviews 38 major state-of-the-art techniques of QRS detection with comprehensive comparative analysis of techniques for ECG signal denoising and QRS detection. In their conclusion, the authors emphasize a need to invent computational techniques “to analyze the ECG signal with higher accuracy in all conditions”, which justifies the development of multidimensional methods to test algorithms’ performance, among other criteria, in various noise conditions and temporal accuracy requirements.
The performance results of the Pan–Tompkins QRS detection algorithm in noisy ambulatory ECG data with varying signal-to-noise ratios are presented in [12]. Two ECG databases are used for testing: the MIT-BIH NSTD [6] and the MIT-BIH AD [5]. The algorithm results for sensitivity (Se = TP/(TP + FN)) and positive predictivity (PPV or +P) (+P = TP/(TP + FP)) deteriorate from close to 100% for noise level with SNR = 24 dB to around 60% and 70% respectively for SNR = −6 dB. The analysis shows that the Pan–Tompkins algorithm needs improvements to achieve good detection performance for noisy signals.
In [13], the performance analysis of selected three well-known QRS detection algorithms is addressed: by Pan–Tompkins [4], WQRS [14], and by Hamilton [15] against the MIT-BIH AD and the noise-contaminated ECG signal with different levels of baseline wander (BW), muscle artifact (MA), and electrode motion (EM) artifact from the MIT-BIH NSTD. As shown in [13], noise and artifacts decreased the quality indices of algorithms from close to 100% for SNR = 12 dB to:
- BW noise: Se = 95% for WQRS and +P = 62% for WQRS for SNR = −12 dB,
- MA noise: Se = 83% for Hamilton and +P = 38% for WQRS for SNR = −12 dB,
- and EM noise: Se = 65% for Hamilton and +P = 30% for WQRS for SNR = −12 dB.
The poorest performance was noted for ECG signals affected by EM artifacts.
In [16], a new QRS detection method is proposed and validated, with different levels of baseline wander, muscle artifact, and electrode motion artifact as noise sources against MIT-BIH NSTD with the following processing blocks: first derivative, Hilbert transform envelope, wavelet transform, wavelet component reduction, signal reconstruction, and thresholding. The proposed QRS detection method achieves Se = 78.89% and +P = 75.25% for MIT-BIH NSTD and SNR = 0 dB.
The performance of three selected state-of-the-art QRS detection algorithms and the evaluation of the accuracy of their R-peak localization are included in [17]. The algorithms under analysis were the following: integrate and fire pulse train automaton [18], zero-crossing counts [19], and the knowledge-based method [20]. The authors propose a method to estimate the temporal accuracy of R-peak detection for normal and abnormal beats as well as a simple scheme to compensate for slackness introduced by the filtering part of the algorithms.
In opposition to the ubiquitous, conventional, TP, FN, and FP parameters mentioned at the beginning of this section, a novel QRS detection performance indicator, jitter with accuracy (JA), aimed at evaluating QRS detection algorithms under realistic noise scenarios, is proposed in [21]. The authors state that Se and +P metrics used to assess the quality of R-peak detection lose information value, where a high temporal tolerance of 100 ms or more [21] is used. Also, frequent use of the MIT-BIH AD, which is, according to the authors, artifact-free, leads to an overestimation of algorithm performance and unjustified reported Se and +P performance indicators significantly above 99%.
The relationship between QRS detection performance and database sampling frequency is examined in [22]. The analysis, carried out for the Hamilton algorithm [23] against the MIT-BIH database, shows that adapting the algorithm threshold parameters to sampling frequency optimizes the algorithm’s accuracy results.
In [24], the five selected multisignal heartbeat detectors are tested against 100 records from the training dataset of the PhysioNet/CinC Challenge 2014, with various noise levels added. The performance results and best-worse ranking of the detectors are reported.
The performance of 10 QRS detection algorithms against six internationally recognized ECG databases with various normal and abnormal beat types and various levels of noise and artifacts is reported in [25]. The tested algorithms were by Pan–Tompkins, Hamilton mean, Hamilton median, RS slope, sixth power, finite state machine (FSM), U3 transform, difference operation (DOM), ‘jqrs’, and optimized knowledge based (OKB). The overall results are reported for each algorithm and each database. The analysis shows that QRS detection results decrease significantly for poor signal-quality ECG signals for all tested algorithms.
A new R-peak detector based on neural networks is proposed in [26]. The algorithm performance does not deteriorate with low-quality or noisy ECG signals acquired from mobile electrocardiogram sensors, such as Holter monitors. The proposed QRS detector uses a 1-D self-organized operational neural network with generative neurons and offers lower computational complexity than conventional 1-D convolutional neural networks. The QRS detection results reported are a 99.10% F1 score (F1 = 2 · PPV · Se/(Se + PPV)), 99.79% Se, and 98.42% +P achieved on the China Physiological Signal Challenge-2020 dataset (CPSC-DB). The CPSC-DB database contains 1 026 095 beats, collected from arrhythmia patients, and includes real-world noise as well as artifacts from a wearable real-world Holter ECG device.
In [27], 10 QRS detection techniques published between 2020 and 2022 are compared based on the performance parameters: Se, PPV, F1 score, and DER (DER = (FN + FP)/TB).
A new R-peak detection technique based on visibility graph transformation, which maps a discrete time series to a graph by expressing each sample as a node and assigning edges between intervisible samples, is proposed in [28]. The proposed method is compared against two existing QRS detection methods on a noisy and sample-accurate University of Glasgow ECG Database [29] with two performance metrics: F1 score and root mean square of successive differences (RMSSD). The result of the first comparison is presented as a boxplot of the proposed F1 score method versus the SWT-based method [30] and matched filter detector [21]. There is an annotation that “the tolerance for deviation from the true R-peaks was 0%”, which corresponds to DTT = 0. In order to evaluate the RMSSD, a Wilcoxon signed-rank test between the estimated RMSSD values and the ground truth was performed and presented.
In [31], the authors present two (FastNVG and FastWHVG) computationally accelerated versions of the visibility graph transformation QRS detection method proposed in [28], together with an extended comparison with additional 7 QRS detectors from the literature.
ECG noise removal techniques are reviewed in [32]. The types and sources of noise are identified, and six major domains of denoising are subsequently explored. The techniques for denoising are presented and their performance is evaluated according to the following parameters: root-mean-square error, percentage-root-mean-square difference, and signal-to-noise ratio improvement.
3. Materials and Methods
To demonstrate the concept of evaluation of QRS detector performance aware of temporal accuracy, the presence of noise, and various QRS morphologies, we implemented four QRS detection algorithms and tested their accuracy, expressed by a true-positive-to-total-beats ratio (TP/TB). The tests are carried out for a range of DTT values and controlled mixing of muscular noise, which is often present in wearables applications. Obviously, it is desirable for QRS detectors to show good TP/TB scores, even for low DTT. Such detectors are particularly welcome, as R-peak location corrections are not necessary, and resynchronization of the heartbeat time series is not needed before further ECG processing steps.
The four algorithms selected from the QRS detection literature consist of three algorithms developed for mobile and wearables applications [1,2,3] and the algorithm broadly used as the reference in QRS detection literature [4]. Algorithms 1 and 2 belong to a group of algorithms based on digital filtering [9]. In addition, they can be classified into a group of “low” computational complexity using the subjective comparison with respect to computational load [9]. In contrast, Algorithm 3 does not use any digital filters and works on a different principle of operation based on a level-crossing sampling of the ECG signal. Algorithm 3 can be assigned to the group of “medium” computational load. Algorithm 4 is based on digital filters [9] and can be assigned to the group of “medium” computational load. Compared with Algorithms 1 and 2, Algorithm 4 uses more mathematical operations performed in multiple stages of signal processing.
Section 3.1, Section 3.2, Section 3.3 and Section 3.4 present the specification of QRS detection algorithms included in the study, while Section 3.5 contains the definition of test signals used to examine their immunity to noise in ECG signals.
3.1. Algorithm 1
Algorithm 1 has been designed to address the requirements of low-power and real-time operations for use in mobile and wearable applications. The algorithm’s two main processing blocks, preprocessing and dynamic thresholding, have been designed to minimize necessary computational resources and power consumption (Figure 1). The preprocessing block consists of three consecutive operations performed on the input digital ECG signal: differentiation, the moving window average, and squaring. The resultant feature signal is fed to the thresholding block, which works in sequence in three states. In State 1, the algorithm searches for the maximum value of the feature signal within a window of fixed length (260 ms). The time instant when the feature signal reaches its maximum is marked as an R-peak temporal location. State 2, following State 1, is a 200 ms wait from the R-peak detection. During State 3, the dynamic threshold is decreased exponentially with time until it reaches the value of the feature signal. State 3 is then terminated and the algorithm moves to State 1, the search for the maximum value of the feature signal. The threshold initial value in State 3 is adaptive and dependent on the average amplitude of all previously found R-peaks.
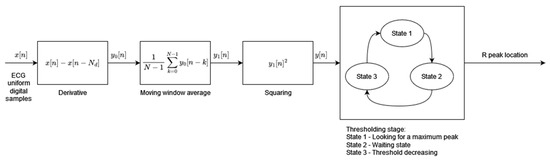
Figure 1.
Algorithm 1 block diagram based on [1].
3.2. Algorithm 2
Algorithm 2 has been designed to achieve the low computational complexity and high energy efficiency needed for mobile and portable applications. The preprocessing stage consists of two parallel signal processing paths (Figure 2). Both paths include the high-pass moving average filters but with different cutoff frequencies followed by a rectification operation. The moving average window lengths Nlong and Nshort define the cutoff frequencies of the filters. The outputs of the parallel processing paths are the inputs to the decision block. The preprocessed signal u[n], after high-pass filtering with a higher cutoff frequency (moving average window length Nshort), is used to decide when to start the QRS search window. During the search window of a fixed 200 ms length, the preprocessed signal of the other path y[n] after high-pass filtering with a lower cutoff frequency (moving average window length NLong) is analyzed in order to find its maximum value. The time instant of the maximum value of the y[n] signal is classified as an R-peak occurrence. The decision block of the algorithm works in three states: (1) identification of the search window, (2) detection of the R-peak by maximum y[n] value search, and (3) waiting state after R-peak occurrence. The threshold necessary to identify the search window is adaptive and its value is calculated based on the amplitude of the last R-peak and the previous threshold value.
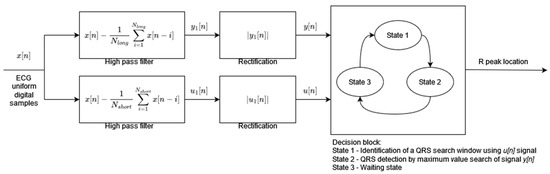
Figure 2.
Algorithm 2 block diagram based on [2].
3.3. Algorithm 3
Algorithm 3 [3] is based on modified level-crossing sampling, which belongs to event-triggered sampling schemes [33]. The input to the algorithm is the analog ECG signal (instead of the digital ECG used for the other algorithms analyzed in this paper). In the level-crossing sampling, the analog input range is divided into 2M − 1 levels (where M is the sampling resolution) and the sample is taken only when the input signal crosses one of the levels. The level-crossing analog-to-digital converter (LC-ADC) used in this algorithm is modified by asymmetrical hysteresis. The sample is taken only when (a) the input signal crosses the sampling level in the same direction as the last sample taken or (b) the input signal crosses kl levels in the opposite direction (where kl is the hysteresis parameter). The LC-ADC outputs the samples that are non-uniformly spaced in time. By selecting the appropriate value of kl, analysis of sample clusters (Figure 3 signal change direction DVi, Token), and their timing (Figure 3 Time Data Dti), it is possible identify the input ECG signal peaks first and, in the next processing step, identify R-peaks. There are three main processing blocks: level-crossing analog-to-digital converter (LC-ADC), peak detector, and beat detector (Figure 3). The algorithm does not use any filters (unlike other algorithms analyzed in this paper) due to the properties of the level-crossing sampling scheme adopted in the LC-ADC with hysteresis. For the purposes of algorithm analysis in this paper, the input to the algorithm is a uniformly sampled ECG signal.
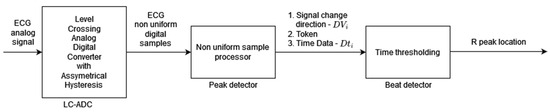
Figure 3.
Algorithm 3 block diagram based on [3]. Peak detector output signal DVi is a two-bit signal where values 00 or 11 indicate the local peak in the ECG signal; that is, the sample that is taken when the input signal crosses kl sampling levels in the opposite direction to the sample taken previously. Token is a one-bit signal indicating with “1” the moment of sampling, and Dti is an 11-bit word readout of the counter to register information about sample time (required in non-uniform sampling).
3.4. Algorithm 4
Algorithm 4, developed by Pan and Tompkins and published in 1985, is the most widely referenced QRS detector. The adaptation of the original algorithm used in this study comes from [34]. In this adaptation, the decision block is simplified, whereas the preprocessing stage uses the Butterworth filter instead of the simple moving average filter. The original ECG signal preprocessing is retained and consists of a band pass filtering, differentiation, squaring, and moving window average [4] (Figure 4). The resulting preprocessed signal is fed to the decision block where, during State 1, its first local maximum that is higher than the detection threshold is marked as the R-peak (the condition for a local maximum is where the next and the previous sample values are smaller than the sample under analysis). Each local maximum smaller than the detection threshold modifies the value of the detection threshold in line with [4]. As soon as the R-peak is found, the algorithm enters the waiting state, State 2, which is 200 ms long, and thereafter resumes the local maximum search. The parallel analysis of filtered signals with a second threshold is not applied in this implementation of the original algorithm. The modification of the feature signal threshold based on a regular and irregular heart rate, as well as the searchback mechanism, is implemented.
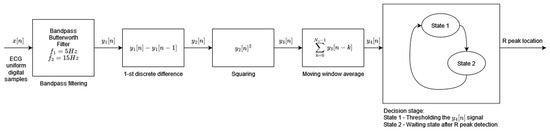
Figure 4.
Algorithm 4 block diagram based on [4].
3.5. ECG Database and Test Dataset
In the MIT-BIH AD, the QRS morphology types [35] appear with the following number of cases: N (Normal)—75052, L (Left Bundle Branch Block)—8075, R (Right Bundle Branch Block)—7259, V (Ventricular Premature Beat)—7130, P (Paced)—7028, and A (Atrial Premature Beat)—2546. These six QRS morphology patterns were selected as the most frequent in the database (107090/109494 beats, i.e., 97.8%) as well as in real recordings expected in mobile patients. Records in the MIT-BIH AD are sampled at 360 Hz, which corresponds to the sampling interval of 2.7778 ms. Throughout this paper, we use the number of samples to describe the timeline.
Noise Pattern and Noisy Test Signals
In order to evaluate the immunity to noise of the QRS detectors under analysis, we have used the first channel signal from the MIT-BIH AD and three derivate datasets. Each of the three datasets was created by adding a noise signal from the MIT-BIH NSTD multiplied by three different scaling factors to the original MIT-BIH AD. Considering the wearable application as the most expected and the omnipresence of muscle artifacts, we decided to use a “muscle artifact” (MA) record from the MIT-BIH NSTD. From a practical viewpoint, the records were made with the same sampling parameters and the same length as the ECG signal. Moreover, the noise added is point-by-point trackable, allowing for a detailed comparison of the detector’s performance at each particular heartbeat. As we used original records from the MIT-BIH AD, the intrinsic noise already present in the data is out of our control. Consequently, the investigation of QRS detectors’ behavior in the presence of noise refers to “original” and not “noise-free” ECGs, and the relative signal-to-noise ratio (SNR) has been calculated based on the average power factor of the original record Ps (MIT-BIH AD) and added noise pattern Pn (MIT-BIH NSD record MA):
The power is calculated according to:
The following procedure has been applied to achieve the target relative SNR of 15, 7, and 3 dB. The mixing procedure for one record of the MIT-BIH AD starts with the calculation of SNR based on Equation (1), where Ps is the power factor for this MIT-BIH AD record and Pn is the power factor for the MIT-BIH NSTD record MA. The result is existing SNR (eSNR). Next, to calculate k (scaling factor), the target noise level (tSNR; for example, 3 dB) is input to Equation (3). The square root in Equation (3) is due to the fact that the amplitude ECGtest and ECGorig ratio is the square root of the power ratio. Once the scaling factor k is calculated, the test dataset ECGtest is calculated according to Equation (4), where MA is the MIT-BIH NSTD record MA. This procedure is repeated for all MIT-BIH AD records for all three (15, 7, 3 dB) noise-test datasets.
The process of adding noise to example record 121 of the MIT-BIH AD is illustrated in Figure 5 and Figure 6 below.
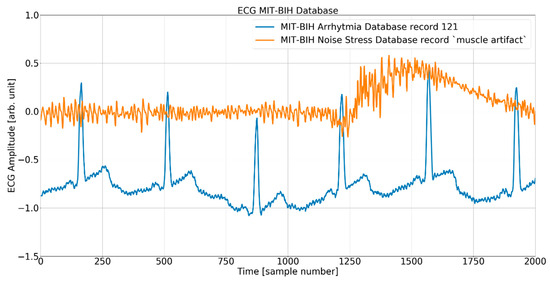
Figure 5.
The ECG (excerpt of record 121 from the MIT-BIH AD) and noise (excerpt of record MA (muscle artifact) from the MIT-BIH NSTD) before the mixing procedure.
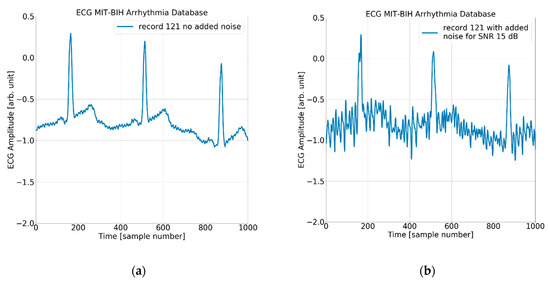
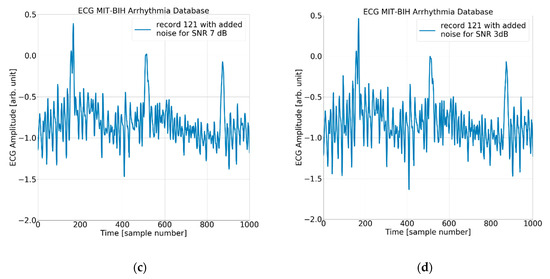
Figure 6.
The ECG (excerpt of record 121 from the MIT-BIH AD) with (a) no added noise, (b) added noise for SNR = 15 dB, (c) added noise for SNR = 7 dB, and (d) added noise for SNR = 3 dB.
4. Results
The investigation of the QRS detection accuracy of four QRS detectors was performed separately for the six most frequent beat morphologies, five arbitrarily selected values of detection temporal tolerance, and four true-to-life levels of noise mixed with the database records. The amount of data to analyze and present is sizeable. Therefore, we present the following:
- statistics of the results in Table 1, Table 2 and Table 3, and the mean and standard deviation of TP/TB,
 Table 1. QRS detectors’ accuracy is expressed as the true-positive-to-total-beats ratio for various DTT values. The mean value and the standard deviation of the true-positive-to-total-beats ratio are computed for all six considered QRS morphology types and all four levels of added noise. The best results are highlighted in bold.
Table 2. QRS detectors’ accuracy is expressed as the true-positive-to-total-beats ratio for various heartbeat morphology types. The mean value and the standard deviation of the true-positive-to-total-beats ratio are computed for all five considered DTT values and all four levels of added noise. The best results are highlighted in bold.
Table 3. QRS detectors’ accuracy is expressed as the true-positive-to-total-beats ratio for various added noise levels. The mean value and the standard deviation of the true-positive-to-total-beats ratio are computed for all six considered QRS morphology types and all five considered DTT values. The best results are highlighted in bold.
Table 1. QRS detectors’ accuracy is expressed as the true-positive-to-total-beats ratio for various DTT values. The mean value and the standard deviation of the true-positive-to-total-beats ratio are computed for all six considered QRS morphology types and all four levels of added noise. The best results are highlighted in bold.
Table 2. QRS detectors’ accuracy is expressed as the true-positive-to-total-beats ratio for various heartbeat morphology types. The mean value and the standard deviation of the true-positive-to-total-beats ratio are computed for all five considered DTT values and all four levels of added noise. The best results are highlighted in bold.
Table 3. QRS detectors’ accuracy is expressed as the true-positive-to-total-beats ratio for various added noise levels. The mean value and the standard deviation of the true-positive-to-total-beats ratio are computed for all six considered QRS morphology types and all five considered DTT values. The best results are highlighted in bold. - the plot for each algorithm in Figure 7, Figure 8, Figure 9 and Figure 10, presenting 120 data points for each algorithm, with data points calculated from totals of detailed results,
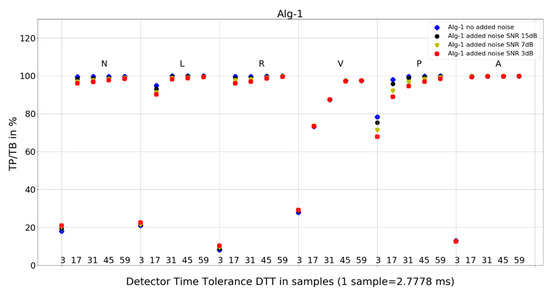 Figure 7. Performance of Algorithm 1 in relation to QRS beat morphology (upper long horizontal axis), DTT values (in samples, bottom short horizontal axes), and added noise level (dot shape and color).
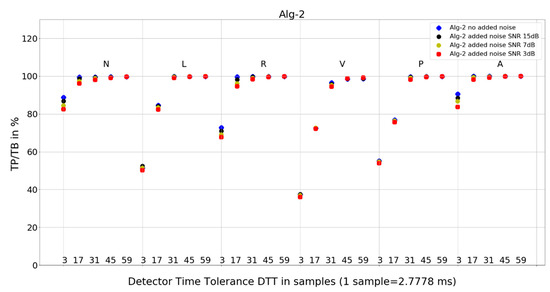 Figure 8. Performance of Algorithm 2 in relation to QRS beat morphology (upper long horizontal axis), DTT values (in samples, bottom short horizontal axes), and added noise level (dot shape and color).
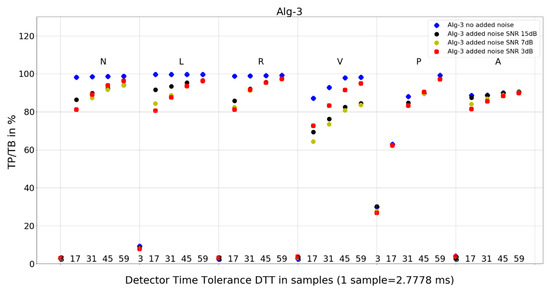 Figure 9. Performance of Algorithm 3 in relation to QRS beat morphology (upper long horizontal axis), DTT values (in samples, bottom short horizontal axes), and added noise level (dot shape and color).
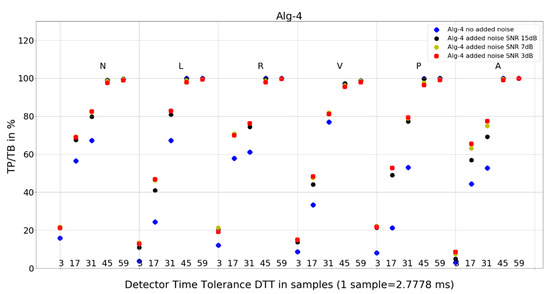 Figure 10. Performance of Algorithm 4 in relation to QRS beat morphology (upper long horizontal axis), DTT values (in samples, bottom short horizontal axes), and added noise level (dot shape and color).
 - and 8 tables from 120 tables, with detailed results for individual records and totals for a given set of DTT, four noise levels, and QRS morphology (Table 4, Table 5, Table 6, Table 7, Table 8, Table 9, Table 10 and Table 11).
Table 4. Results for Algorithm 1, N-type morphology beats and DTT = 3 (8.33 ms), from the MIT-BIH AD. Improvements in results are marked in bold. Records 107, 109, 111, 118, 124, 207, 214, and 232 are not shown, as there are no N-type morphology beats in those records.
Table 5. Results for Algorithm 1, N-type morphology beats and DTT = 17 (47.22 ms), from the MIT-BIH AD. Improvements in results are marked in bold. Records 107, 109, 111, 118, 124, 207, 214, and 232 are not shown, as there are no N-type morphology beats in those records.
Table 6. Results for Algorithm 2, N-type morphology beats and DTT = 3 (8.33 ms), from the MIT-BIH AD. Improvements in results are marked in bold. Records 107, 109, 111, 118, 124, 207, 214, and 232 are not shown, as there are no N-type beats in those records.
Table 7. Results for Algorithm 2, N-type morphology beats and DTT = 17 (47.22 ms), from the MIT-BIH AD. Records 107, 109, 111, 118, 124, 207, 214, and 232 are not shown, as there are no N-type beats in those records.
Table 8. Results for Algorithm 3, N-type morphology beats and DTT = 3 (8.33 ms), from the MIT-BIH AD. Improvements in results are marked in bold. Records 107, 109, 111, 118, 124, 207, 214, and 232 are not shown, as there are no N-type morphology beats in those records.
Table 9. Results for Algorithm 3, N-type morphology beats and DTT = 17 (47.22 ms), from the MIT-BIH AD. Improvements in results are marked in bold. Records 107, 109, 111, 118, 124, 207, 214, and 232 are not shown, as there are no N-type morphology beats in those records.
Table 10. Results for Algorithm 4, N-type morphology beats and DTT = 3 (8.33 ms), from the MIT-BIH AD. Improvements in results are marked in bold. Records 107, 109, 111, 118, 124, 207, 214, and 232 are not shown, as there are no N-type morphology beats in those records.
Table 11. Results for Algorithm 4, N-type morphology beats and DTT = 17 (47.22 ms), from the MIT-BIH AD. Improvements in results are marked in bold. Records 107, 109, 111, 118, 124, 207, 214, and 232 are not shown, as there are no N-type morphology beats in those records.
4.1. Statistics of the QRS Detectors’ Performance
With four independent variables (detector number, DTT, QRS morphology type, and added noise level), one can build a total of 16 statistical analyses. We selected the three most representative statistical analyses for independent studies of the detectors’ performance and vulnerability to DTT, QRS morphology type, and added noise level. Table 1 summarizes statistics on TP/TB for each algorithm (columns) and each tolerance window length (rows) for various DTT values, while the mean value and standard deviation are calculated for all QRS morphology types and added noise levels.
Table 2 presents statistics on TP/TB for each QRS morphology type (rows), while the mean value and standard deviation are calculated for all DTT values and noise levels. This table represents the detection quality and its independence from the QRS morphology, which is unknown at the time of detection.
Table 3 presents statistics on TP/TB for each algorithm (columns) and each noise level tested (rows), while the mean value and standard deviation are calculated for all QRS morphology types and DTT values. This table helps to explore which algorithm is the best and which gives the most stable detection results in the presence of noise.
4.2. Plots of the Detectors’ Performance
5. Discussion
5.1. Influence of Noise
While planning the experimental work, the expectation was that, with increasing levels of noise the TP/TB results would deteriorate. When we analyze the average TP/TB results in Table 3, we can conclude that the expectations are fulfilled for Algorithm 1, Algorithm 2, and Algorithm 3 but not for Algorithm 4.
The average TP/TB (Table 3) results for increased levels of noise are in the following range for no added noise to maximum added noise SNR = 3 dB, respectively:
- Algorithm 1—83.72% and 82.12%,
- Algorithm 2—90.68% and 89.18%,
- Algorithm 3—77.12% and 71.74%,
- and Algorithm 4—62.03% and 70.43%; there is no deterioration, but an improvement of 8.4% with added noise.
For Algorithm 1, the improvement in average TP/TB with increased level of added noise has not been observed (Table 3). Turning the analysis of Algorithm 1 to not-averaged TP/TB data (Figure 7), we can observe that, for DTT 8.33 ms (three samples) QRS morphology types N, L, R, and V, there is an improvement in TP/TB with increased added noise level for several records. Looking into details (Table 4) for QRS morphology of N type, DTT 8.33 ms (three samples), the TP/TB results for added noise 15 dB, 7 dB, and 3 dB are improved compared with records with no added noise for the following records: 103, 106, 112, 113, 115, 117, 119, 122, 123, 200, 201, 202, 203, 208, 210, 213, 219, 220, 221, 233, and 234 (Table 4). It constitutes results for over 50% of the records (21 from 40 records with N-type QRS morphology). The biggest improvement is registered for record 122. For greater values of DTT and N-type beats with this algorithm, there are no improvements in TP/TB (Figure 7); detailed results for DTT 47.22 ms (17 samples) are shown in Table 5.
For Algorithm 2, an improvement in average TP/TB with an increased level of added noise has not been observed (Table 3). As can be seen in the detailed data for N-type QRS morphology and DTT 8.33 ms (three samples) in Table 6, there is only one case of TP/TB improvement, for record 230. The improvement in TP results for no added noise versus added noise of 15, 7, and 3 dB are 86, 156, and 196, respectively.
For Algorithm 3, the improvement in average TP/TB with an increased level of added noise has not been observed (Table 3). When analyzing Algorithm 3 results for not-averaged TP/TB data (Figure 9), the improvement of TP/TB with an increased level of added noise is revealed for QRS morphology type V for all values of DTT. Analysis of the results for N-type QRS morphology (Table 8 and Table 9) reveals that, for DTT 8.33 ms (three samples), there is improvement in totals, whereas for DTT 47.22 ms (17 samples), there is no improvement in totals (only in a few selected records).
For Algorithm 4, the improvement in average TP/TB with an increased level of added noise has been observed (Table 3). Looking into details (Table 10) for QRS morphology of N-type, DTT 8.33 ms (three samples), the TP/TB results for added noise 15 dB, 7 dB, and 3 dB are improved for 35 out of 40 records. The improvement is not revealed for records 105, 119, 121, 122, and 212. For DTT 47.22 ms (17 samples), the improvement is revealed for 30 out of 40 records. The improvement is not revealed for the following records: 100, 105, 106, 119, 121, 122, 212, 222, 228, and 231.
Why do TP/TB results for Algorithm 4 not deteriorate with increased levels of noise? When we look into detailed data in Table 10, TP/TB results for N-type QRS morphology, and DTT 8.33 ms (three samples), the improvement in TP/TB with increasing levels of noise can be observed for 30 out of 40 records. Similar improvements of results are revealed for DTT 47.22 ms (17 samples) and can be observed in Table 11. Why do TP/TB results improve with added noise? Our hypothesis is that it is related to Algorithm 4 higher computational complexity being reflected in more calculations and processing blocks in computation. Thus, the hypothesis is that adding noise to the input ECG signal reduces friction between the blocks of computation. The phenomena of reduction of error from sticky moving parts in mechanical computers used to perform navigation and bomb trajectory calculations are cited as the first observation and purposeful use of dither [36]. In analog-to-digital conversion, dither—purposeful distortion to the input signal—causes digitization error to behave well statistically (dithered quantization) [7,8].
In summary, by adding muscular noise, we expected a deterioration of the detectors’ performance. Surprisingly, our results show that this is not always the case. For Algorithm 4, there is general improvement visible in averaged TP/TB data and confirmed in detailed data. For other algorithms, general improvement in averaged TP/TB has not been observed. Still, the phenomena of TP/TB improvement with added noise are present, although on a smaller scale for other algorithms (namely for specific QRS morphologies, DTT values, or individual records).
5.2. Influence of Detector Time Tolerance DTT
While planning the experimental work, the expectation was that increasing DTT would improve the TP/TB results. This assumption was additionally supported by results of one-dimensional analysis of DTT influence on TP in [10].
When we analyze the results in Table 1, we can see that results confirm the expectation for all algorithms and all DTT values under analysis. The average TP/TB results calculated over all added noise and QRS morphologies achieved for the lowest DTT 8.33 ms (three samples) and highest DTT 163.89 ms (59 samples), respectively, are:
- Algorithm 1—27.54% and 99.25%,
- Algorithm 2—65.75% and 99.71%,
- Algorithm 3—8.26% and 94.80%,
- and Algorithm 4—14.30% and 99.46%.
The following are additional observations from the analysis of plots (Figure 7, Figure 8, Figure 9 and Figure 10) for all algorithms:
- Algorithm 1 for QRS morphologies N, L, R, P, and A, with the exception of DTT 8.33 ms (three samples), reveals TP/TB of more than 90%. For QRS morphology type V, the TP/TB results are below 90% for all DTT ≤ 125 ms (45 samples). For DTT 8.33 ms (three samples), for all QRS morphologies, the TP/TB results are below 30%.
- Algorithm 2 results of TP/TB for all DTT and for QRS morphology N and A are above 80%. For L-, R-, V- and P-type QRS morphologies, the TP/TB results are above 90% for DTT > 86.11 ms (31 samples).
- Algorithm 3 TP/TB results for DTT 8.33 ms and for all QRS morphologies are below 30%, and for other higher DTT values, there is a clear deterioration of TP/TB results with decreasing DTT. For all QRS morphologies TP/TB is above 90% only for DTT 125 ms and 163.89 ms (45 and 59 samples).
- Algorithm 4 TP/TB results for all QRS morphologies are above 90% only for DTT 125 ms and 163.89 ms (45 and 59 samples). Results for other values of DTT clearly deteriorate well below 80% with decreasing DTT value.
In summary, decreasing DTT causes deterioration of TP/TB with varying ratios dependent on algorithm, QRS morphology, and added noise level.
5.3. Influence of QRS Morphology
While planning the experimental work, the expected result was that, depending on the algorithm, certain QRS morphologies are more difficult for precise R-peak detection than other QRS morphologies. During the analysis of average TP/TB results in Table 2, we observed that the aforementioned expectation is fulfilled for all algorithms.
On closer analysis of the range of TP/TB results from worst to best in Table 2, we can observe the following range of TP/TB results for algorithm and QRS morphology, respectively:
- Algorithm 1 from 76.92% for V to 92.52% for P,
- Algorithm 2 from 80.51% for V to 97.24% for A,
- Algorithm 3 from 67.29% for V to 76.47% for L,
- and Algorithm 4 from 65.38% for L to 72.28% for N.
We can conclude that, for the four algorithms under analysis, the most difficult in precise R-peak location was V-type QRS morphology for three algorithms and L-type for one algorithm. In terms of the easiest QRS morphology type for precise R-peak location, it is different for each algorithm under analysis and yields P-, A-, L-, and N-types of QRS morphology.
Visual analysis of the TP/TB results displayed in plots (Figure 7, Figure 8, Figure 9 and Figure 10) in a direction to reveal any visual similarities in locations of the data points for various QRS morphologies is presented below for algorithm and QRS morphology, respectively:
- Algorithm 1 for N, R, and A—similar locations; for L, V, and P, each type—different locations,
- Algorithm 2 for N, R, and A—similar locations; for L, V, and P—similar locations,
- Algorithm 3 for N, L, and R—similar locations; for V, P, and A, each type—different locations,
- and Algorithm 4 for N, R, and A—similar locations; for L, V, and P—similar locations.
In summary, the most difficult and easiest QRS morphology type for accurate R-peak detection by a given detection algorithm is specific for that algorithm. The worst and best TP/TB results for all levels of noise in ECG signal and all DTT values under analysis are also specific for each algorithm.
5.4. Comparison of the Algorithms Studied
It is evident that a high-performance QRS detector should demonstrate a high TP/TB ratio even with low DTT. Therefore, a series of QRS detection instants may reliably be used by following procedures such as heart rate variability. In this aspect, all atrial premature, blocked, paced, and ventricular beats are not considered as representative to cardiac cycle control from the autonomous nervous system. Consequently, the precision of N-type QRS detection is more important than other types of beat morphology. At the same time, the high stability of the detection point sequence (that is, its independence from QRS morphology) is a desired algorithm feature. Lastly, an algorithm’s detection robustness to noise is very important, especially for mobile and wearable applications, as the level of noise is high and fluctuates depending on the environment and human activity.
Algorithm 1 and Algorithm 2 demonstrate good robustness to noise in ECG signal (Table 3, Figure 7 and Figure 8), whereas the QRS detection accuracy for Algorithm 3 and Algorithm 4 for noisy ECG signal is significantly worse. Additionally, the detection accuracy strongly drops with noise level, which makes the Algorithm 3 and Algorithm 4 not suitable for implementation in wearable ECG devices.
Algorithm 2 has a good detection accuracy even for low temporal tolerances (DTT = 3), except for V-type beats it has a TP/TB score over 50%, and for DTT = 17, it grows over 93% except for types L and V. This is a clinically acceptable detection ratio for remote cardiac rhythm detection and, as our results show, can be achieved with a temporal accuracy of 47.22 ms (17 samples).
Algorithm 1 and Algorithm 3 work well for DTT ≥ 47.22 ms (17 samples); TP/TB exceeds 90%, except for QRS types V for Algorithm 1 and Algorithm 3, and P for Algorithm 3, but its performance drops for low temporal tolerance (DTT 8.33 ms, three samples). Compared with Algorithm 1, Algorithm 2, and Algorithm 3, which were developed in the last decade, Algorithm 4, developed in 1985 and broadly referenced in the literature on QRS detection, is more sensitive to noise (Figure 10) and QRS morphology. It achieves satisfactory detection accuracy only for large DTT values.
Algorithm 1 (Figure 7) shows perfect noise immunity for V-type QRS morphology and high noise immunity for other beat types. For low noise levels, it has similar scores to Algorithm 3 (Figure 9), except for P morphology, where it is, again, significantly better.
Adding noise improves the results of Algorithm 3 in V-type morphology, and for high DTT also in N-type QRS morphology. This is also observed in Algorithm 4 (Figure 10), where, in most cases, red dots (SNR = 3 dB) are not the lowest data points in the plot.
5.5. Limitations of the Study and Future Research
A lack of computational complexity analysis may be considered as the main limitation of our study. Although the number of elementary operations for each algorithm and the growth of resource demand related to input size can be easily determined, preferences in this aspect depend on the target platform. The hardware architecture (e.g., multicore processors, vector data processing) and machine representation of data determine principal usability factors, such as maximum time of autonomy or the necessary size of battery, particularly in wearable recorders.
Another limitation of our study is the use of the MIT-DIH Arrhythmia Database, which is relatively sparsely sampled (sampling frequency 360 Hz) and known for annotation errors. In fact, the position of the maximum of the signal depends on the ECG lead used (each lead “sees” the spatial electrical phenomenon of heartbeat from a different viewpoint) and the true QRS maximum (i.e., precise R-peak) position can only be estimated from vectorcardiography. Moreover, in all cases, the sampling process is in no way synchronized with heart action. Consequently, the maximum falls between samples, and calculation of its true position requires interpolation. Nevertheless, we assume that possible annotation errors are rare and equally distributed before and after the true positions of R-peaks. This may result in an overestimation of the standard deviation results, but with no effect on the mean results of the algorithms.
The above two limitations will be addressed in future research, as will be the analysis of the sources of improvement in TP/TB results under conditions of added noise, as discussed in Section 5.1.
6. Conclusions
This study focused on the performance evaluation of QRS detectors aware of temporal accuracy and the presence of noise. Contrarily to most authors, satisfied with detection correctness as the sole quality indicator, we propose multidimensional criteria, including
- accuracy (i.e., TP/TB),
- precision of detection point location, i.e., TP/TB dependence on the DTT,
- sensitivity to noise,
- and sensitivity to QRS morphology.
To show the multidimensional method for QRS detectors’ evaluation of temporal accuracy, we compared three modern QRS detection algorithms and a well-known, commonly referenced Pan–Tompkins algorithm originating from the pioneer age of computerized electrocardiography.
The main scientific contribution of this work lies in testing QRS detectors in multiple dimensions, including various time tolerance values (DTT), which determines the detection statistics expressed by true positive, false positive, and false negative detection cases. Algorithms that demonstrate good accuracy with low values of DTT are the most precise algorithms. Output from such algorithms is immediately usable for subsequent ECG processing procedures such as HRV analysis or QRS morphology classification. Moreover, we observed that the accuracy of QRS detection depends on QRS morphology. Tests performed for various levels of added muscular noise revealed that there are significant differences between algorithms with respect to their noise robustness. High robustness amid noise (stable detection accuracy in noisy ECG recordings) is important in mobile and wearable applications in unstable conditions (e.g., in motion).
Author Contributions
Conceptualization, W.R. and P.A.; methodology, W.R. and P.A.; software, W.R. and M.M.; validation, P.A.; formal analysis, M.M.; investigation, W.R. and P.A.; resources, W.R. and P.A.; data curation, W.R.; writing—original draft preparation, W.R. and P.A.; writing—review and editing, W.R., M.M. and P.A.; visualization, W.R.; supervision, P.A.; project administration, M.M.; funding acquisition, P.A. and M.M. All authors have read and agreed to the published version of the manuscript.
Funding
This research was funded by AGH University of Krakow in 2023 and 2024 as research project no. 16.16.120.773, and by the National Science Centre of Poland under research project DEC-2018/31/B/ST7/03874.
Institutional Review Board Statement
Not applicable, no ethical issues, only public database used as study materials.
Informed Consent Statement
Not applicable, no human-acquired data, only public database used as study materials.
Data Availability Statement
Not applicable, data used are already available as public database.
Conflicts of Interest
The authors declare no conflicts of interest. The funders had no role in the design of the study, in the collection, analyses, or interpretation of data, in the writing of the manuscript, or in the decision to publish the results.
References
- Gutiérrez-Rivas, R.; Garcia, J.J.; Marnane, W.P.; Hernández, A. Novel real-time low-complexity QRS complex detector based on adaptive thresholding. IEEE Sens. J. 2015, 15, 6036–6043. [Google Scholar] [CrossRef]
- Reklewski, W.; Heryan, K.; Miśkowicz, M.; Augustyniak, P. Real time ECG R-peak detection by extremum sampling. In Proceedings of the 2020 IEEE 6th International Conference on Event-Based Control, Communication, and Signal Processing (EBCCSP), Krakow, Poland, 23–25 September 2020; pp. 1–7. [Google Scholar]
- Ravanshad, N.; Rezaee-Dehsorkh, H.; Lotfi, R.; Lian, Y. A level-crossing based QRS-detection algorithm for wearable ECG sensors. IEEE J. Biomed. Health Inform. 2013, 18, 183–192. [Google Scholar] [CrossRef]
- Pan, J.; Tompkins, W.J. A real-time QRS detection algorithm. IEEE Trans. Biomed. Eng. 1985, 3, 230–236. [Google Scholar] [CrossRef]
- Moody, G.B.; Mark, R.G. The MIT-BIH arrhythmia database on CD-ROM and software for use with it. IEEE Comput. Cardiol. Proceed. 1990, 2, 185–188. [Google Scholar]
- Moody, G.; Muldrow, W.; Mark, R. The MIT-BIH noise stress test database. Comput. Cardiol. 1984, 11, 381–384. [Google Scholar]
- Carbone, P.; Narduzzi, C.; Petri, D. Dither signal effects on the resolution of nonlinear quantizers. IEEE Trans. Instrum. Meas. 1994, 43, 139–145. [Google Scholar] [CrossRef]
- Gray, R.M.; Stockham, T.G. Dithered quantizers. IEEE Trans. Inf. Theory 1993, 39, 805–812. [Google Scholar] [CrossRef]
- Kohler, B.U.; Hennig, C.; Orglmeister, R. The principles of software QRS detection. IEEE Eng. Med. Biol. Mag. 2002, 21, 42–57. [Google Scholar] [CrossRef] [PubMed]
- Heryan, K.; Reklewski, W.; Szaflarski, A.; Ordowski, M.; Augustyniak, P.; Miśkowicz, M. Sensitivity of QRS Detection Accuracy to Detector Temporal Resolution. In Proceedings of the 2021 IEEE Computing in Cardiology (CinC), Brno, Czech Republic, 13–15 September 2021; Volume 48, pp. 1–4. [Google Scholar]
- Tripathi, P.M.; Kumar, A.; Komaragiri, R.; Kumar, M. A review on computational methods for denoising and detecting ECG signals to detect cardiovascular diseases. Arch. Comput. Methods Eng. 2022, 29, 1875–1914. [Google Scholar] [CrossRef]
- Fariha MA, Z.; Ikeura, R.; Hayakawa, S.; Tsutsumi, S. Analysis of Pan-Tompkins algorithm performance with noisy ECG signals. In Journal of Physics: Conference Series; IOP Publishing: Bristol, UK, 2020; Volume 1532, p. 012022. [Google Scholar]
- Mohd Apandi, Z.F.; Ikeura, R.; Hayakawa, S.; Tsutsumi, S. An analysis of the effects of noisy electrocardiogram signal on heartbeat detection performance. Bioengineering 2020, 7, 53. [Google Scholar] [CrossRef]
- Zong, W.; Moody, G.B.; Jiang, D. A robust open-source algorithm to detect onset and duration of QRS complexes. Comput. Cardiol. 2003, 30, 737–740. [Google Scholar]
- Hamilton, P. Open Source ECG Analysis. Comput. Cardiol. 2002, 1, 101–104. [Google Scholar]
- D’Aloia, M.; Longo, A.; Rizzi, M. Noisy ECG signal analysis for automatic peak detection. Information 2019, 10, 35. [Google Scholar] [CrossRef]
- Gradl, S.; Leutheuser, H.; Elgendi, M.; Lang, N.; Eskofier, B.M. Temporal correction of detected R-peaks in ECG signals: A crucial step to improve QRS detection algorithms. In Proceedings of the 2015 37th Annual International Conference of the IEEE Engineering in Medicine and Biology Society (EMBC), Milan, Italy, 25–29 August 2015; pp. 522–525. [Google Scholar]
- Nallathambi, G.; Prıncipe, J.C. Integrate and fire pulse train automaton for QRS detection. IEEE Trans. Biomed. Eng. 2014, 61, 317–326. [Google Scholar] [CrossRef] [PubMed]
- Kohler, B.U.; Hennig, C.; Orglmeister, R. QRS Detection Using Zero Crossing Counts. Progress Biomed. Res. 2003, 8, 138–145. [Google Scholar]
- Elgendi, M. Fast QRS detection with an optimized knowledge-based method: Evaluation on 11 standard ECG databases. PLoS ONE 2013, 8, e73557. [Google Scholar] [CrossRef]
- Porr, B.; Macfarlane, P.W. A new QRS detector stress test combining temporal jitter and accuracy (JA) reveals significant performance differences amongst popular detectors. bioRxiv 2023, 722397. [Google Scholar] [CrossRef]
- Gusev, M.; Domazet, E. Optimizing the impact of resampling on QRS detection. In Communications in Computer and Information Science, Proceedings of the ICT Innovations 2018, Engineering and Life Sciences: 10th International Conference, ICT Innovations 2018, Ohrid, Macedonia, 17–19 September 2018; Springer International Publishing: Berlin/Heidelberg, Germany, 2018; pp. 107–119. [Google Scholar]
- Hamilton, P.S.; Tompkins, W.J. Quantitative investigation of QRS detection rules using the MIT/BIH arrhythmia database. IEEE Trans. Biomed. Eng. 1986, 12, 1157–1165. [Google Scholar] [CrossRef]
- Vollmer, M. Noise resistance of several top-scored heart beat detectors. In Proceedings of the 2017 Computing in Cardiology (CinC), Rennes, France, 24–27 September 2017; IEEE: Piscataway, NJ, USA; pp. 1–4. [Google Scholar]
- Liu, F.; Liu, C.; Jiang, X.; Zhang, Z.; Zhang, Y.; Li, J.; Wei, S. Performance analysis of ten common QRS detectors on different ECG application cases. J. Healthc. Eng. 2018, 2018, 9050812. [Google Scholar] [CrossRef]
- Gabbouj, M.; Kiranyaz, S.; Malik, J.; Zahid, M.U.; Ince, T.; Chowdhury, M.E.; Khandakar, A.; Tahir, A. Robust peak detection for holter ECGs by self-organized operational neural networks. In IEEE Transactions on Neural Networks and Learning Systems; IEEE: Piscataway, NJ, USA, 2022. [Google Scholar]
- Revanth, N.; Bennet, M.A. Detection of QRS Complexes in ECG Signal. In Proceedings of the 2023 IEEE International Conference on Integrated Circuits and Communication Systems (ICICACS), Raichur, India, 24–25 February 2023; IEEE: Piscataway, NJ, USA; pp. 1–5. [Google Scholar]
- Koka, T.; Muma, M. Fast and Sample Accurate R-Peak Detection for Noisy ECG Using Visibility Graphs. In Proceedings of the 2022 44th Annual International Conference of the IEEE Engineering in Medicine & Biology Society (EMBC), Glasgow, UK, 11–15 July 2022; IEEE: Piscataway, NJ, USA; pp. 121–126. [Google Scholar]
- Howell, L.; Porr, B. High precision ECG Database with Annotated R Peaks, Recorded and Filmed Under Realistic Conditions. 2018. [Google Scholar] [CrossRef]
- Kalidas, V.; Tamil, L. Real-time QRS detector using Stationary Wavelet Transform for Automated ECG Analysis. In Proceedings of the 2017 IEEE 17th International Conference on Bioinformatics and Bioengineering (BIBE), Washington, DC, USA, 23–25 October 2017; pp. 457–461. [Google Scholar]
- Emrich, J.; Koka, T.; Wirth, S.; Muma, M. Accelerated Sample-Accurate R-Peak Detectors Based on Visibility Graphs. In Proceedings of the 2023 31st European Signal Processing Conference (EUSIPCO), Helsinki, Finland, 4–8 September 2023; IEEE: Piscataway, NJ, USA; pp. 1090–1094. [Google Scholar]
- Chatterjee, S.; Thakur, R.S.; Yadav, R.N.; Gupta, L.; Raghuvanshi, D.K. Review of noise removal techniques in ECG signals. IET Signal Process. 2020, 14, 569–590. [Google Scholar] [CrossRef]
- Miskowicz, M. Reducing communication by event-triggered sampling. In Event-based Control and Signal Processing; CRC Press: Boca Raton, FL, USA, 2016; pp. 37–58. [Google Scholar]
- Porr, B.; Howell, L.; Stournaras, J.; Nir, Y. Popular ECG R peak detectors written in python, (1.3.3); Zenodo: Geneva, Switzerland, 2023. [Google Scholar] [CrossRef]
- Goldberger, A.; Amaral, L.A.; Glass, L.; Hausdorff, J.M.; Ivanov, P.C.; Mark, R.G.; Mietus, J.E.; Moody, G.B.; Peng, C.-K.; Stanley, H.E. PhysioBank, PhysioToolkit, and PhysioNet: Components of a new research resource for complex physiologic signals. Circulation 2000, 101, e215–e220. [Google Scholar] [CrossRef] [PubMed]
- Pohlmann, K.C. Principles of Digital Audio; McGraw-Hill Professional: New York, NY, USA, 2000. [Google Scholar]
Disclaimer/Publisher’s Note: The statements, opinions and data contained in all publications are solely those of the individual author(s) and contributor(s) and not of MDPI and/or the editor(s). MDPI and/or the editor(s) disclaim responsibility for any injury to people or property resulting from any ideas, methods, instructions or products referred to in the content. |
© 2024 by the authors. Licensee MDPI, Basel, Switzerland. This article is an open access article distributed under the terms and conditions of the Creative Commons Attribution (CC BY) license (https://creativecommons.org/licenses/by/4.0/).