
Investigation on the Integration of Low-Cost NIR Spectrometers in Mill Flour Industries for Protein, Moisture and Ash Content Estimation


Abstract
:1. Introduction
2. Materials and Methods
2.1. Low-Cost NIR Spectrometers
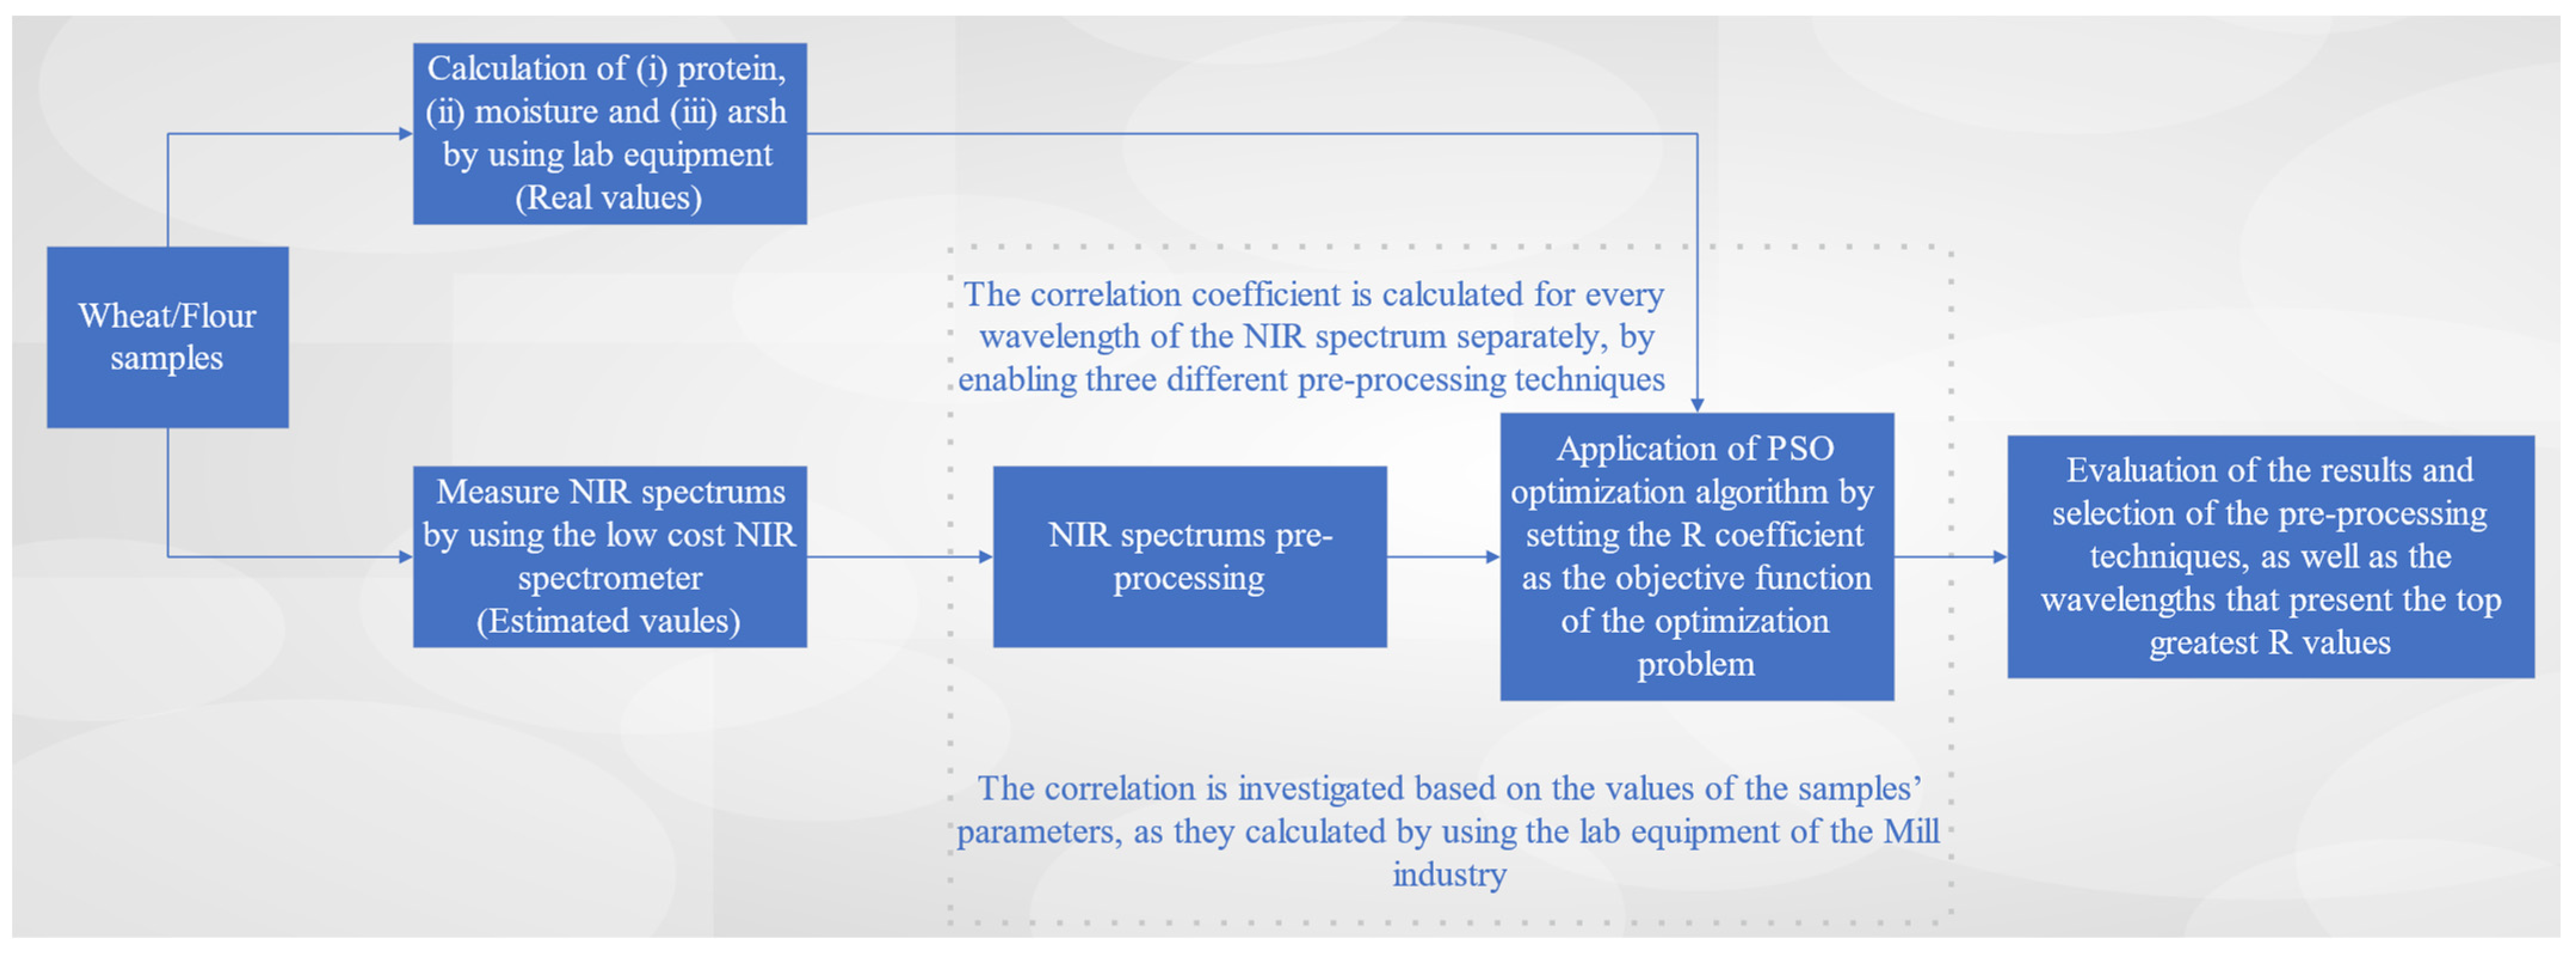
2.2. Investigation on the Effectiveness of Low-Cost Spectrometer NeoSpectra Scanner
2.3. NIR Spectrums Pre-Processing
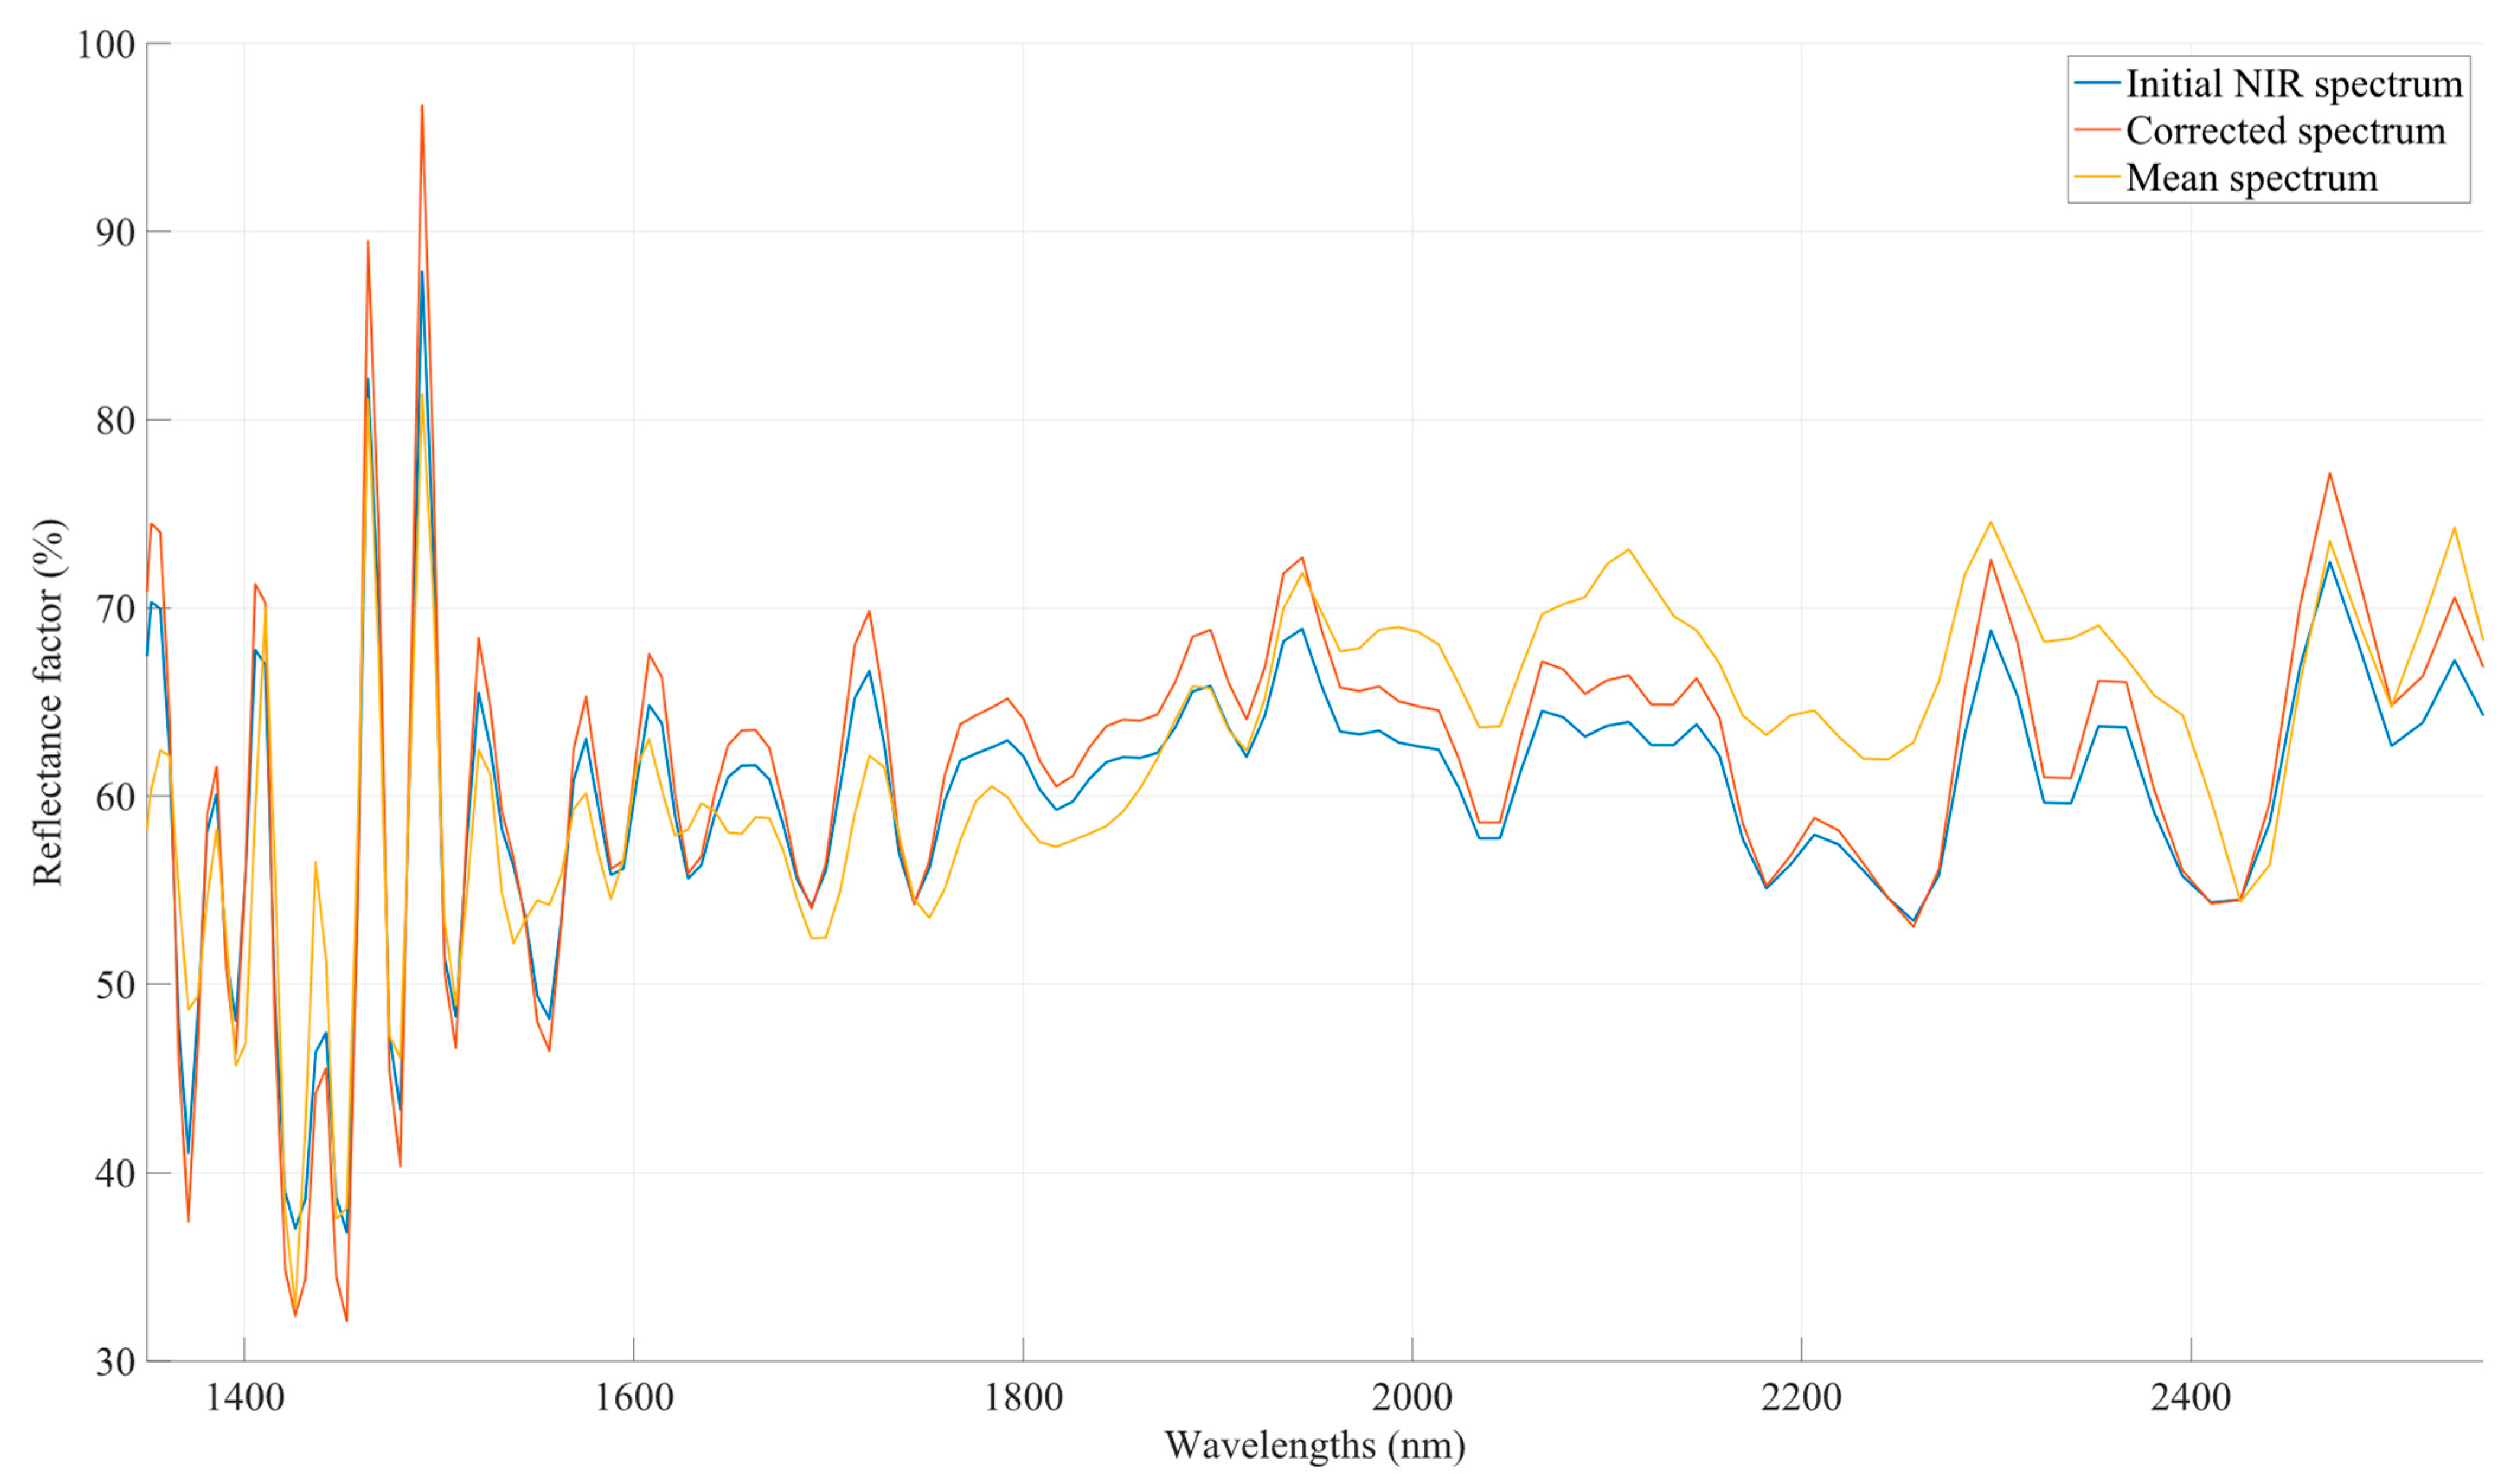
2.3.1. Multiplicative Scatter Correction
2.3.2. First Derivatives
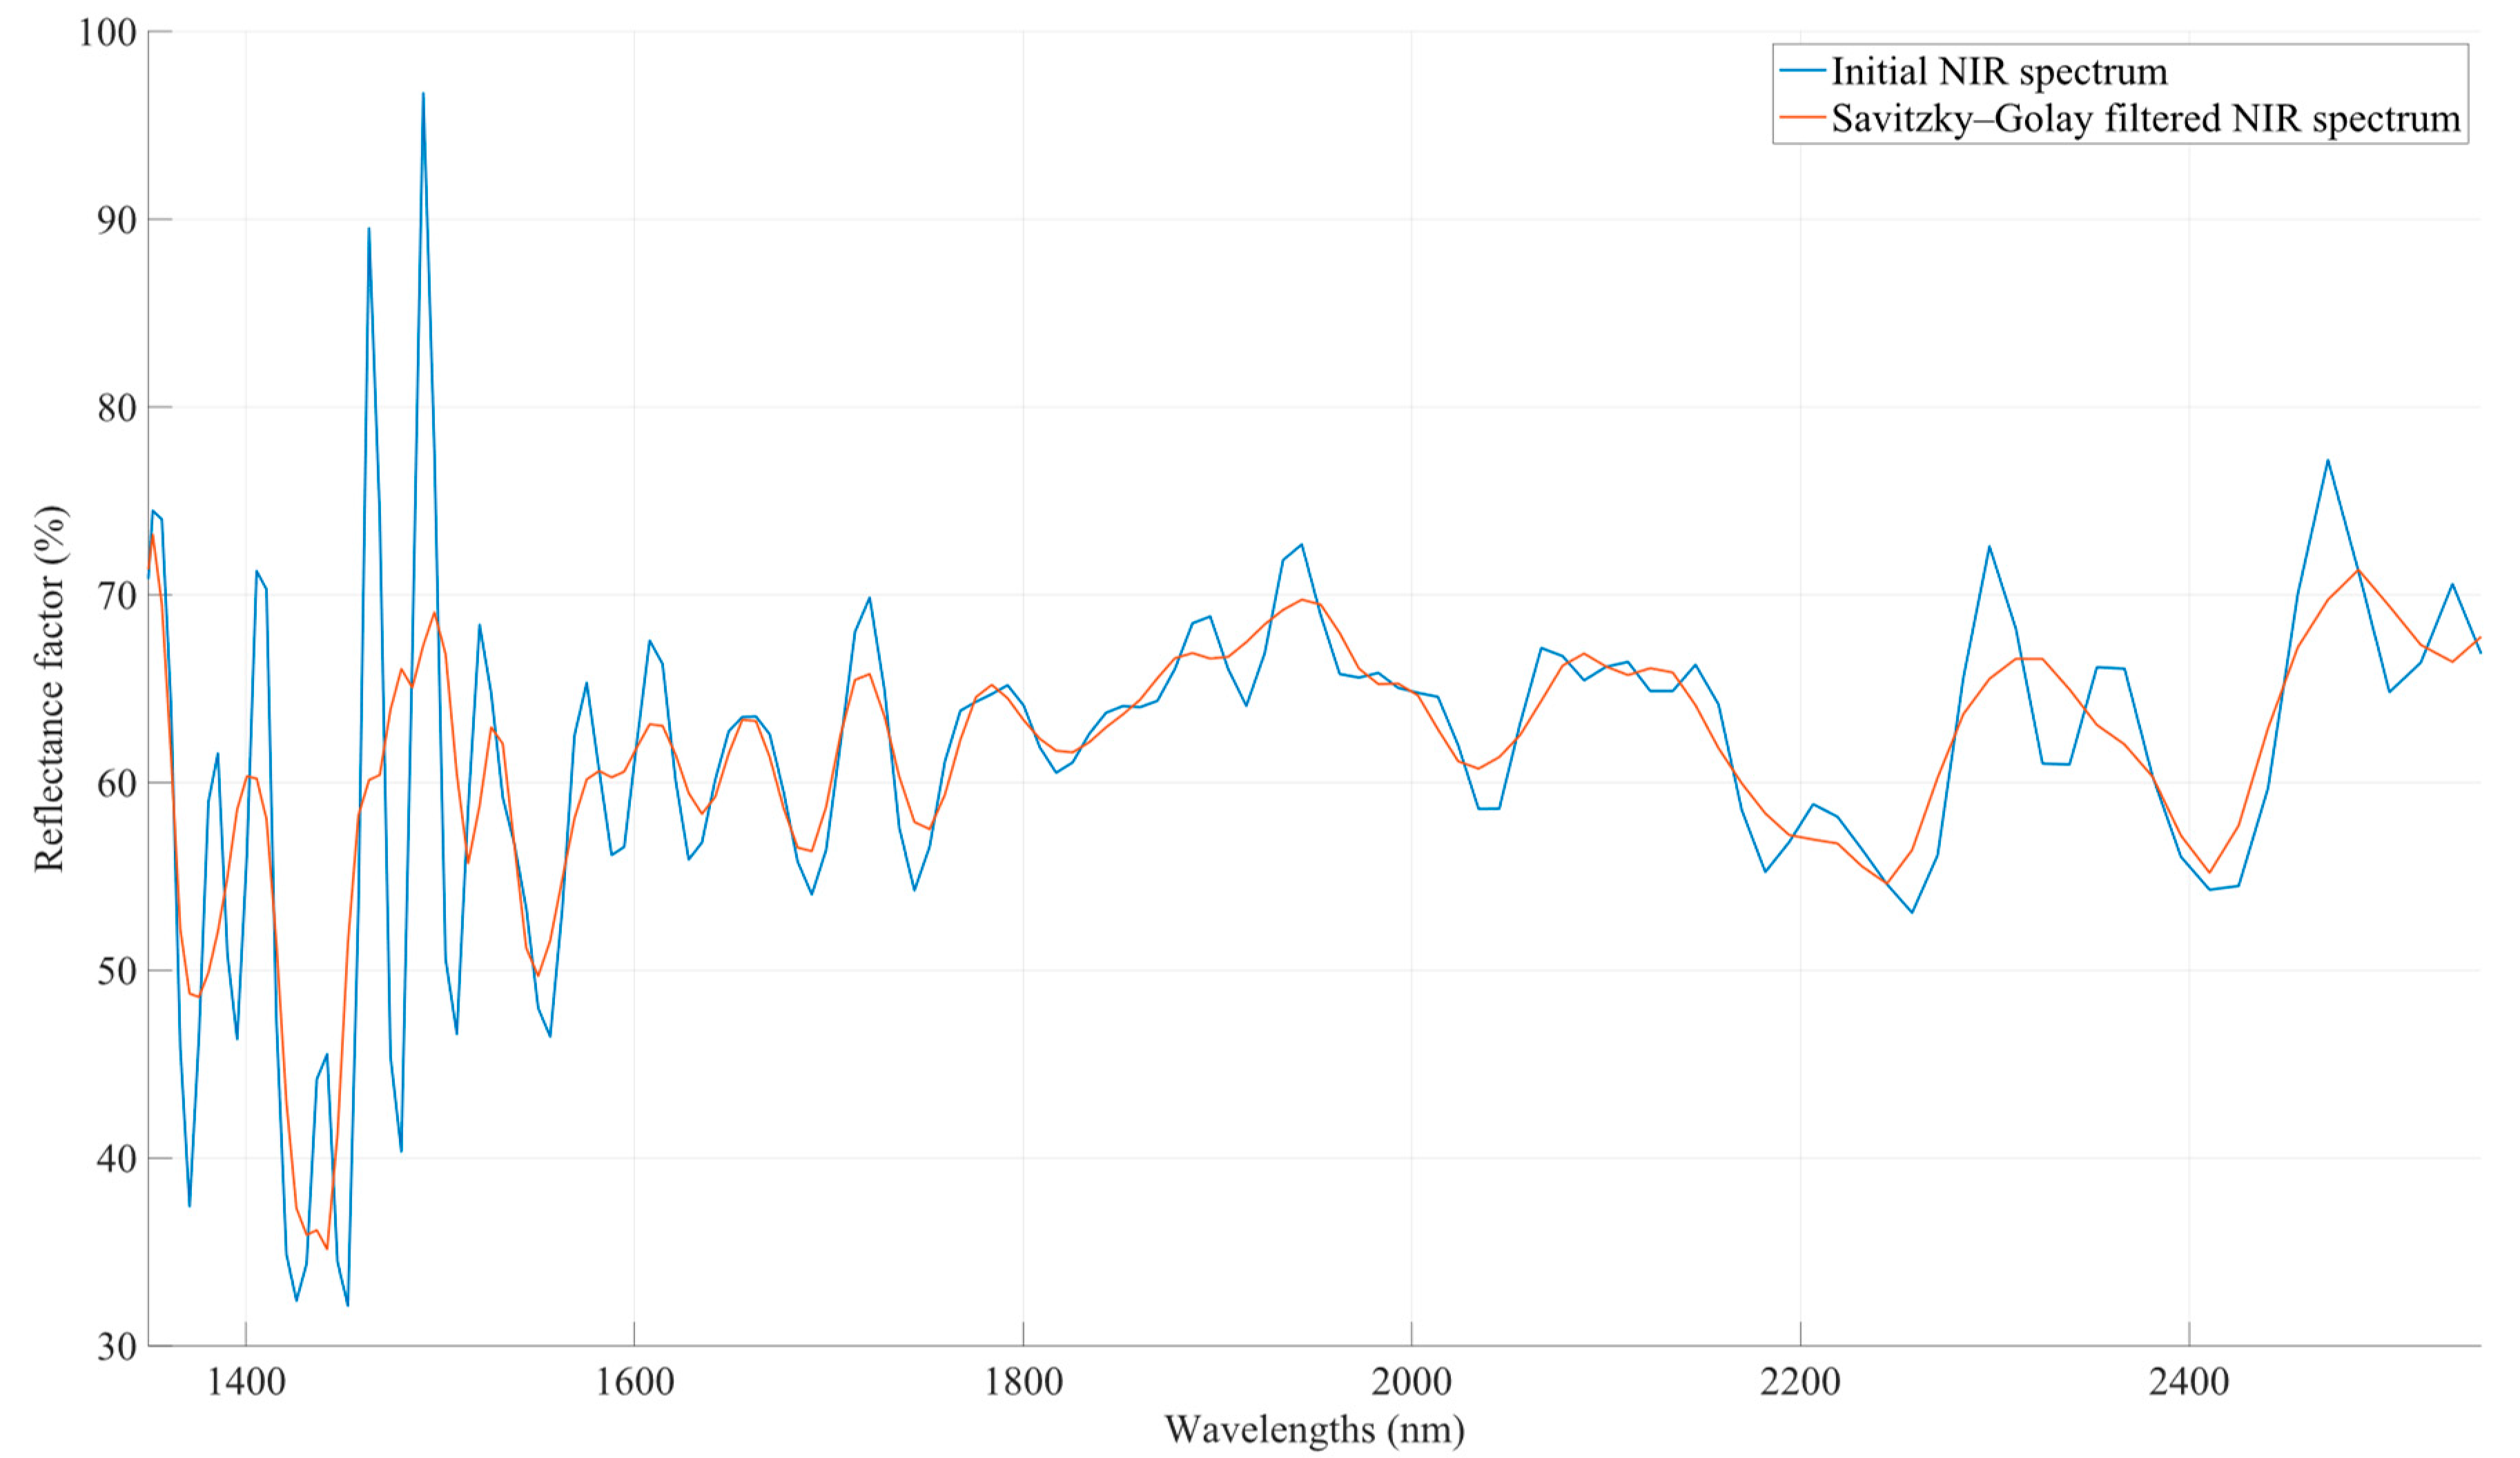
2.3.3. Smooth Filtering
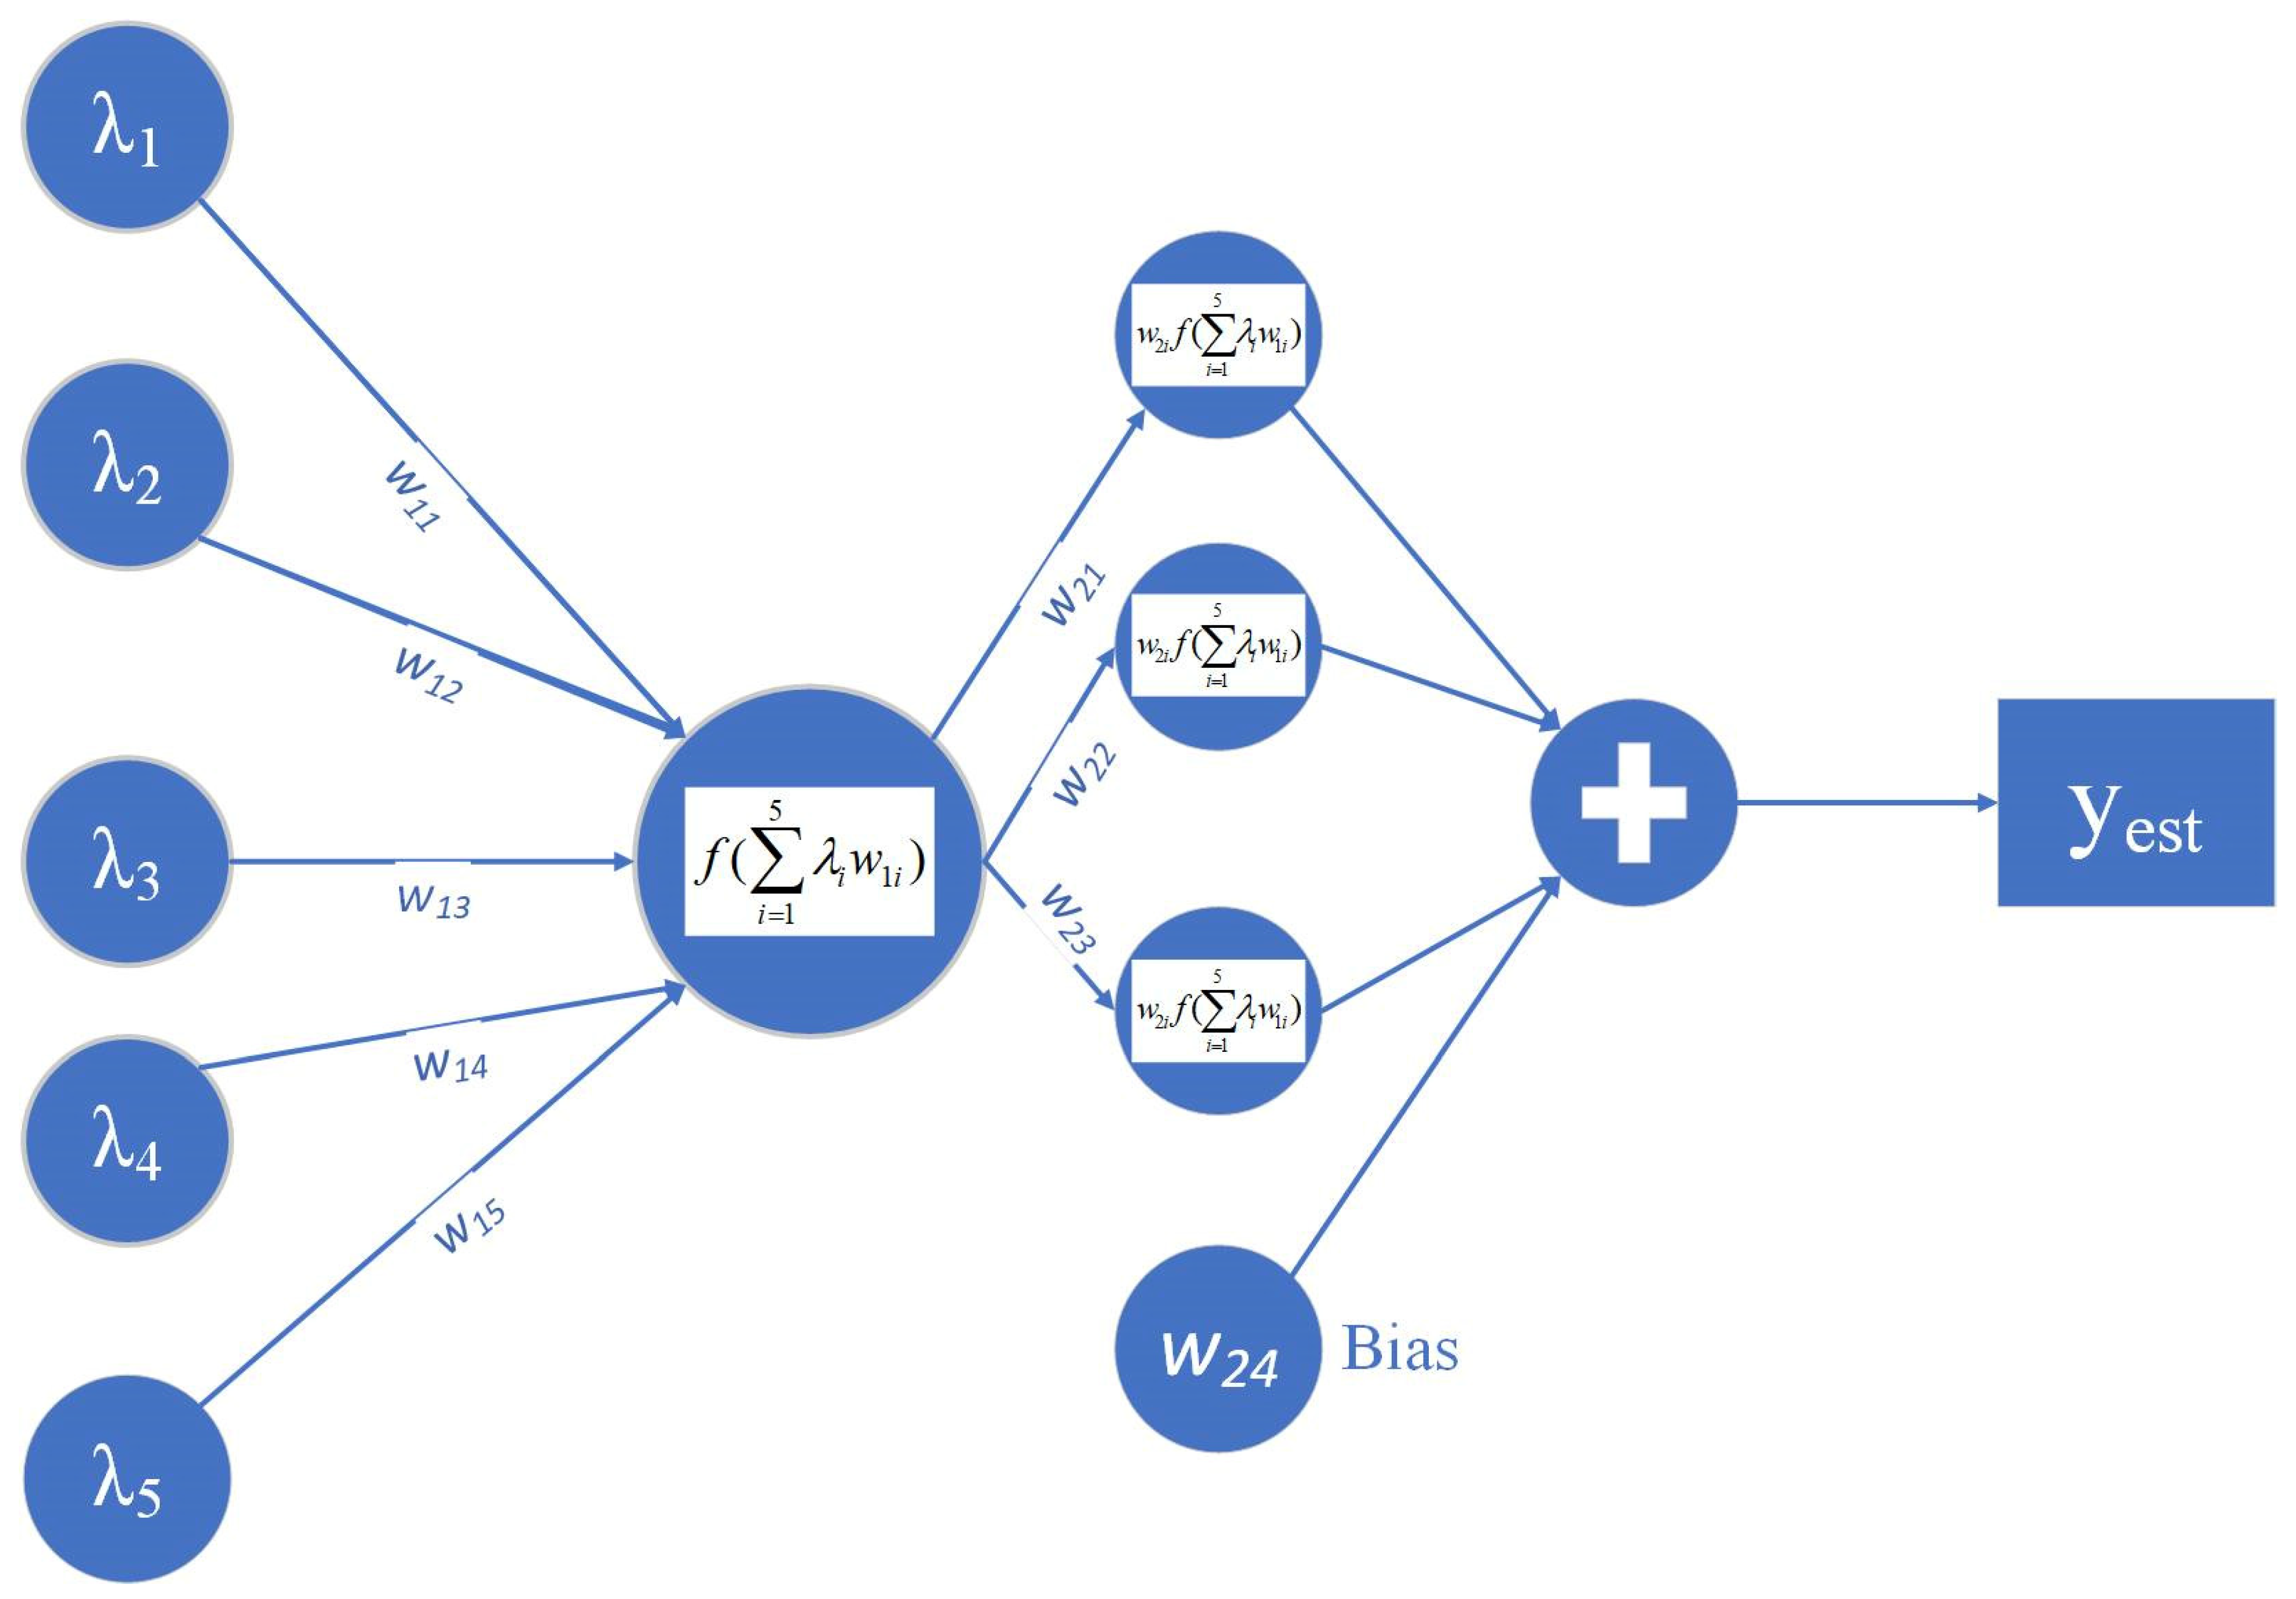
2.4. Fuzzy Cognitive Maps and Design of the Parameter Estimation Models
3. Experimental Setup and Samples Preparation
Samples Preparation
4. Results Evaluation and Discussion
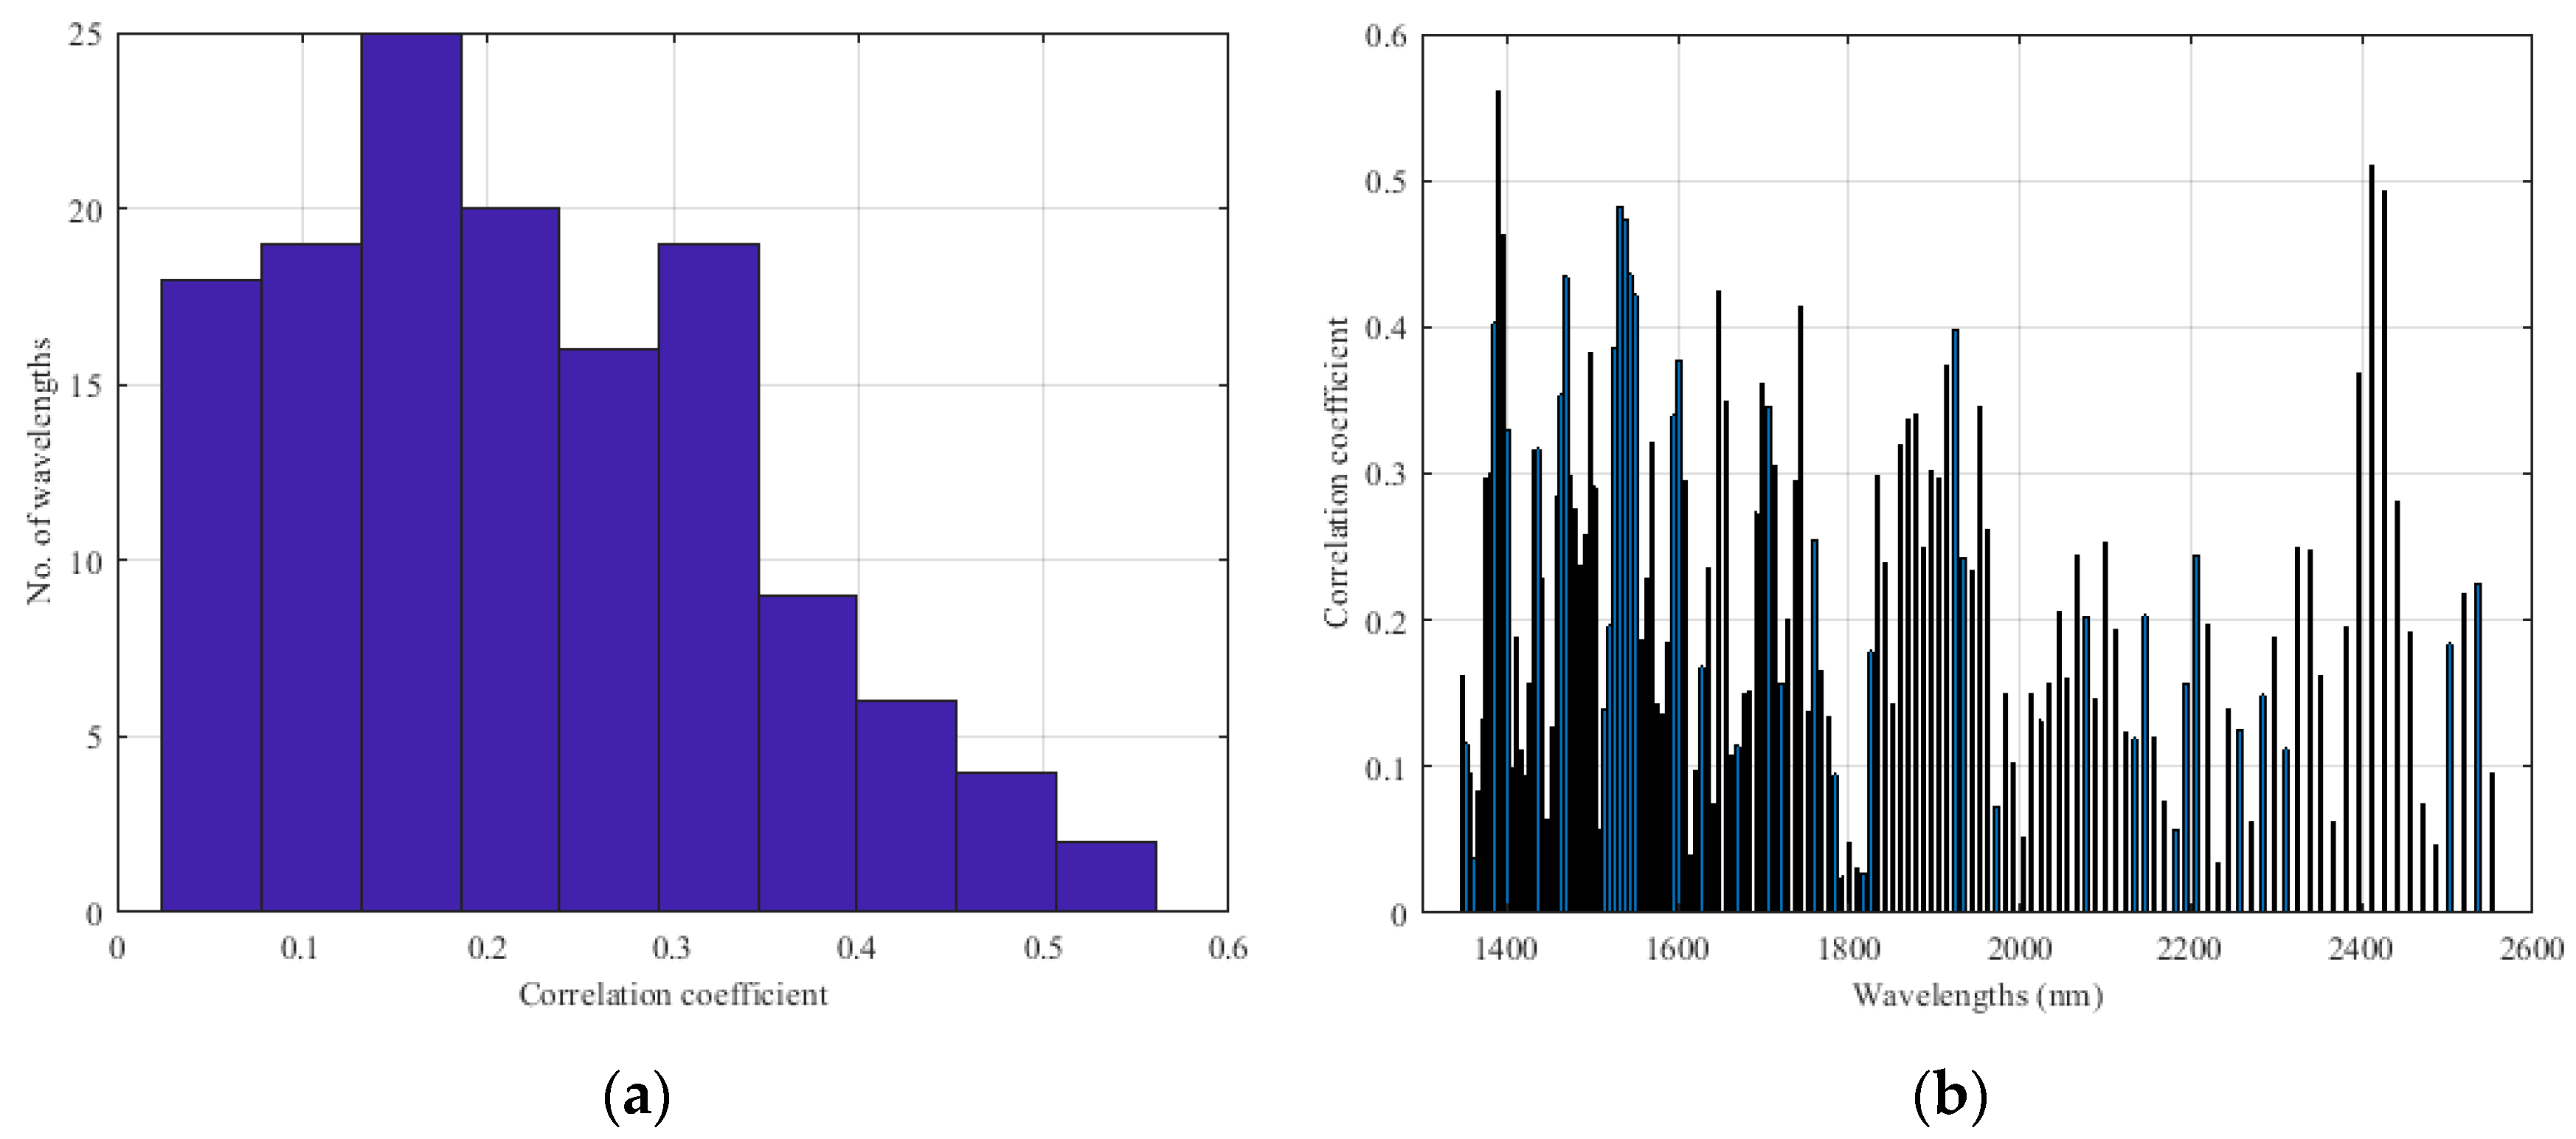
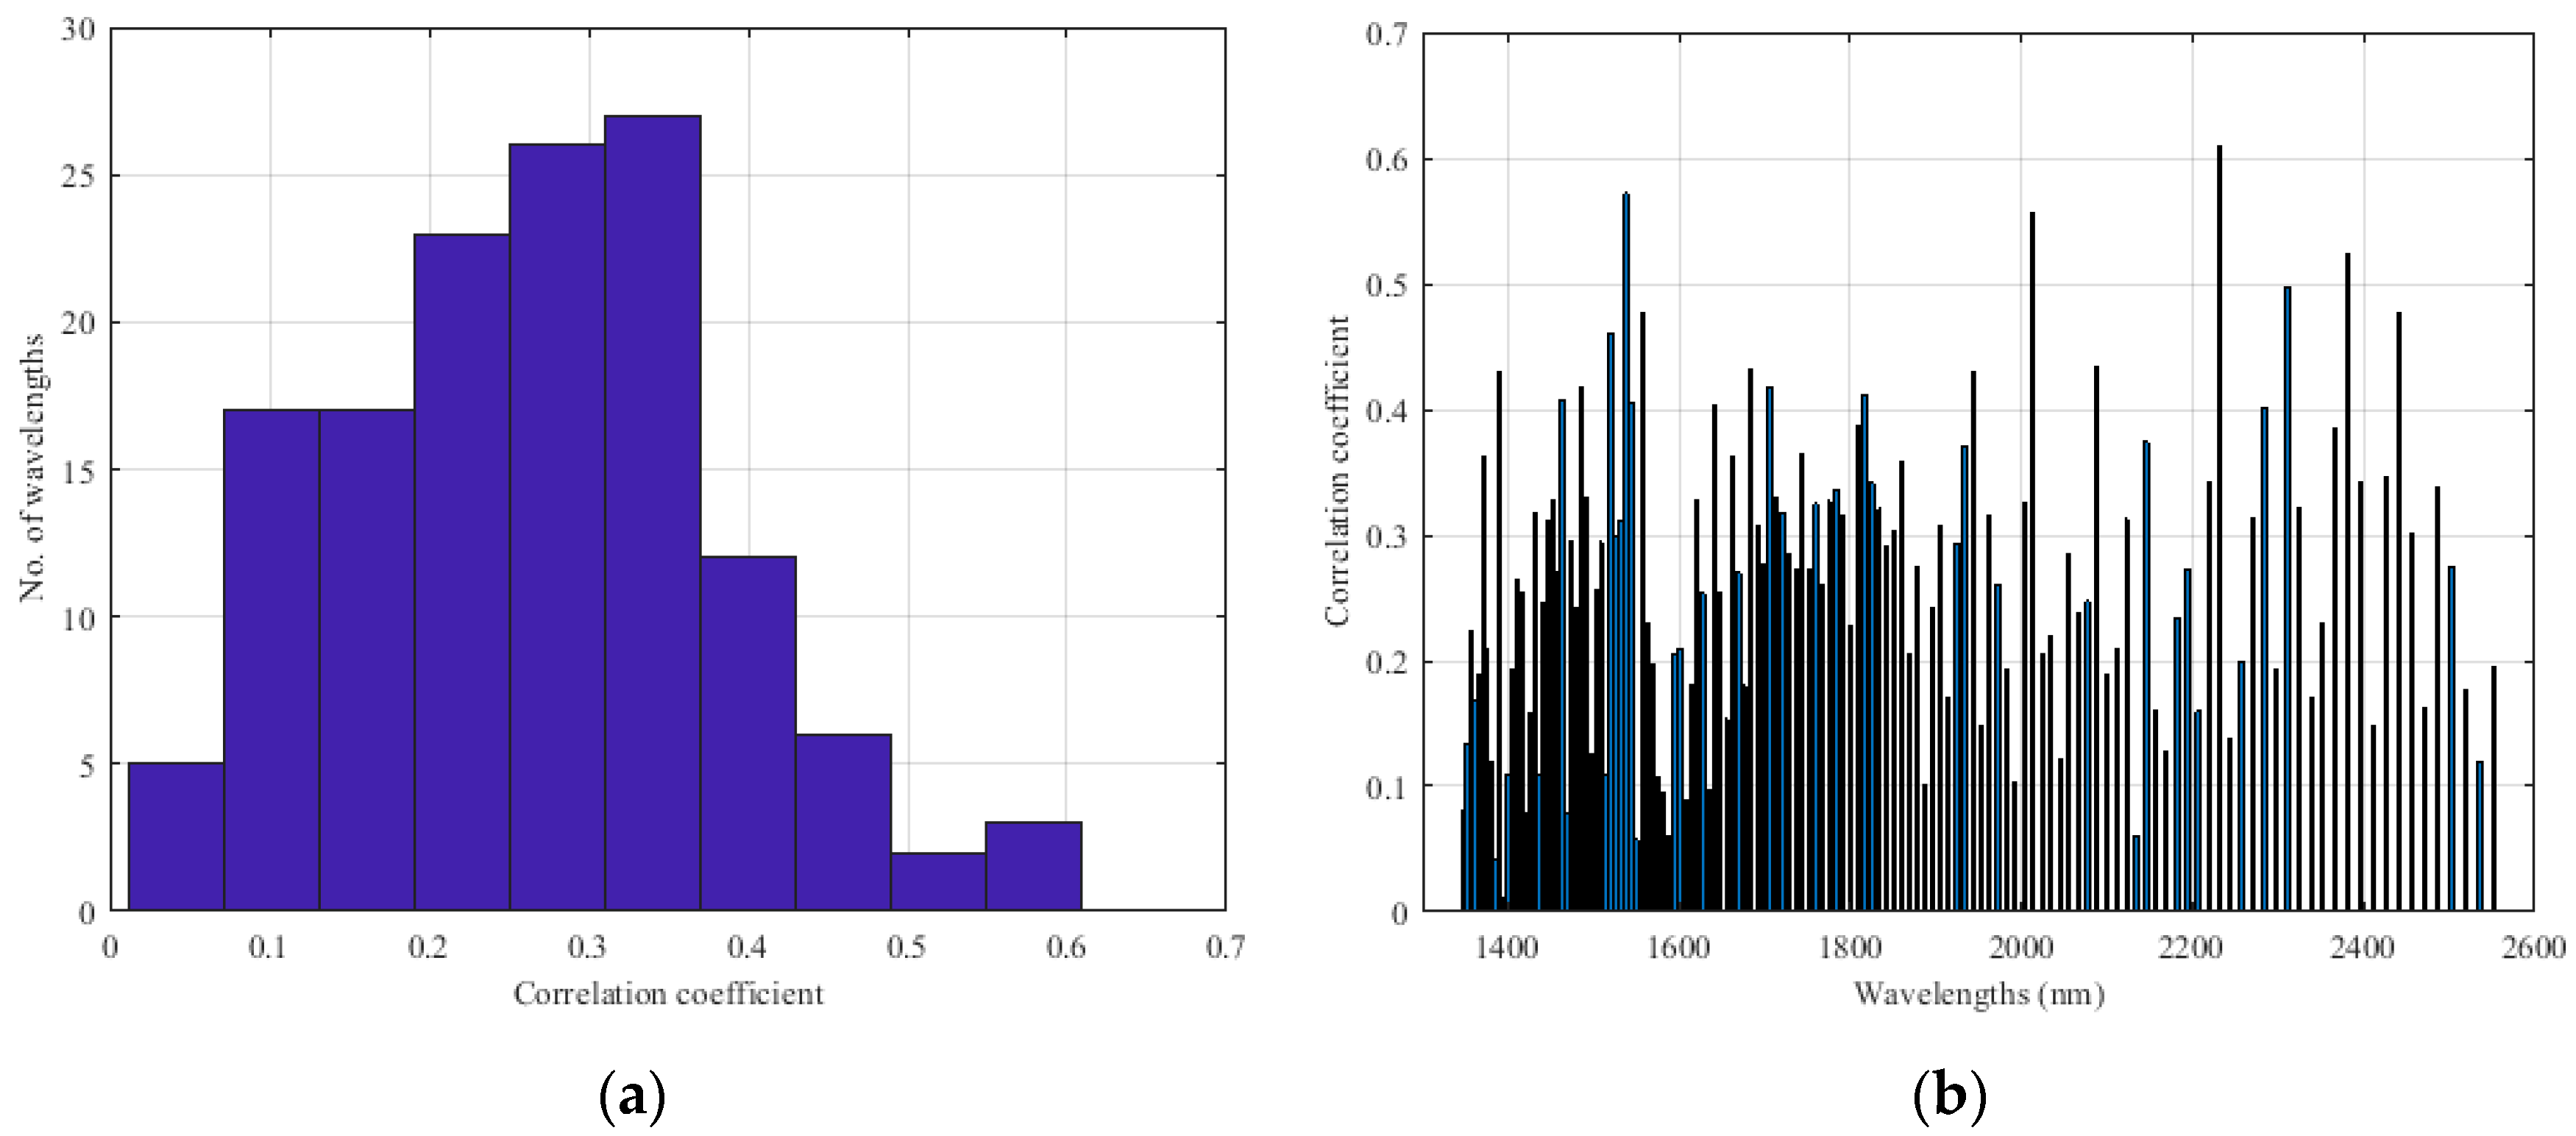
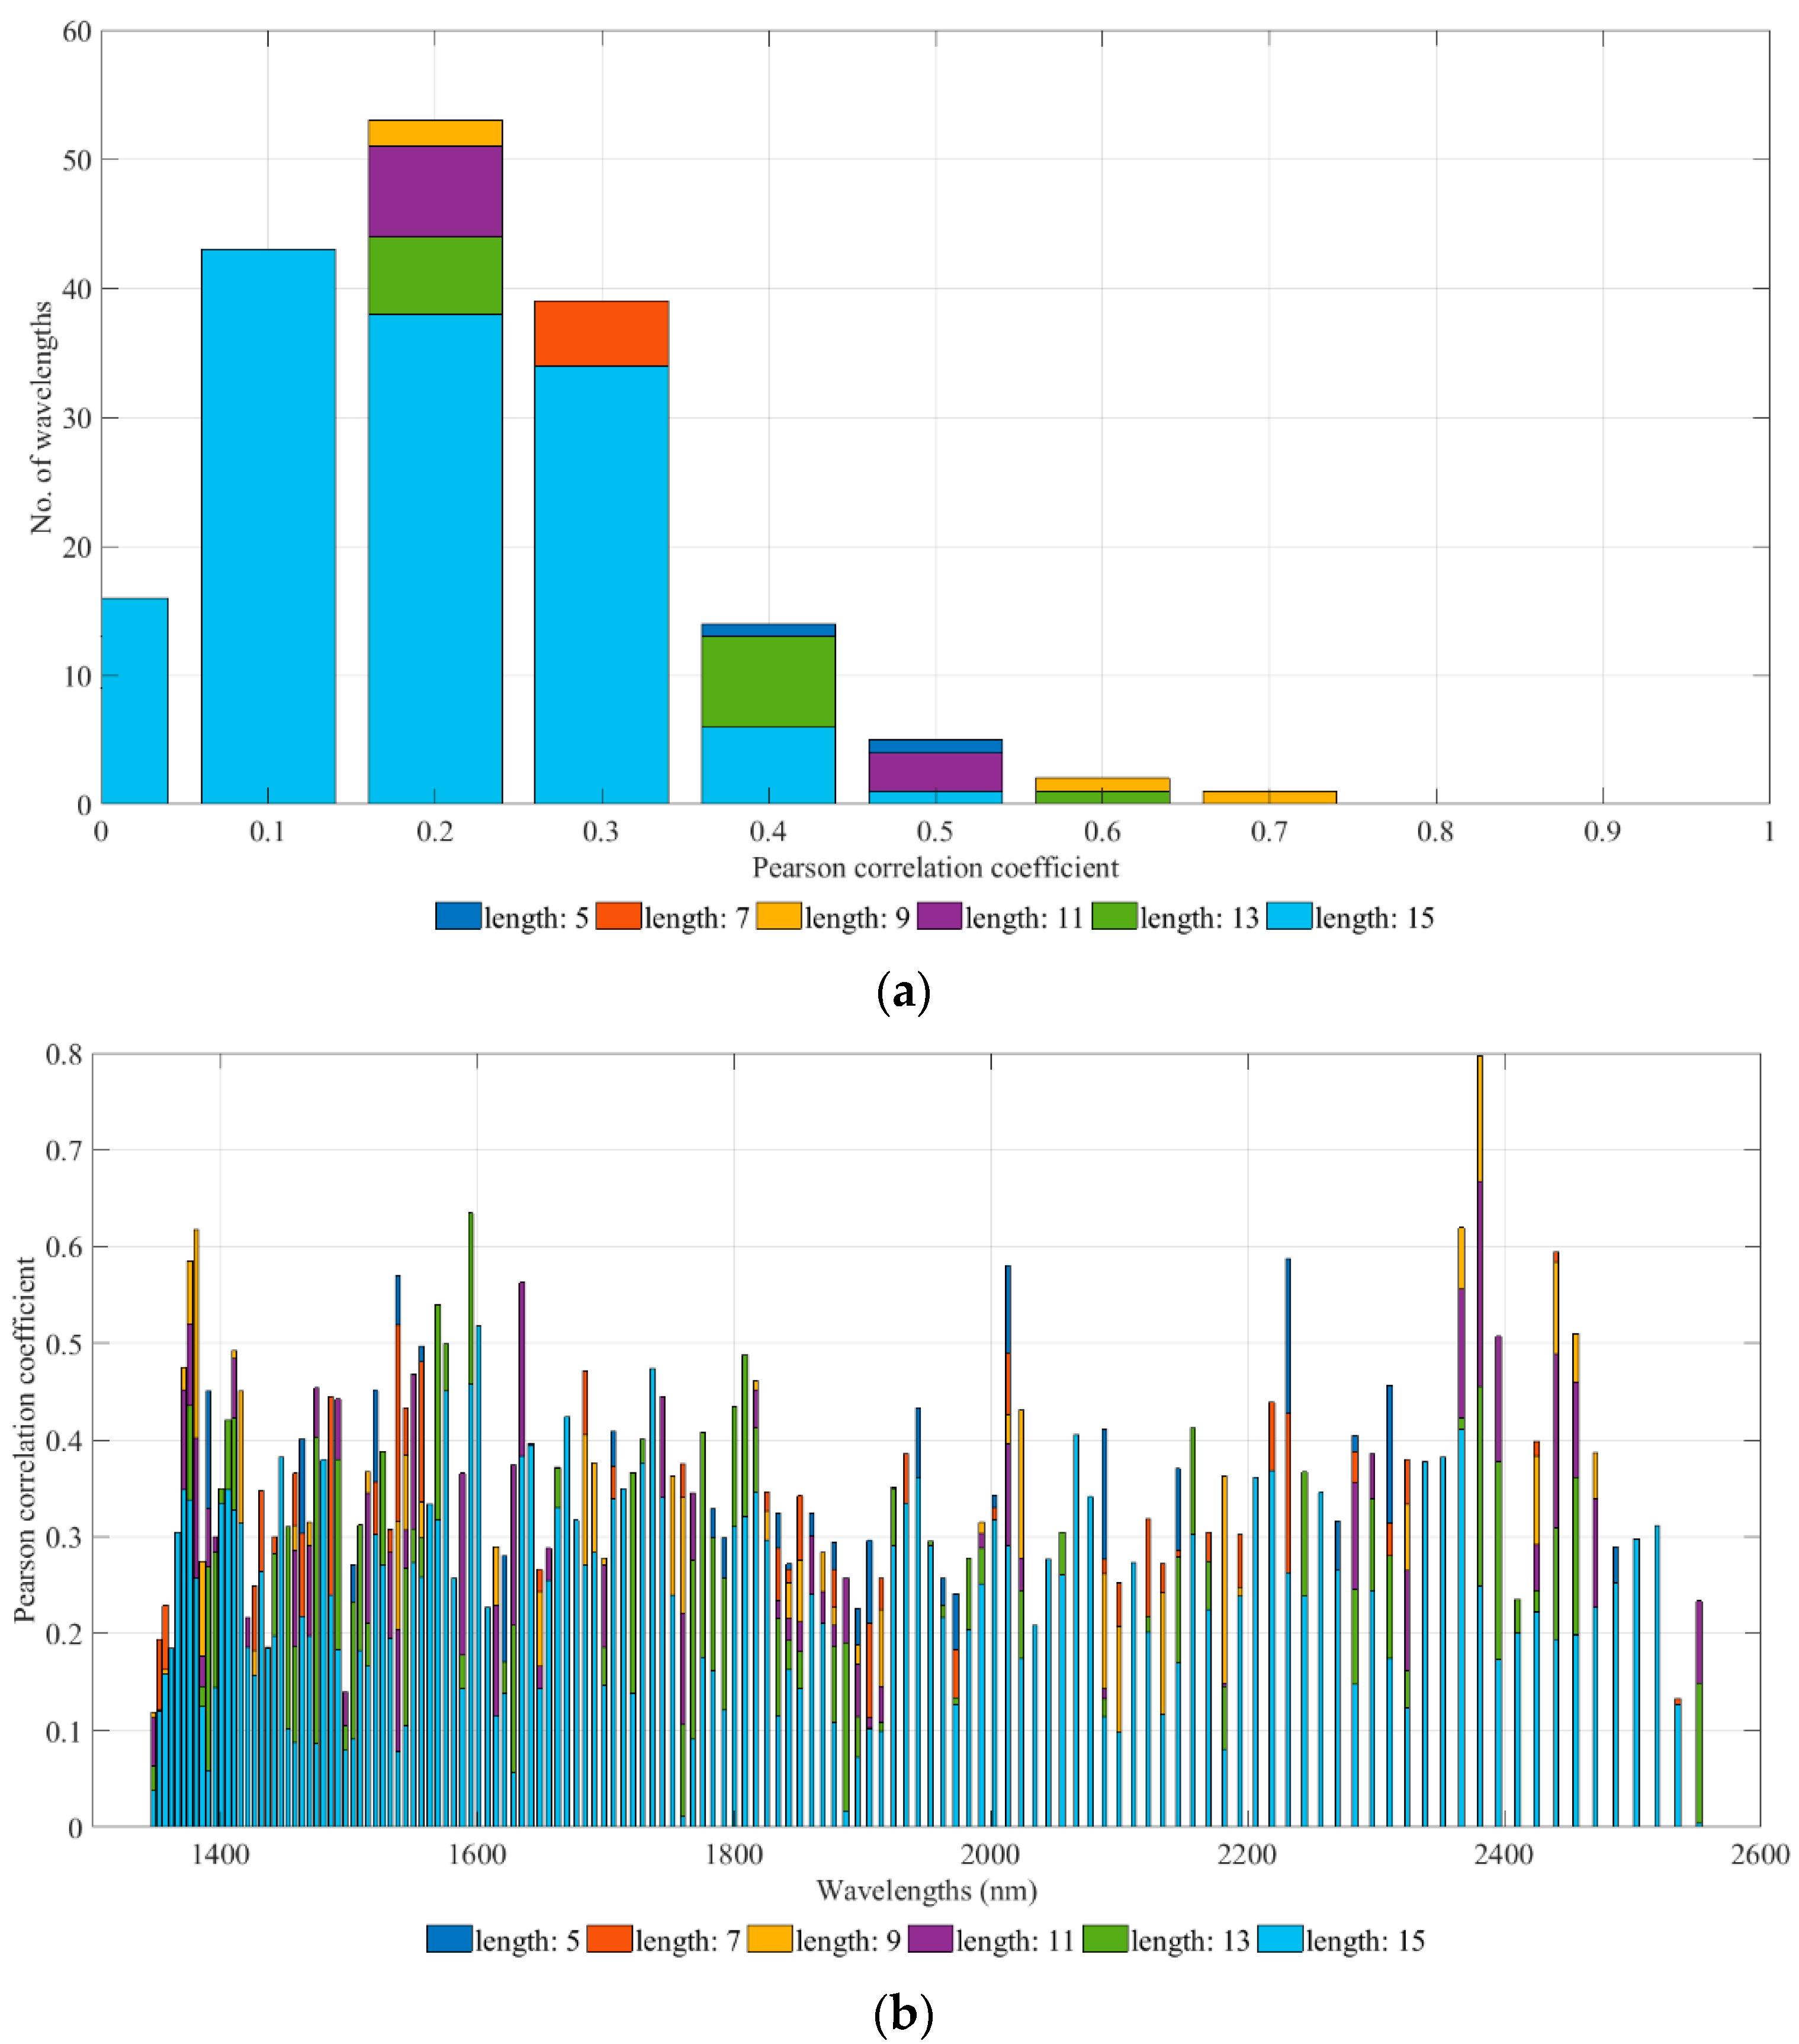
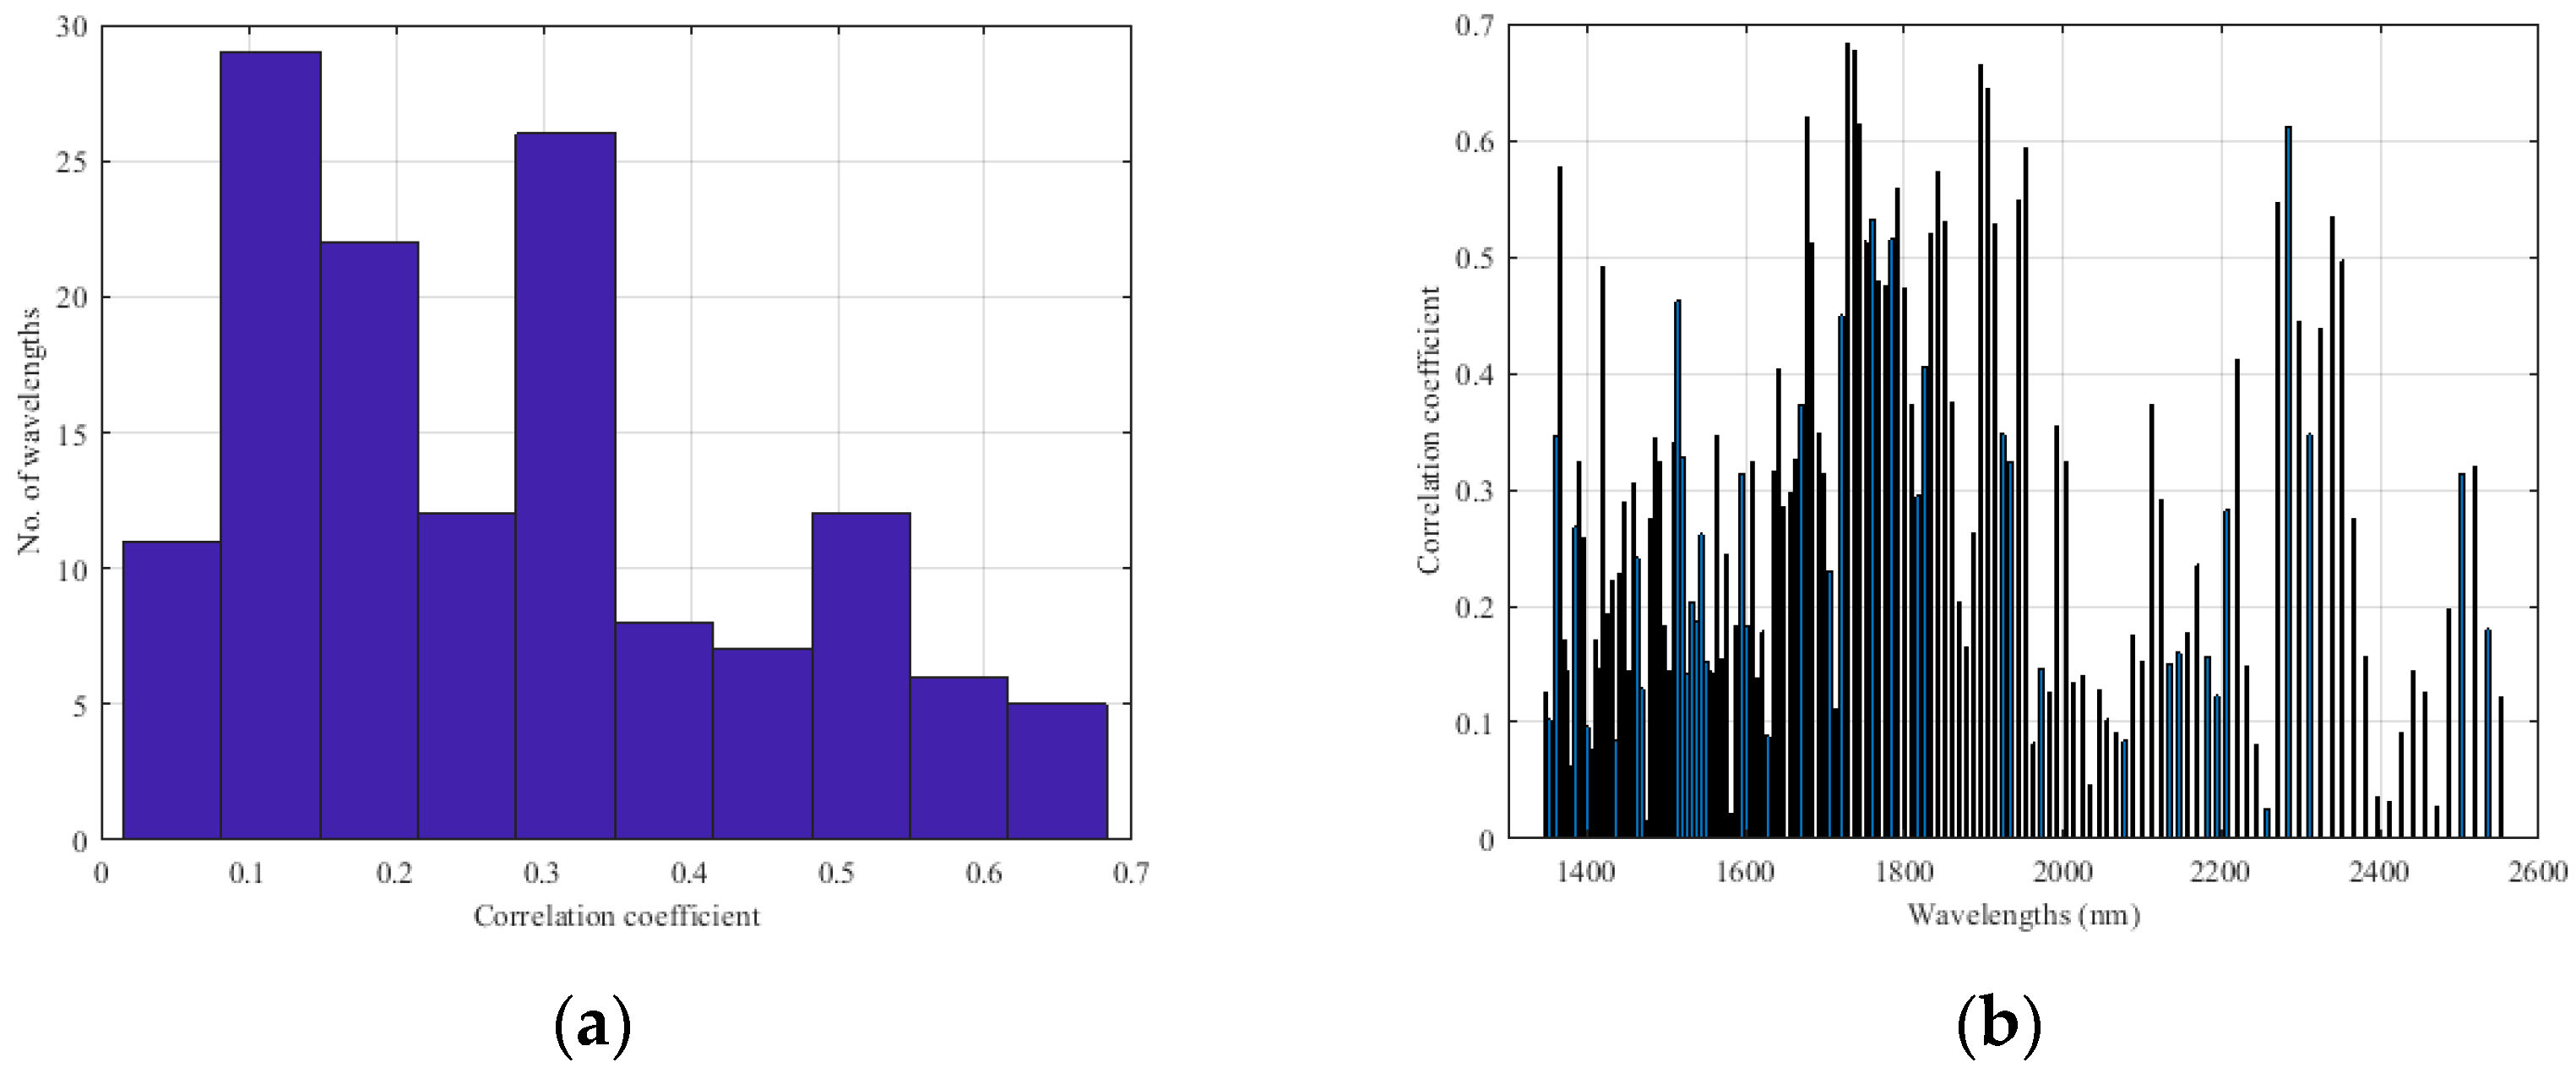
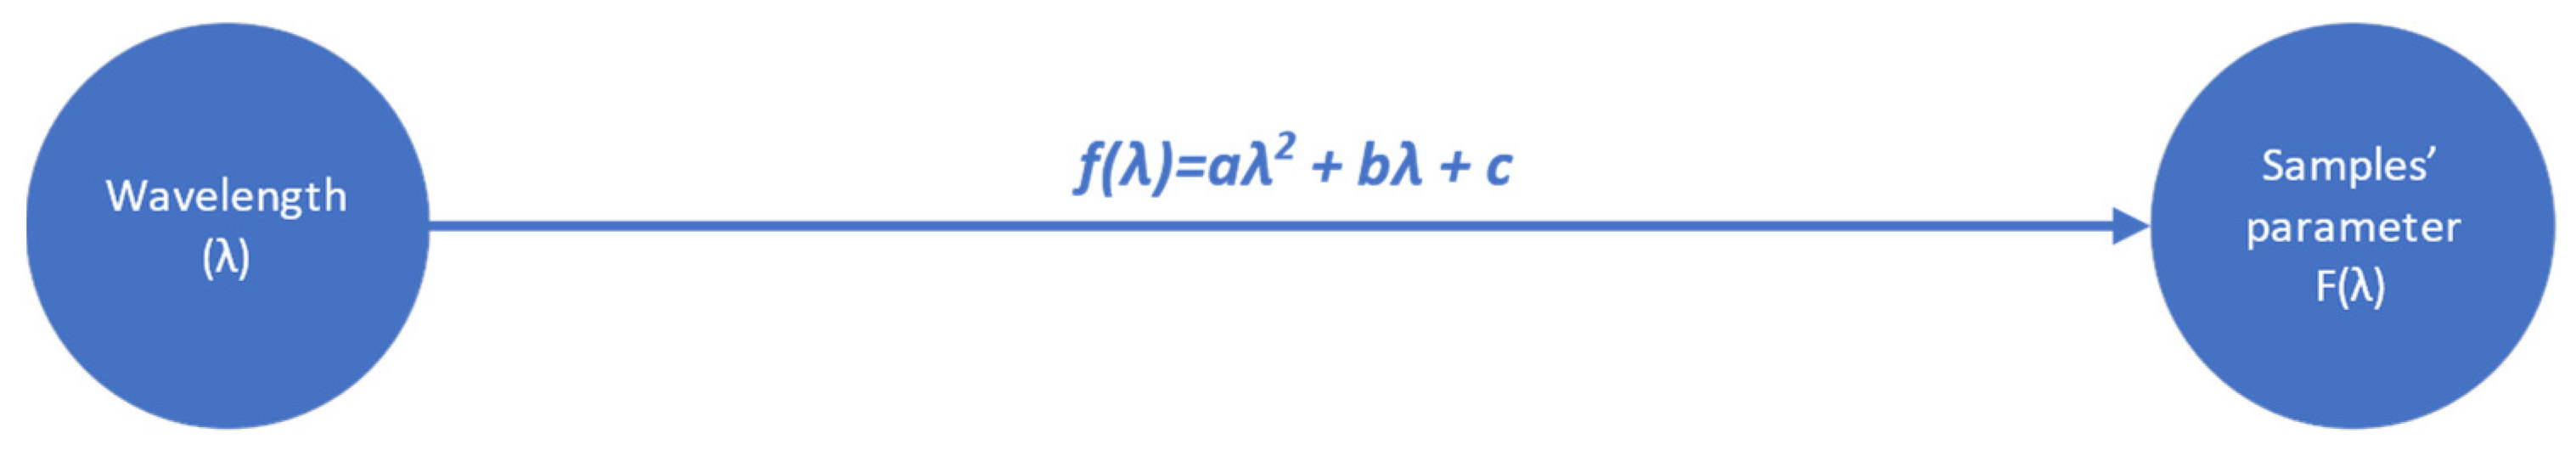
4.1. Results on the Investigation of Wavelengths’ Effectiveness on Wheat and Flour Chemical Parameters
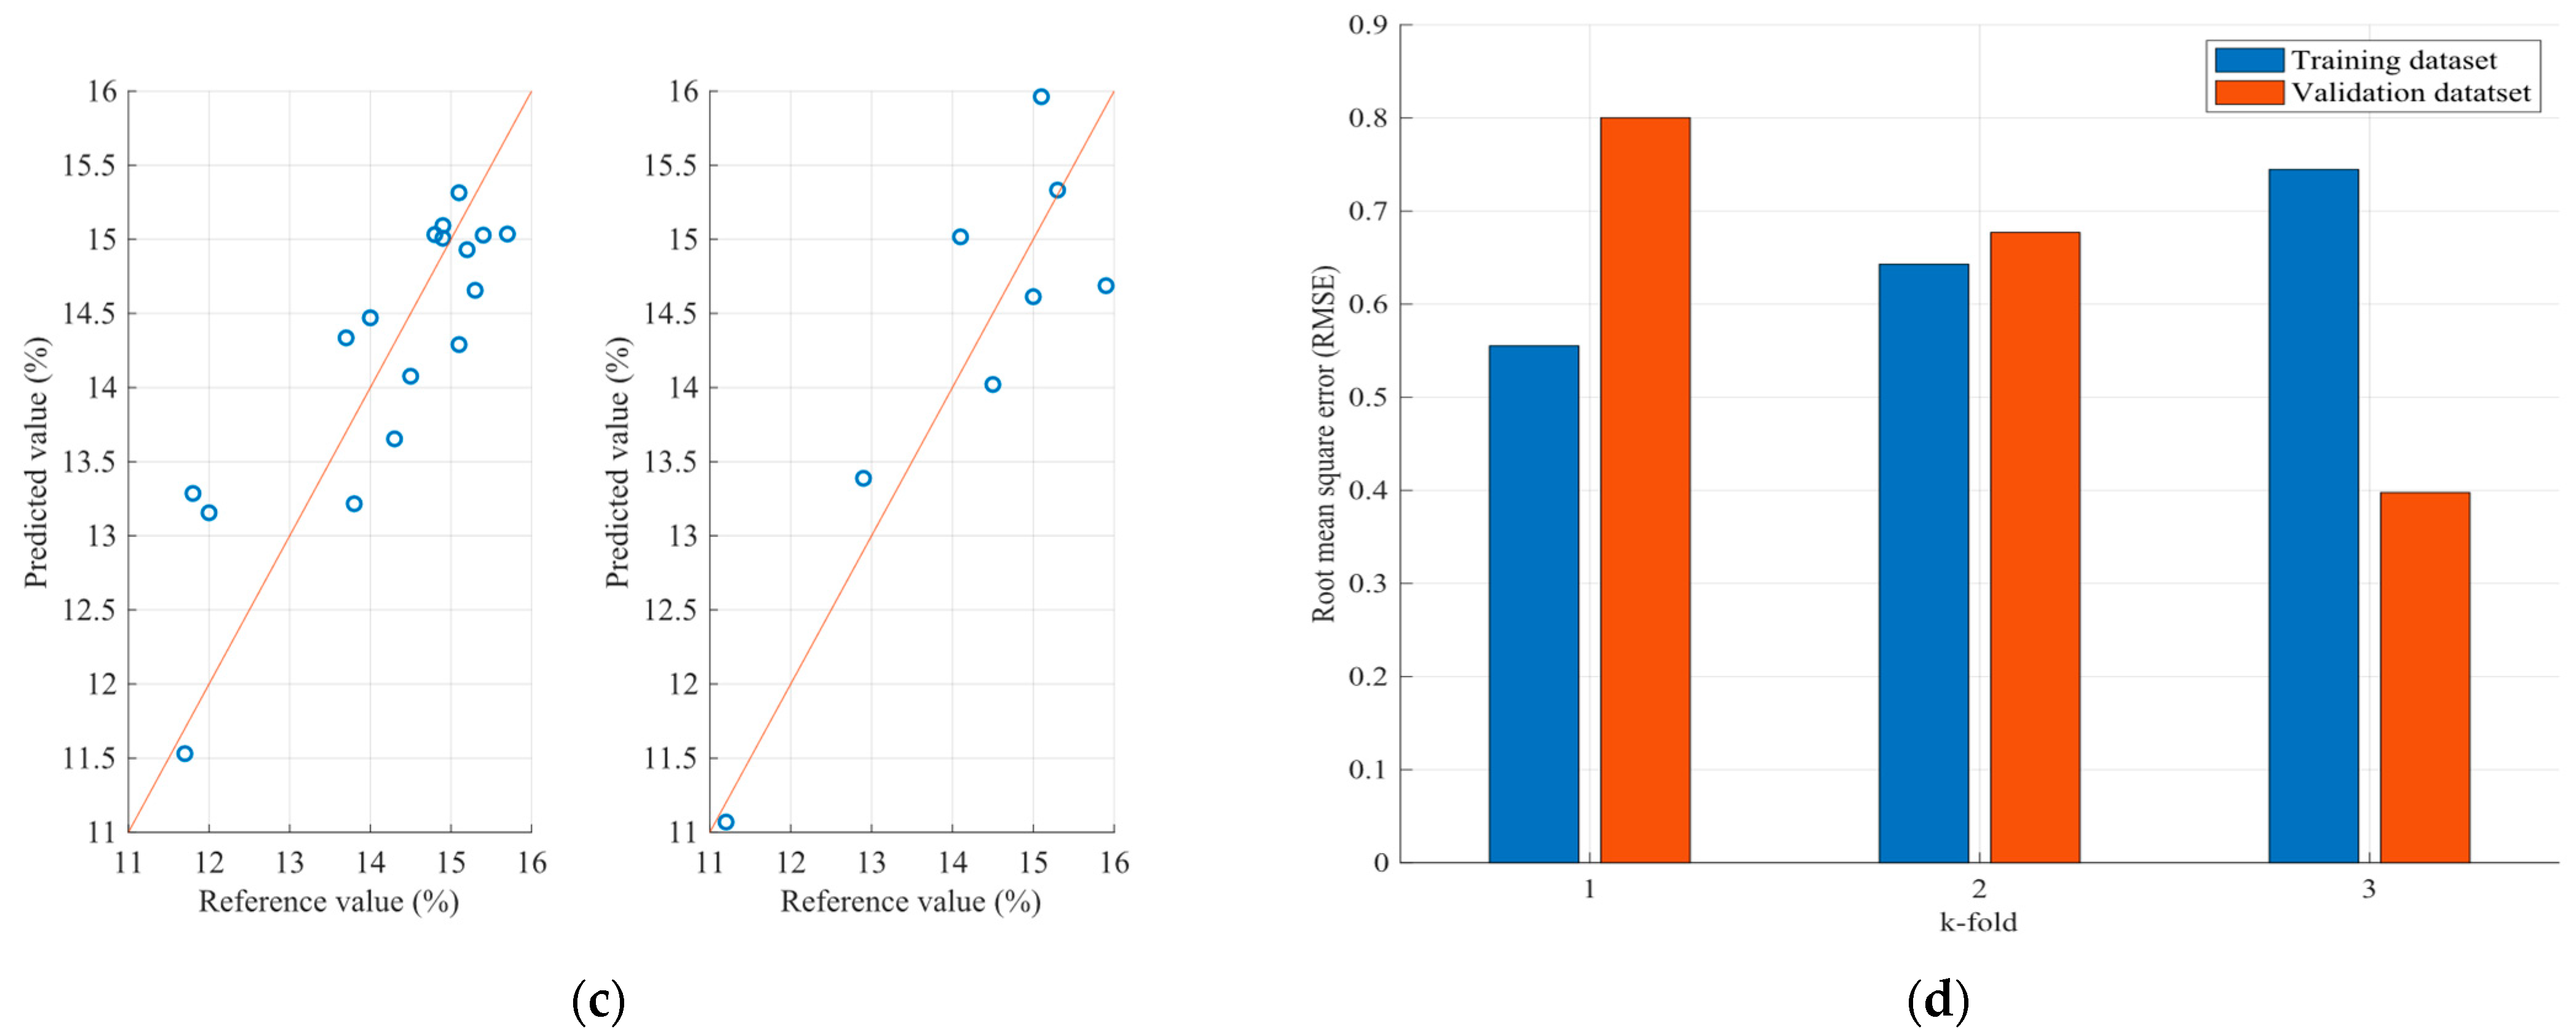
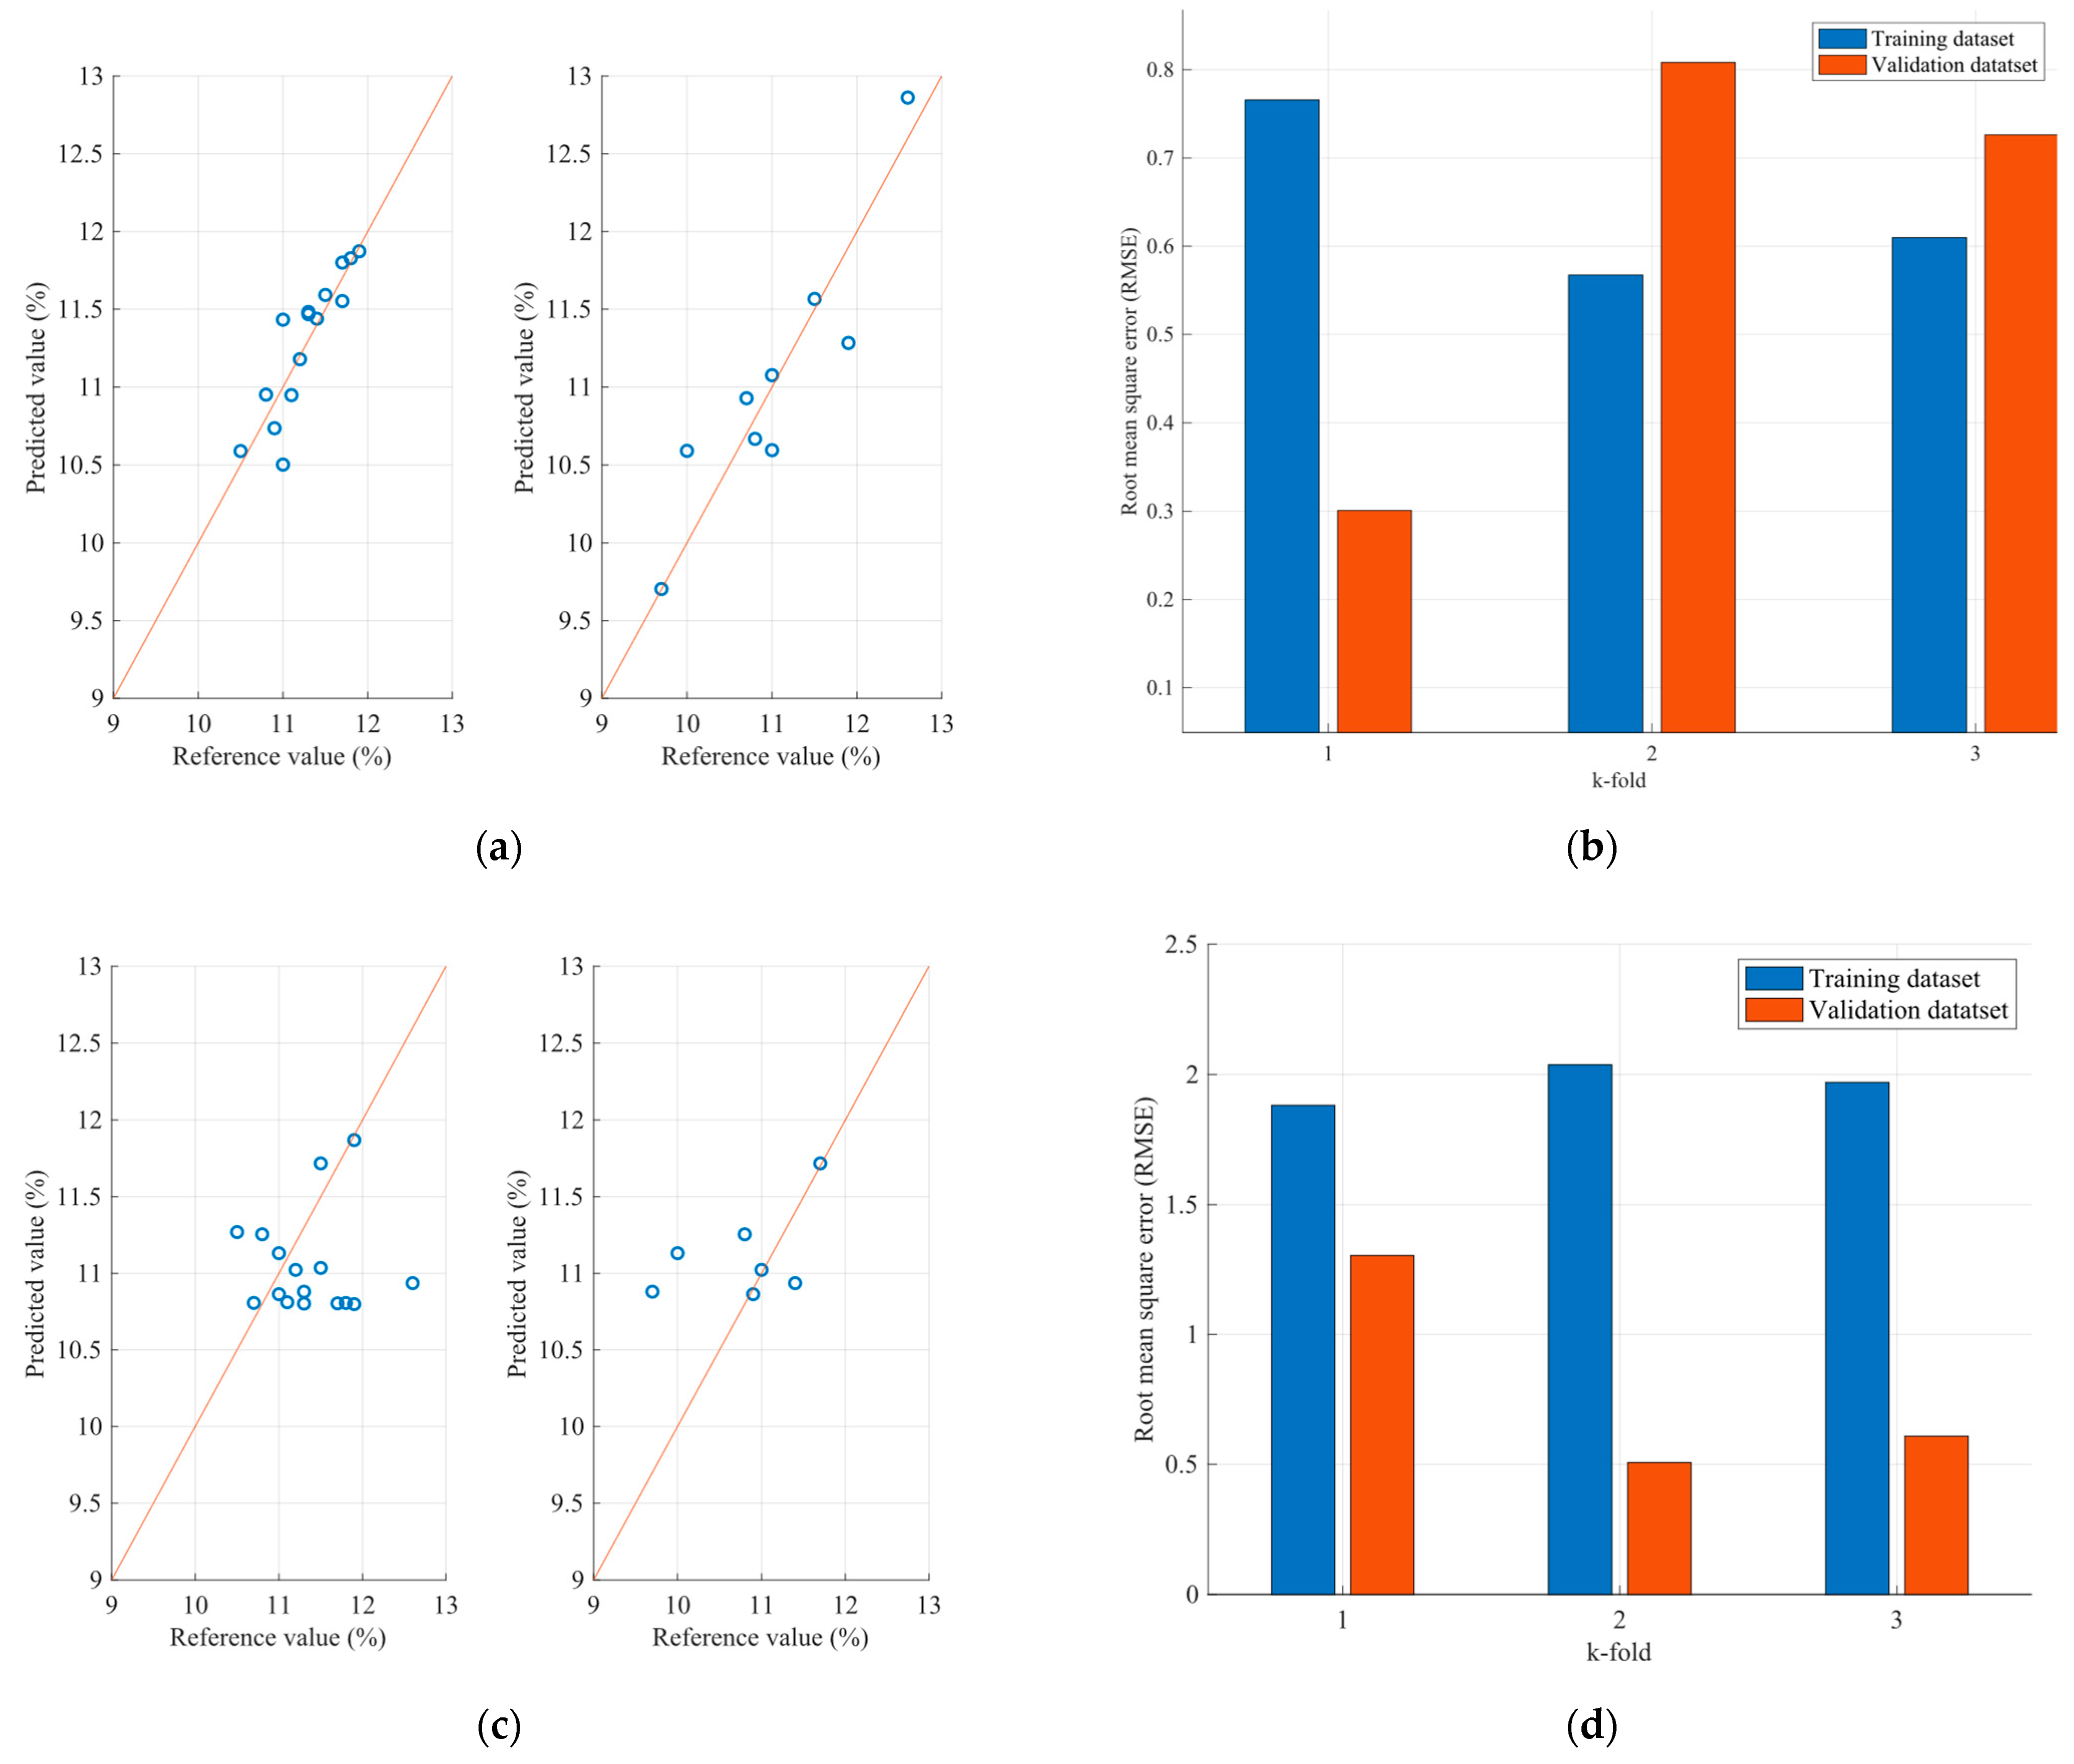
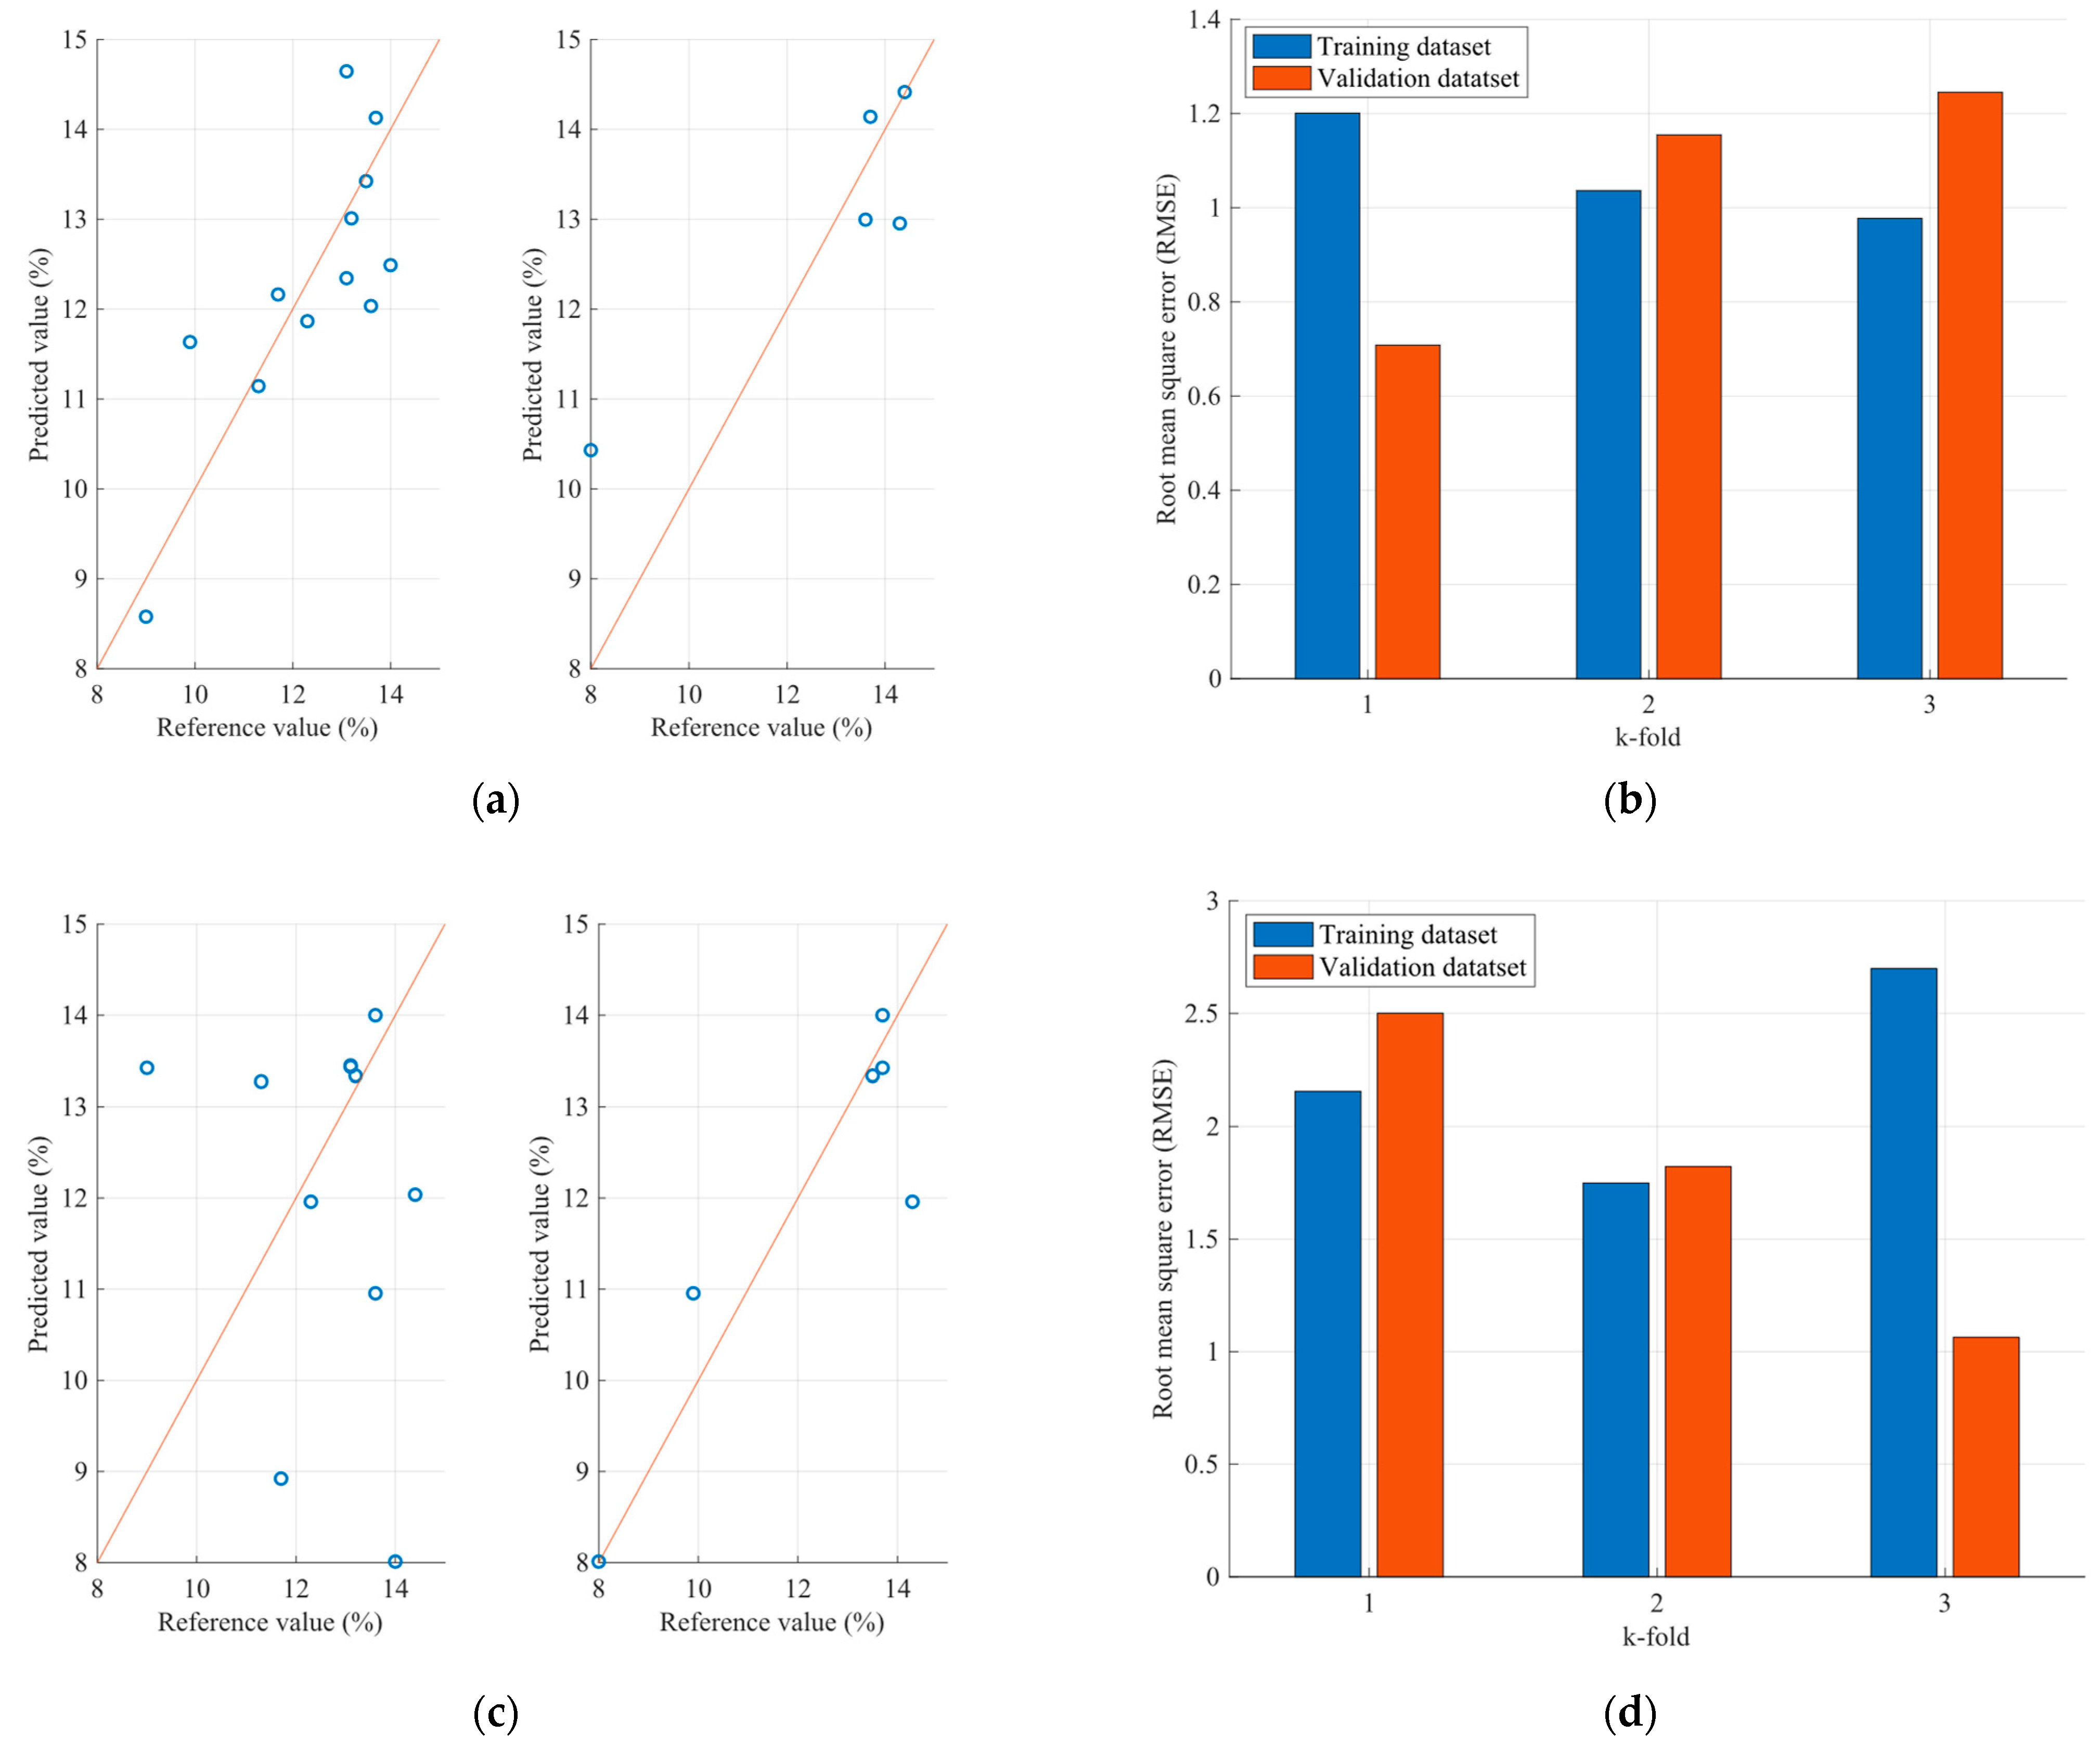
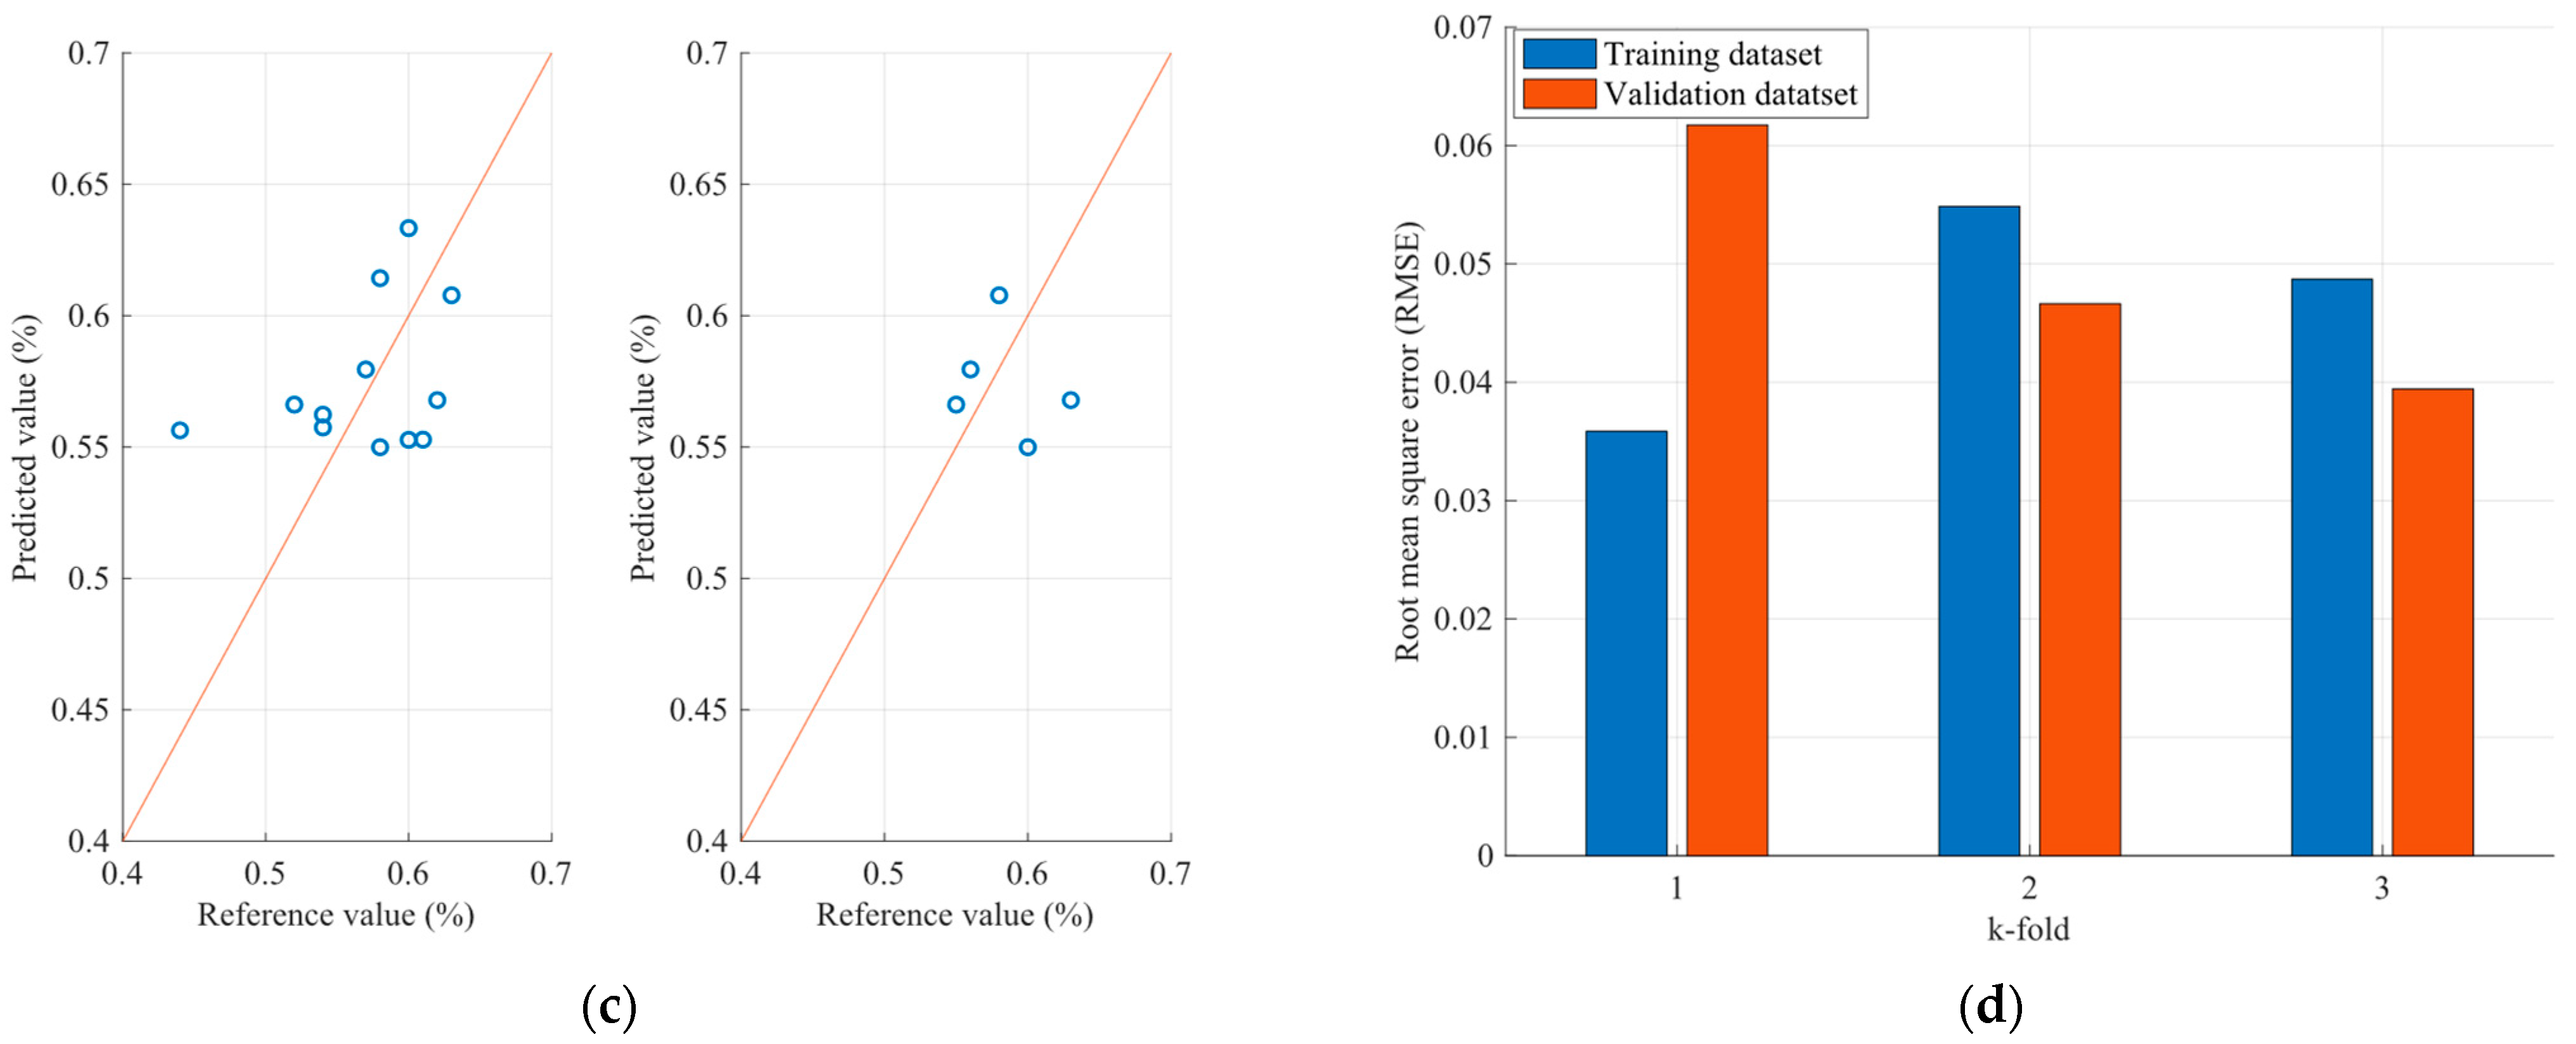
4.2. Optimization Results of the FCMs Estimation Models
5. Conclusions
Author Contributions
Funding
Institutional Review Board Statement
Informed Consent Statement
Data Availability Statement
Conflicts of Interest
Appendix A


Appendix B

References
- Soori, M.; Arezoo, B.; Dastres, R. Internet of Things for Smart Factories in Industry 4.0, a Review. Internet Things Cyber-Phys. Syst. 2023, 3, 192–204. [Google Scholar] [CrossRef]
- Grassi, S.; Marti, A.; Cascella, D.; Casalino, S.; Cascella, G.L. Electric Drive Supervisor for Milling Process 4.0 Automation: A Process Analytical Approach with IIoT NIR Devices for Common Wheat. Sensors 2020, 20, 1147. [Google Scholar] [CrossRef] [PubMed]
- Miskelly, D.; Suter, D. Assessing and Managing Wheat-Flour Quality before, during and after Milling. In Cereal Grains; Elsevier: Amsterdam, The Netherlands, 2017; pp. 607–634. ISBN 978-0-08-100719-8. [Google Scholar]
- Cappelli, A.; Oliva, N.; Cini, E. Stone Milling versus Roller Milling: A Systematic Review of the Effects on Wheat Flour Quality, Dough Rheology, and Bread Characteristics. Trends Food Sci. Technol. 2020, 97, 147–155. [Google Scholar] [CrossRef]
- Doblado-Maldonado, A.F.; Flores, R.A.; Rose, D.J. Low Moisture Milling of Wheat for Quality Testing of Wholegrain Flour. J. Cereal Sci. 2013, 58, 420–423. [Google Scholar] [CrossRef]
- Cozzolino, D. The Ability of Near Infrared (NIR) Spectroscopy to Predict Functional Properties in Foods: Challenges and Opportunities. Molecules 2021, 26, 6981. [Google Scholar] [CrossRef]
- Zhang, S.; Liu, S.; Shen, L.; Chen, S.; He, L.; Liu, A. Application of Near-Infrared Spectroscopy for the Nondestructive Analysis of Wheat Flour: A Review. Curr. Res. Food Sci. 2022, 5, 1305–1312. [Google Scholar] [CrossRef]
- Beć, K.B.; Grabska, J.; Huck, C.W. Principles and Applications of Miniaturized Near-Infrared (NIR) Spectrometers. Chem. A Eur. J. 2021, 27, 1514–1532. [Google Scholar] [CrossRef]
- Dos Santos, C.A.T.; Lopo, M.; Páscoa, R.N.M.J.; Lopes, J.A. A Review on the Applications of Portable Near-Infrared Spectrometers in the Agro-Food Industry. Appl. Spectrosc. 2013, 67, 1215–1233. [Google Scholar] [CrossRef]
- Salgó, A.; Gergely, S. Analysis of Wheat Grain Development Using NIR Spectroscopy. J. Cereal Sci. 2012, 56, 31–38. [Google Scholar] [CrossRef]
- Delwiche, S.R. Protein Content of Single Kernels of Wheat by Near-Infrared Reflectance Spectroscopy. J. Cereal Sci. 1998, 27, 241–254. [Google Scholar] [CrossRef]
- Zhu, Z.; Li, T.; Cui, J.; Shi, X.; Chen, J.; Wang, H. Non-Destructive Estimation of Winter Wheat Leaf Moisture Content Using near-Ground Hyperspectral Imaging Technology. Acta Agric. Scand. Sect. B Soil Plant Sci. 2020, 70, 294–306. [Google Scholar] [CrossRef]
- Liu, R.; Liu, J.; Liu, C. Determination of Protein Content of Wheat Using Partial Least Squares Regression Based on Near-Infrared Spectroscopy Preprocessing. In Proceedings of the 2022 4th International Conference on Robotics and Computer Vision (ICRCV), Wuhan, China, 25 September 2022; pp. 7–10. [Google Scholar]
- Chadalavada, K.; Anbazhagan, K.; Ndour, A.; Choudhary, S.; Palmer, W.; Flynn, J.R.; Mallayee, S.; Pothu, S.; Prasad, K.V.S.V.; Varijakshapanikar, P.; et al. NIR Instruments and Prediction Methods for Rapid Access to Grain Protein Content in Multiple Cereals. Sensors 2022, 22, 3710. [Google Scholar] [CrossRef]
- Lin, C.; Chen, X.; Jian, L.; Shi, C.; Jin, X.; Zhang, G. Determination of Grain Protein Content by Near-Infrared Spectrometry and Multivariate Calibration in Barley. Food Chem. 2014, 162, 10–15. [Google Scholar] [CrossRef] [PubMed]
- Golea, C.M.; Codină, G.G.; Oroian, M. Prediction of Wheat Flours Composition Using Fourier Transform Infrared Spectrometry (FT-IR). Food Control 2023, 143, 109318. [Google Scholar] [CrossRef]
- Liu, C.; Yang, S.X.; Li, X.; Xu, L.; Deng, L. Noise Level Penalizing Robust Gaussian Process Regression for NIR Spectroscopy Quantitative Analysis. Chemom. Intell. Lab. Syst. 2020, 201, 104014. [Google Scholar] [CrossRef]
- Liu, Y.; Liu, Y.; Chen, Y.; Zhang, Y.; Shi, T.; Wang, J.; Hong, Y.; Fei, T.; Zhang, Y. The Influence of Spectral Pretreatment on the Selection of Representative Calibration Samples for Soil Organic Matter Estimation Using Vis-NIR Reflectance Spectroscopy. Remote Sens. 2019, 11, 450. [Google Scholar] [CrossRef]
- Mishra, P.; Lohumi, S. Improved Prediction of Protein Content in Wheat Kernels with a Fusion of Scatter Correction Methods in NIR Data Modelling. Biosyst. Eng. 2021, 203, 93–97. [Google Scholar] [CrossRef]
- Schuster, C.; Huen, J.; Scherf, K.A. Prediction of Wheat Gluten Composition via Near-Infrared Spectroscopy. Curr. Res. Food Sci. 2023, 6, 100471. [Google Scholar] [CrossRef]
- Basile, T.; Marsico, A.D.; Cardone, M.F.; Antonacci, D.; Perniola, R. FT-NIR Analysis of Intact Table Grape Berries to Understand Consumer Preference Driving Factors. Foods 2020, 9, 98. [Google Scholar] [CrossRef]
- Delwiche, S.R.; Reeves, J.B. A Graphical Method to Evaluate Spectral Preprocessing in Multivariate Regression Calibrations: Example with Savitzky—Golay Filters and Partial Least Squares Regression. Appl. Spectrosc. 2010, 64, 73–82. [Google Scholar] [CrossRef]
- Kosko, B. Fuzzy Cognitive Maps. Int. J. Man-Mach. Stud. 1986, 24, 65–75. [Google Scholar] [CrossRef]
- Papageorgiou, E.I.; Salmeron, J.L. A Review of Fuzzy Cognitive Maps Research during the Last Decade. IEEE Trans. Fuzzy Syst. 2013, 21, 66–79. [Google Scholar] [CrossRef]
- Boglou, V.; Karavas, C.; Karlis, A.; Arvanitis, K. An Intelligent Decentralized Energy Management Strategy for the Optimal Electric Vehicles’ Charging in Low-voltage Islanded Microgrids. Int. J. Energy Res. 2022, 46, 2988–3016. [Google Scholar] [CrossRef]
- Karavas, C.-S.; Kyriakarakos, G.; Arvanitis, K.G.; Papadakis, G. A Multi-Agent Decentralized Energy Management System Based on Distributed Intelligence for the Design and Control of Autonomous Polygeneration Microgrids. Energy Convers. Manag. 2015, 103, 166–179. [Google Scholar] [CrossRef]
- Karlis, A.D.; Kottas, T.L.; Boutalis, Y.S. A Novel Maximum Power Point Tracking Method for PV Systems Using Fuzzy Cognitive Networks (FCN). Electr. Power Syst. Res. 2007, 77, 315–327. [Google Scholar] [CrossRef]


| Sample | Number of Samples | Parameter (%) | Average | Variance | SD | SE |
|---|---|---|---|---|---|---|
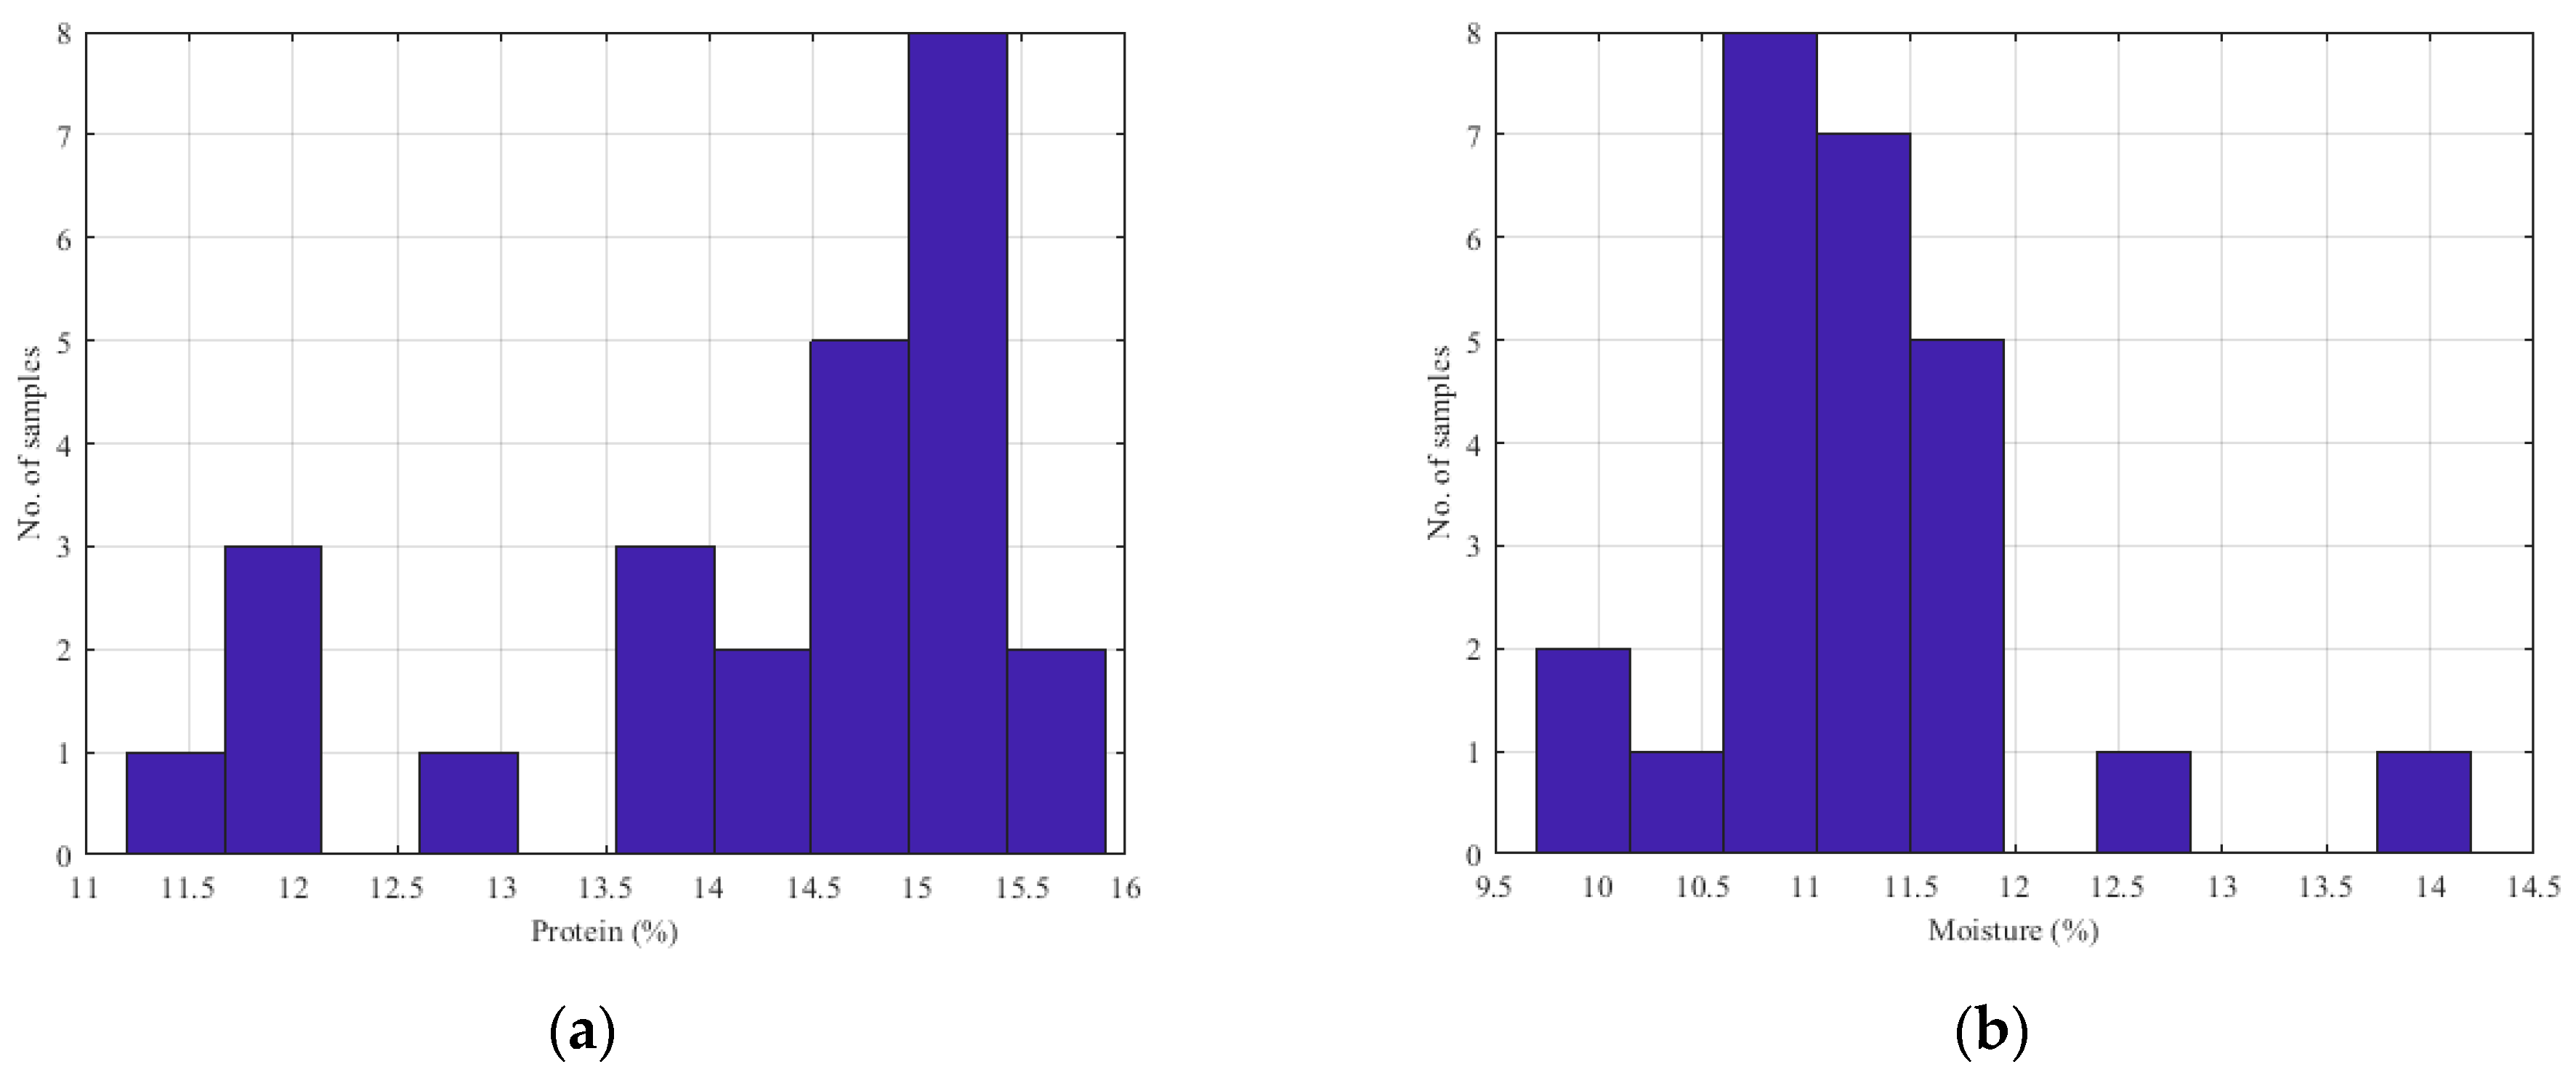
| Wheat | 25 | Protein | 14.25 | 1.77 | 1.33 | 0.27 |
| Moisture | 11.30 | 0.74 | 0.86 | 0.17 | ||
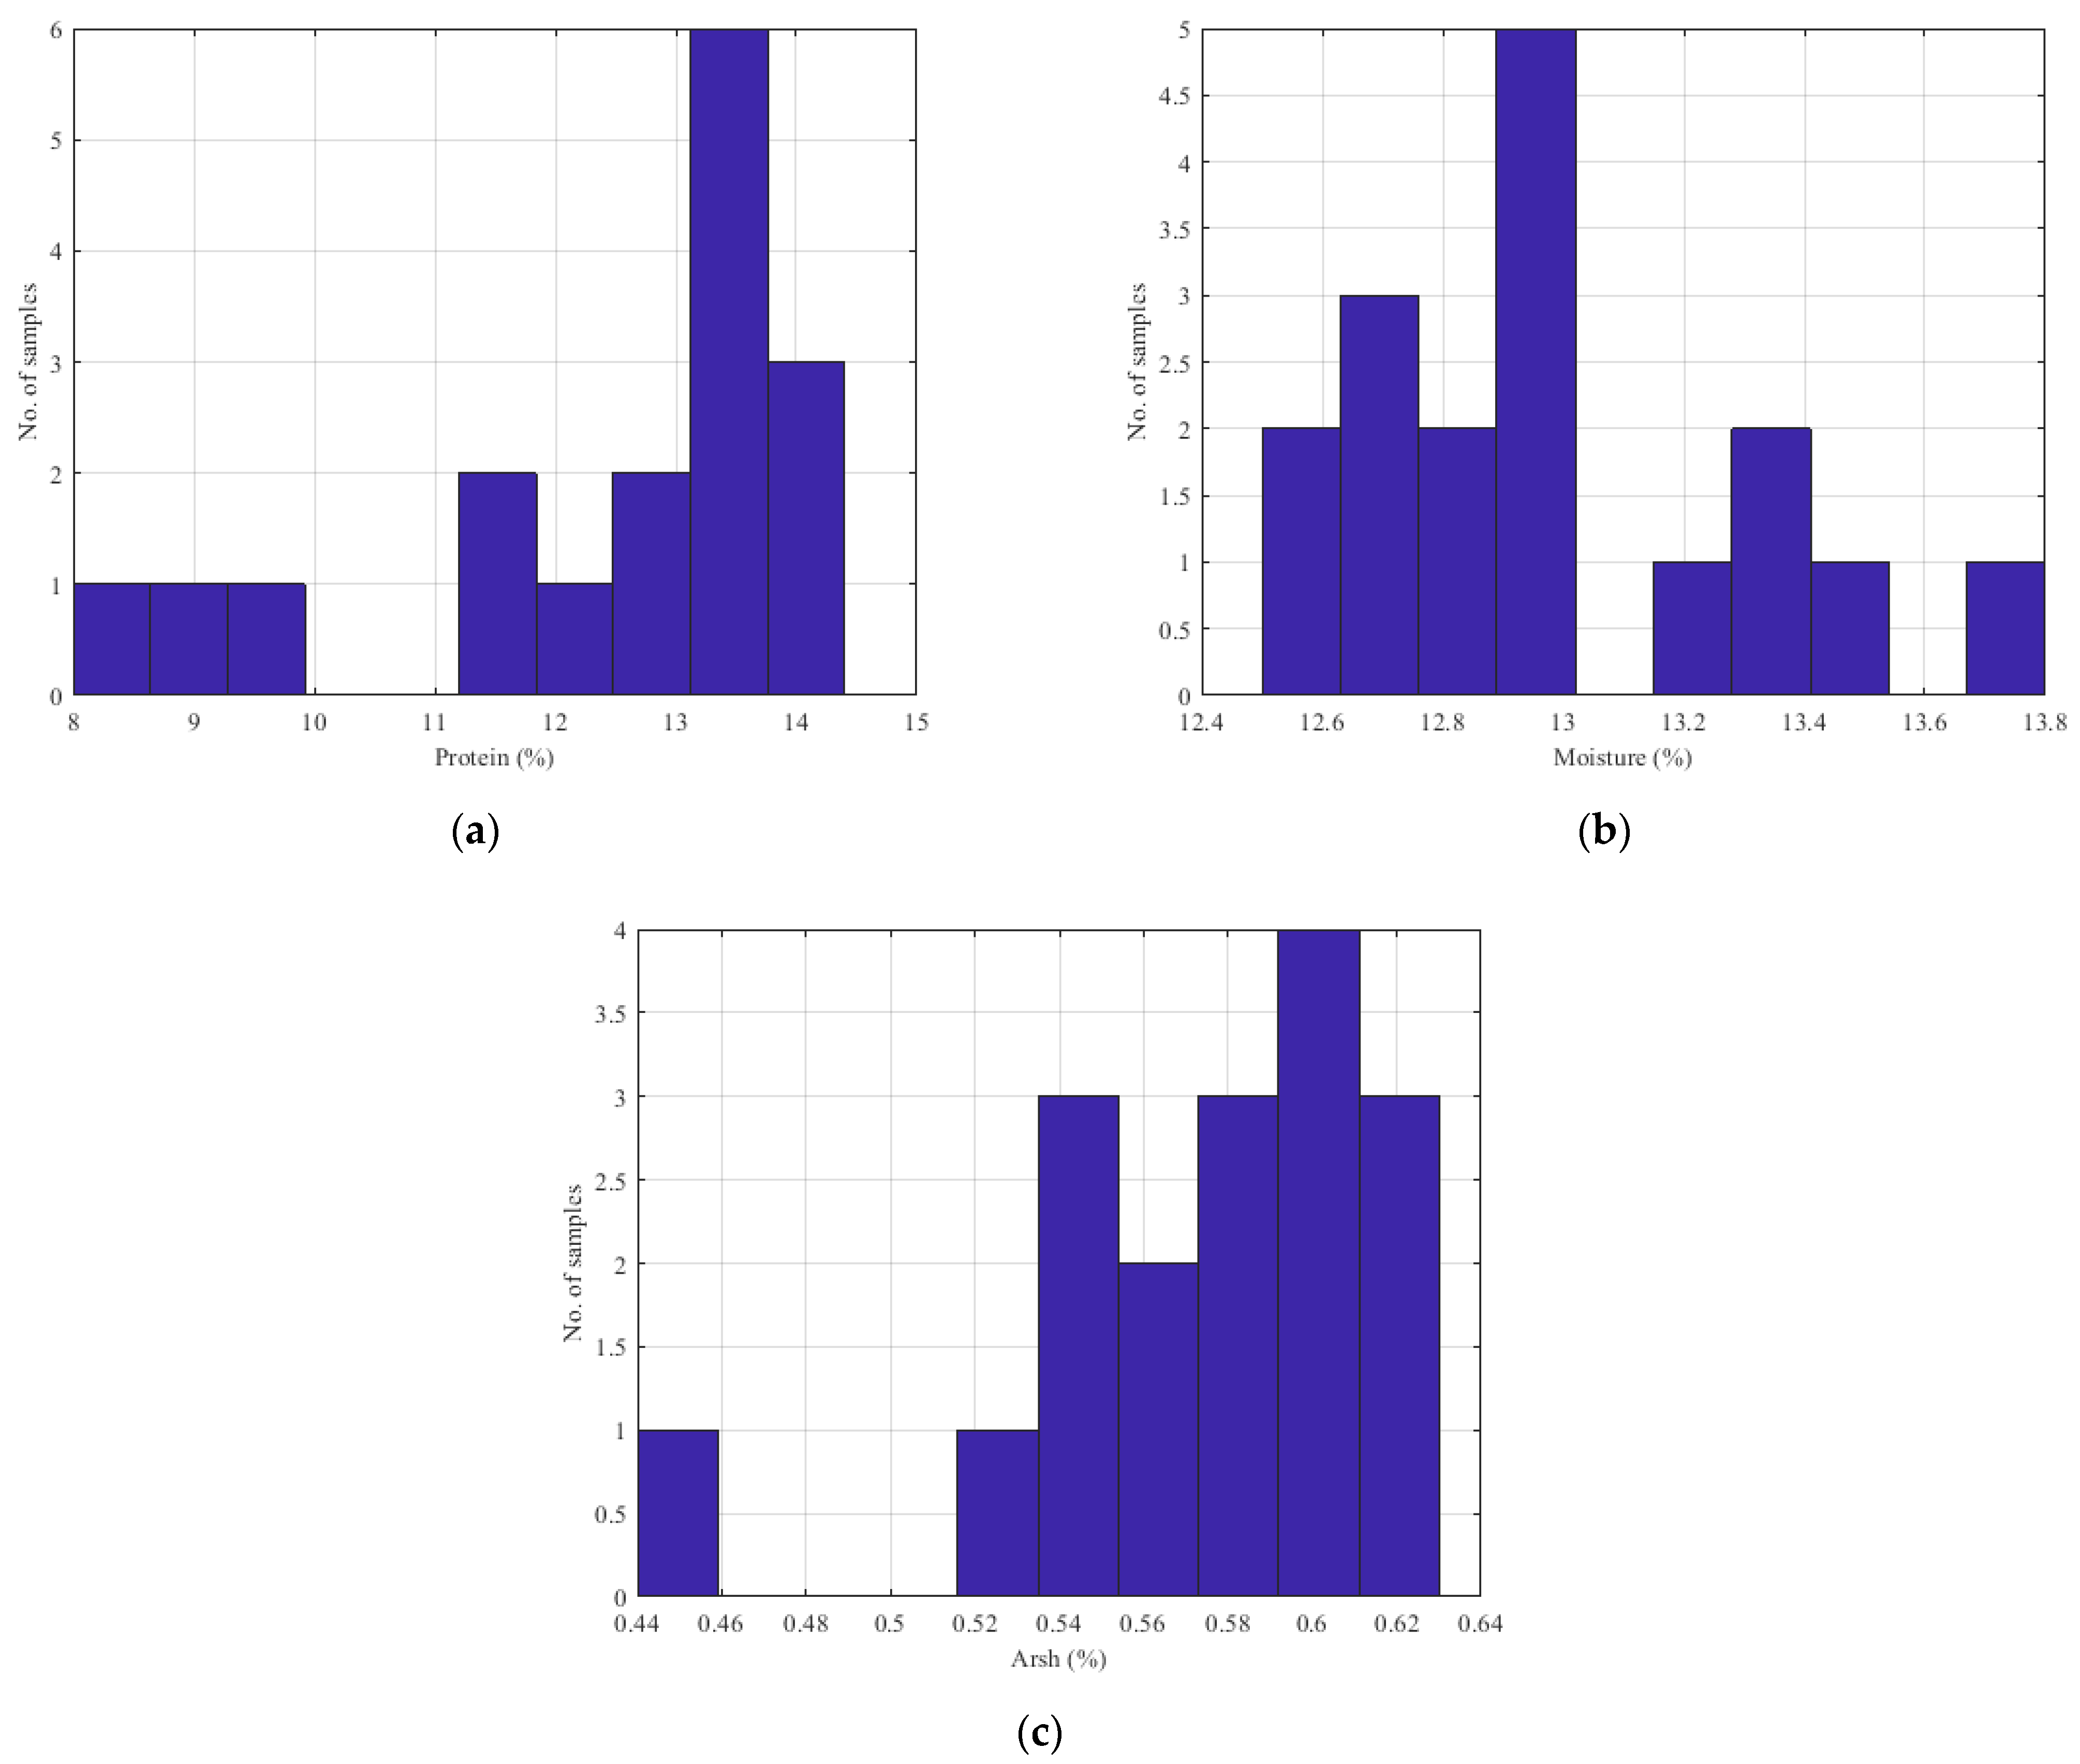
| Flour | 17 | Protein | 12.50 | 3.62 | 1.904 | 0.462 |
| Moisture | 13.00 | 0.12 | 0.342 | 0.082 | ||
| Ash | 0.58 | 0.002 | 0.047 | 0.012 |
| Weight | Protein Estimator | Selected Wavelength | Moisture Estimator | Selected Wavelength |
|---|---|---|---|---|
| W1,1 | 3.11 | 2440.50 | 2.43 | 2487.05 |
| W1,2 | 3.58 | 2381.07 | 0.03 | 2194.07 |
| W1,3 | 0.17 | 2366.66 | 0.61 | 1759.74 |
| W1,4 | −0.11 | 1380.79 | 3.21 | 1736.30 |
| W1,5 | 0.18 | 1375.93 | −1.52 | 1728.63 |
| W2,1 | 18.00 | 22.48 | ||
| W2,2 | 10.23 | 5.24 | ||
| W2,3 | 12.95 | 11.17 | ||
| W2,4 | −6.69 | −15.38 |
| Weight | Protein Estimator | Selected Wavelength | Moisture Estimator | Selected Wavelength (nm) | Ash Estimator | Selected Wavelength (nm) |
|---|---|---|---|---|---|---|
| W1,1 | 8.00 | 2055.69 | 15.46 | 1933.73 | −9.87 | 1775.71 |
| W1,2 | −4.83 | 2044.94 | −14.67 | 1924.22 | 0.01 | 1759.73 |
| W1,3 | −7.53 | 1683.97 | −0.16 | 1457.99 | 0.03 | 1751.85 |
| W1,4 | 4.05 | 1375.93 | 0.03 | 1405.59 | −0.41 | 1491.35 |
| W1,5 | −0.71 | 1371.10 | −0.54 | 1347.49 | 5.70 | 1480.06 |
| W2,1 | 0 | 0 | 0 | |||
| W2,2 | 0 | 0 | 0 | |||
| W2,3 | −0.08 | 0.05 | 0.01 | |||
| W2,4 | 9.01 | 12.75 | 1.97 |
| Sample | Parameter (%) | FCM Model RMSE | PLS Model RMSE |
|---|---|---|---|
| Wheat | Protein | 0.581 | 0.65 |
| Moisture | 0.412 | 1.93 | |
| Flour | Protein | 1.06 | 2.40 |
| Moisture | 0.09 | 0.38 | |
| Ash | 0.020 | 0.055 |
Disclaimer/Publisher’s Note: The statements, opinions and data contained in all publications are solely those of the individual author(s) and contributor(s) and not of MDPI and/or the editor(s). MDPI and/or the editor(s) disclaim responsibility for any injury to people or property resulting from any ideas, methods, instructions or products referred to in the content. |
© 2023 by the authors. Licensee MDPI, Basel, Switzerland. This article is an open access article distributed under the terms and conditions of the Creative Commons Attribution (CC BY) license (https://creativecommons.org/licenses/by/4.0/).
Share and Cite
Boglou, V.; Verginadis, D.; Karlis, A. Investigation on the Integration of Low-Cost NIR Spectrometers in Mill Flour Industries for Protein, Moisture and Ash Content Estimation. Sensors 2023, 23, 8476. https://doi.org/10.3390/s23208476
Boglou V, Verginadis D, Karlis A. Investigation on the Integration of Low-Cost NIR Spectrometers in Mill Flour Industries for Protein, Moisture and Ash Content Estimation. Sensors. 2023; 23(20):8476. https://doi.org/10.3390/s23208476
Chicago/Turabian StyleBoglou, Vasileios, Dimosthenis Verginadis, and Athanasios Karlis. 2023. "Investigation on the Integration of Low-Cost NIR Spectrometers in Mill Flour Industries for Protein, Moisture and Ash Content Estimation" Sensors 23, no. 20: 8476. https://doi.org/10.3390/s23208476
APA StyleBoglou, V., Verginadis, D., & Karlis, A. (2023). Investigation on the Integration of Low-Cost NIR Spectrometers in Mill Flour Industries for Protein, Moisture and Ash Content Estimation. Sensors, 23(20), 8476. https://doi.org/10.3390/s23208476