
Determination of Sugars and Acids in Grape Must Using Miniaturized Near-Infrared Spectroscopy
 , , , , and
Abstract
:1. Introduction
2. Materials and Methods
2.1. Plant Material and Sampling
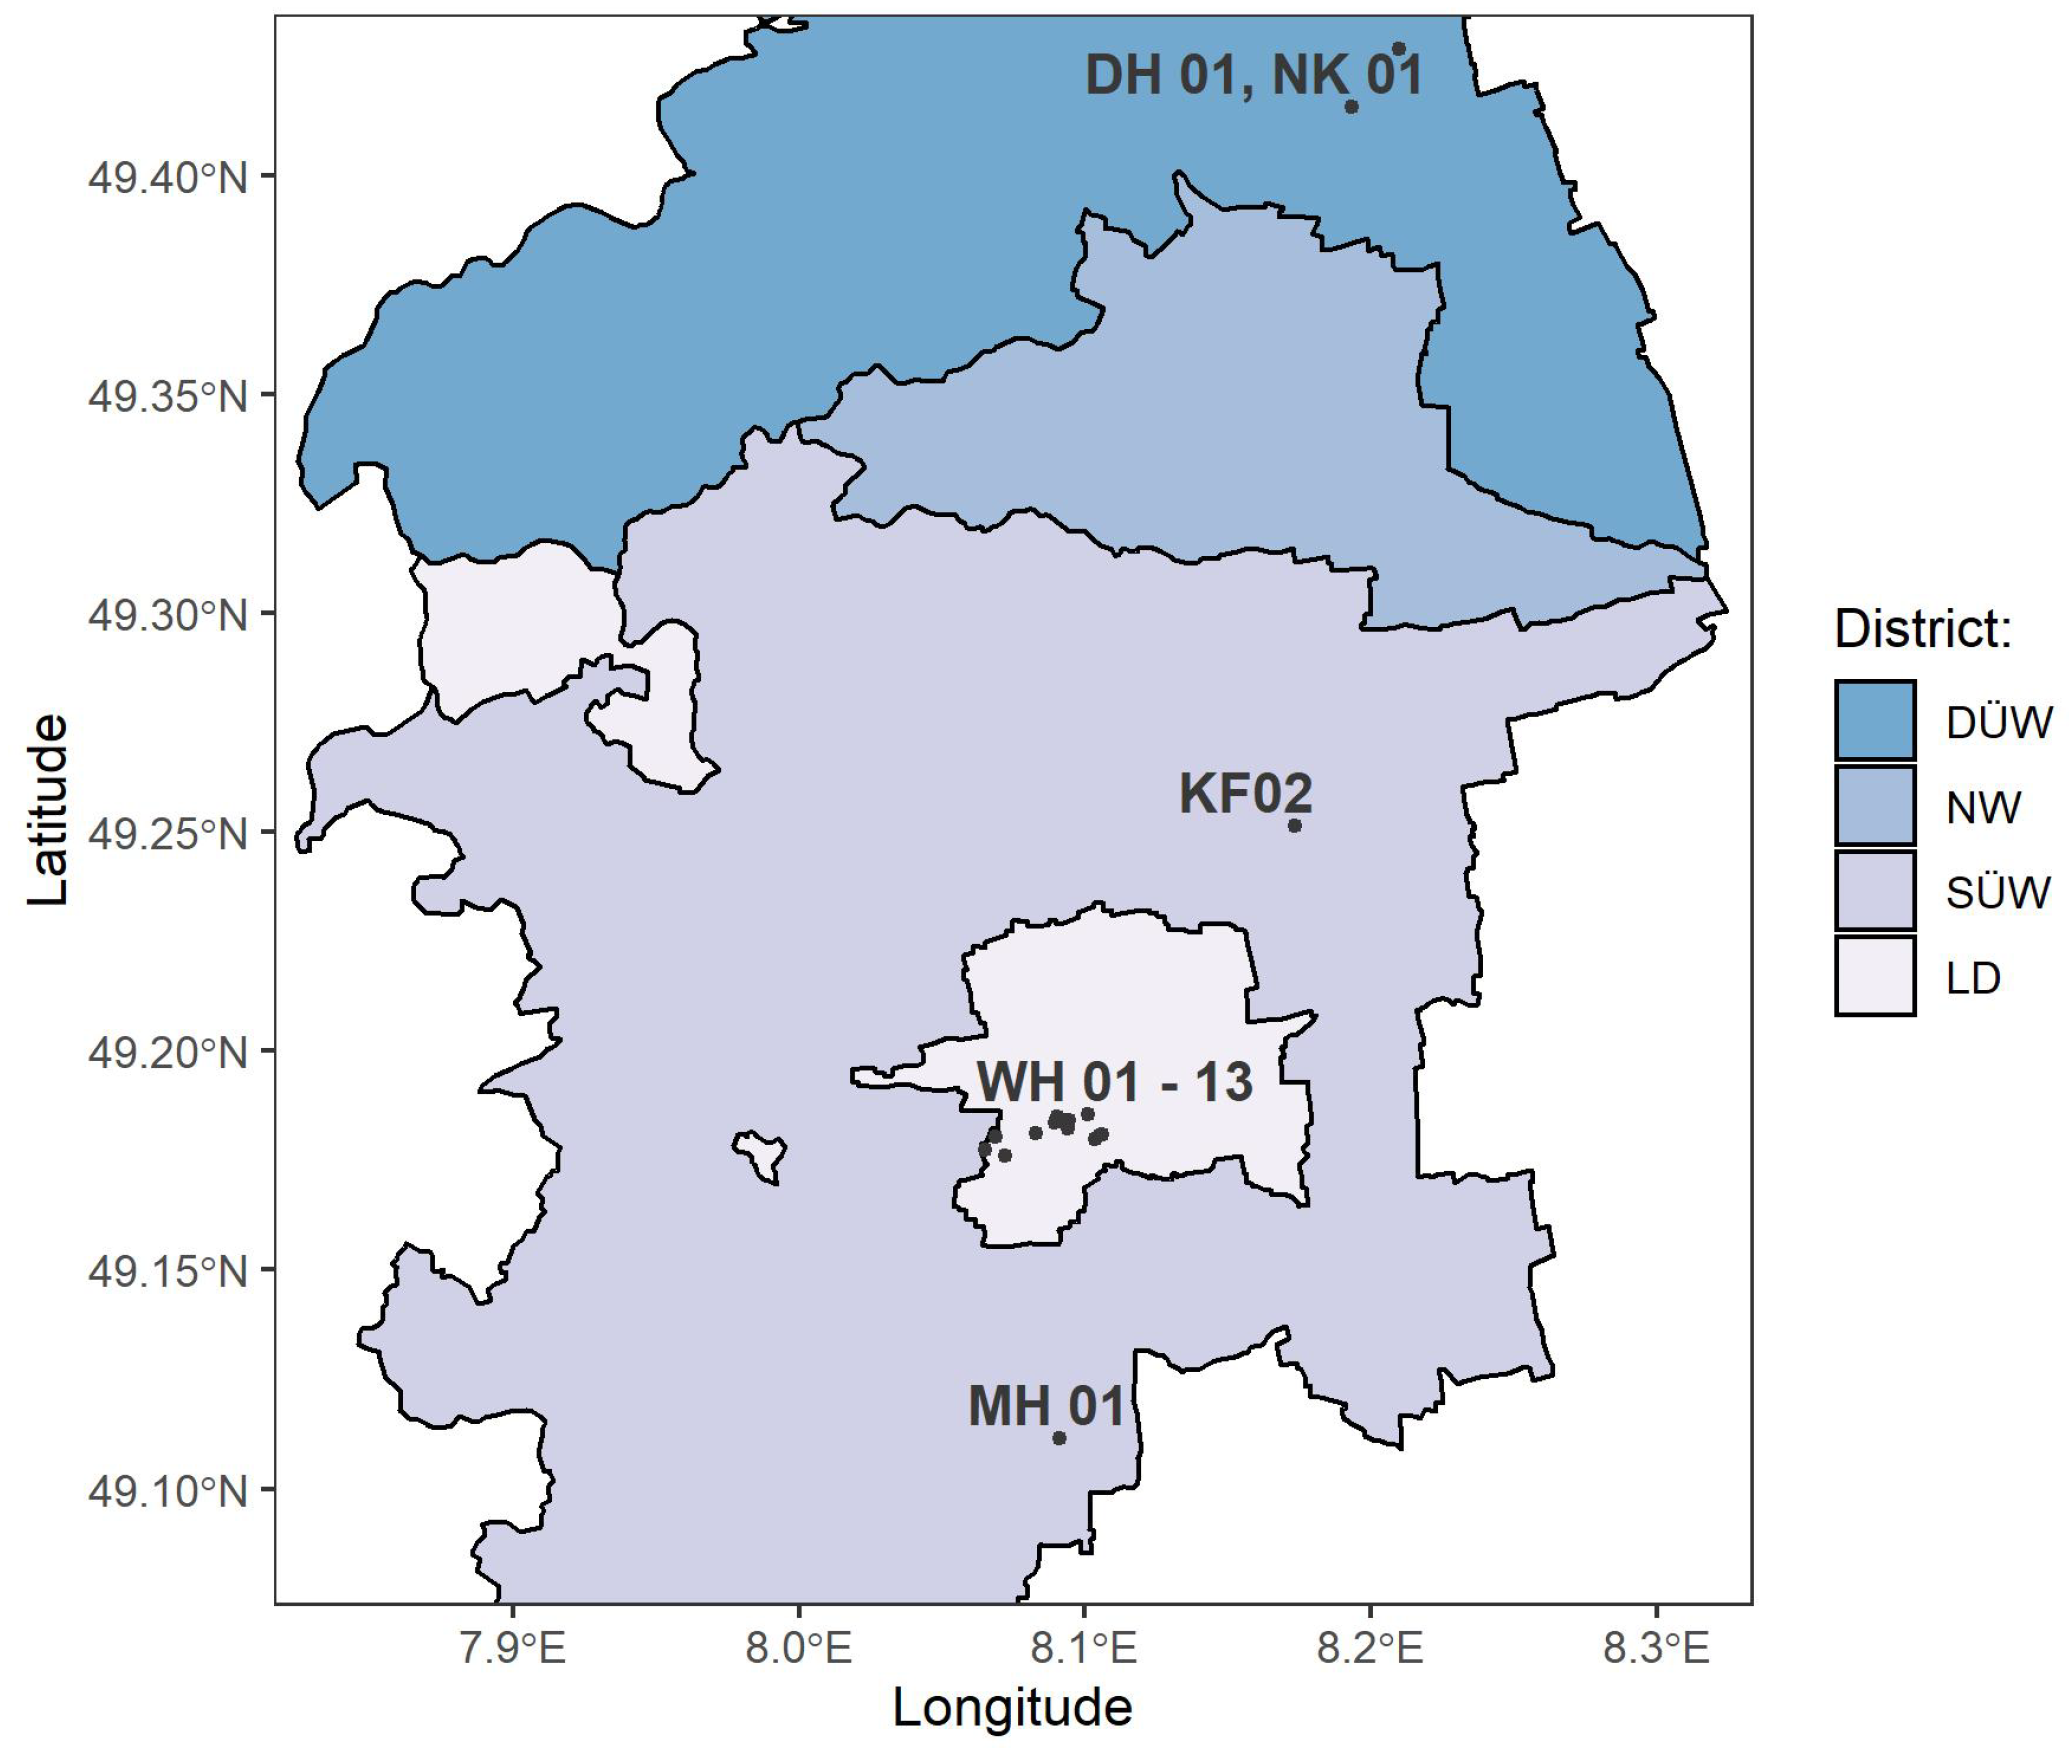
2.1.1. Grapevine Farming Sites and Used Vitis vinifera (L.) Varieties
2.1.2. Sampling and Processing Samples
2.2. Collection of Reference Values
2.2.1. High-Performance Liquid Chromatography
2.2.2. Fourier-Transform Infrared Spectroscopy
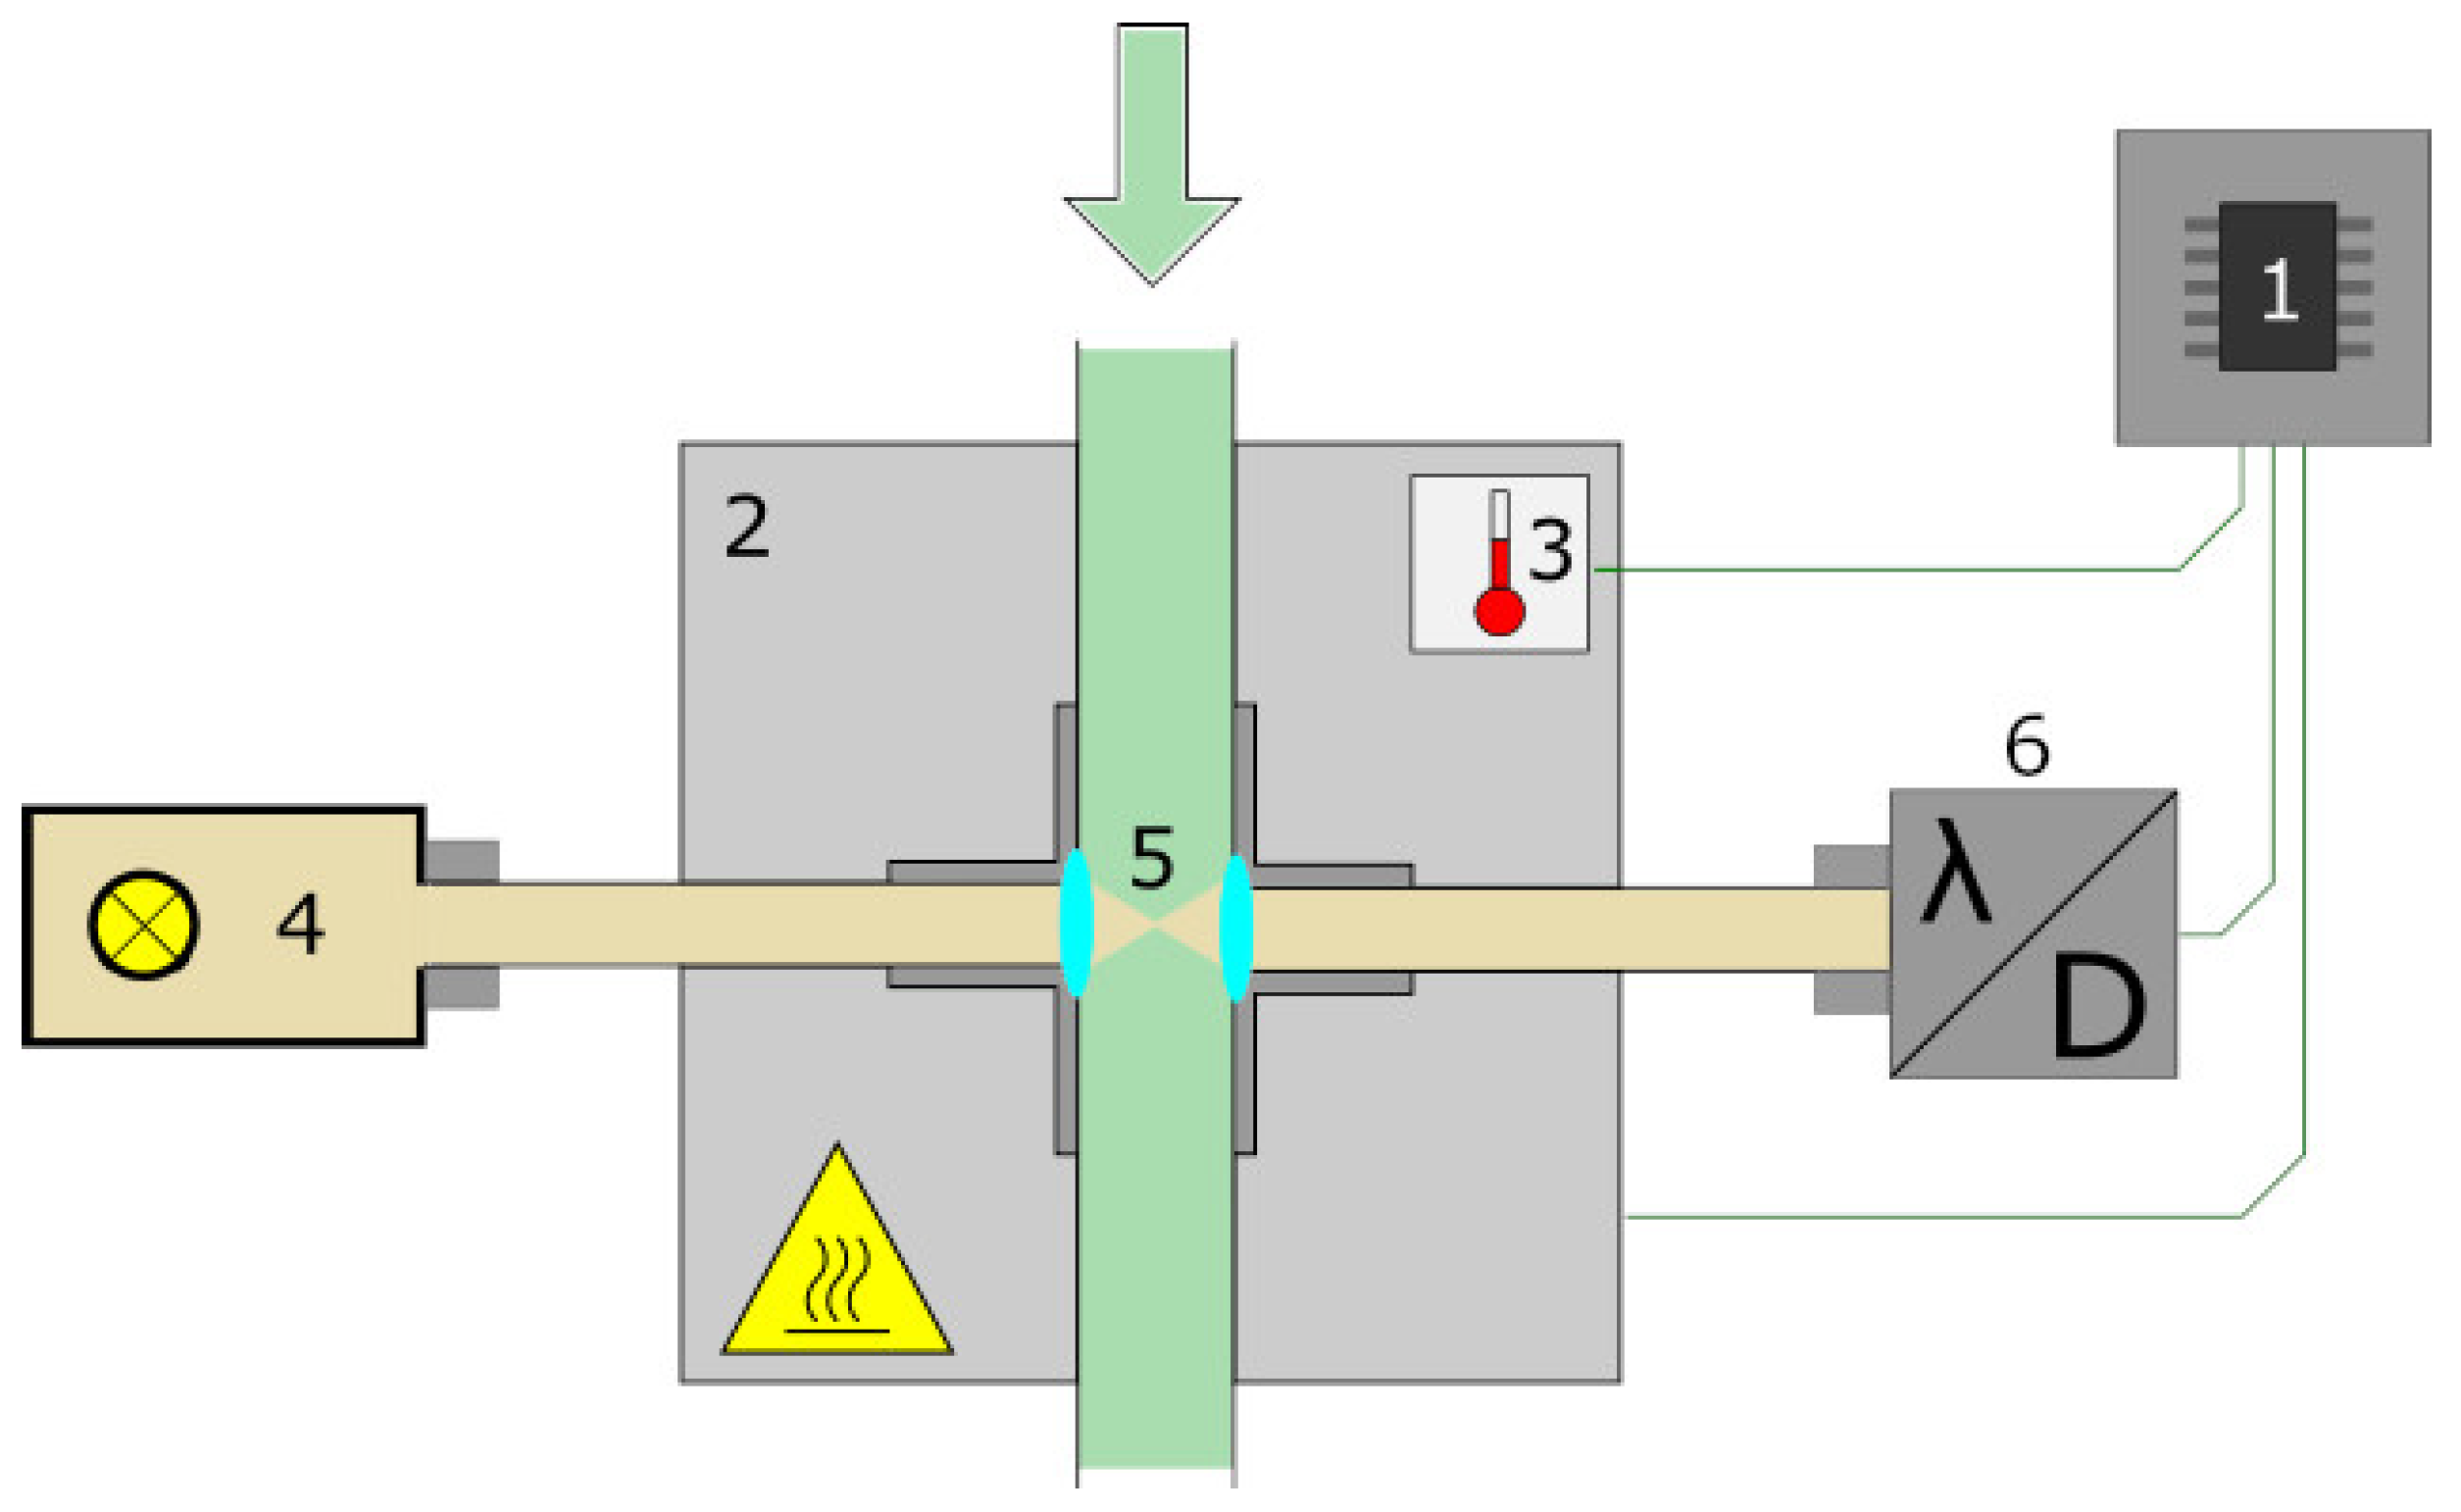
2.3. NIR Apparatus and Acquisition of Spectral Data
2.4. Spectral Processing and Statistical Analysis
3. Results
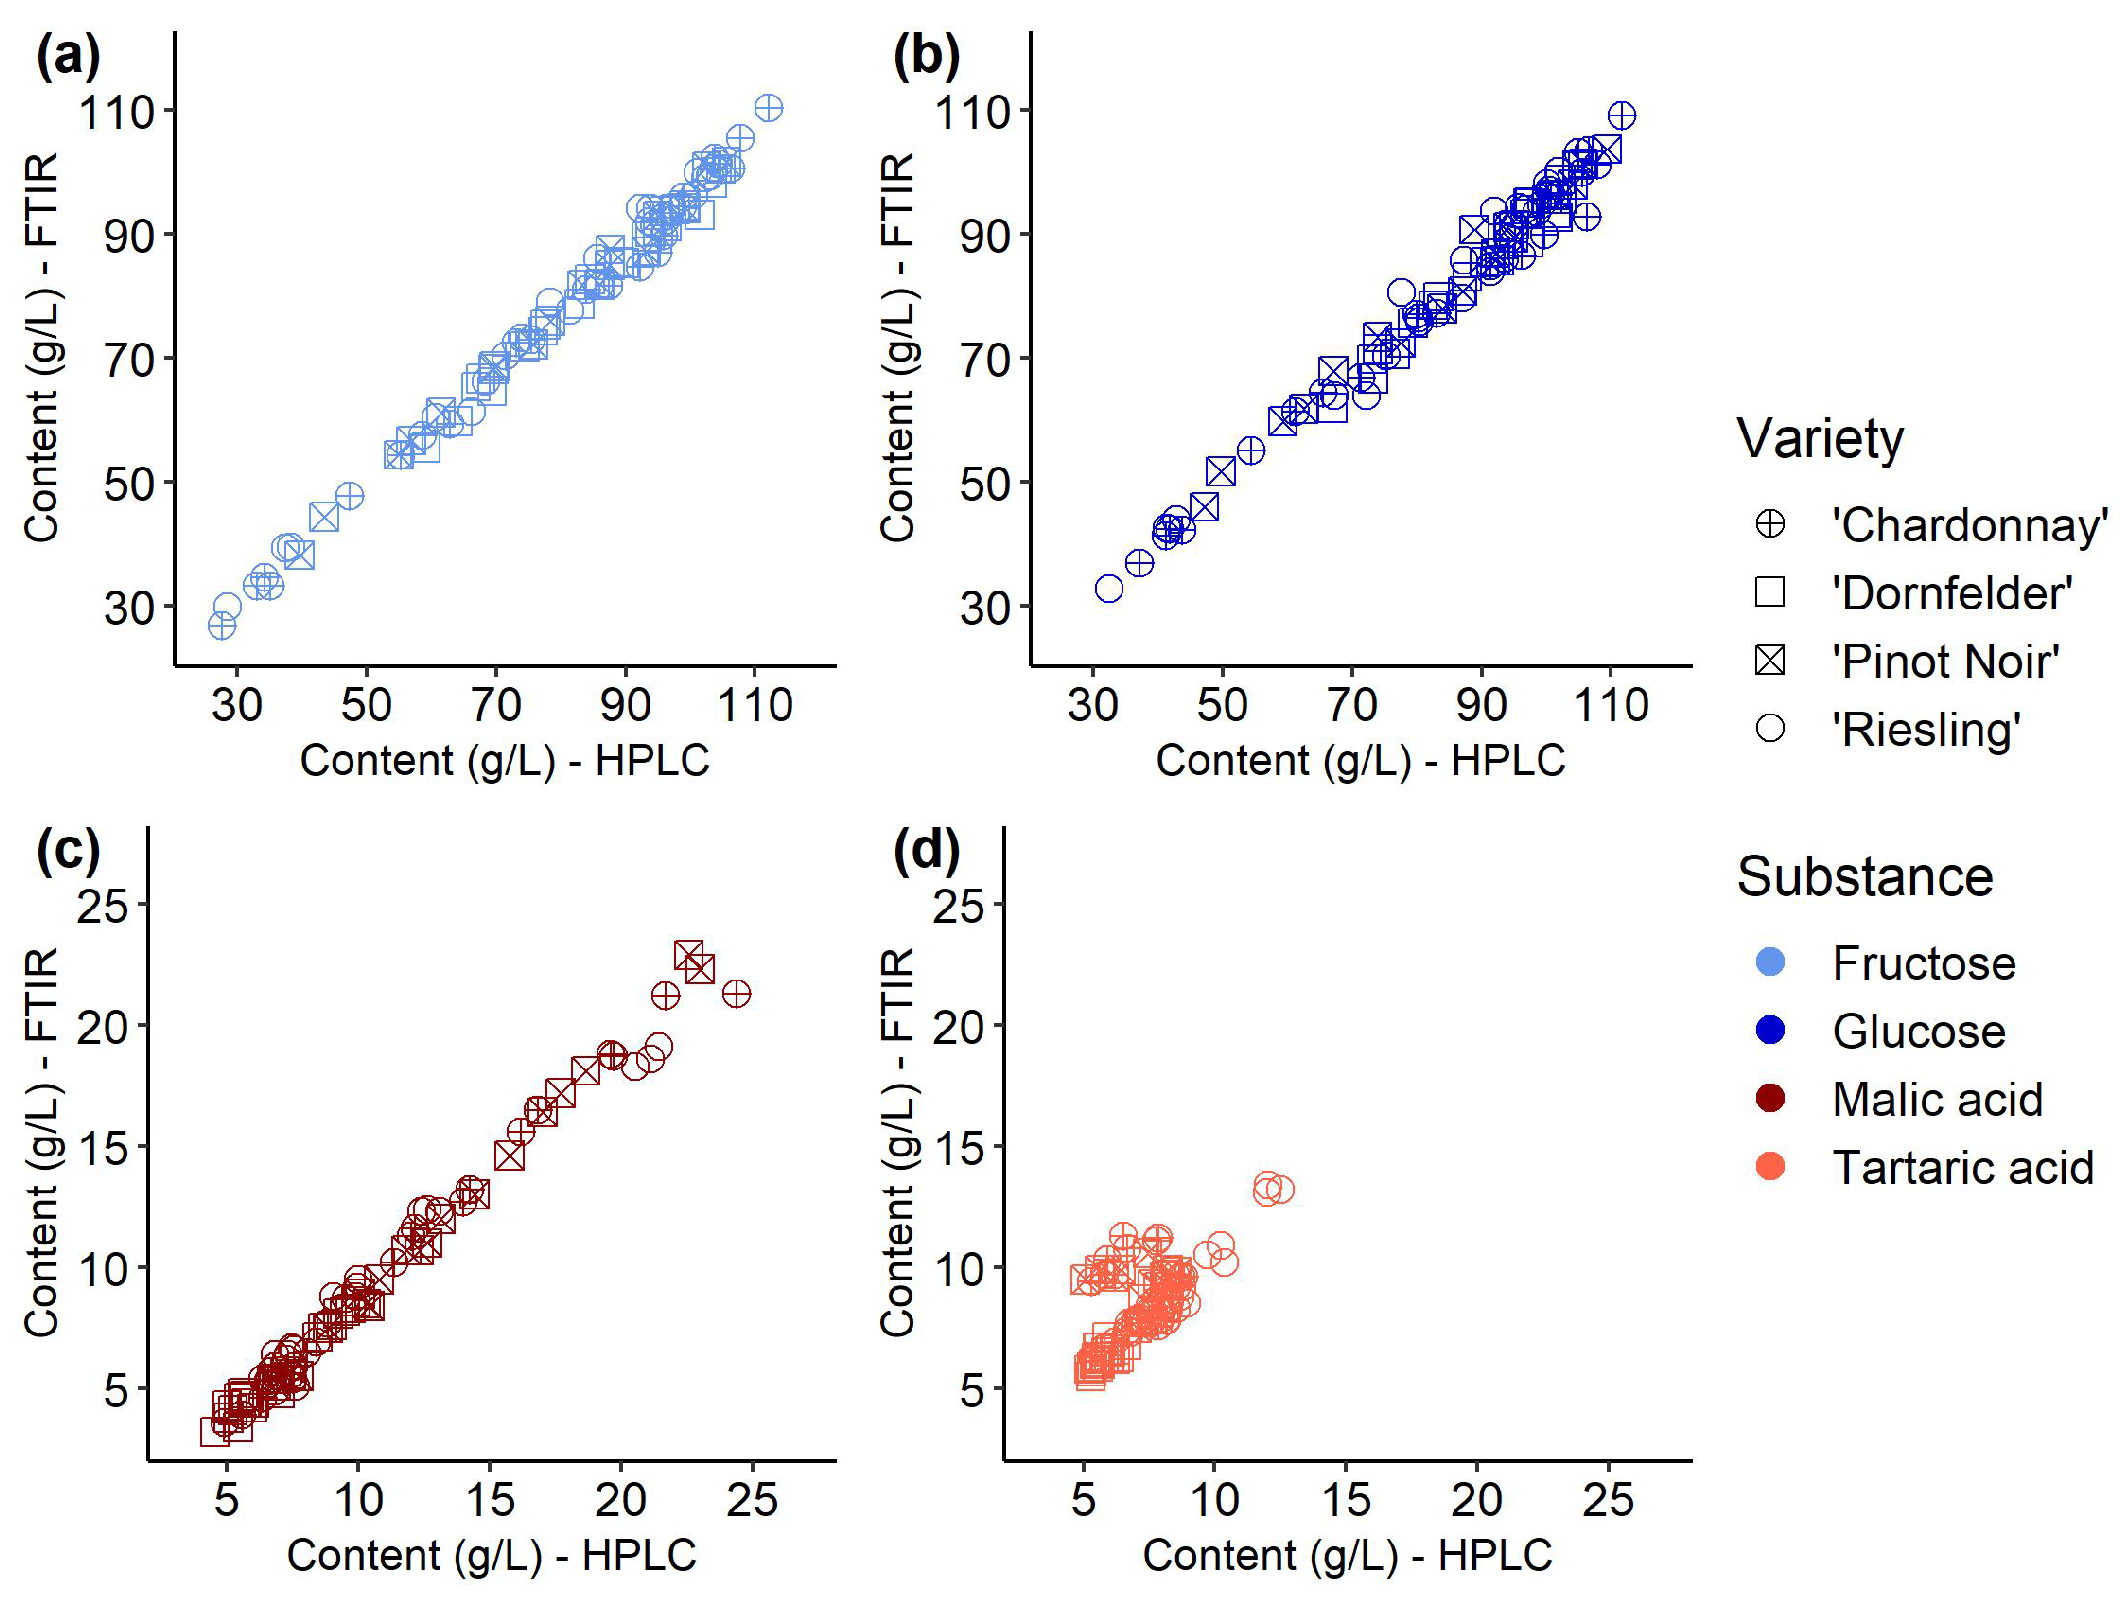
3.1. Reference Data
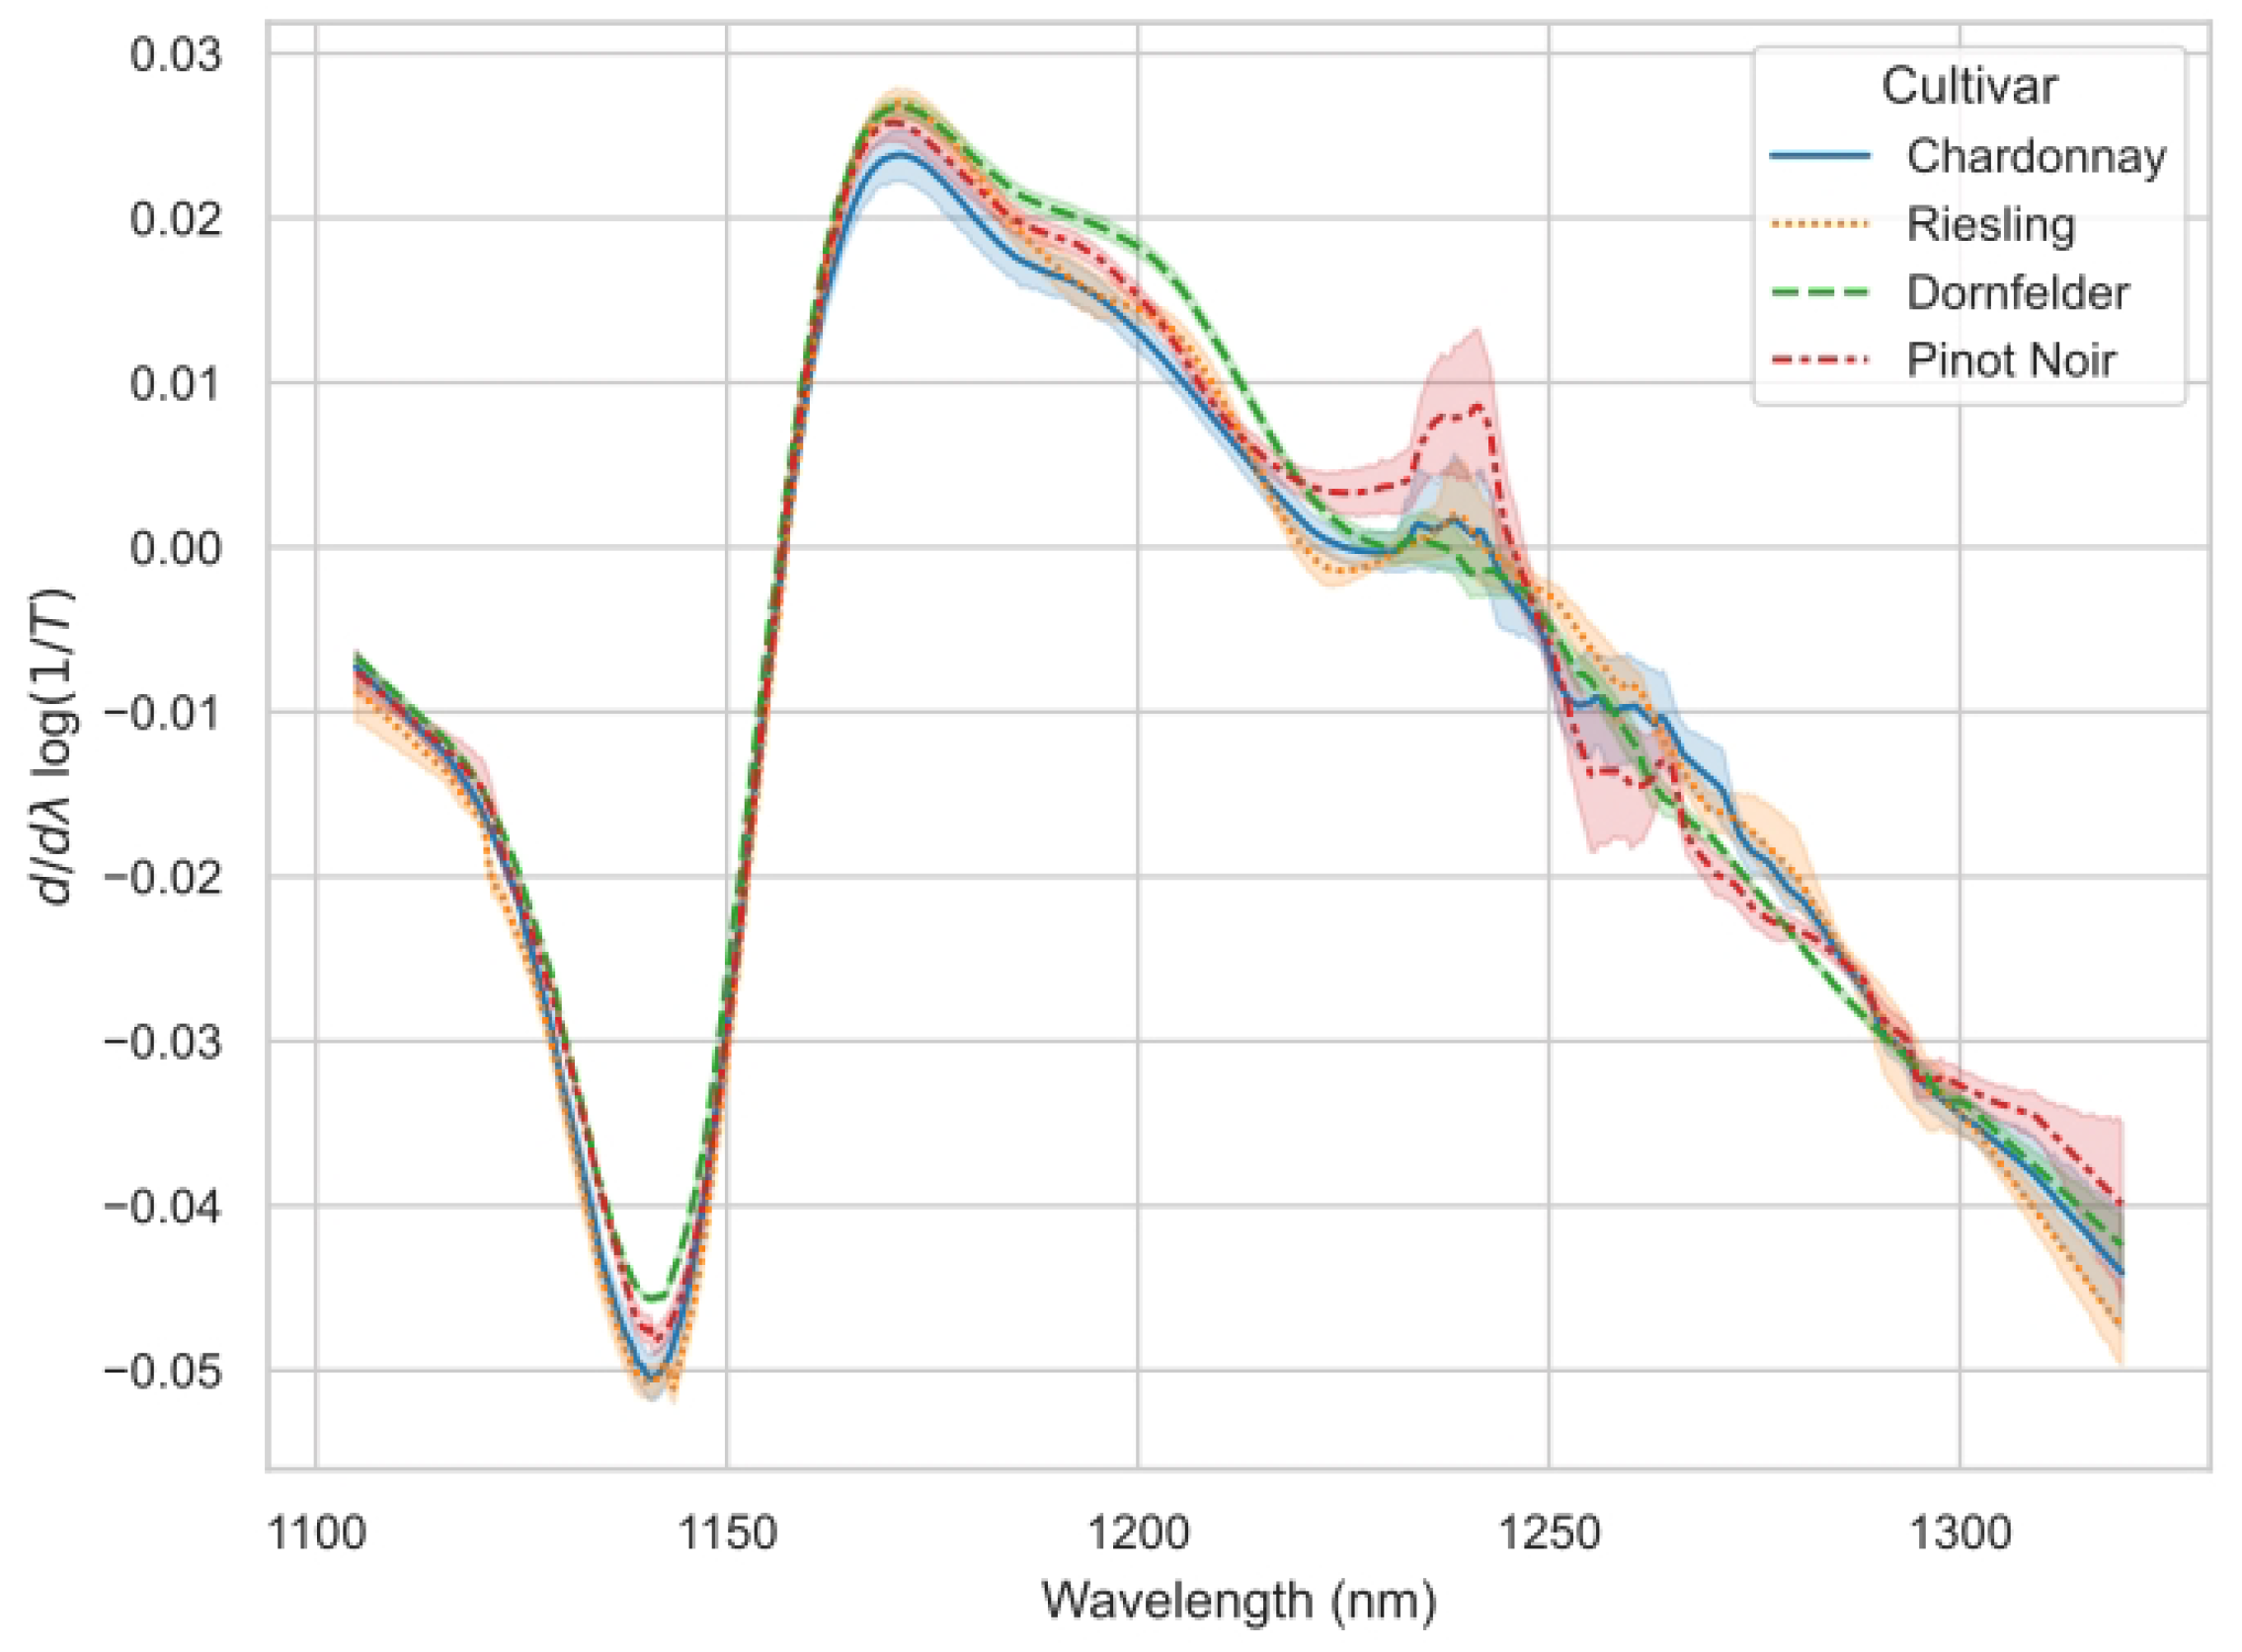
3.2. Spectra and Modelling
4. Discussion
5. Conclusions
Author Contributions
Funding
Institutional Review Board Statement
Informed Consent Statement
Data Availability Statement
Acknowledgments
Conflicts of Interest
Appendix A

| Abbreviation | Vitis vinifera | Planting | Farming | Root- | Orientation |
|---|---|---|---|---|---|
| Variety | Year | Practice | Stock | ||
| DH 01 | Pinot Noir | 2000 | Org | 26 G | W-O |
| KF 02 | Chardonnay | 2016 | Con | SO 4 | N-S |
| MH 01 | Dornfelder | 1997 | Org | 5 C | N-S |
| NK 01 | Chardonnay | 2010 | Org | SO 4 | N-S |
| WH 01 | Riesling | 2005 | Org | 5 C | N-S |
| WH 02 | Chardonnay | 2001 | Org | SO 4 | N-S |
| WH 03 | Dornfelder | 1997 | Org | 5 C | N-S |
| WH 04 | Riesling | 1991 | Con | 5 C | N-S |
| WH 05 | Pinot Noir | 1990 | Org | SO 4 | N-S |
| WH 06 | Dornfelder | 2002 | Con | 125 AA | N-S |
| WH 07 | Chardonnay | 2005 | Con | SO 4 | N-S |
| WH 08 | Riesling | 1991 | Org | Binova | N-S |
| WH 09 | Pinot Noir | 2004 | Con | 125 AA | N-S |
| WH 10 | Riesling | 2006 | Con | 5 C | N-S |
| WH 11 | Chardonnay | 1990 | Con | SO 4 | N-S |
| WH 12 | Dornfelder | 2004 | Con | 125 AA | N-S |
| WH 13 | Pinot Noir | 2001 | Con | SO 4 | N-S |
| Vitis vinifera | Substance | Median Content | RMSEP low | n low | RMSEP high | n high |
|---|---|---|---|---|---|---|
| variety | (g/L) | (g/L) | (g/L) | |||
| Chardonnay | Fructose | 85.67 | 9.89 | 39 | 5.73 | 39 |
| Glucose | 92.43 | 9.17 | 39 | 4.96 | 39 | |
| Malic acid | 9.76 | 1.3 | 39 | 2.25 | 39 | |
| Tartaric acid | 7.29 | 0.73 | 39 | 0.66 | 39 | |
| Riesling | Fructose | 89.12 | 6.31 | 33 | 3.66 | 33 |
| Glucose | 91.66 | 6.33 | 33 | 3.65 | 33 | |
| Malic acid | 7.57 | 0.64 | 33 | 1.08 | 33 | |
| Tartaric acid | 8.27 | 0.42 | 33 | 0.44 | 33 | |
| Dornfelder | Fructose | 89.07 | 6.29 | 36 | 3.98 | 36 |
| Glucose | 94.25 | 4.84 | 36 | 3.21 | 36 | |
| Malic acid | 6.04 | 0.38 | 36 | 0.45 | 36 | |
| Tartaric acid | 5.63 | 0.22 | 36 | 0.27 | 36 | |
| Pinot Noir | Fructose | 80.81 | 7.27 | 27 | 6.37 | 27 |
| Glucose | 87.95 | 6.88 | 27 | 6.08 | 27 | |
| Malic acid | 12.46 | 1.26 | 27 | 2.08 | 27 | |
| Tartaric acid | 7.55 | 0.57 | 27 | 0.43 | 27 |
| Vitis vinifera | Substance | RMSE F | r2 F | RMSE H | r2 H | RMSE HF | r2 HF | n |
|---|---|---|---|---|---|---|---|---|
| Variety | (g/L) | (g/L) | (g/L) | |||||
| Chardonnay | Fructose | 10.11 | 0.88 | 9.89 | 0.88 | 3.65 | 0.99 | 26 |
| Glucose | 9.50 | 0.88 | 8.63 | 0.89 | 5.47 | 0.99 | 26 | |
| Malic acid | 2.43 | 0.86 | 2.01 | 0.88 | 1.38 | 0.99 | 26 | |
| Tartaric acid | 2.55 | −0.04 | 0.60 | 0.70 | 2.36 | −0.02 | 26 | |
| Riesling | Fructose | 3.29 | 0.98 | 3.54 | 0.98 | 2.73 | 0.99 | 22 |
| Glucose | 4.21 | 0.97 | 4.03 | 0.96 | 4.04 | 0.98 | 22 | |
| Malic acid | 1.41 | 0.97 | 0.71 | 0.98 | 1.36 | 0.98 | 22 | |
| Tartaric acid | 0.69 | 0.92 | 0.39 | 0.95 | 0.64 | 0.94 | 22 | |
| Dornfelder | Fructose | 6.03 | 0.89 | 4.60 | 0.88 | 4.06 | 0.99 | 23 |
| Glucose | 6.59 | 0.88 | 3.67 | 0.90 | 5.27 | 0.97 | 23 | |
| Malic acid | 1.35 | 0.90 | 0.42 | 0.95 | 1.42 | 0.95 | 23 | |
| Tartaric acid | 0.63 | 0.09 | 0.22 | 0.63 | 0.60 | 0.29 | 23 | |
| Pinot Noir | Fructose | 7.19 | 0.87 | 6.55 | 0.88 | 2.73 | 0.99 | 18 |
| Glucose | 7.26 | 0.88 | 5.73 | 0.90 | 4.28 | 0.98 | 18 | |
| Malic acid | 2.03 | 0.87 | 1.67 | 0.86 | 1.32 | 0.99 | 18 | |
| Tartaric acid | 2.28 | −0.03 | 0.5 | 0.76 | 2.23 | 0 | 18 |
| Timepoint (n) | Fructose (g / L) | Glucose (g / L) | Malic Acid (g / L) | Tartaric Acid (g / L) | |
|---|---|---|---|---|---|
| ’Chardonnay’ | |||||
| T3 (4) | min–max | 27.63–35.10 | 37.12–43.62 | 19.59–24.38 | 6.51–7.87 |
| median (sd) | 33.58 (3.03) | 41.52 (2.48) | 20.70 (2.03) | 7.22 (0.65) | |
| T4 (4) | min–max | 47.34–62.81 | 54.35–71.31 | 13.97–16.82 | 5.32–6.19 |
| median (sd) | 56.90 (5.93) | 63.35 (6.47) | 15.20 (1.28) | 5.86 (0.33) | |
| T5 (4) | min–max | 71.48–83.97 | 79.90–91.38 | 9.52–12.16 | 8.51–8.83 |
| median (sd) | 74.25 (5.03) | 81.63 (4.84) | 11.69 (1.10) | 8.63 (0.14) | |
| T6 (5) | min–max | 77.47–95.96 | 86.61–106.30 | 6.89–14.10 | 7.86–9.30 |
| median (sd) | 92.27 (7.01) | 96.19 (6.76) | 8.42 (2.59) | 8.16 (0.54) | |
| T7 (5) | min–max | 94.12–106.36 | 98.33–107.94 | 5.56–10.00 | 5.32–8.50 |
| median (sd) | 98.87 (4.36) | 100.68 (3.63) | 7.50 (1.46) | 6.21 (1.17) | |
| T8 (4) | min–max | 103.84–112.19 | 105.02–111.70 | 4.89–6.68 | 6.68–7.37 |
| median (sd) | 106.09 (3.49) | 106.06 (2.77) | 6.46 (0.75) | 7.12 (0.26) | |
| ’Riesling’ | |||||
| T5 (3) | min–max | 28.49–38.26 | 32.37–42.81 | 20.53–21.44 | 11.99–12.49 |
| median (sd) | 37.39 (4.68) | 41.34 (4.90) | 21.10 (0.40) | 12.02 (0.24) | |
| T6 (3) | min–max | 60.63–68.40 | 67.23–75.31 | 12.39–13.06 | 9.72–10.36 |
| median (sd) | 66.17 (3.47) | 72.24 (3.53) | 12.60 (0.30) | 10.22 (0.29) | |
| T7 (4) | min–max | 73.99–85.99 | 77.63–91.37 | 9.03–9.99 | 7.58–8.94 |
| median (sd) | 79.85 (4.57) | 83.72 (5.64) | 9.93 (0.41) | 8.39 (0.52) | |
| T8 (4) | min–max | 85.69–94.41 | 87.30–95.76 | 7.27–7.53 | 7.55–8.22 |
| median (sd) | 93.83 (3.78) | 94.61 (3.53) | 7.39 (0.11) | 7.97 (0.28) | |
| T9 (4) | min–max | 92.24–101.12 | 91.94–101.87 | 6.34–7.62 | 6.76–7.53 |
| median (sd) | 98.93 (3.68) | 98.02 (3.83) | 6.80 (0.51) | 6.89 (0.32) | |
| T10 (4) | min–max | 96.16–103.68 | 94.25–100.39 | 6.73–6.83 | 8.10–8.75 |
| median (sd) | 102.77 (3.16) | 100.08 (2.69) | 6.81 (0.04) | 8.50 (0.28) | |
| ’Dornfelder’ | |||||
| T3 (3) | min–max | 59.02–69.39 | 66.93–76.55 | 9.47–9.90 | 6.22–6.65 |
| median (sd) | 64.08 (4.49) | 73.20 (4.23) | 9.70 (0.19) | 6.36 (0.19) | |
| T4 (4) | min–max | 66.88–77.26 | 73.07–82.53 | 8.45–9.23 | 5.79–6.19 |
| median (sd) | 71.02 (4.62) | 76.66 (4.06) | 8.81 (0.32) | 5.95 (0.16) | |
| T5 (4) | min–max | 77.59–89.73 | 83.29–94.25 | 6.87–7.44 | 5.52–5.91 |
| median (sd) | 84.51 (4.66) | 89.09 (4.17) | 7.13 (0.23) | 5.58 (0.16) | |
| T6 (4) | min–max | 84.46–95.00 | 92.75–101.84 | 5.42–6.04 | 5.35–5.99 |
| median (sd) | 91.49 (4.38) | 99.36 (3.85) | 5.72 (0.23) | 5.54 (0.26) | |
| T7 (4) | min–max | 93.25–99.10 | 95.06–100.11 | 5.05–5.66 | 5.29–6.20 |
| median (sd) | 97.00 (2.25) | 97.11 (1.90) | 5.52 (0.25) | 5.43 (0.39) | |
| T8 (4) | min–max | 96.09–104.79 | 97.16–104.82 | 4.54–5.96 | 5.22–6.04 |
| median (sd) | 102.43 (3.44) | 102.29 (2.91) | 5.11 (0.54) | 5.57 (0.31) | |
| ’Pinot Noir’ | |||||
| T3 (1) | 39.59 | 47.09 | 23 | 7.44 | |
| T4 (4) | min–max | 43.37–69.58 | 49.63–77.49 | 12.61–22.57 | 5.06–6.43 |
| median (sd) | 55.90 (9.71) | 60.88 (10.45) | 17.82 (3.73) | 5.90 (0.55) | |
| T5 (4) | min–max | 61.44–87.62 | 67.11–94.97 | 10.42–17.69 | 7.65–8.55 |
| median (sd) | 74.05 (10.19) | 80.47 (11.39) | 14.43 (2.86) | 8.03 (0.36) | |
| T6 (4) | min–max | 75.74–99.25 | 83.91–104.12 | 7.71–14.42 | 7.26–8.27 |
| median (sd) | 89.59 (9.15) | 93.10 (7.51) | 11.30 (2.59) | 8.15 (0.43) | |
| T7 (3) | min–max | 83.24–105.64 | 92.19–109.32 | 6.73–11.83 | 5.48–7.32 |
| median (sd) | 95.01 (9.71) | 101.18 (7.42) | 10.05 (2.24) | 7.03 (0.85) | |
| T8 (2) | min–max | 87.68–102.57 | 88.84–105.61 | 8.84–10.78 | 7.86–8.16 |
| median (sd) | 95.12 +(8.16) | 97.23 (9.18) | 9.81 (1.06) | 8.01 (0.16) | |
References
- Coombe, B.G. Relationship of growth and development to changes in sugars, auxins, and gibberilins in fruit of seeded and seedless varieties of Vitis vinifera. Plant Physiol. 1960, 35, 241–250. [Google Scholar] [CrossRef] [Green Version]
- Coombe, B.G.; Hale, C.R. The hormone content of ripening grape berries and the effects of growth substance treatments. Plant Physiol. 1973, 51, 629–634. [Google Scholar] [CrossRef] [Green Version]
- Ollat, N.; Diakou-Verdin, P.; Carde, J.P.; Barrieu, F.; Gaudillère, J.P.; Moing, A. Grape berry development: A review. J. Int. Sci. Vigne Vin 2002, 36, 109–131. [Google Scholar]
- Mira de Orduña Heidinger, R. Climate change associated effects on grape and wine quality and production. Food Res. Int. 2010, 43, 1844–1855. [Google Scholar] [CrossRef]
- van Leeuwen, C.; Destrac-Irvine, A. Modified grape composition under climate change conditions requires adaptations in the vineyard. OENO One 2017, 51, 147. [Google Scholar] [CrossRef]
- Rienth, M.; Torregrosa, L.; Sarah, G.; Ardisson, M.; Brillouet, J.M.; Romieu, C. Temperature desynchronizes sugar and organic acid metabolism in ripening grapevine fruits and remodels their transcriptome. BMC Plant Biol. 2016, 16, 164. [Google Scholar] [CrossRef] [PubMed]
- Keller, M.; Smith, J.P.; Bondada, B.R. Ripening grape berries remain hydraulically connected to the shoot. J. Exp. Bot. 2006, 57, 2577–2587. [Google Scholar] [CrossRef] [PubMed] [Green Version]
- Keller, M. Managing grapevines to optimise fruit development in a challenging environment: A climate change primer for viticulturists. Aust. J. Grape Wine Res. 2010, 16, 56–69. [Google Scholar] [CrossRef]
- Cozzolino, D.; Dambergs, R.G.; Janik, L.; Cynkar, W.U.; Gishen, M. Review: Analysis of grapes and wine by near infrared spectroscopy. J. Near Infrared Spectrosc. 2006, 14, 279–289. [Google Scholar] [CrossRef]
- Huang, H.; Yu, H.; Xu, H.; Ying, Y. Near infrared spectroscopy for on/in-line monitoring of quality in foods and beverages: A review. J. Food Eng. 2008, 87, 303–313. [Google Scholar] [CrossRef]
- González-Caballero, V.; Sánchez, M.T.; López, M.I.; Pérez-Marín, D. First steps towards the development of a non-destructive technique for the quality control of wine grapes during on-vine ripening and on arrival at the winery. J. Food Eng. 2010, 101, 158–165. [Google Scholar] [CrossRef]
- Fernández-Novales, J.; López, M.I.; Sánchez, M.T.; García-Mesa, J.A.; González-Caballero, V. Assessment of quality parameters in grapes during ripening using a miniature fiber-optic near-infrared spectrometer. Int. J. Food Sci. Nutr. 2009, 60 (Suppl. S7), 265–277. [Google Scholar] [CrossRef]
- Krause, J.; Grüger, H.; Gebauer, L.; Zheng, X.; Knobbe, J.; Pügner, T.; Kicherer, A.; Gruna, R.; Längle, T.; Beyerer, J. SmartSpectrometer—Embedded Optical Spectroscopy for Applications in Agriculture and Industry. Sensors 2021, 21, 4476. [Google Scholar] [CrossRef] [PubMed]
- R Core Team. R: A Language and Environment for Statistical Computing; R Core Team: Vienna, Austria, 2021. [Google Scholar]
- Wickham, H. ggplot2: Elegant Graphics for Data Analysis; Springer: New York, NY, USA, 2016. [Google Scholar]
- Kassambara, A. ggpubr: ’ggplot2’ Based Publication Ready Plots, R Package Version 0.4.0. 2020.
- Pebesma, E. Simple Features for R: Standardized Support for Spatial Vector Data. R J. 2018, 10, 439–446. [Google Scholar] [CrossRef] [Green Version]
- Giangiacomo, R. Study of water–sugar interactions at increasing sugar concentration by NIR spectroscopy. Food Chem. 2006, 96, 371–379. [Google Scholar] [CrossRef]
- Dambergs, R.; Gishen, M.; Cozzolino, D. A Review of the State of the Art, Limitations, and Perspectives of Infrared Spectroscopy for the Analysis of Wine Grapes, Must, and Grapevine Tissue. Appl. Spectrosc. Rev. 2015, 50, 261–278. [Google Scholar] [CrossRef]
- Burbidge, C.A.; Ford, C.M.; Melino, V.J.; Wong, D.C.J.; Jia, Y.; Jenkins, C.L.D.; Soole, K.L.; Castellarin, S.D.; Darriet, P.; Rienth, M.; et al. Biosynthesis and Cellular Functions of Tartaric Acid in Grapevines. Front. Plant Sci. 2021, 12, 643024. [Google Scholar] [CrossRef]
- Martelo-Vidal, M.J.; Domínguez-Agis, F.; Vázquez, M. Ultraviolet/visible/near-infrared spectral analysis and chemometric tools for the discrimination of wines between subzones inside a controlled designation of origin: A case study of Rías Baixas. Aust. J. Grape Wine Res. 2013, 19, 62–67. [Google Scholar] [CrossRef]
- Liu, L.; Cozzolino, D.; Cynkar, W.U.; Gishen, M.; Colby, C.B. Geographic classification of spanish and Australian tempranillo red wines by visible and near-infrared spectroscopy combined with multivariate analysis. J. Agric. Food Chem. 2006, 54, 6754–6759. [Google Scholar] [CrossRef]
- Cozzolino, D.; Cynkar, W.U.; Shah, N.; Smith, P.A. Can spectroscopy geographically classify Sauvignon Blanc wines from Australia and New Zealand? Food Chem. 2011, 126, 673–678. [Google Scholar] [CrossRef]
- Arana, I.; Jarén, C.; Arazuri, S. Maturity, variety and origin determination in white grapes (Vitis Vinifera L.) using near infrared refl ectance technology. J. Near Infrared Spectrosc. 2005, 13, 349–357. [Google Scholar] [CrossRef]


| Variety | Substance | Value Range | RMSEP | R2 | ||
|---|---|---|---|---|---|---|
| (nsample/nspectra) | (g/L) | (g/L) | ||||
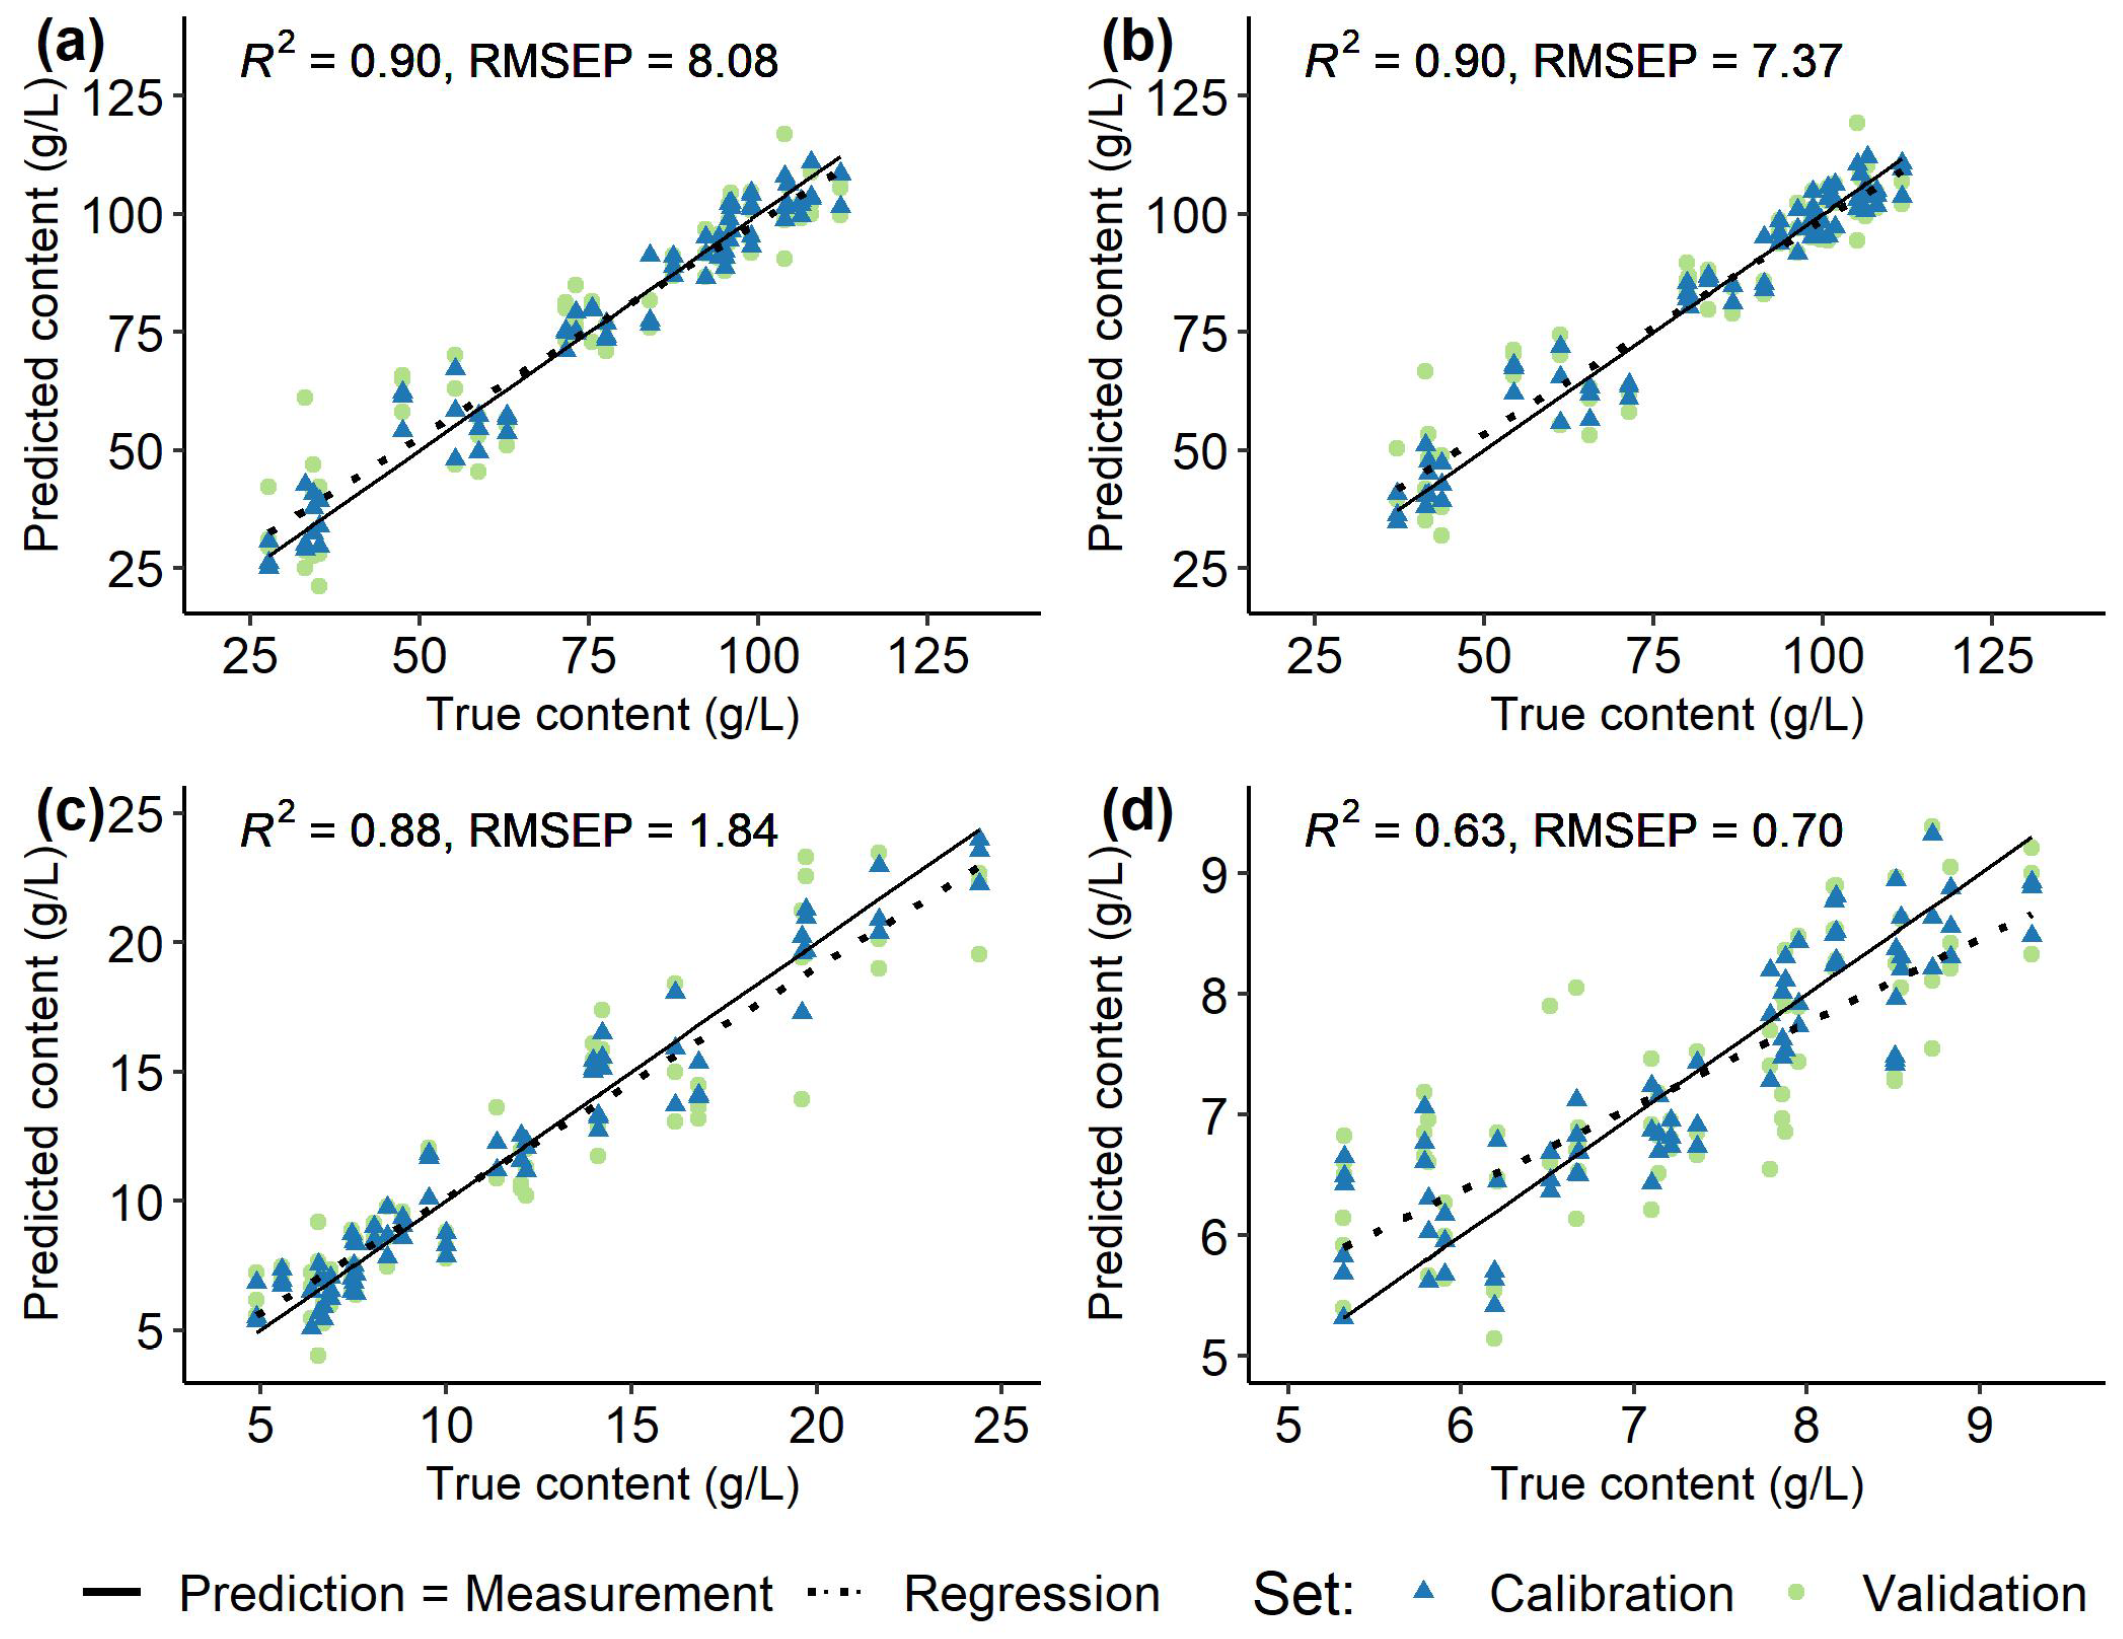
| ’Chardonnay’ | Fructose | 27.63 | – | 112.19 | 8.08 | 0.90 |
| (26/78) | Glucose | 37.12 | – | 111.70 | 7.37 | 0.90 |
| Malic acid | 4.89 | – | 24.38 | 1.84 | 0.88 | |
| Tartaric acid | 5.32 | – | 9.30 | 0.70 | 0.63 | |
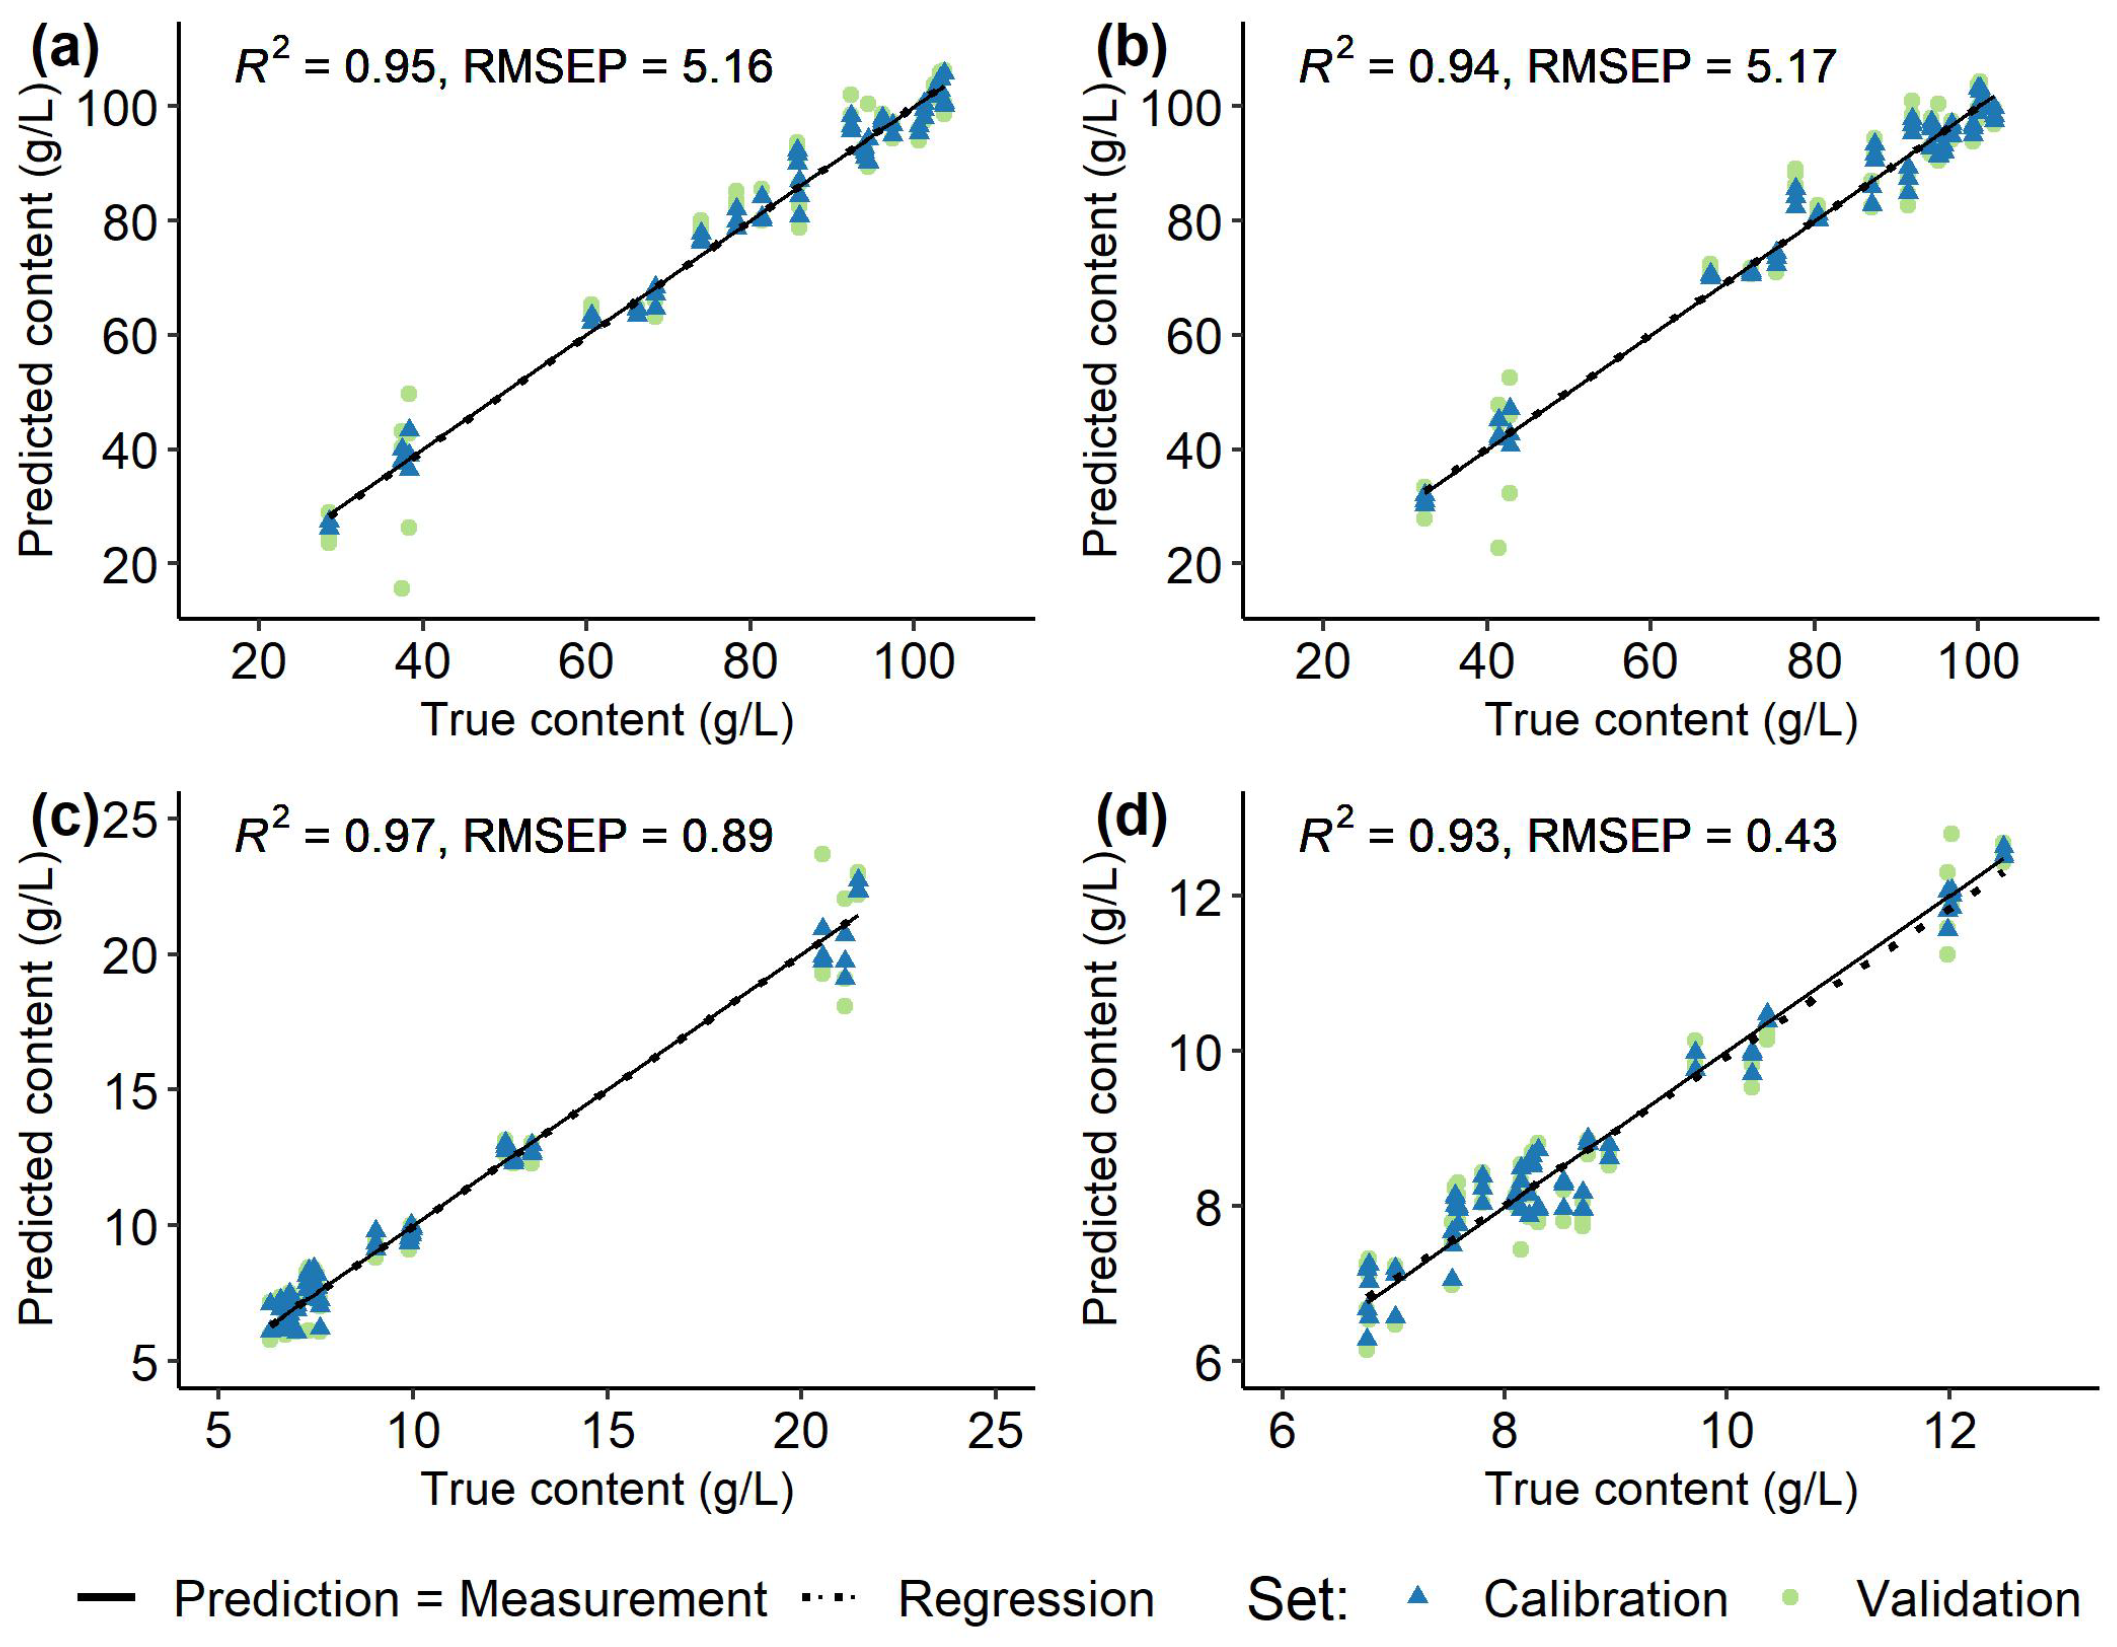
| ’Riesling’ | Fructose | 28.49 | – | 103.68 | 5.16 | 0.95 |
| (22/66) | Glucose | 32.37 | – | 101.87 | 5.17 | 0.94 |
| Malic acid | 6.34 | – | 21.44 | 0.89 | 0.97 | |
| Tartaric acid | 6.76 | – | 12.49 | 0.43 | 0.93 | |
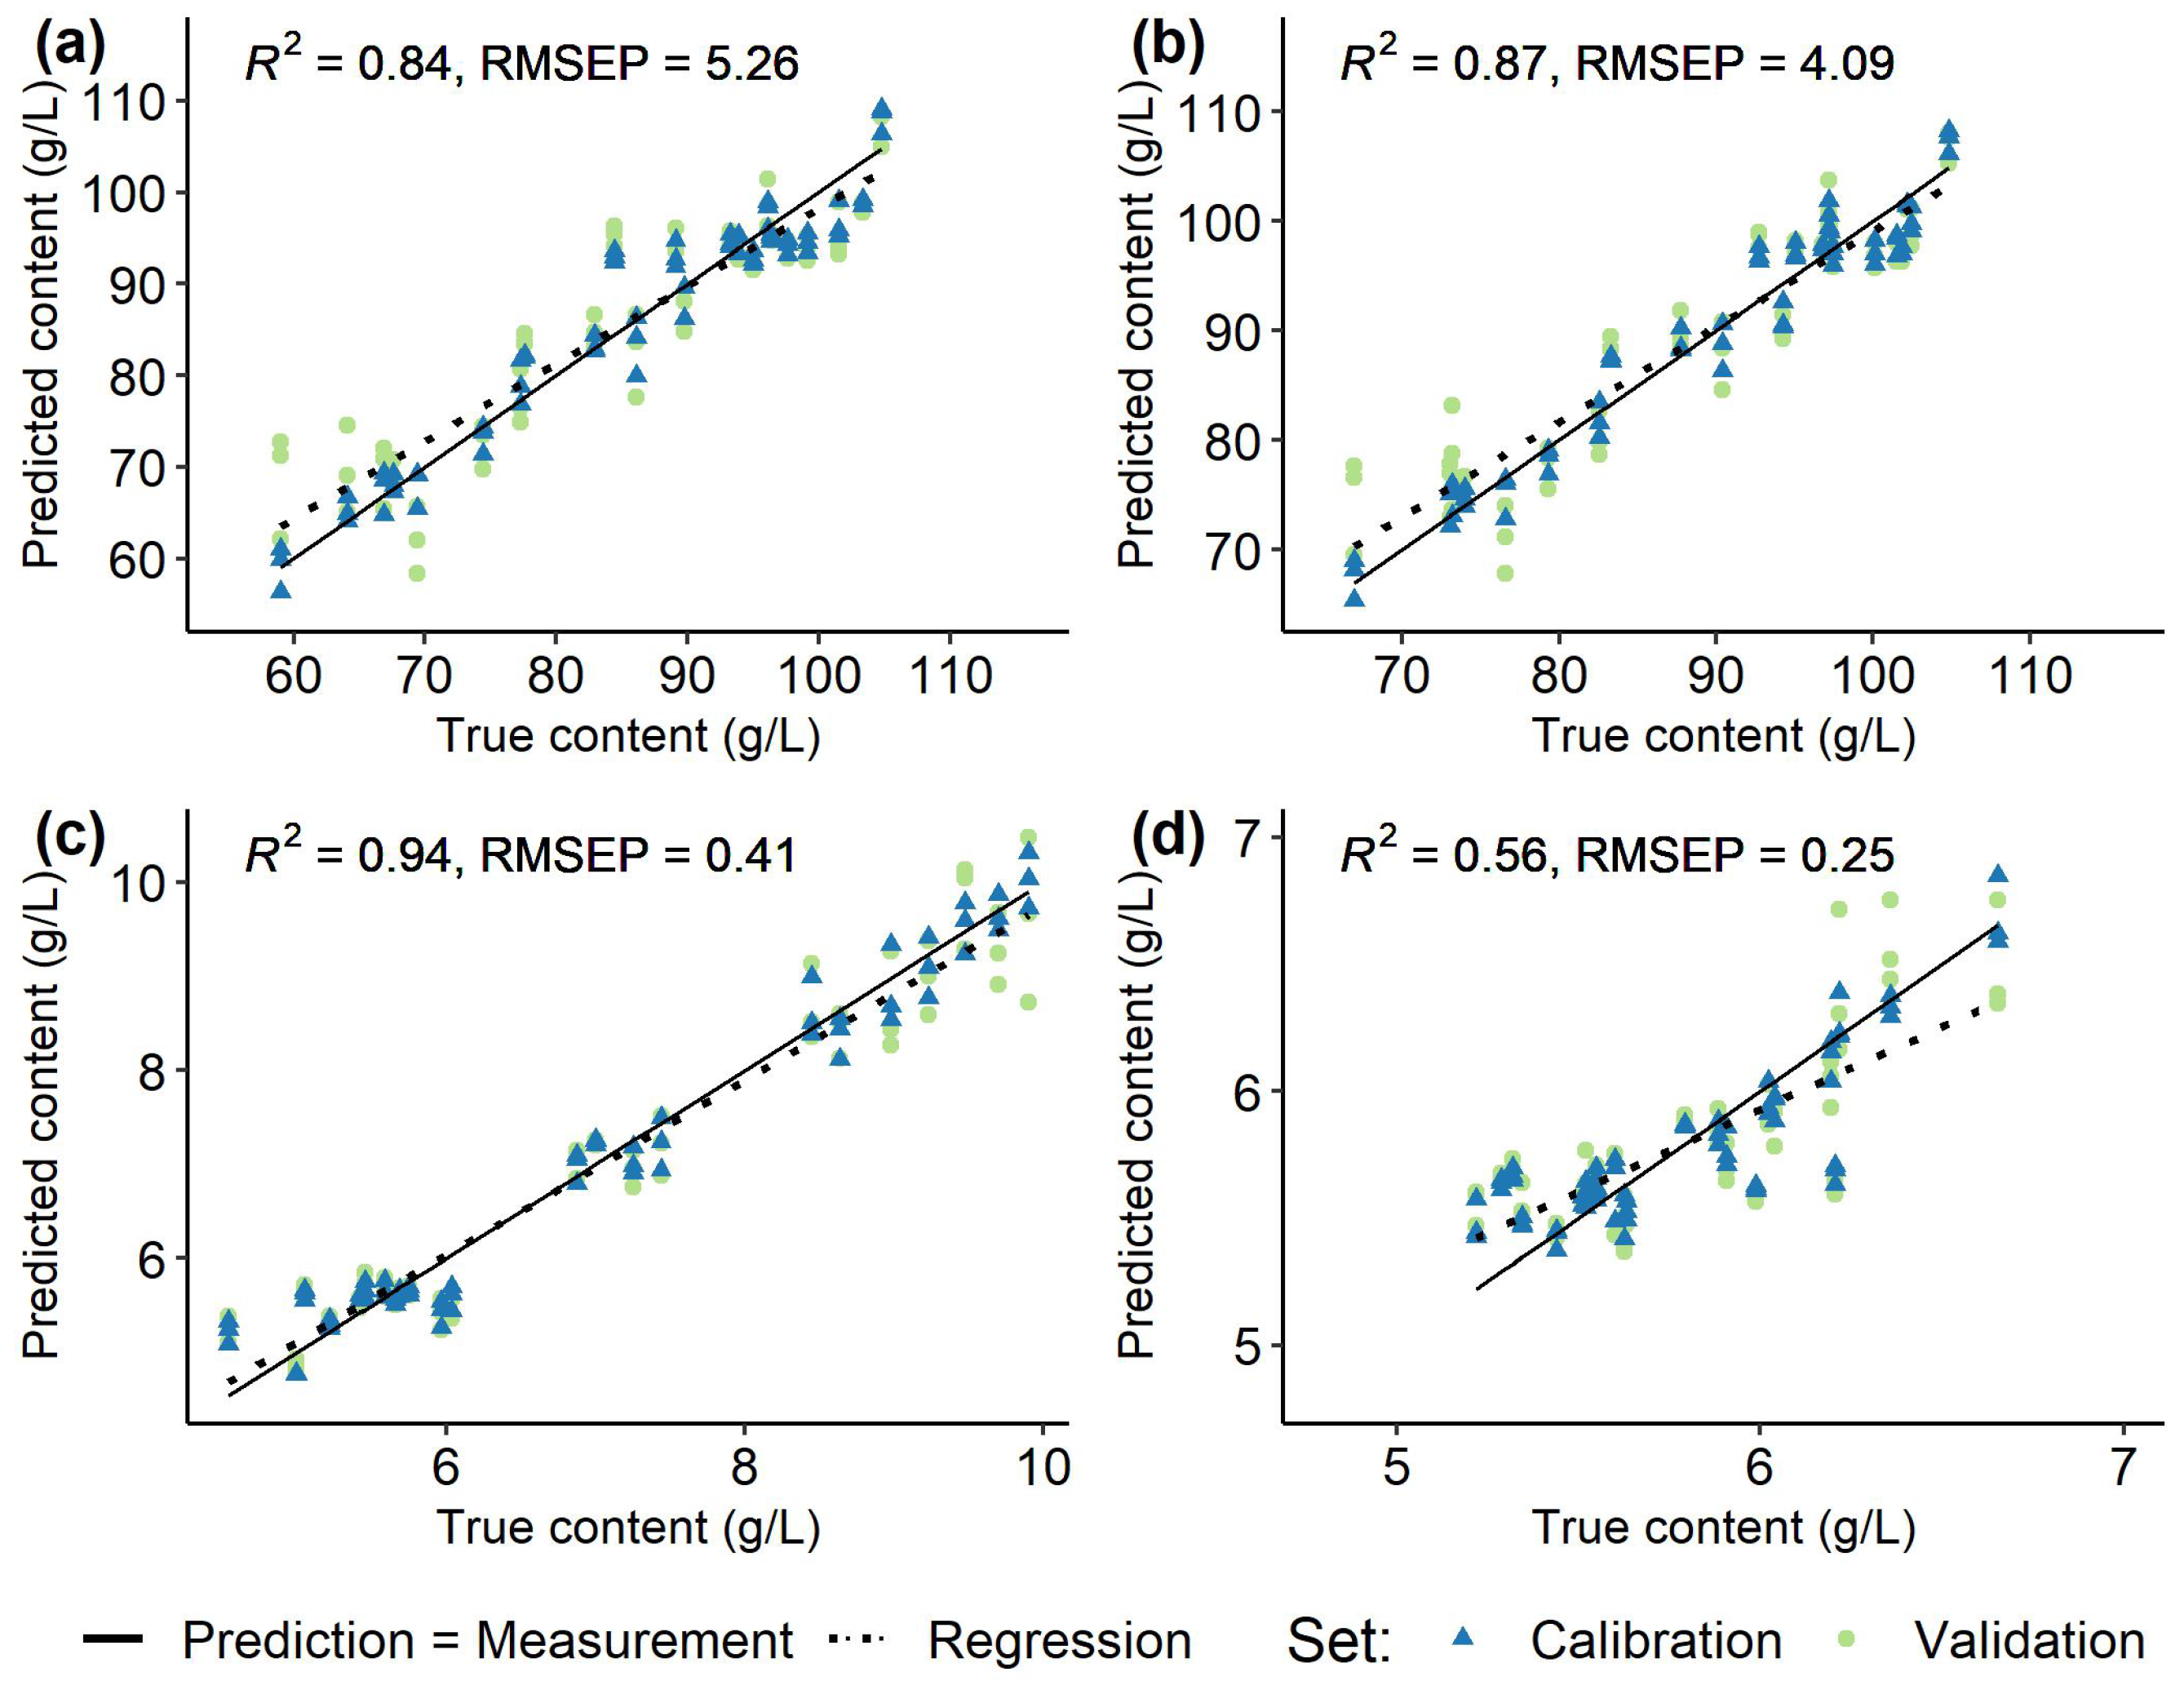
| ’Dornfelder’ | Fructose | 59.02 | – | 104.79 | 5.26 | 0.84 |
| (23/69) | Glucose | 66.93 | – | 104.82 | 4.09 | 0.87 |
| Malic acid | 4.54 | – | 9.90 | 0.41 | 0.94 | |
| Tartaric acid | 5.22 | – | 6.65 | 0.25 | 0.56 | |
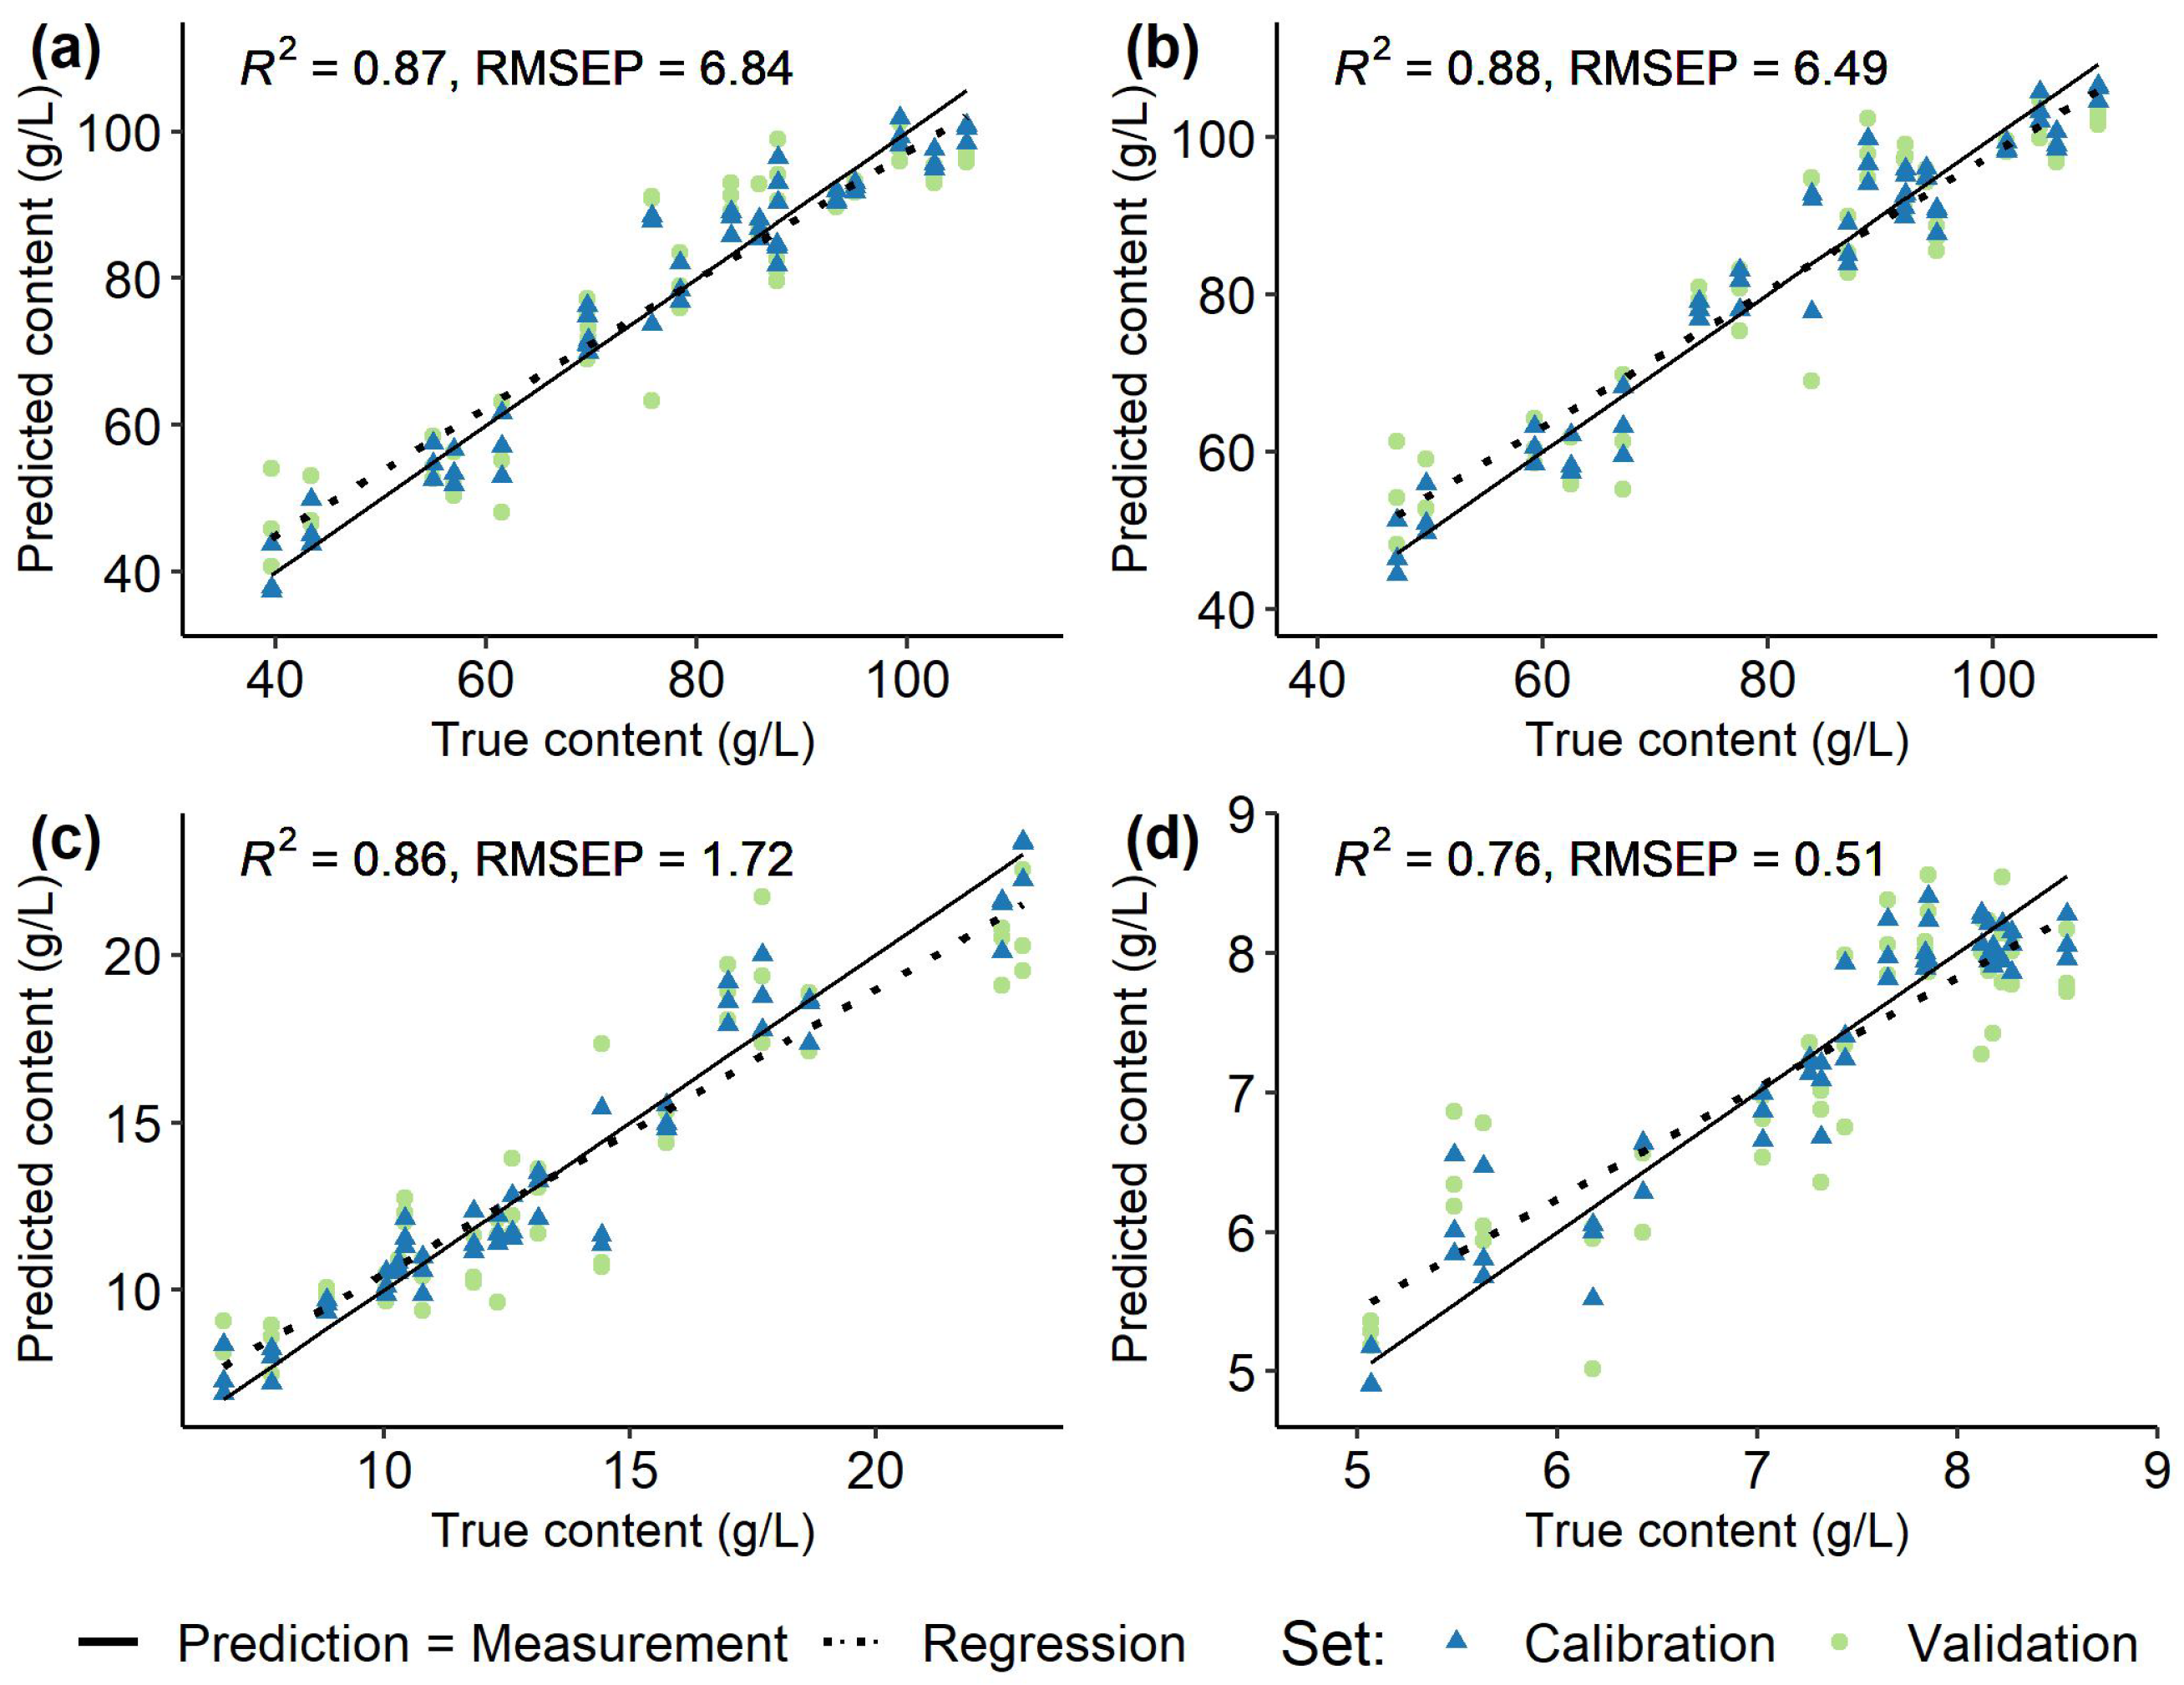
| ’Pinot Noir’ | Fructose | 39.59 | – | 105.64 | 6.84 | 0.87 |
| (18/54) | Glucose | 47.09 | – | 109.32 | 6.49 | 0.88 |
| Malic acid | 6.73 | – | 23.00 | 1.72 | 0.86 | |
| Tartaric acid | 5.06 | – | 8.55 | 0.51 | 0.76 | |
Disclaimer/Publisher’s Note: The statements, opinions and data contained in all publications are solely those of the individual author(s) and contributor(s) and not of MDPI and/or the editor(s). MDPI and/or the editor(s) disclaim responsibility for any injury to people or property resulting from any ideas, methods, instructions or products referred to in the content. |
© 2023 by the authors. Licensee MDPI, Basel, Switzerland. This article is an open access article distributed under the terms and conditions of the Creative Commons Attribution (CC BY) license (https://creativecommons.org/licenses/by/4.0/).
Share and Cite
Cornehl, L.; Krause, J.; Zheng, X.; Gauweiler, P.; Schwander, F.; Töpfer, R.; Gruna, R.; Kicherer, A. Determination of Sugars and Acids in Grape Must Using Miniaturized Near-Infrared Spectroscopy. Sensors 2023, 23, 5287. https://doi.org/10.3390/s23115287
Cornehl L, Krause J, Zheng X, Gauweiler P, Schwander F, Töpfer R, Gruna R, Kicherer A. Determination of Sugars and Acids in Grape Must Using Miniaturized Near-Infrared Spectroscopy. Sensors. 2023; 23(11):5287. https://doi.org/10.3390/s23115287
Chicago/Turabian StyleCornehl, Lucie, Julius Krause, Xiaorong Zheng, Pascal Gauweiler, Florian Schwander, Reinhard Töpfer, Robin Gruna, and Anna Kicherer. 2023. "Determination of Sugars and Acids in Grape Must Using Miniaturized Near-Infrared Spectroscopy" Sensors 23, no. 11: 5287. https://doi.org/10.3390/s23115287