

Fast Sleep Stage Classification Using Cascaded Support Vector Machines with Single-Channel EEG Signals
Abstract
:1. Introduction
2. Materials and Methods
2.1. Data Collection
2.2. Signal Preprocessing
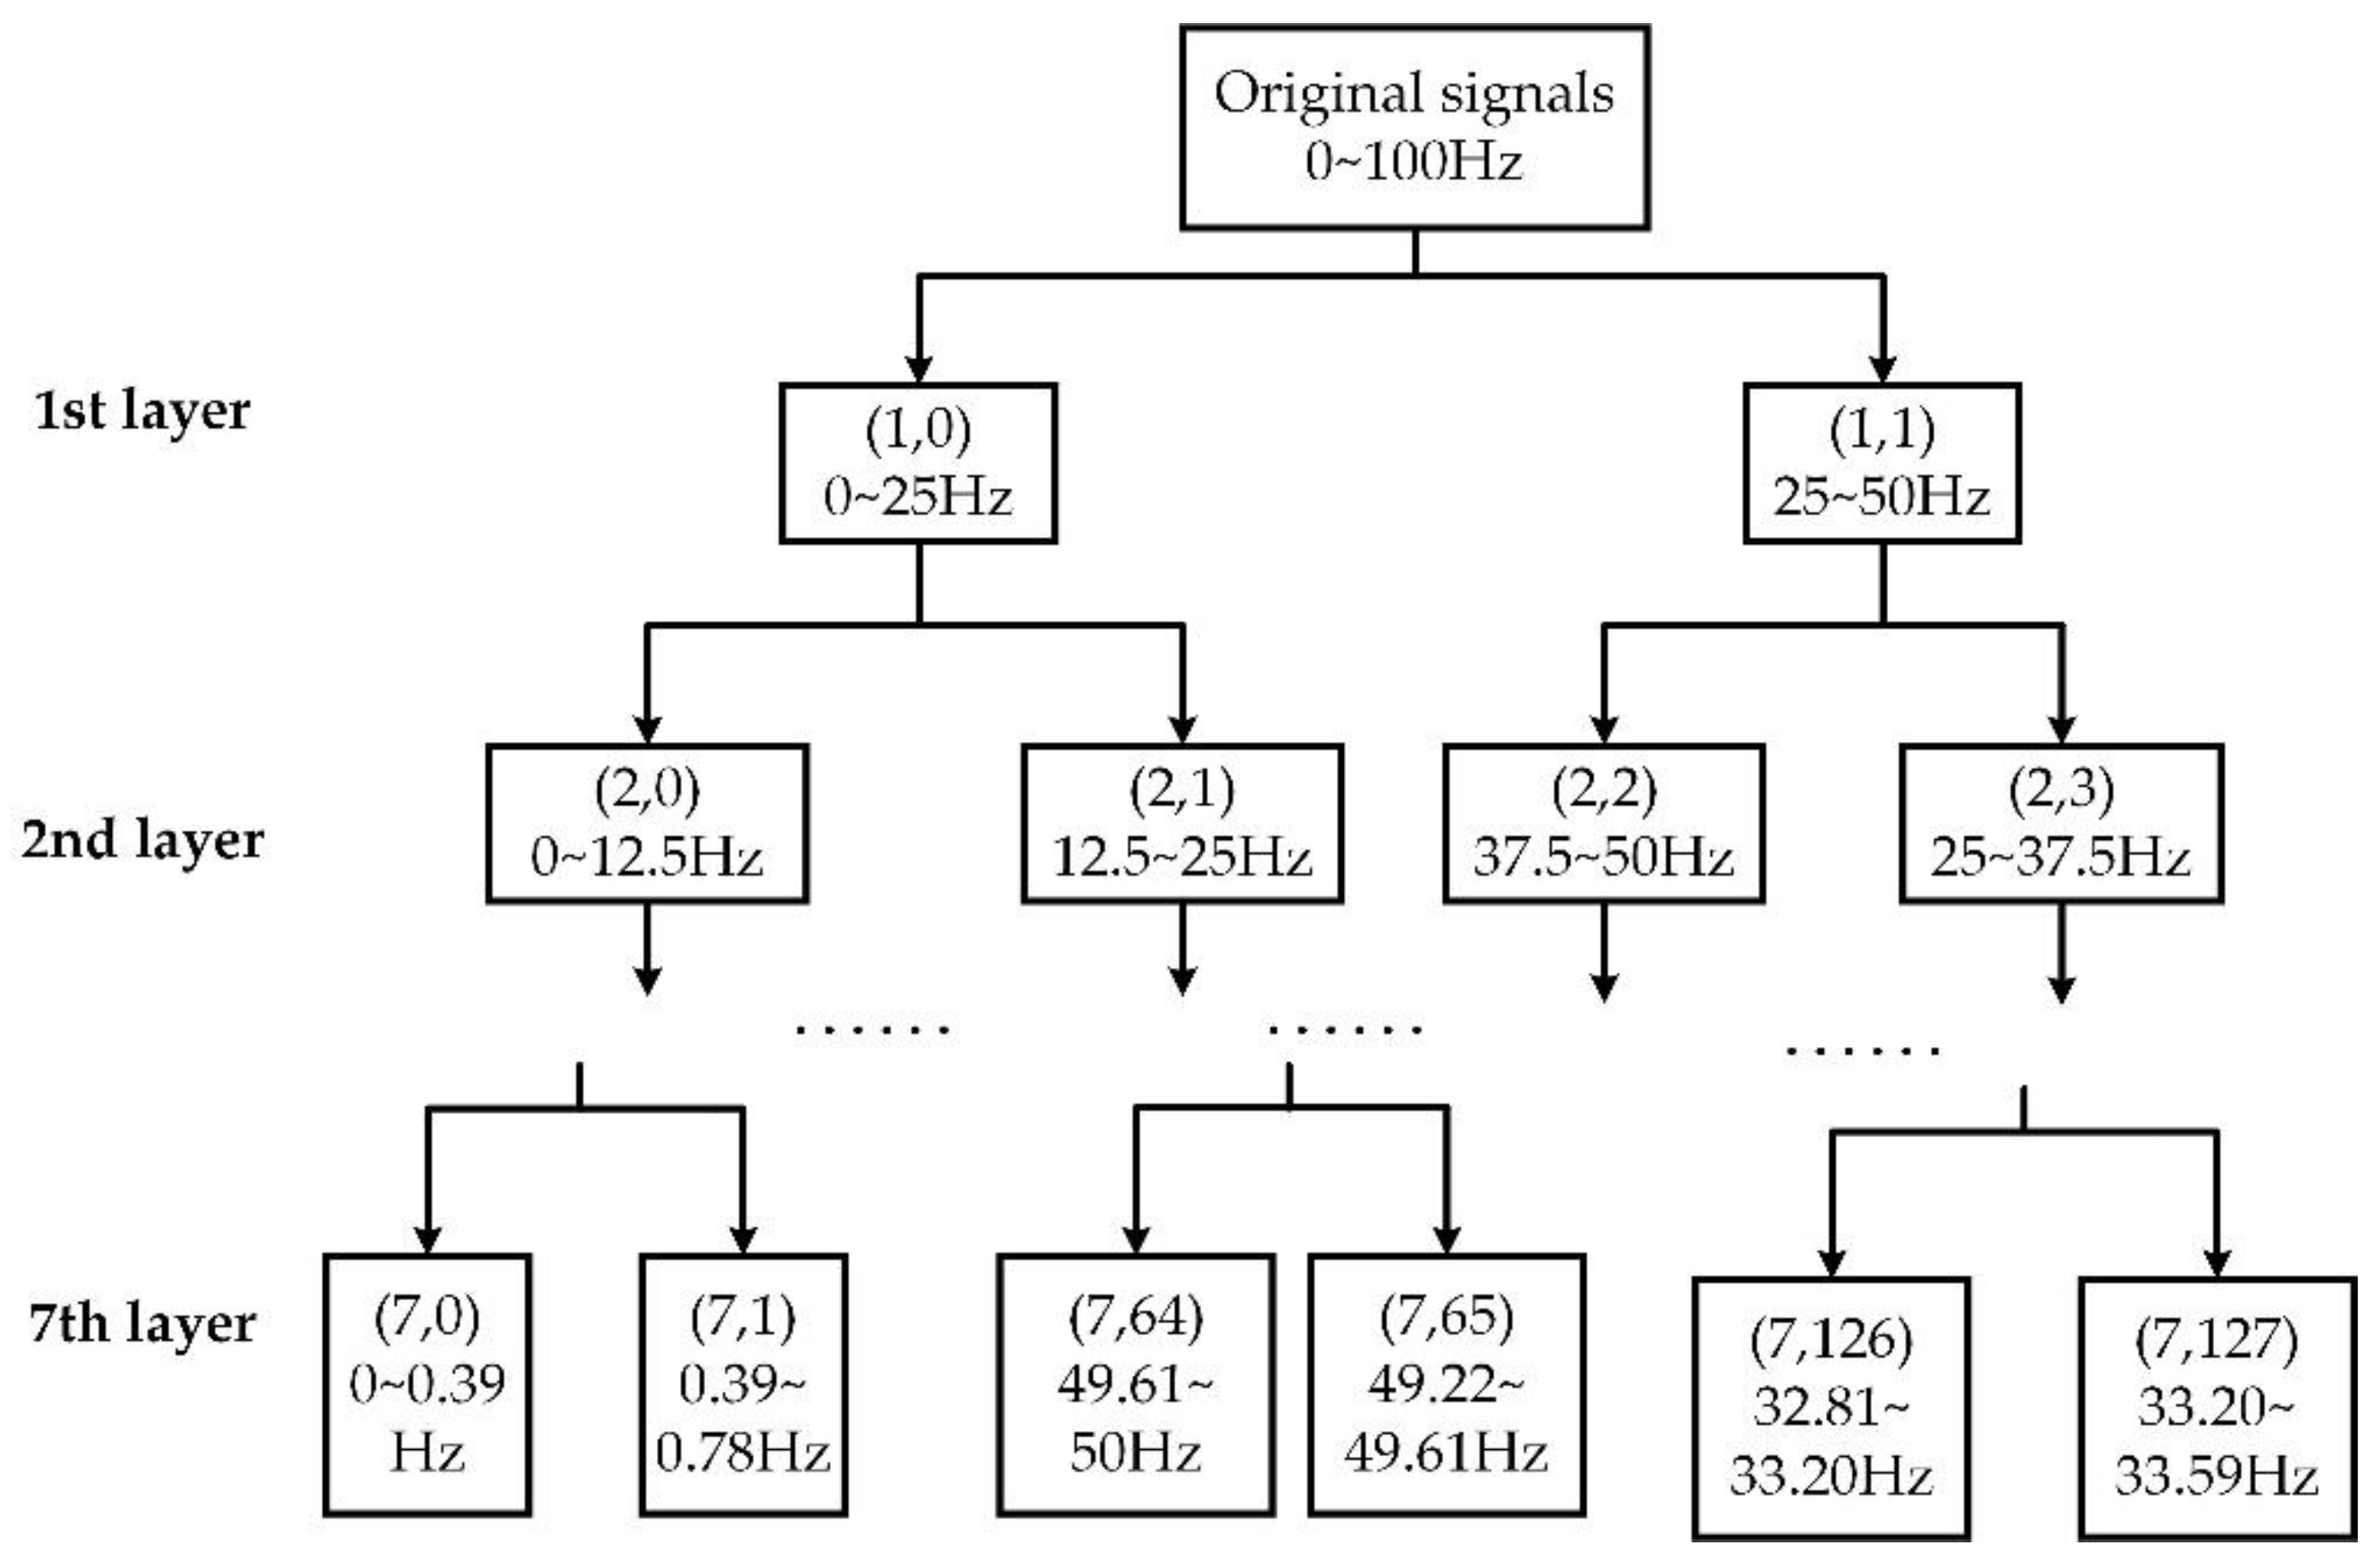
2.2.1. Wavelet Packet Transform
2.2.2. Feature Extraction
- (1)
- Time-domain features
- (2)
- Energy-domain features
- (3)
- Frequency-domain features
- (4)
- Nonlinear-dynamics-domain features
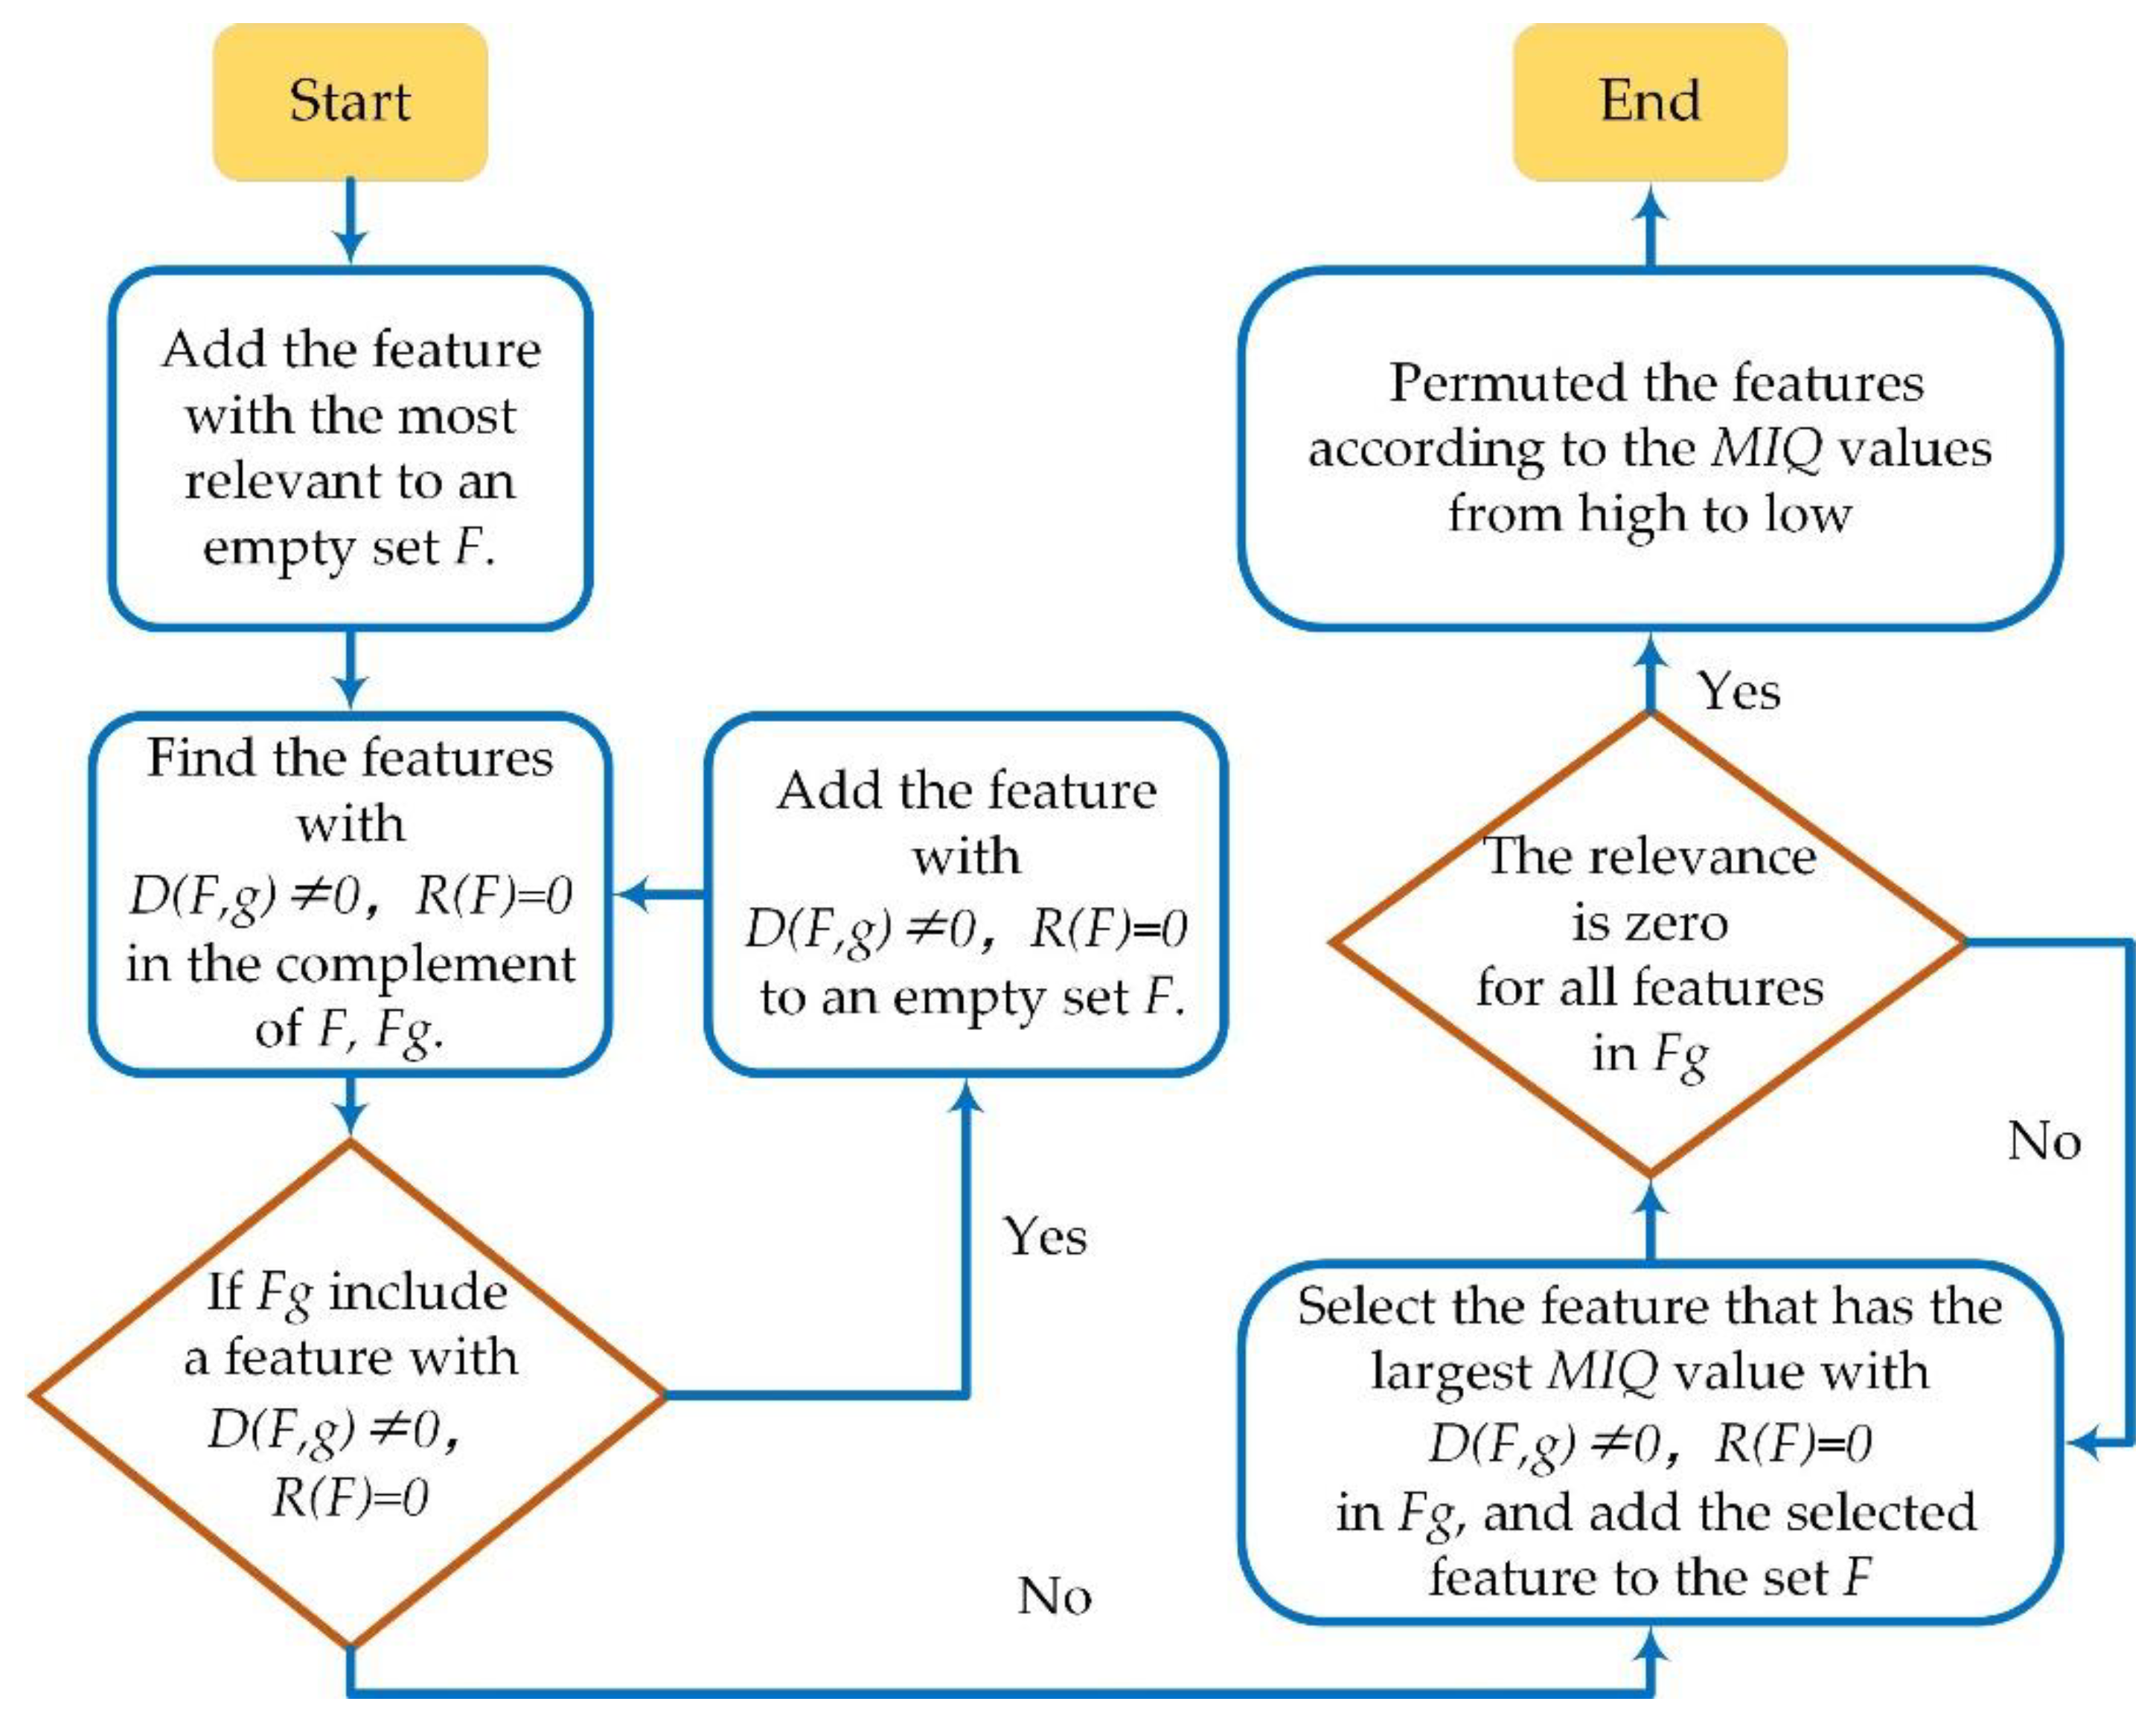
2.2.3. Feature Selection
2.3. Cascaded Support Vector Machine Classifier
2.3.1. Data Set for SVM I
2.3.2. Data Set for SVM II
2.3.3. Transform the Input Data
3. Results and Discussion
3.1. The Average Accuracy of Sleep Stage Classification
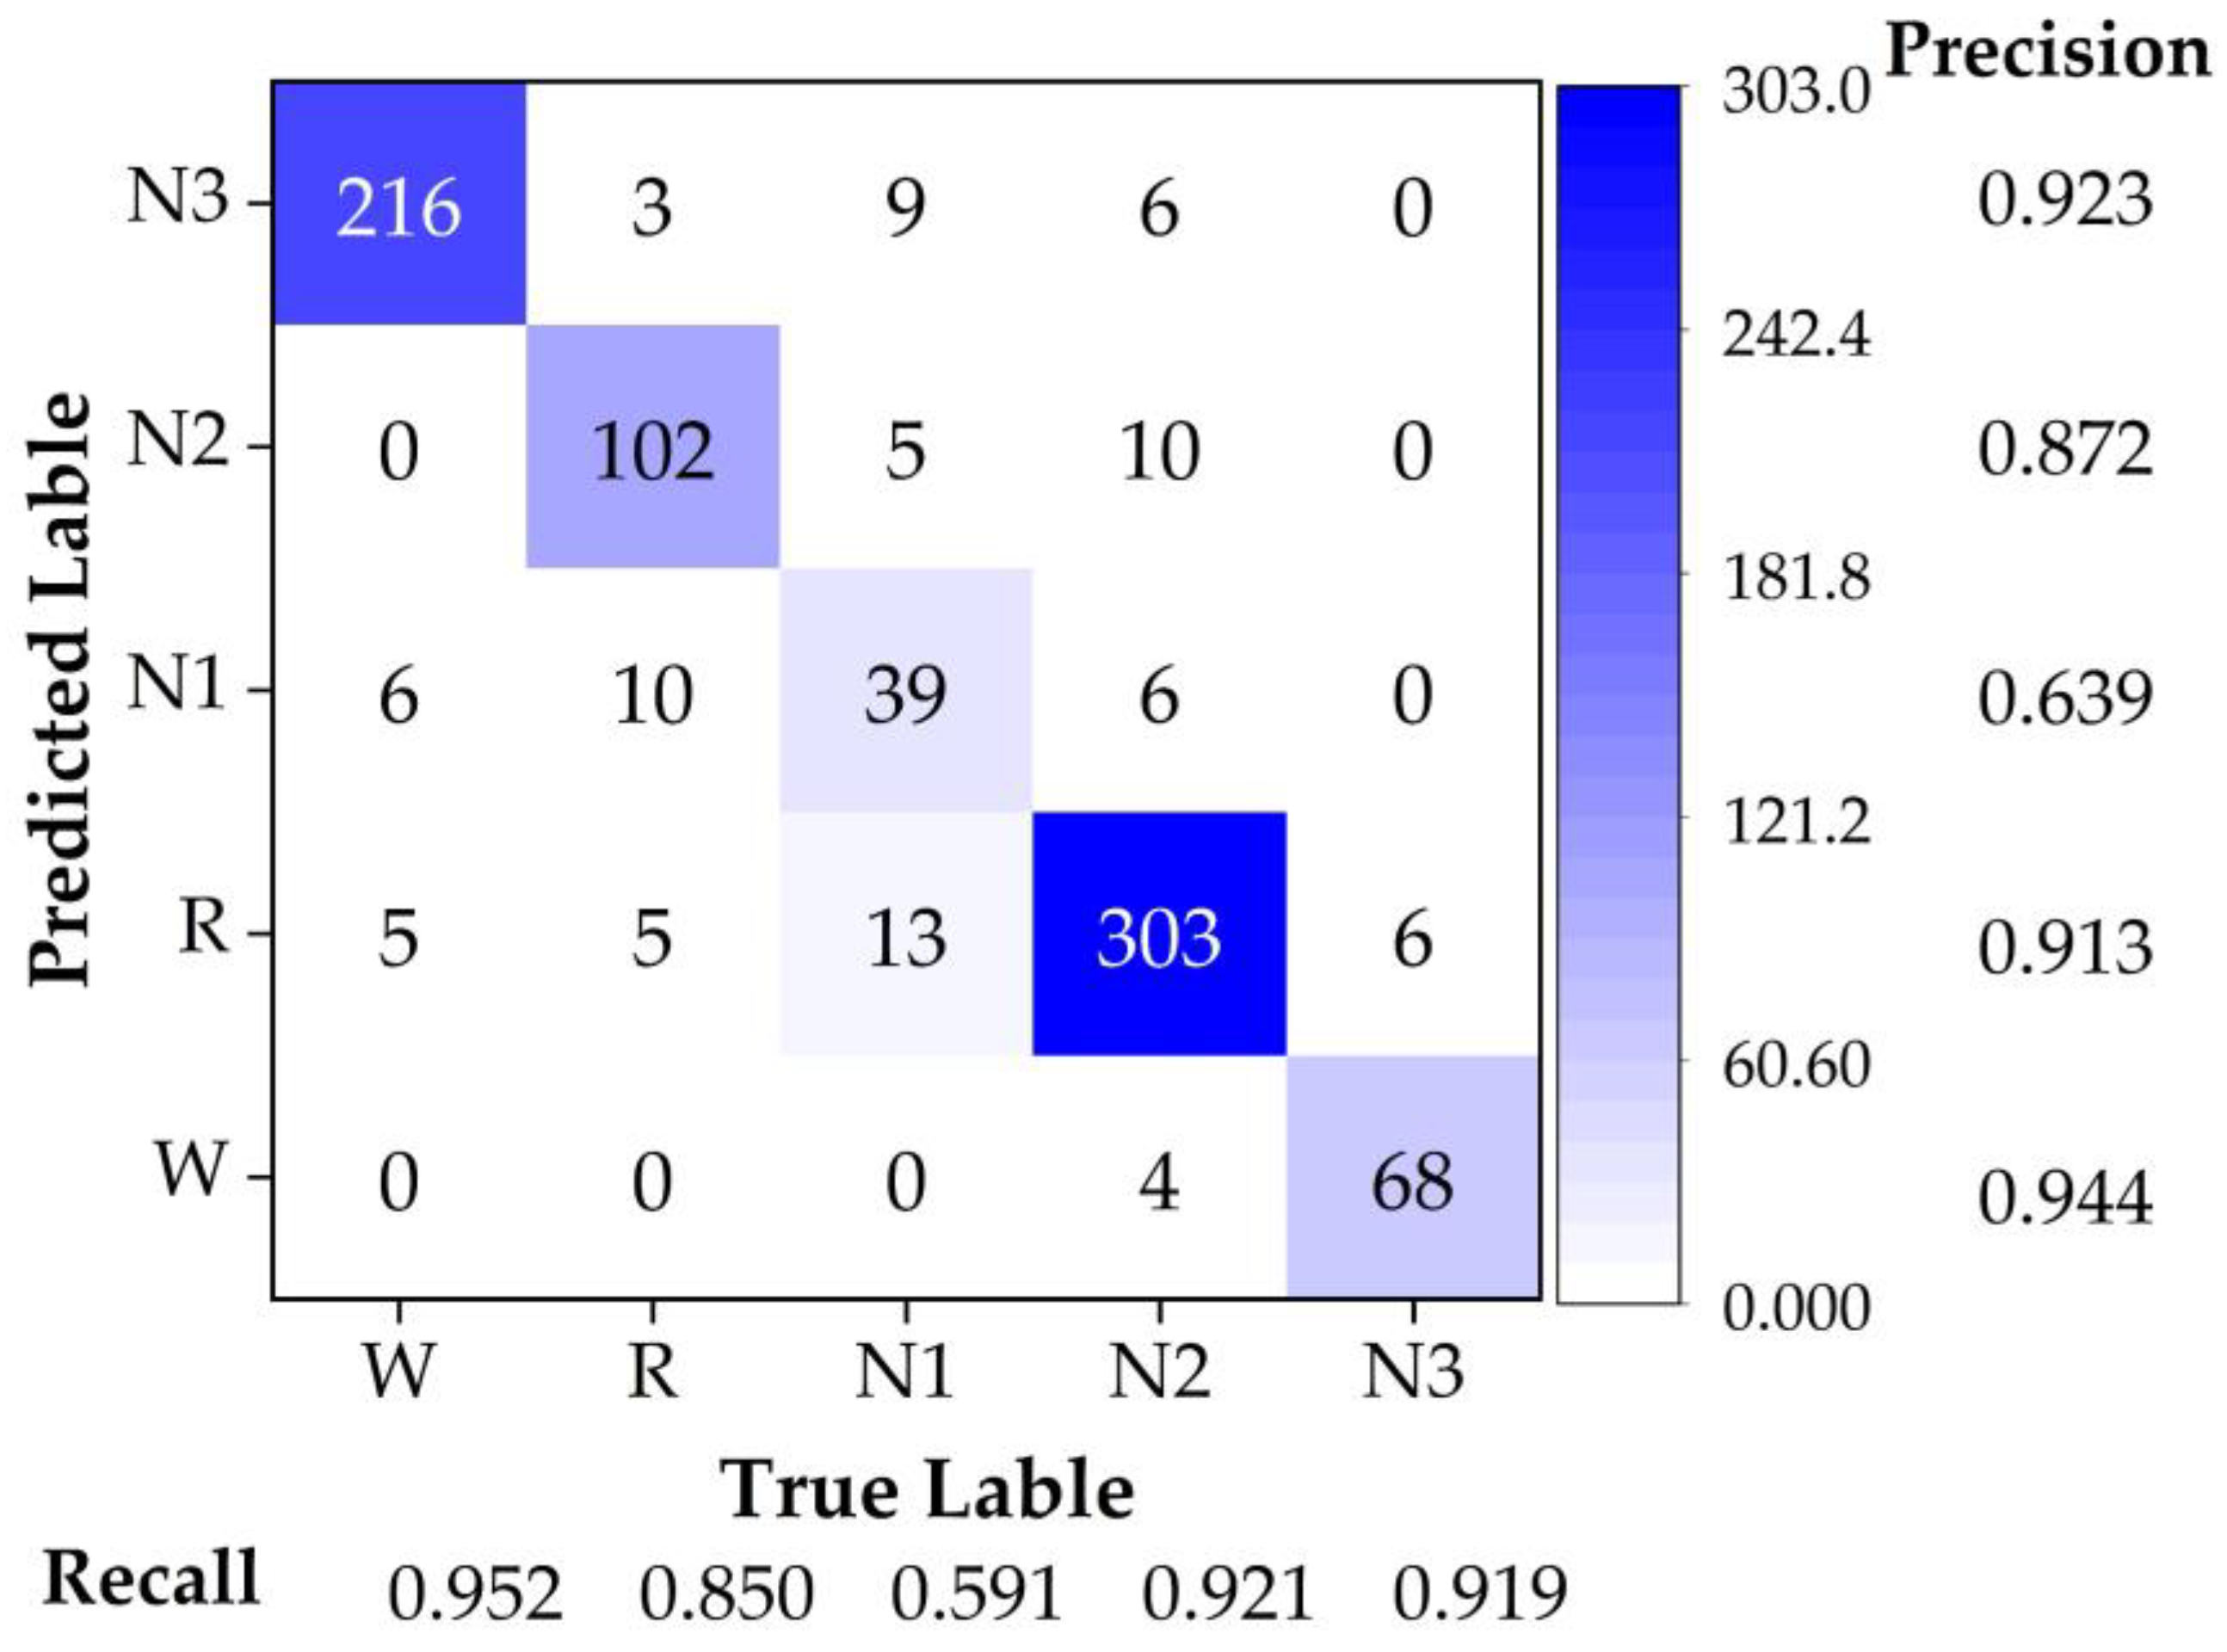
3.2. The Sleep Stage Classification Performance
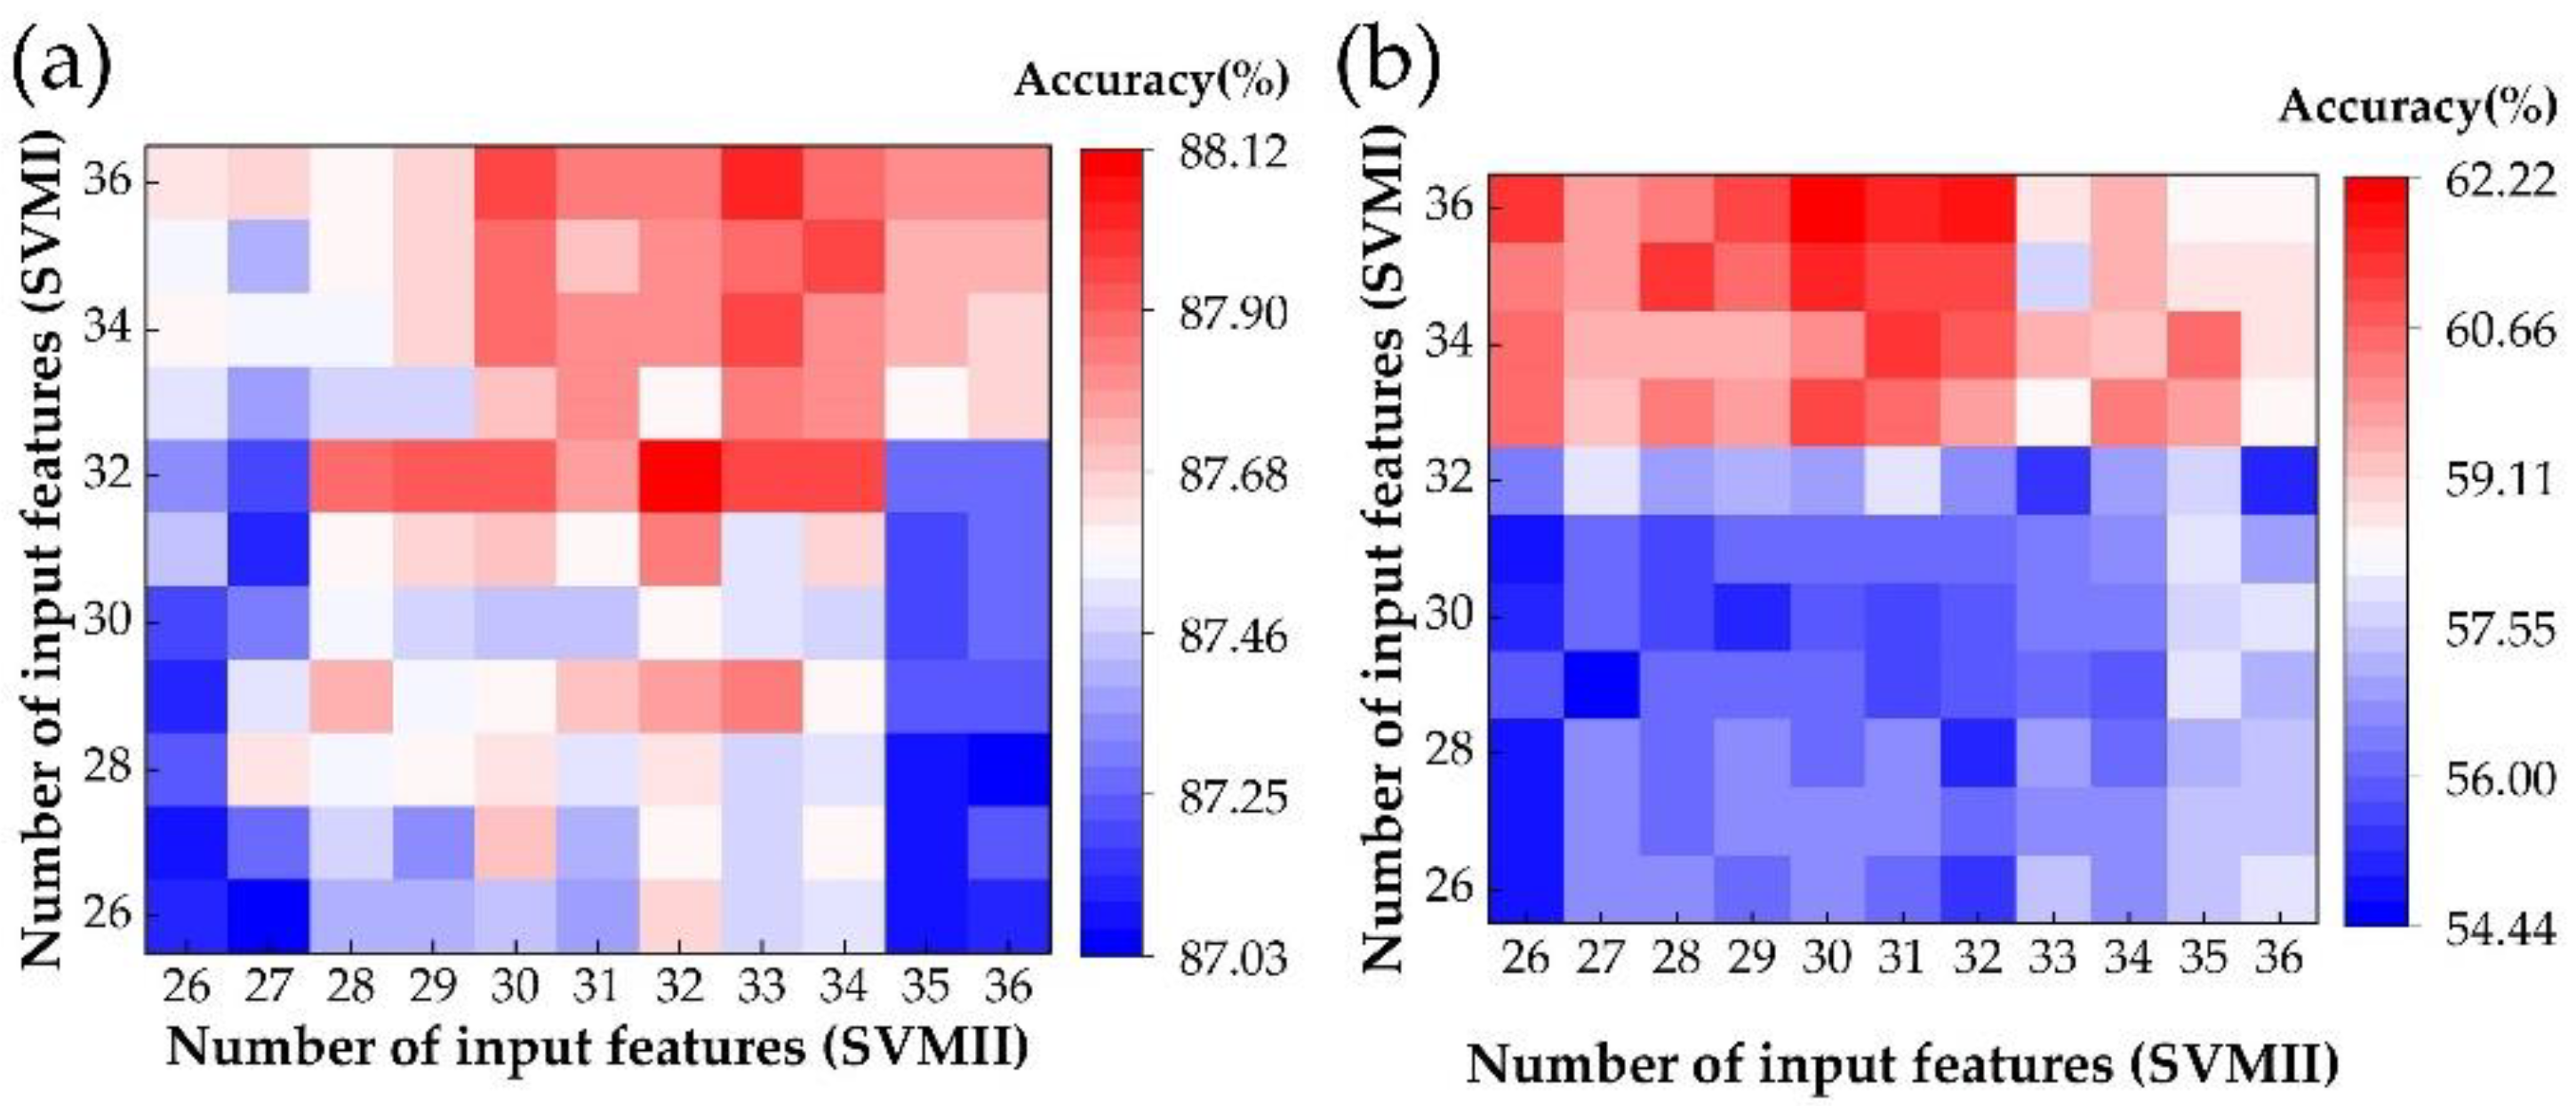
3.3. Influence by Number of Input Features on Classification Accuracy
3.4. Effectiveness Analysis of Different Nonlinear Dynamics Features
4. Conclusions
5. Patents
Author Contributions
Funding
Institutional Review Board Statement
Informed Consent Statement
Data Availability Statement
Acknowledgments
Conflicts of Interest
Appendix A
Appendix A.1. Effective Time-Domain Features of the EEG Signals

| Time-Domain Features | Functions |
|---|---|
| Mean | |
| Median | |
| Variance | |
| Skewness | |
| Kurtosis | |
| Hjorth mobility | |
| Peak-to-peak amplitude | |
| Hjorth complexity | |
| Average rectified value | |
| Root mean square |
Appendix A.2. Nonlinear-Dynamics-Domain Features of the EEG Signals
- (1)
- Spectral entropy (SE)
- (2)
- Sample entropy
- (3)
- Fuzzy entropy
Appendix A.3. The Feature System Considered in this Study
| Time-Domain Features | Energy-Domain Features | Frequency-Domain Features | Nonlinear-Dynamics-Domain Features |
|---|---|---|---|
| 7: Mean | 31: Mean frequency | 47: Renyi entropy | |
| 8: Median | 48: Sample entropy | ||
| 9: Variance | 49: Fuzzy entropy | ||
| 10: Skewness | 50: Multi-scale entropy | ||
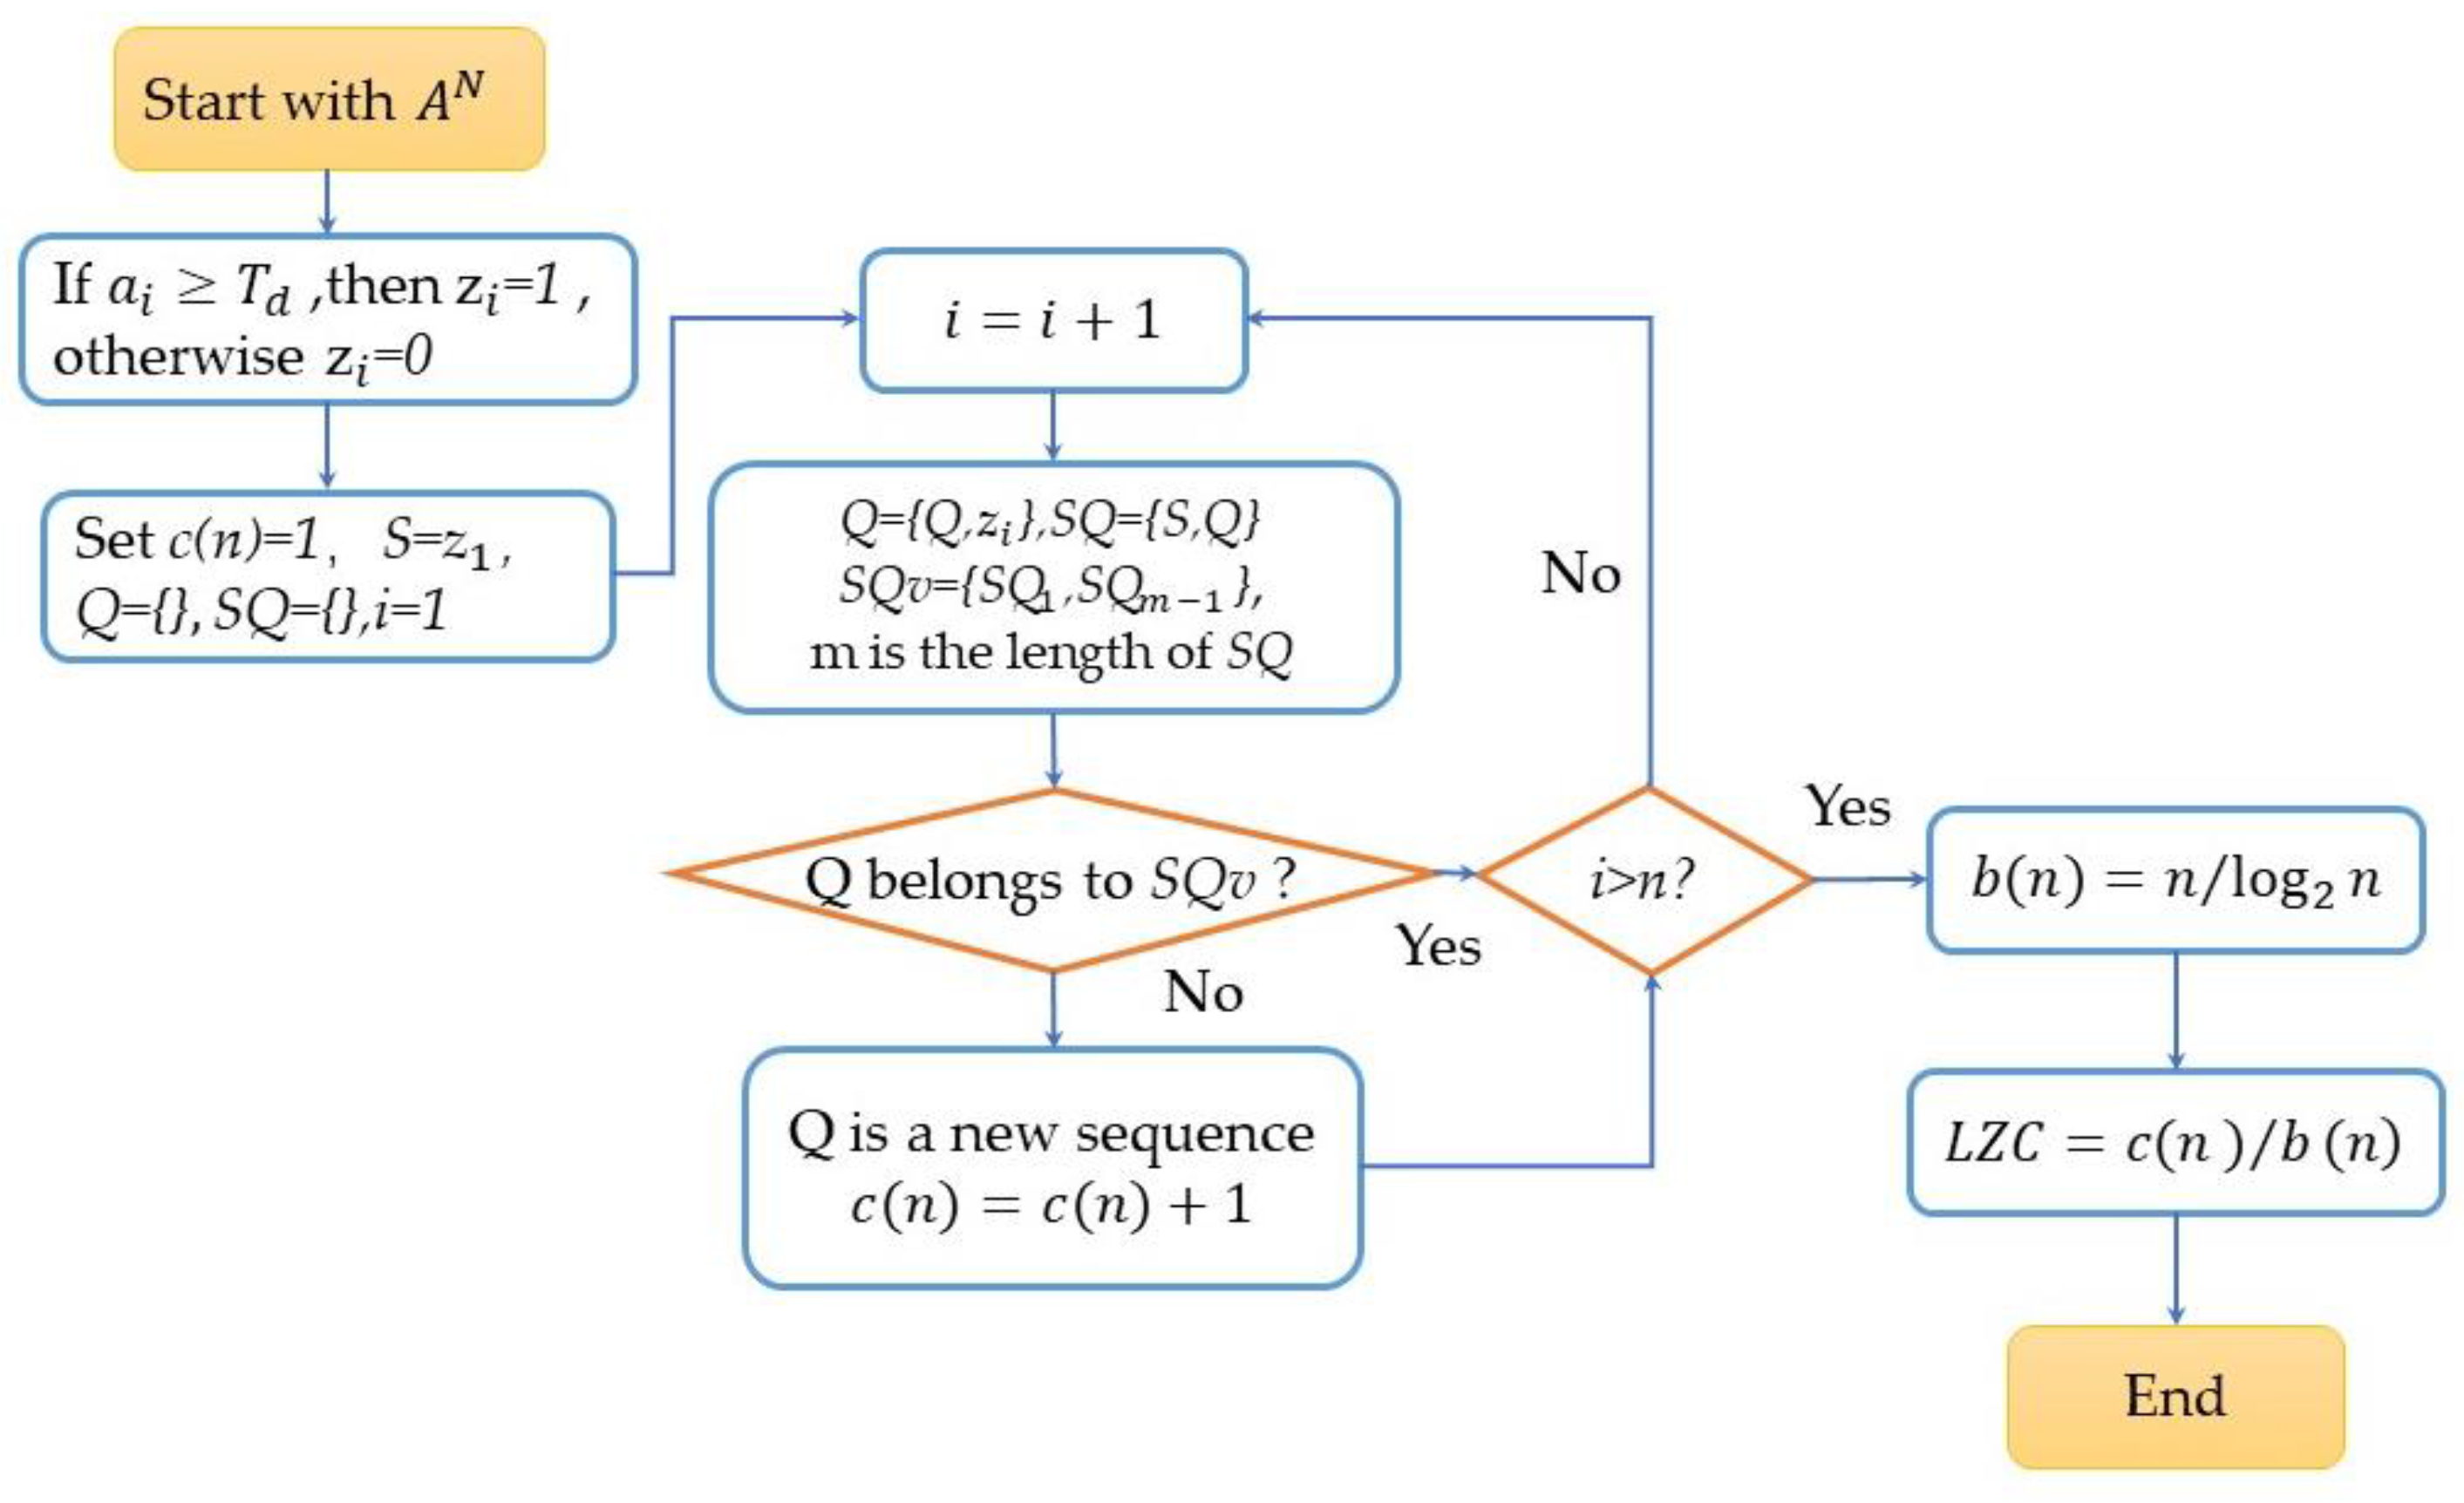
| 11: Kurtosis | 51:Lempel–Ziv complexity | ||
| 12: Hjorth mobility | |||
| 13:peak-to-peak amplitude | |||
| 14: Hjorth complexity | |||
| 15: Average rectified value | |||
| 16: Root mean square (RMS) |
Appendix A.4. The Permuted Rank of Different Features for SVM Classifiers
| Classifier | Ranks of Features’ Number |
|---|---|
| Support Vector Machine I | 46→49→11→40→10→24→32→50→20→7 12→33→35→47→8→29→13→51→42→15 25→31→43→26→3→48→14→44→9→37 36→41→23 →34→16→27→4→2→38→17 19→28→5→18→1→21→39→45→6→22→30 |
| Support Vector Machine II | 20→7→24→2→32→33→17→11→19→39 43→13→49→21→45→50→14→37→40→30 15→31→35→44→4→36→18→25→9→23 28→48→41→34→42→6→38→12→3→26 1→46→5→16→22→27→51→29→47→8→10 |
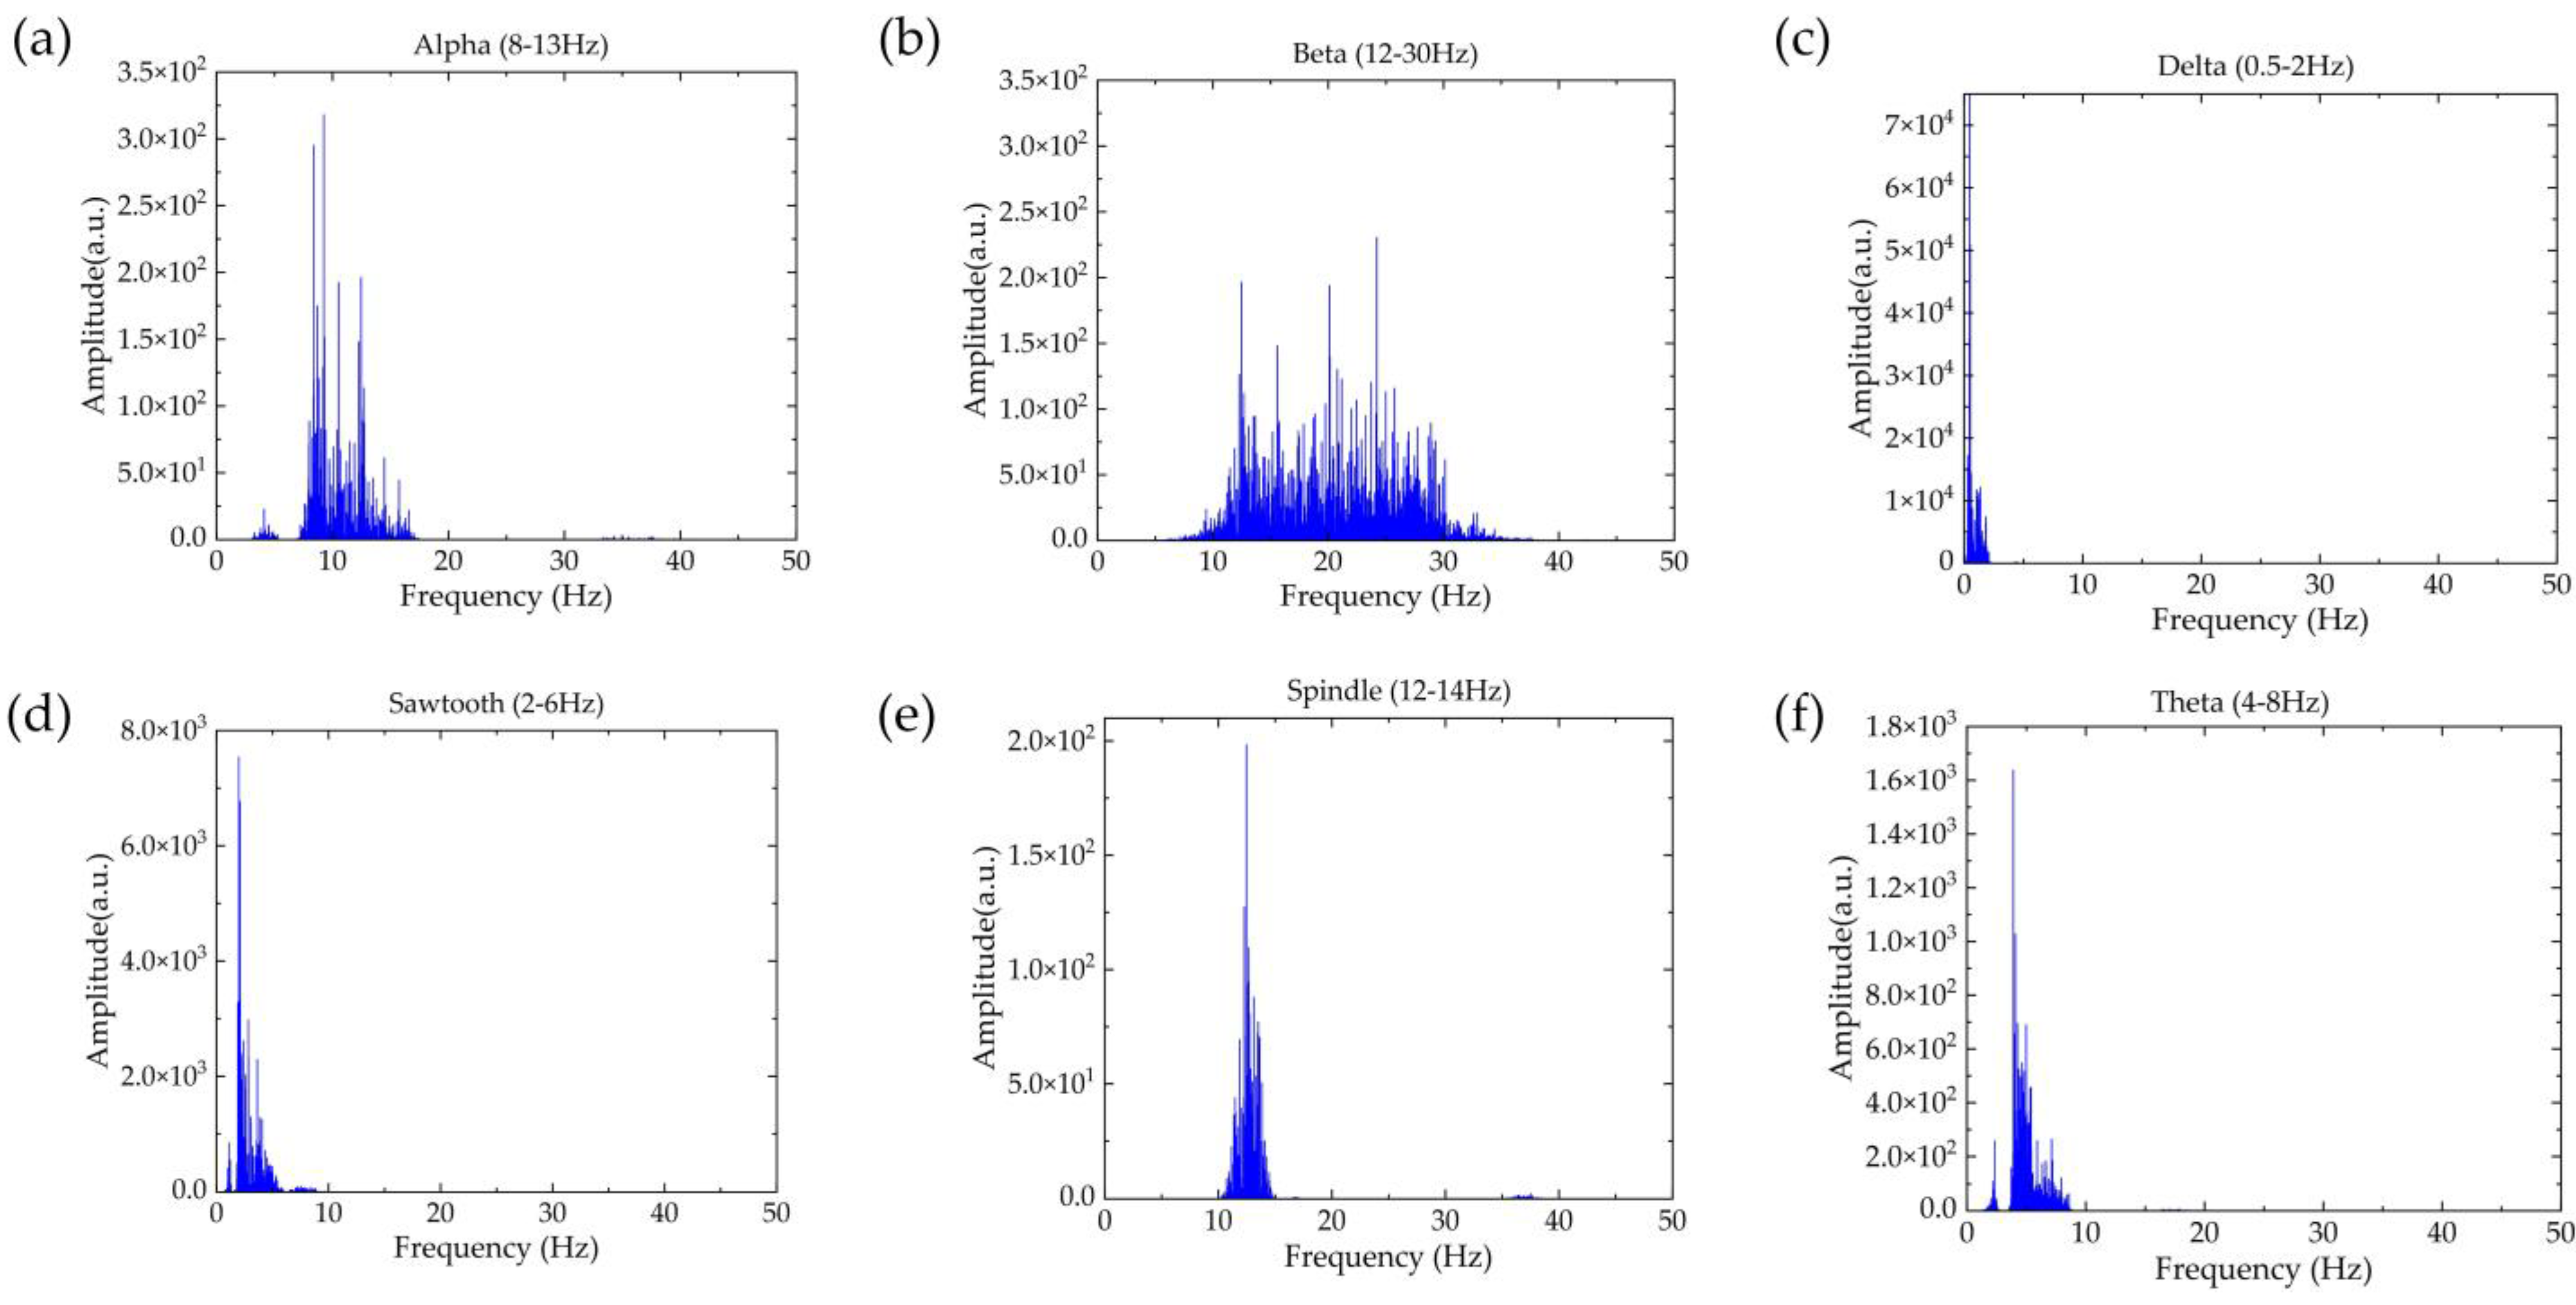
Appendix A.5. The Frequency Spectra That Were Used for Computing the Frequency-Domain Features
References
- Labeix, P.; Berger, M.; Zellag, A.; Garcin, A.; Barthelemy, J.C.; Roche, F.; Hupin, D. Resistance training of inspiratory muscles after coronary artery disease may improve obstructive sleep apnea in outpatient cardiac rehabilitation: RICAOS study. Front. Physiol. 2022, 13, 846532. [Google Scholar] [CrossRef] [PubMed]
- Vrajova, M.; Slamberova, R.; Hoschl, C.; Ovsepian, S.V. Methamphetamine and sleep impairments: Neurobehavioral correlates and molecular mechanisms. Sleep 2021, 44, zsab001. [Google Scholar] [CrossRef] [PubMed]
- Yan, C.; Li, P.; Yang, M.; Li, Y.; Li, J.; Zhang, H.; Liu, C. Entropy Analysis of Heart Rate Variability in Different Sleep Stages. Entropy 2022, 24, 379. [Google Scholar] [CrossRef] [PubMed]
- Mitchell, H.A.; Weinshenker, D. Good night and good luck: Norepinephrine in sleep pharmacology. Biochem. Pharmacol. 2010, 79, 801–809. [Google Scholar] [CrossRef] [Green Version]
- Sharma, M.; Tiwari, J.; Patel, V.; Acharya, U.R. Automated identification of sleep disorder types using triplet half-band filter and ensemble machine learning techniques with EEG signals. Electronics 2021, 10, 1531. [Google Scholar] [CrossRef]
- Tripathy, R.K.; Gajbhiye, P.; Acharya, U.R. Automated sleep apnea detection from cardio-pulmonary signal using bivariate fast and adaptive EMD coupled with cross time-frequency analysis. Comput. Biol. Med. 2020, 120, 103769. [Google Scholar] [CrossRef] [PubMed]
- Hori, T.; Sugita, Y.; Koga, E.; Shirakawa, S.; Inoue, K.; Uchida, S.; Kuwahara, H.; Kousaka, M.; Kobayashi, T.; Tsuji, Y.; et al. Proposed supplements and amendments to ‘A Manual of Standardized Terminology, Techniques and Scoring System for Sleep Stages of Human Subjects’, the Rechtschaffen & Kales (1968) standard. Psychiat. Clin. Neuros. 2001, 55, 305–310. [Google Scholar]
- Berry, R.B.; Budhiraja, R.; Gottlieb, D.J.; Gozal, D.; Iber, C.; Kapur, V.K.; Marcus, C.L.; Mehra, R.; Parthasarathy, S.; Quan, S.F.; et al. Rules for scoring respiratory events in sleep: Update of the 2007 AASM Manual for the Scoring of Sleep and Associated Events. Deliberations of the Sleep Apnea Definitions Task Force of the American Academy of Sleep Medicine. J. Clin. Sleep. Med. 2012, 8, 597–619. [Google Scholar] [CrossRef] [Green Version]
- Schulz, H. Phasic or transient? Comment on the terminology of the AASM manual for the scoring of sleep and associated events. J. Clin. Sleep. Med. 2007, 3, 752. [Google Scholar] [CrossRef] [Green Version]
- Arora, N.; Meskill, G.; Guilleminault, C. The role of flow limitation as an important diagnostic tool and clinical finding in mild sleep-disordered breathing. Sleep Sci. 2015, 8, 134–142. [Google Scholar] [CrossRef] [Green Version]
- Khalighi, S.; Sousa, T.; Pires, G.; Nunes, U. Automatic sleep staging: A computer assisted approach for optimal combination of features and polysomnographic channels. Expert Syst. Appl. 2013, 40, 7046–7059. [Google Scholar] [CrossRef]
- Zhang, X.; Kou, W.; Chang, E.I.-C.; Gao, H.; Fan, Y.; Xu, Y. Sleep stage classification based on multi-level feature learning and recurrent neural networks via wearable device. Comput. Biol. Med. 2018, 103, 71–81. [Google Scholar] [CrossRef] [PubMed] [Green Version]
- Nguyen, A.; Alqurashi, R.; Raghebi, Z.; Banaei-Kashani, F.; Halbower, A.C.; Vu, T. LIBS: A Lightweight and Inexpensive In-Ear Sensing System for Automatic Whole-Night Sleep Stage Monitoring. GetMobile Mob. Comp. Comm. 2017, 21, 31–34. [Google Scholar] [CrossRef]
- Tripathy, R.K.; Ghosh, S.K.; Gajbhiye, P.; Acharya, U.R. Development of automated sleep stage classification system using multivariate projection-based fixed boundary empirical wavelet transform and entropy features extracted from multichannel EEG signals. Entropy 2020, 22, 1141. [Google Scholar] [CrossRef]
- Ebrahimi, F.; Setarehdan, S.-K.; Nazeran, H. Automatic sleep staging by simultaneous analysis of ECG and respiratory signals in long epochs. Biomed. Signal Process. Control 2015, 18, 69–79. [Google Scholar] [CrossRef]
- Gomez-Pilar, J.; Gutierrez-Tobal, G.C.; Poza, J.; Fogel, S.; Doyon, J.; Northoff, G.; Hornero, R. Spectral and temporal characterization of sleep spindles-methodological implications. J. Neural Eng. 2021, 18, 036014. [Google Scholar] [CrossRef]
- Gupta, V.; Pachori, R.B. FBDM based time-frequency representation for sleep stages classification using EEG signals. Biomed. Signal Process. 2021, 64, 102265. [Google Scholar] [CrossRef]
- Peker, M. An efficient sleep scoring system based on EEG signal using complex-valued machine learning algorithms. Neurocomputing 2016, 207, 165–177. [Google Scholar] [CrossRef]
- Diykh, M.; Li, Y.; Wen, P. EEG Sleep Stages Classification Based on Time Domain Features and Structural Graph Similarity. IEEE Trans. Neural Syst. Rehabil. Eng. A Publ. IEEE Eng. Med. Biol. Soc. 2016, 24, 1159–1168. [Google Scholar] [CrossRef]
- Čić, M.; Šoda, J.; Bonković, M. Automatic classification of infant sleep based on instantaneous frequencies in a single-channel EEG signal. Comput. Biol. Med. 2013, 43, 2110–2117. [Google Scholar] [CrossRef]
- Memar, P.; Faradji, F. A Novel Multi-Class EEG-Based Sleep Stage Classification System. IEEE Trans. Neural Syst. Rehabil. Eng. A Publ. IEEE Eng. Med. Biol. Soc. 2018, 26, 84–95. [Google Scholar] [CrossRef] [PubMed]
- Dimitriadis, S.I.; Salis, C.; Linden, D. A novel, fast and efficient single-sensor automatic sleep-stage classification based on complementary cross-frequency coupling estimates. Clin. Neurophysiol. Off. J. Int. Fed. Clin. Neurophysiol. 2018, 129, 815–828. [Google Scholar] [CrossRef] [PubMed]
- Graves, A.; Schmidhuber, J. Framewise phoneme classification with bidirectional LSTM and other neural network architectures. Neural Netw. 2005, 18, 602–610. [Google Scholar] [CrossRef] [PubMed]
- Zhang, J.M.; Wu, Y. Automatic sleep stage classification of single-channel EEG by using complex-valued convolutional neural network. Biomed. Eng.-Biomed. Tech. 2018, 63, 177–190. [Google Scholar] [CrossRef]
- Gers, F.A.; Schmidhuber, J.; Cummins, F. Learning to forget: Continual prediction with LSTM. Neural Comput. 2000, 12, 2451–2471. [Google Scholar] [CrossRef]
- Sors, A.; Bonnet, S.; Mirek, S.; Vercueil, L.; Payen, J.-F. A convolutional neural network for sleep stage scoring from raw single-channel EEG. Biomed. Signal Proces 2018, 42, 107–114. [Google Scholar] [CrossRef]
- Hsu, Y.L.; Yang, Y.T.; Wang, J.S.; Hsu, C.Y. Automatic sleep stage recurrent neural classifier using energy features of EEG signals. Neurocomputing 2013, 104, 105–114. [Google Scholar] [CrossRef]
- Goldberger, A.L.; Amaral, L.A.; Glass, L.; Hausdorff, J.M.; Ivanov, P.C.; Mark, R.G.; Mietus, J.E.; Moody, G.B.; Peng, C.K.; Stanley, H.E. PhysioBank, PhysioToolkit, and PhysioNet: Components of a new research resource for complex physiologic signals. Circulation 2000, 101, E215–E220. [Google Scholar] [CrossRef] [Green Version]
- Kemp, B.; Zwinderman, A.H.; Tuk, B.; Kamphuisen, H.A.; Oberyé, J.J. Analysis of a sleep-dependent neuronal feedback loop: The slow-wave microcontinuity of the EEG. IEEE Trans. Bio-Med. Eng. 2000, 47, 1185–1194. [Google Scholar] [CrossRef]
- Mousavi, S.; Afghah, F.; Acharya, U.R. SleepEEGNet: Automated sleep stage scoring with sequence to sequence deep learning approach. PLoS ONE 2019, 14, e0216456. [Google Scholar] [CrossRef] [Green Version]
- van Sweden, B.; Kemp, B.; Kamphuisen, H.A.; van der Velde, E.A. Alternative electrode placement in (automatic) sleep scoring (Fpz-Cz/Pz-Oz versus C4-A1). Sleep 1990, 13, 279–283. [Google Scholar] [CrossRef] [PubMed]
- Park, H.J.; Oh, J.S.; Jeong, D.U.; Park, K.S. Automated sleep stage scoring using hybrid rule- and case-based reasoning. Comput. Biomed. Res. Int. J. 2000, 33, 330–349. [Google Scholar] [CrossRef]
- Percival, D.B.; Walden, A.T. Wavelet Methods for Time Series Analysis; Cambridge University Press: Cambridge, UK, 2000. [Google Scholar]
- da Silveira, T.L.T.; Kozakevicius, A.J.; Rodrigues, C.R. Automated drowsiness detection through wavelet packet analysis of a single EEG channel. Expert Syst. Appl. 2016, 55, 559–565. [Google Scholar] [CrossRef]
- Tanaka, H.; Hayashi, M.; Hori, T. Topographical characteristics and principal component structure of the hypnagogic EEG. Sleep 1997, 20, 523–534. [Google Scholar] [CrossRef] [PubMed] [Green Version]
- Oliva, J.T.; Rosa, J.L.G. Classification for EEG report generation and epilepsy detection. Neurocomputing 2019, 335, 81–95. [Google Scholar] [CrossRef]
- Yin, Y.; Sun, K.; He, S. Multiscale permutation Rényi entropy and its application for EEG signals. PLoS ONE 2018, 13, e0202558. [Google Scholar] [CrossRef] [PubMed] [Green Version]
- Ding, C.; Peng, H. Minimum redundancy feature selection from microarray gene expression data. J. Bioinform. Comput. Biol. 2005, 3, 185–205. [Google Scholar] [CrossRef]
- Rosenberg, R.S.; van Hout, S. The American Academy of Sleep Medicine inter-scorer reliability program: Sleep stage scoring. J. Clin. Sleep Med. 2013, 9, 81–87. [Google Scholar] [CrossRef] [Green Version]
- Horn, D.; Demircioğlu, A.; Bischl, B.; Glasmachers, T.; Weihs, C. A comparative study on large scale kernelized support vector machines. Adv. Data Anal. Classif. 2018, 12, 867–883. [Google Scholar] [CrossRef]
- Tzeng, G.-H.; Huang, J.-J. Multiple Attribute Decision Making: Methods and Applications; CRC Press: Boca Raton, FL, USA, 2011; p. 335. [Google Scholar]
- Seifpour, S.; Niknazar, H.; Mikaeili, M.; Nasrabadi, A.M. A new automatic sleep staging system based on statistical behavior of local extrema using single channel EEG signal. Expert Syst. Appl. 2018, 104, 277–293. [Google Scholar] [CrossRef]
- Hassan, A.R.; Bashar, S.K.; Bhuiyan, M.I.H. On the classification of sleep states by means of statistical and spectral features from single channel Electroencephalogram. In Proceedings of the 2015 International Conference on Advances in Computing, Communications and Informatics (ICACCI), Kochi, India, 10–13 August 2015; IEEE: Kochi, India, 2015; pp. 2238–2243. [Google Scholar]
- Sharma, M.; Goyal, D.; Achuth, P.V.; Acharya, U.R. An accurate sleep stages classification system using a new class of optimally time-frequency localized three-band wavelet filter bank. Comput. Biol. Med. 2018, 98, 58–75. [Google Scholar] [CrossRef] [PubMed]
- Dai, Y.; Zhang, H.; Mao, X.; Shang, P. Complexity–entropy causality plane based on power spectral entropy for complex time series. Phys. A Stat. Mech. Its Appl. 2018, 509, 501–514. [Google Scholar] [CrossRef]
- Helakari, H.; Kananen, J.; Huotari, N.; Raitamaa, L.; Tuovinen, T.; Borchardt, V.; Rasila, A.; Raatikainen, V.; Starck, T.; Hautaniemi, T.; et al. Spectral entropy indicates electrophysiological and hemodynamic changes in drug-resistant epilepsy—A multimodal MREG study. NeuroImage. Clin. 2019, 22, 101763. [Google Scholar] [CrossRef] [PubMed]
- Zhang, A.; Yang, B.; Huang, L. Feature Extraction of EEG Signals Using Power Spectral Entropy. In Proceedings of the 2008 International Conference on BioMedical Engineering and Informatics, Sanya, China, 27–30 May 2008; pp. 435–439. [Google Scholar]
- Jiayi, G.; Peng, Z.; Xin, Z.; Mingshi, W. Sample Entropy Analysis of Sleep EEG under Different Stages. In Proceedings of the 2007 IEEE/ICME International Conference on Complex Medical Engineering, Beijing, China, 23–27 May 2007; IEEE: Beijing, China, 2007; pp. 1499–1502. [Google Scholar]
- Huang, J.-R.; Fan, S.-Z.; Abbod, M.; Jen, K.-K.; Wu, J.-F.; Shieh, J.-S. Application of Multivariate Empirical Mode Decomposition and Sample Entropy in EEG Signals via Artificial Neural Networks for Interpreting Depth of Anesthesia. Entropy 2013, 15, 3325–3339. [Google Scholar] [CrossRef]
- Pincus, S.M. Approximate entropy as a measure of system complexity. Proc. Natl. Acad. Sci. USA 1991, 88, 2297–2301. [Google Scholar] [CrossRef]
- Nakamura, T.; Adjei, T.; Alqurashi, Y.; Looney, D.; Morrell, M.J.; Mandic, D.P. Complexity science for sleep stage classification from EEG. In Proceedings of the 2017 International Joint Conference on Neural Networks (IJCNN), Anchorage, AK, USA, 14–19 May 2017; pp. 4387–4394. [Google Scholar]


| Sleep Stage | Characteristic Waves |
|---|---|
| W | Alpha (8–13 Hz) and beta (12–30 Hz) |
| N1 | Theta (4–8 Hz) |
| N2 | Spindle (12–14 Hz) and K complex (1 Hz) |
| N3 | Delta (0.5–2 Hz) |
| R | Alpha (8–13 Hz), beta (12–30 Hz), theta (4–8 Hz), and sawtooth wave (2–6 Hz) |
| Sleep Stage | Number of Epochs in Stages | Proportion |
|---|---|---|
| W | 2201 | 26.97% |
| N1 | 579 | 7.10% |
| N2 | 3221 | 39.47% |
| N3 | 900 | 11.03% |
| R | 1259 | 15.43% |
| Cascaded SVM | SVM | |
|---|---|---|
| Computing time for each epoch (s) | 1.65 | 1.57 |
| Average accuracy | 88.11% ± 0. 67% | 86.45% ± 0.71% |
| The average accuracy of N1 | 55.65% ± 3.13% | 41.5% ± 1.72% |
| Reference | Classifier | Accuracy | Accuracy of N1 |
|---|---|---|---|
| [41] | OCRNN | 82.40% | 33.39% |
| [18] | LSTM RNN | 86.74% | 61.09% |
| [42] | Elman RNN | 87.20% | 36.70% |
| [43] | Bagging | 86.53% | 27.48% |
| [26] | CNN | 86.79% | 34.92% |
| [44] | Multi-class SVM | 83.92% | 17.39% |
| This work | Cascaded Support Vector Machine | 88.11% | 55.65% |
| Features | Computing Time(s) | Accuracy | Accuracy of N1 | Score |
|---|---|---|---|---|
| Fuzzy entropy | 2.04 ± 0.012 | 0.8560 ± 0.0133 | 0.4685 ± 0.0638 | 0.6136 |
| LZC | 2.03 ± 0.015 | 0.8586 ± 0.0143 | 0.4550 ± 0.0647 | 0.5399 |
| Sample entropy | 2.04 ± 0.021 | 0.8589 ± 0.0096 | 0.4750 ± 0.0740 | 0.3808 |
| Multi-scale entropy | 2.02 ± 0.014 | 0.8651 ± 0.0152 | 0.4524 ± 0.0391 | 0.5858 |
| Performance Parameter | Before Nonlinear Features Selection | After Nonlinear Feature Selection | Total Features |
|---|---|---|---|
| Computing time for each epoch (s) | 2.08 | 1.65 | 2.65 |
| Average accuracy | 74.54% ± 0. 82% | 88.11% ± 0.67% | 74.36% ± 1.93% |
| Average accuracy of N1 | 26.58% ± 1.76% | 55.65% ± 3.13% | 26.97% ± 0. 75% |
Publisher’s Note: MDPI stays neutral with regard to jurisdictional claims in published maps and institutional affiliations. |
© 2022 by the authors. Licensee MDPI, Basel, Switzerland. This article is an open access article distributed under the terms and conditions of the Creative Commons Attribution (CC BY) license (https://creativecommons.org/licenses/by/4.0/).
Share and Cite
Li, D.; Ruan, Y.; Zheng, F.; Su, Y.; Lin, Q. Fast Sleep Stage Classification Using Cascaded Support Vector Machines with Single-Channel EEG Signals. Sensors 2022, 22, 9914. https://doi.org/10.3390/s22249914
Li D, Ruan Y, Zheng F, Su Y, Lin Q. Fast Sleep Stage Classification Using Cascaded Support Vector Machines with Single-Channel EEG Signals. Sensors. 2022; 22(24):9914. https://doi.org/10.3390/s22249914
Chicago/Turabian StyleLi, Dezhao, Yangtao Ruan, Fufu Zheng, Yan Su, and Qiang Lin. 2022. "Fast Sleep Stage Classification Using Cascaded Support Vector Machines with Single-Channel EEG Signals" Sensors 22, no. 24: 9914. https://doi.org/10.3390/s22249914