

Colon Cancer Diagnosis Based on Machine Learning and Deep Learning: Modalities and Analysis Techniques
by
 , and
, and
Mai Tharwat
1,
Nehal A. Sakr
1,
Shaker El-Sappagh
2,3,
Hassan Soliman
1,
Kyung-Sup Kwak
4,* and
Mohammed Elmogy
1,*
1
Information Technology Department, Faculty of Computers and Information, Mansoura University, Mansoura 35516, Egypt
2
Information Systems Department, Faculty of Computers and Artificial Intelligence, Benha University, Benha 13512, Egypt
3
Faculty of Computer Science and Engineering, Galala University, Suez 435611, Egypt
4
Department of Information and Communication Engineering, Inha University, Incheon 22212, Republic of Korea
*
Authors to whom correspondence should be addressed.
Sensors 2022, 22(23), 9250; https://doi.org/10.3390/s22239250
Submission received: 24 October 2022
/
Accepted: 24 November 2022
/
Published: 28 November 2022
(This article belongs to the Collection Artificial Intelligence (AI) in Biomedical Imaging)
Abstract
:The treatment and diagnosis of colon cancer are considered to be social and economic challenges due to the high mortality rates. Every year, around the world, almost half a million people contract cancer, including colon cancer. Determining the grade of colon cancer mainly depends on analyzing the gland’s structure by tissue region, which has led to the existence of various tests for screening that can be utilized to investigate polyp images and colorectal cancer. This article presents a comprehensive survey on the diagnosis of colon cancer. This covers many aspects related to colon cancer, such as its symptoms and grades as well as the available imaging modalities (particularly, histopathology images used for analysis) in addition to common diagnosis systems. Furthermore, the most widely used datasets and performance evaluation metrics are discussed. We provide a comprehensive review of the current studies on colon cancer, classified into deep-learning (DL) and machine-learning (ML) techniques, and we identify their main strengths and limitations. These techniques provide extensive support for identifying the early stages of cancer that lead to early treatment of the disease and produce a lower mortality rate compared with the rate produced after symptoms develop. In addition, these methods can help to prevent colorectal cancer from progressing through the removal of pre-malignant polyps, which can be achieved using screening tests to make the disease easier to diagnose. Finally, the existing challenges and future research directions that open the way for future work in this field are presented.
1. Introduction
Colon cancer is a specific kind of tumor that originates in the colon or the rectum, existing in the digestive system at the lower portion of [1]. The colon forms the main part of the large intestine, and the rectum exists at the end of the colon [2]. Colon cancer is considered to be one of the leading causes of death in the industrialized and Western world, and its incidence grown [3]. In 2012, about 1.4 million people were diagnosed with this disease. In 2017, there were almost 50,260 deaths reported [4]. The main reasons for incidence stem from unhealthy habits, including chain-smoking and eating high amounts of red meat and little fruit in addition to a family history of disease and increasing age [5].
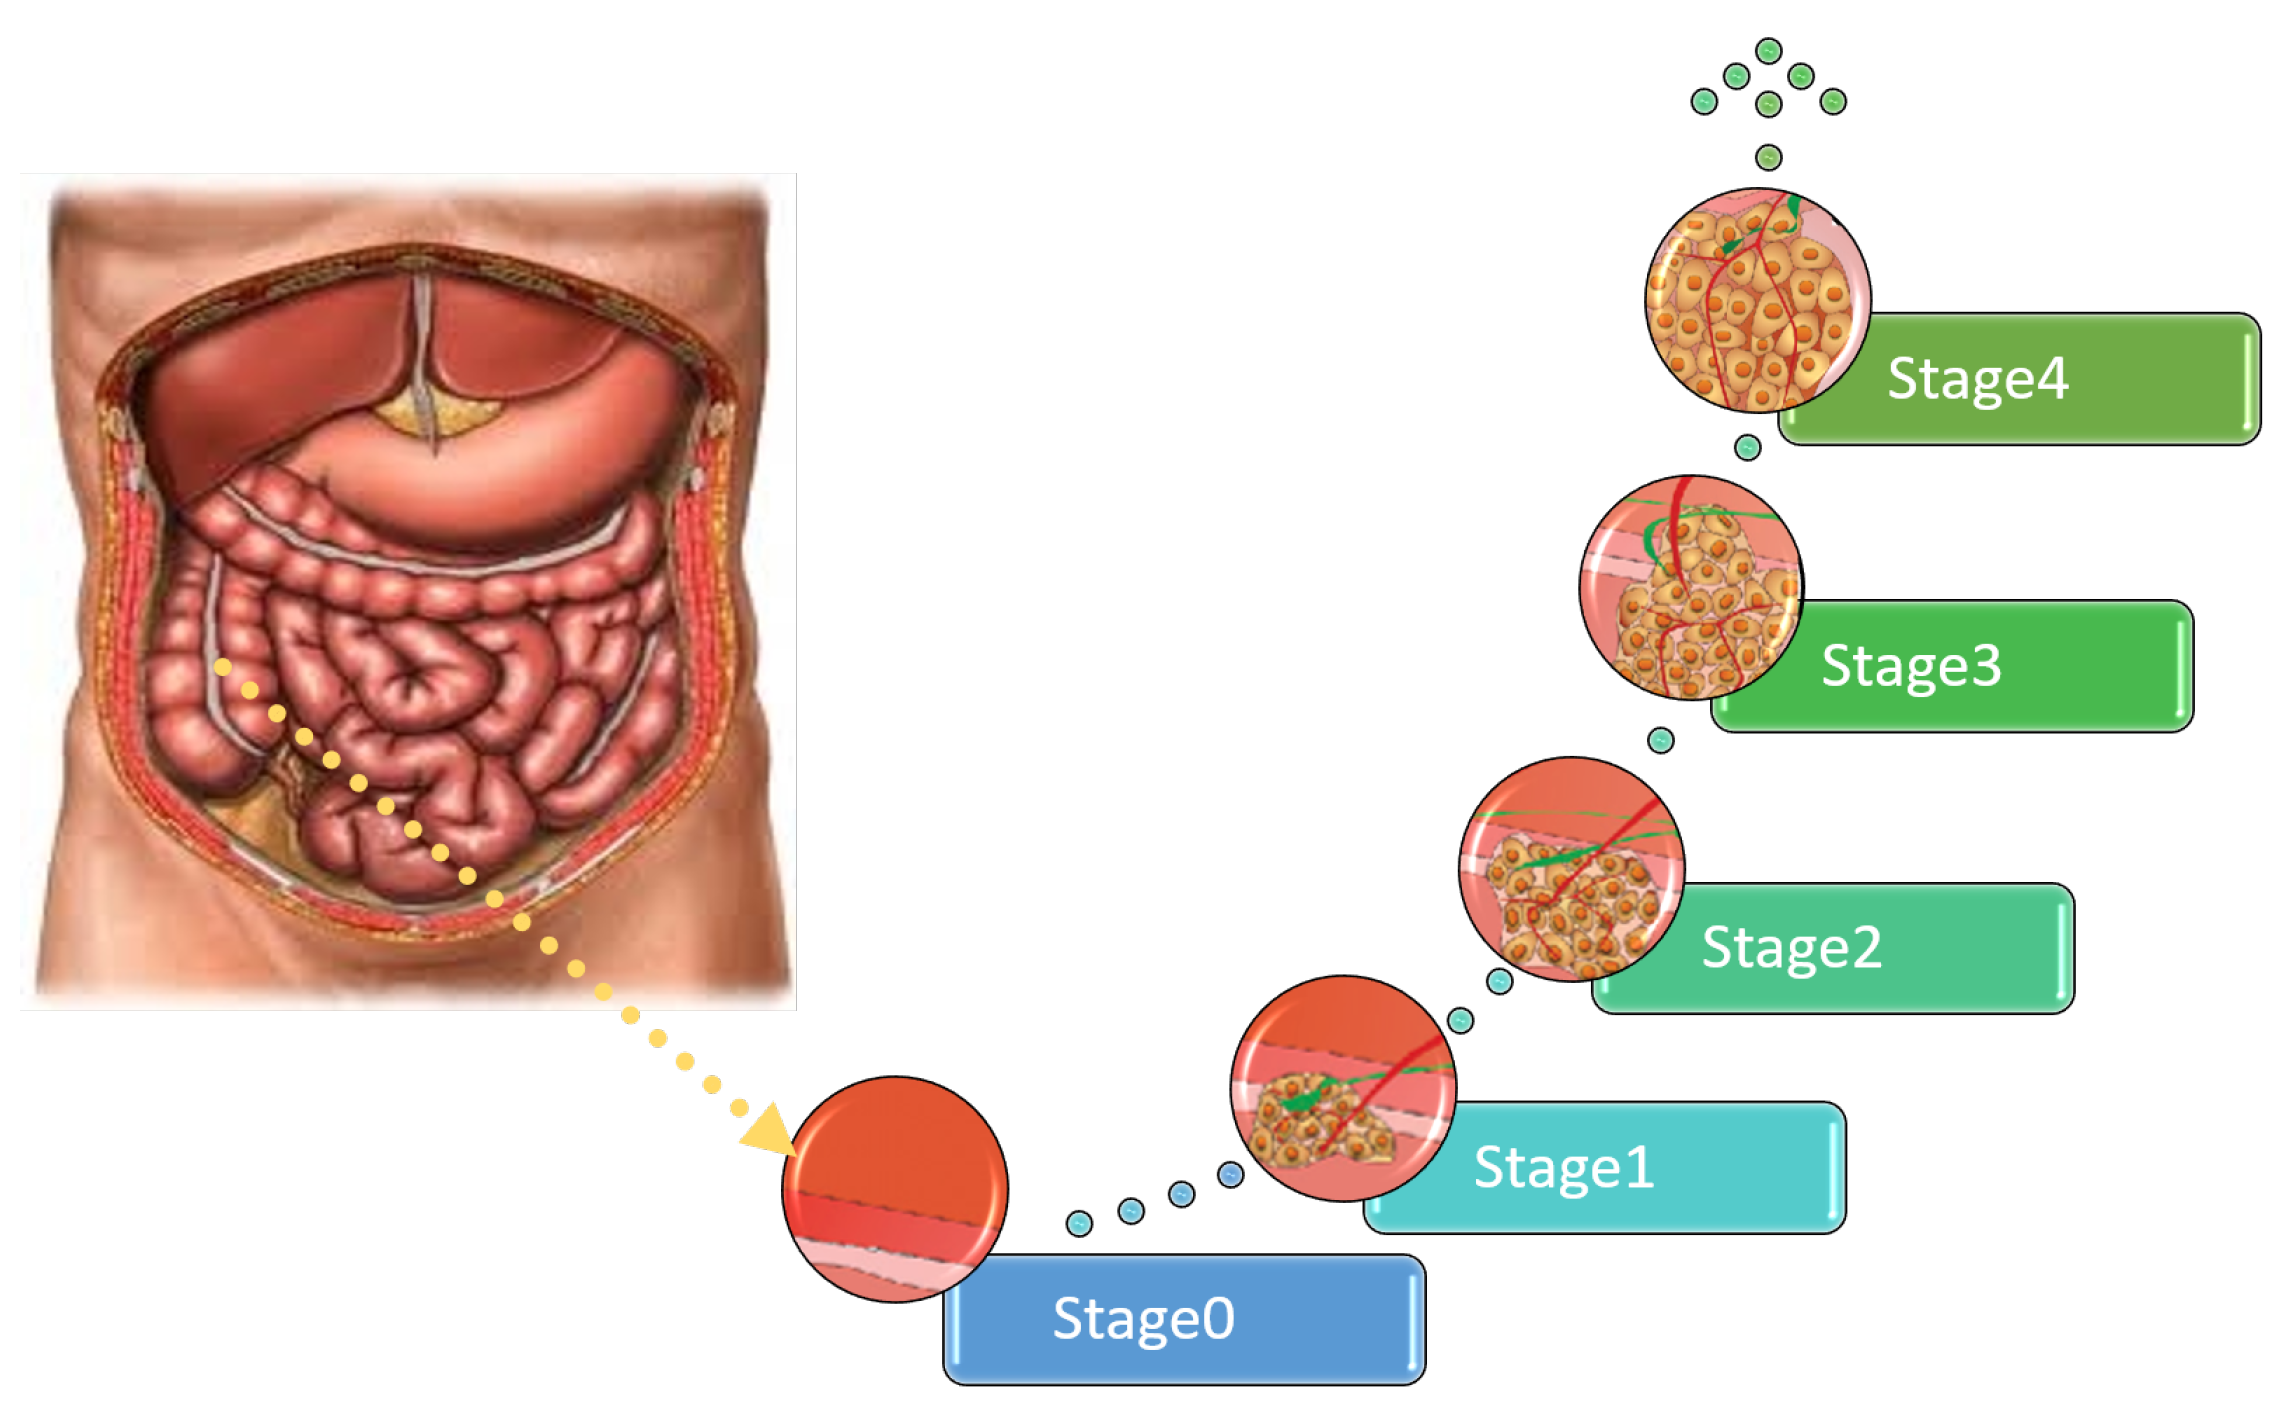
There are four main grades of colon cancer as shown in Figure 1 [6]. The first stage is defined as the mucosa or lining of the colon or rectum, while the organ wall has not yet developed tumors. In the second stage, the walls of the rectum or colon begin to develop tumors; however, nearby tissues or lymph nodes are not yet affected [7].
The third stage is reached when the tumor has spread only to the lymph tissues but has not yet spread to any other body part. In the fourth stage, the tumor spreads to other organs, such as the lungs [8]. The prevalence in stage four has different symptoms, depending on the organ to which the tumor has spread as shown in Table 1 [9].
Although colorectal cancer does not have apparent symptoms, particularly in its early stages [10], there are unusual symptoms, such as abdominal pain, constipation, excess gas, diarrhea, and changes in the color and shape of stool (e.g., narrow stool, abdominal cramps, and blood in the stool) [11]. According to ACS, the most common reason for colon cancer stems from adenocarcinoma disorders, accounting for almost 96% of all stages of this type of cancer [12].
Colorectal cancers can also arise from other tissues that have tumors, such as carcinomas that first arise in the hormone-producing polyps of the intestines [13] and lymphomas that may first form in the colon; however, this is less common. These sarcomas start in small tissues, such as gastrointestinal stromal tumors that start as normal tumors and later become cancerous (these at a few times begin in the colon but almost start in the digestive tract) [14].
Not all types of tumors are malignant. There is a non-spreadable or benign type that is not fatal or destructive as the spreadable type is. The difference of biological tumor structures presents great challenges for automatic and manual analysis of histopathological images (HIs) [15]. A manual examination of the cancer level/grade relies on the pathologist’s visual assessment, which is subjective, time-consuming, and potentially error-prone [16]. An incorrect or late diagnosis can cause anxiety for many patients. Therefore, Medical Image Analysis (MIA) is required to process and analyze HIs automatically. Such an MIA system can be used to classify colon cancer and present an objective, and accurate assessment of various grades of this cancer [17].
A diagnosis of colon cancer can be implemented automatically with the power of AI, leading to more types of diagnosis with less cost and in less time. AI-based diagnosis methods can be categorized into ML techniques and DL techniques. Recent advances in digital image processing (DIP) techniques and DL play an essential role in the diagnostic process [18]. In this paper, we show a comprehensive survey on different ML and DL techniques proposed for identifying the different stages of colon cancer. This can be accomplished using different imaging modalities. However, we focus on histopathological imaging, which is considered the best modality used to examine, classify, locate and provide a comprehensive view of the different cancer stages.
Due to the high mortality rates caused by colon cancer and the power of AI-based techniques for early diagnosis, many studies have been proposed on colon cancer diagnosis. However, the number of surveys presented in this research topic is limited. Starting from 2009, C. Demir and B. Yener [19] reported a brief review on detection of colon cancer on the basis of histopathological images. Then, in 2013, Rathore et al. [6] introduced a review on techniques of detection of colon cancer that were classified according to the employed dataset and methodology into biopsy-based analysis methods and physical sample analysis methods.
In this study, the authors claimed that much more work is required in their experiments regarding the performance measures and parameter tuning. In 2020, Pacal et al. [20] presented a comprehensive survey on the application of DL to colon cancer diagnosis. This work gives a detailed discussion on DL identifying its basic architectures and emerging topics and then summarizes the recent DL-related studies. Finally, in 2022, Davri et al. [21] published a systematic review on colon cancer diagnosis using histopathological images. They investigated the application of DL techniques for cancer diagnosis from both the medical and technical viewpoints.
In this review, the authors presented a summary of recent DL-based methods. Therefore, a detailed analysis and comparison of these techniques illustrating their working methodology, strengths, and limitations is still required. As noticed, recent reviews focused only on the application of DL for colon cancer diagnosis. Moreover, a detailed analysis of these studies is required, identifying their limitations to fulfill the main need of reviewers who are in this field by improving the open research directions.
The main purpose of this survey is to discuss and summarize the recent research attempts proposed for colon cancer identification and diagnosis, classified into ML-based and DL-based models. First, we discus many aspects related to colon cancer diagnosis, such as the existing imaging modalities used for analysis with special attention on histopathology images, in addition to the common cancer diagnosis systems. We review and compare the available datasets for colon cancer apart from the common performance evaluation metrics. Then, we review the existing work, identifying its working methodology in addition to the strengths and limitations. Finally, we discuss the most obvious challenges related to the automatic diagnosis of colon cancer to open the mind for future research directions.
The rest of this survey is categorized into eight parts as follows. Section 2 shows the methodology followed to present this survey, such as the keywords used for the search, the data sources, the criteria used for the inclusion and exclusion of articles, and the selection of articles. Section 3 discusses different aspects related to colon cancer diagnosis, such as the different screening tests used to analyze this type of cancer, the common diagnosis systems that are based on the analysis of HIs, the available datasets, and common performance evaluation metrics.
Section 4 presents a literature review of the conventional ML and DL techniques proposed for colon cancer diagnosis using different modalities. Section 5 presents the existing challenges discovered thus far, and Section 6 presents the future research directions to obtain better techniques. Finally, Section 7 concludes this study. Figure 2 shows the structure of this survey. Table 2 presents a list of abbreviations with the corresponding definitions used in this survey.
2. Research Methodology
In this part, we present the approach used to survey the modalities and techniques applied to diagnose colon cancer from the year 2019 to 2022. We discuss the keywords used for the search, the sources of data, the exclusion/inclusion criteria of articles, and the principles of article selection. Figure 3 shows the analysis frequency of DL and ML techniques. Figure 4 represents sub-techniques used in detection of colon cancer, classified into deep-learning (DL) and hand-crafted (HC) Techniques.
2.1. Keywords
Initially, we used specific keywords close to colon cancer in the search process, such as ’colon cancer diagnosis’ and ’colorectal cancer’. After the search, new words were collected from the resulting articles to obtain numerous keywords. Furthermore, new keywords, such as ’Imaging Modalities’, ’Deep Learning Techniques’, ’Histopathology Image Analysis’, and ’Medical Image Analysis’ were used based on our understanding of the research topic.
2.2. Data Sources
Various academic databases were used for obtaining relevant articles for the survey as shown in Table 3.
2.3. Inclusion and Exclusion of Article Criteria
In order to identify the most relevant publications for further review in our study, exclusion/inclusion measures were utilized that depended on our study objective. The studies that matched with the inclusion criteria were considered related to the study, while those that did not match the criteria were eliminated. Figure 5 shows the inclusion and exclusion criteria used in our research.
2.4. Selection of The Articles
To select the most significant articles, three stages were followed. First, the article title, abstract, and keywords were checked for relevant articles. The second stage refined the results obtained in the previous stage by analyzing the abstract, introduction, and conclusion of the obtained articles. Finally, the last stage was to read and analyze the main body of the articles more deeply and to determine their relevance to our research.
3. Colon Cancer Diagnosis
Before going in depth and reviewing the current work on colon cancer diagnosis, many aspects related to the diagnosis process should be taken into consideration, such as the image modality used, type of diagnosis system, the dataset used, and the metrics used for evaluation. Therefore, in the following subsections, we discuss these aspects.
3.1. Imaging Modalities
As mentioned before, our main goal is the automatic diagnosis of colon cancer with high detection accuracy and without manual intervention. In this section, we take an in-depth look at the different imaging modalities recently applied for MIA, including Computed Tomography (CT), Endorectal Ultrasound (ERUS), virtual Computed Tomography Colonoscopy (CTC), and Magnetic Resonance Imaging (MRI) [22] in addition to other modalities, such as Histopathological Imaging (HI) and Positron Emission Tomography (PET) [23]. A brief comparison between the different imaging modalities from different aspects is presented in Table 4.
3.1.1. Virtual Computed Tomography Colonoscopy (CTC)
CTC imaging is the first modality to rely on low-density attenuation X-rays. For accurate examination, the colon/rectum must be adequately inflated using a thin carbon dioxide rectal catheter or by air pushed into the patient’s colon [24]. Air distention of the colon is preferred because of its ease of administration and lower cost. Acquisition of CT can be performed twice for two reasons. The first reason is to better reach the different parts of the colon through gravitational compression, which is based on its abdominal structures.
The second reason is that the polyps can exist in the intestine walls from fecal or liquid residues in the prone and passive position (or vice versa). Appropriate software can be used to remove residual fluid from CTC images. Different images of the CTC colonoscopy are shown in Figure 6. Horton et al. [25] showed that the CT modality is valuable for the planning of colon cancer surgery since it can capture the regional extension of the tumor in addition to distant metastases and adenopathies. With CT imaging, colorectal cancer usually appears as a soft-tissue mass, a discrete mass, or in a thickened cushion-walled form with intestinal discomfort.
Ding et al. [26] presented a comparison between CTC and colonoscopy for the ability to detect a larger colorectal polyp. Two meta-analysis studies showed the high accuracy of colon cancer CTC detection—a high sensitivity equal to 100%. CTC is an approach to screen patients without actual symptoms as suggested by the ACS as a method for validation of diagnosis since 2008 and is considered the primary method used in screening for CRC [27].
However, Kekelidze et al. [28] used a multi-center randomized trial that included a large sample of patients, almost 1610 patients, and the results showed that this suggestion was revalidated. CTC is a non-surgical replacement to MRI colonoscopy that is not related to radiation exposure but has similar sensitivity [29]. However, CTC is not recommended as a screening modality because the results of the available studies are insufficient.
3.1.2. Magnetic Resonance Imaging (MRI) and Endorectal Ultrasound (ERUS)
The MRI modality is recommended for the early stages of tumors as it can define the location and accurately identify the relationship between the tissues, the reflective Britton, and the total extension [10]. The MRI modality is characterized by its high precision in determining the length of the tumor by measuring the distance between the tumor distal part and the junction of anorectal. On the other hand, the ERUS modality can be used to assess the integrity of the rectal wall layers. Endorectal MRI has many disadvantages, including limited availability, being less patient-friendly, and being costly. Therefore, this method is not recommended by the European society for medical oncology guidelines [30].
Burdan et al. [10] presented an overview of the ERUS and MRI modalities. These modalities have the ability to capture and explore the morphology of the colon in detail. Therefore, they are considered an essential tool in locating the tumor at any stage. Each stage of cancer has its treatment plan. With the ERUS and MRI imaging modalities, it is easy to determine the proper treatment plan for an early-stage tumor faster than other modalities.

Table 4.
Comparison between different imaging modalities.
| No. | Image Modality | Characteristics | Diagnosis Applications | CONS. | PROS. |
|---|---|---|---|---|---|
| 1 | Computed Tomography Colonoscopy (CTC) [31]. | To obtain the images uses magnets and radio waves to create [32]. |
|
|
|
| 2 | Magnetic Resonance Imaging (MRI) [33]. | Uses radio waves and magnetic [34]. |
|
| |
| 3 | Histopathology Images (HI) [36,37]. | Using glass slides and braces on surgical specimens or microscopy to examine a biopsy [38]. |
|
|
|
| 4 | Positron Emission Tomography (PET) [39]. | Showing activity using a radioactive drug (tracer) [40]. |
|
|
|
3.1.3. Histopathology Images (HIs)
HIs have different biological structures and are based on pathologists’ knowledge in defining morphological and architectural features. Through the tissue area, HIs show an appearance with visual variability at a high rate in the linked patterns of certain small structures. In biological and anatomy systems, most of the visual variability is inherited [42]. For biological research, this useful modality, which makes it our main objective in this survey. The use of the HI modality affects the method of obtaining the design and data of algorithms concerning storage and processor limitations.
3.1.4. Positron Emission Tomography (PET)
Mukai et al. [43] used 18F-fluoro-2-deoxy-d-glucose (FDG) to screen PET images for malignant tumors. They also evaluated preoperative PET images in cancer patients. The following sections present a detailed discussion of common imaging modalities.
3.2. Common Diagnosis Systems Based on HI Analysis
In this paper, our main focus is on colon cancer diagnosis based on HI analysis. In general, most of the stages of HI analysis depend mainly on the basic concepts of mathematics. Figure 7 presents the main stages of a typical HI Analysis pipeline [44].
In the first stage, 2D/3D arrays of HIs are obtained and passed to a gray-scale or color imaging system. They are then fed to the preprocessing phase, where some operations in linear algebra are applied to array of the image for better image resolution to be able to distinguish structures from others. Then, the segmentation phase separates the background of the objects from the cells by applying mathematical algorithms, such as texture homogeneity, intensity, watershed transformation, and level set transformations.
The next stage is the extraction of features process. Instead of processing each pixel, this stage explores the most significant features from the sliced images for further processing. Therefore, it minimizes the computational complexity of the system. Finally, the diagnostic stage applies clustering or classification algorithms on the features extracted from the input images [45]. To achieve an intensive analysis of HIs, mathematical functions and operations must be applied to all analysis phases, beginning with the prepossession phase and ending with the diagnostic phase [46].
This section discusses common diagnosis systems applied for colon cancer detection based on HI analysis. These systems include Computer-Aided Diagnosis (CAD), Content-Based Image Retrieval (CBIR), and other findings in clinicopathology association systems.
3.2.1. Computer-Aided Diagnosis (CAD) Systems
During the process of analysis of electronic HIs, CAD systems cover many of the tasks, and thus their functionality corresponds to the pathologists who are involved. The errors that result from applying the ML process differ from those that result from an individual pathologist. Therefore, the application of the CAD method improves the classification results and increases the system’s reliability. Furthermore, you can minimize the instability of analyzing and understanding each pixel in WSI. Various diagnostic functions involve the region of interest segmentation or recognition as an index of immunization.
Doi et al. [47] presented the motivation and strategy for the CAD scheme’s early development, together with the future potential and current status of CAD in an environment of PACs, using the output of the computer as a “second opinion” by radiologists with CAD to make the final decisions. The results were that the sensitivity was 75% at 1.03 false-positive fractures per image.
Hamilton et al. [48] presented, within large histological scenes, a means of locating abnormality focal areas through image texture scanning on low-power mode. In this study, images classified as dysplastic and normal on the basis of their texture were not perfect.
3.2.2. Content-Based Image Retrieval (CBIR) Systems
Images used by CBIR are related to query images. CBIR approaches are supported by different histories, such as the study, training, examination, and pathology. For example, CBIR methods can be used by novice pathologists and academic applications to recover HIs from tissues appropriately. Furthermore, they are useful for competent pathologists, particularly when detecting unusual situations.
We can use unsupervised learning since CBIR does not require tagged data. There is a need for high-speed investigation from multiple images that depends on related images—not only accuracy—in CBIR. Therefore, the dimensional features of the image can be minimized by many approaches, such as nearest-neighbor searches, which are rapidly estimated [49].
Hou et al. [50] proposed supervised methods based on labeled histopathology data with large volumes that are expensive to generate. The proposed method learns in an unsupervised manner from heterogeneous pathology patches. The used model is synthesized with importance weights as trained patches, to train the task-specific (e.g., segmentation) CNN to minimize the ideal (unbiased) generalization error over real data.
In supervised methods, the results are significantly better than across-cancer generalization results when no supervised data is available for a cancer case. The proposed method does as well as supervised methods, even existing supervised data, due to the synthetic data being on a much larger scale. The results are segmented on over 5000 whole-slide images (WSIs), which is a larger dataset than the human annotated datasets that are currently available.
3.2.3. Finding New Clinicopathological Association Systems
Analysts and pathologists produce many discoveries related to important diseases, such as contagious diseases and tumors. For example, pathologists processed the gastric mucosa of individuals that are diagnosed with gastritis. The morphological options of cancers must be linked. Tumor classification is important for various cancer cases, such as breast and prostate cancer, specifically in the treatment preparation and the patient process of diagnosis.
There is a significant growth in the digitization of clinical data, where it has boosted techniques to assess the genome. Therefore, today, we can achieve large amounts of electronic data, such as genome data, CT scans, and MRI. New relations of hospital pathology, such as somatic cancer mutations, including morphological quality, are available by examining the relationships between different imaging screening methods. Existing CAD approaches can be classified into DL and conventional ML methods, which will be discussed in the following section.
Cheng et al. [51] assessed mismatch repair protein deficiency in the largest series for the breast cancer as survival outcomes were linked and the immunohistochemistry was determined. They determined 31 MMR-deficient states out of 1635 that had data for all four MMR biomarkers (MSH2, MSH6, MLH1, and PMS2).
Kim et al. [52] proposed patients with PCNSL having the characteristics of low FDG uptake over a 10-year period. The data recommended that PCNSL was closely matched by the tumor to negative results, specifically with a low uptake for MUM1 expression. MUM1 plays an essential role in the differentiation, survival, and proliferation of cells.
Janowczyk et al. [53] showed a unified tool for the DP domain and the importance of DL according to its innate ability for learning useful features from data directly via seven use cases: the (a) segmentation of nuclei, (b) segmentation of epithelium, (c) detection of lymphocyte, (d) detection of mitosis, and (e) classification of lymphoma. They outlined a guide with insights for bridging the current knowledge gap between the DP domain and DL methods.
3.3. Datasets
Dramatically increasing the dataset size needed for testing training is a critical challenge [54,55]. There are public datasets in the electronic pathology course, including manual observations for HIs. These are helpful in the review process. Image artifacts (e.g., the zoom level and image resolution) and slide problems (e.g., smudges) have similarity ratios. However, all of these datasets are expected only in specific states of tumors, and there are several tasks that the existing databases do not handle. The publicly available datasets for colorectal cancer are summarized in Table 5 and are discussed below.
- CRC Grading DatasetThe CRC [56] Grading Dataset contains 38 H&E stained histological WSIs with a resolution 4548 × 7548.
- PanNuke DatasetPanNuke [57] includes 200,000 nuclei divided into five main classes to challenge the approaches of classifying and segmenting nuclei in WSIs with a resolution of 224 × 224.
- The Warwick-QU DatasetIn this dataset [58] are 16 slides of H&E stained histological WSIs of colon histology; this dataset is being created as category of the GlaS challenge with resolutions of 430 × 575 (14 images) and 520 × 775 (151 images).
- CoNSeP DatasetCoNSeP [59] contains 41 H&E stained image slides with a resolution of 1000 × 1000 pixels at 40× magnification of objective: generally 24,319 annotated nuclei with labeled classes.
- ETIS-LARIB
- CRCHistoPhenotypes–Labeled Cell Nuclei DatasetThis dataset [61] has 100 H&E CRC. For the process of detection, there are 29,756 nuclei; for classification, 22,444 nuclei (miscellaneous, fibroblast, and epithelial); and 7312 unlabeled with a resolution of 500 × 500.
- Kent Integrated Dataset (KID)The KID [62] is responsible for the health and welfare system for the entire population of Medway and Kent. This dataset is rich and unique for researchers seeking health and care on a large scale. This also provides an overview of the patient journey, care, and needs.
- CVC-ColonDB and CVC-ClinicDB
- Colonoscopy DatasetThe dataset [63] contains 76 videos, containing both WL and NBI. The database contains 40 adenomas with SD resolution of 768 × 576, 21 hyperplastic lesions, and 15 serrated adenomas.
- Extended CRC Grading Dataset (KID) In this dataset [64] are 300 images that are non-overlapping. These were labeled by expert pathologists as high grade (Grade 3) tumors, low grade (Grade 2) tumors, or normal tissue (Grade 1) with a resolution of 4548 × 7548.
- ASU-Mayo ClinicCurrently, there are numerous research programs based on co-funded acceleration, seed research, and team science grants [65]. This means that more than 20–30 cohorts of senior nursing students in their clinical training by Mayo Clinic nursing faculty on the Mayo campus are expected to be completed. Due to this effort and cooperation, the seed grant program has added joint, cutting-edge research collaborations, a host of dual degree opportunities, and others. In 2016 and in the summer of 2010, the relationships of the Mayo Clinic became enterprise-wide, and the ASU Alliance for Health Care was formed.
Table 5.
Datasets for colorectal cancer with different imaging modalities.
| Author | Dataset Name | No. of Images | Resolution | Task | Modality |
|---|---|---|---|---|---|
| Awan et al. [56] | CRC Grading Dataset | 139 | 4548 × 7548 | Classification, Cancer grading, | Histology |
| Gamper et al. [57] | PanNuke Dataset | 20K WSI | 224 × 224 | Classification, Segmentation | Histology |
| Sirinukunwattana et al. [58] | The Warwick-QU Dataset | 165 | 430 × 575 (14 images), 520 × 775 (151 images), | Gland segmentation | Histology |
| Leenhardt et al. [66] | CAD-CAP | 25,000 | Various resolutions | Detection, classification | Capsule endoscopy (CE) |
| Graham et al. [59] | CoNSeP dataset | 41 | 1000 × 1000 | Classification, Nuclear instance segmentation | Histology |
| Bernal et al. [67] | ETIS-Laribv | 196 | HD,1225 × 966 | Polyp detection, localization | Colonoscopy |
| Vázquez et al. [68] | CVC-ColonDB | 300 | SD, 574 × 500 | Polyp segmentation, localization | Colonoscopy |
| Sirinukunwattana et al. [61] | CRCHistoPhenotypes–Labeled Cell Nuclei Dataset | 100 | 500 × 500 | Nucleus detection, classification | Histology |
| Bernal et al. [69] | CVC-ClinicDB | 612 | SD, 384 ×b288 | Polyp detection, localization, segmentation | Colonoscopy |
| Jha et al. [60] | Kvasir-SEG | 1000 | Various resolutions | Polyp segmentation | Colonoscopy |
| Mesejo et al. [63] | Colonoscopy Dataset | 76 | SD, 768 × 576 | Classification | Colonoscopy |
| Javed et al. [70] | CRC Tissue Phenotyping (CRC-TP) Dataset | 256 | 500 × 500 | Nucleus detection, classification | Histology |
| Kather et al. [71] | CRC-VAL-HE-7K CRC-VAL-HE-7K | 7180 image patches | 224 × 224 | Predicting survival, classification, detection | Histology |
| Shaban et al. [64] | Extended CRC Grading Dataset | 300 | 4548 × 7548 | Cancer Grading | Histology |
3.4. Performance Evaluation Metrics
Metrics of evaluation are utilized to measure the quality of models of machine learning. One can evaluate whether the DL algorithm of training is effective on new data by using these metrics of evaluation. Many different evaluation metrics can be used for testing a model. More accurate results can be found using multiple metrics for evaluating the quality of a trained model because each model performing using a metric of evaluation differs from the same model using another evaluation metric.
The factors of correctly used evaluation metrics are critical as these describe whether the trained model is performing well or not. In the following section, we show some formulas and an explanation of the evaluation metrics utilized by academic papers.
True Positive (TP) is when a method classifies the correct category correctly, while False Positive (FP) is when a method classifies the correct category incorrectly. On the other hand, True Negative (TN) is when a method classifies the negative category correctly, while False Negative (FN) is when a method classifies the negative category incorrectly. We can customize these values in the medical field of cancer detection. An example is that, if the image includes cancerous cells, then the trained model predicts the malignant cells successfully, and thus this case is called TP, while if the trained model predicts that it is not a malignant cell, then this case is called FP.
On the other hand, if the image includes no malignant cells, and the model predicts that the image does not contain cancerous cells, then this case is called TN. If the image includes no malignant cells, and the trained model predicts it as a malignant cell, then this case is called FN. In the next section, we present an explanation and description for formulas that are related to the common evaluation metrics.
- The Accuracy measures the proportion of true observations to the number of samples measured, which can be calculated as:
- The Rate of Error shows the proportion of inaccurate observations to the number of measured samples, which can be calculated as:
- The Precision measures the true classified positive estimates of the total classified estimates in a correct category, which can be calculated as:
- The Recall is employed for measuring the ratio of correct estimates that are correctly predicted. This can be calculated as:
- The Specificity is presented for measuring the positive observations rate of false samples and can be calculated as:
- The Sensitivity measures the number of correct samples that are classified as true and can be calculated as:
- The ROC curve presents the ratio of false positives to the ratio of TPs by showing the performances of the possible threshold values used and can be calculated as:
4. Literature Review
CAD systems are an active topic to research using HIs and play an important role in diagnosis. Various imaging techniques are used to diagnose the disease and examine these HIs. In addition, various MIA techniques have been performed for classification to measure disease characteristics from HIs. Additionally, nuclei and glands can be segmented to recognize cell types and to automatically determine the existence of a disease within samples. Depending on the sample, the evaluation of the intensity of the disease can also be obtained [72].
Existing CAD systems can be categorized into systems based on ML techniques and systems based on DL techniques. In the following subsections, we introduce the most prominent research proposed toward the diagnosis of colon cancer on the basis of ML and DL techniques.
4.1. Conventional Machine-Learning Methods
The machine-learning process for HI analysis involves five main phases as shown in Figure 10, and these are discussed in the following text.
4.1.1. Preprocessing
The images obtained contain variations (e.g., staining, color, and noise) and must be uniform. These variations generally result from the scanning procedures. The components and architecture of the tissue are analyzed using wax under the microscope to produce the macroscopic sections. Pathologists use one or more colored stains to diagnose and analyze the architecture and tissue components to isolate the cellular components [73].
Jang et al. [74] used hematoxylin-eosin (H&E) to separate the nuclei, cytoplasm, and connective polyps. Hematoxylin colors the nucleus blue and eosin colors the cytoplasm and connective tissue pink. The classification performance is determined based on the consistency of the extracted features. Therefore, the step of image processing is essential for determining the image state. On this basis, the approaches utilized to enhance the image and to overcome different illumination fluctuations are determined. In this way, the quality is also improved.
Various preprocessing approaches can be applied to images. The preprocessing techniques are well adapted to the state of the image. They control the differences of contrast in images, noise removal, and brightness. Therefore, this phase is critical as the input tissue images must be similar to those stored in the database. In addition, a number of effects, such as image size variations, orientation, posture, lighting, and background, should be reduced.
4.1.2. Segmentation
The process of segmentation in images plays an essential role in the analysis of histopathology images, which plays a significant role in solving different problems. The tasks required are different from each other for each stage, and even each image is different from another. Image segmentation is similar to clustering. This defines meaningful segments that can differ from model to model or even cell to cell [28,75].
4.1.3. Feature Extraction
This stage is utilized for extracting features from the colonoscopy images that describe the characteristics of the colon. This is performed using computer-diagnosed colonoscopy images to discover the patient’s current condition. At this stage, tissues are removed from the region to facilitate the diagnostic process [76]. This step helps to improve the accuracy of the classification performance. There are many feature extraction techniques, such as LBP [77], SIFT [78], and HOG [79].
There are many available approaches for examining the colon, such as barium radiography and sigmoidoscopy; however, colonoscopy is currently the best modality for diagnosing any colonic tissue. The early detection of any tissue increases the chances of a cure for patients.
Image textures in CTCs have a high capability to differ between various tissue cases and thus improve the CTC model toward optimal tissue management for preventing fatal colorectal cancer [80]. However, textures of images are frequently compromised according to the operations of error correction and noise smoothing in most CT image reconstructions.
4.1.4. Image Classification
Accurate and efficient histological cell classification is paramount for image analysis in the medical field. Thus, the classification process is a challenging task according to the variation of the cells. For doctors, this phase makes it easier to understand the different treatment approaches for colon cancer. Below, we review recent ML-based studies for colon cancer diagnosis, and these are summarized in Table 6. After a comprehensive analysis of these studies, we summarize their main strengths and limitations in Table 7.
Niazi et al. [81] showed the use of unsupervised learning for colon cancer detection and the process of cancer case analysis using gene expression data. This method differs from any other approach used for diagnosing colon cancer, as it allows the use of various kinds of data and is not only for colon cancer. Gene expression data are used to classify and detect different types of cancer.
Rasti et al. [82] proposed three approaches of classification to three states of cancer on mice colon walls as well as inflammation and health with the use of endomicroscopy images. Fully automated methods of machine learning (ML) were presented with the SVM methodology, including classical texture-based classification, transfer learning, and deep learning. They compared various strategies of training. The experimental results had an accuracy of 99.93% on the ImageNet/ILSVRC dataset.
Na et al. [83,84,85] presented a fully automated method of classification with a GBM method that depends on supervised learning, which was then tested on many images. The experimental results showed that the rate of correct recognition was 99.93%, which was the best performance proved for the second approach. For the more difficult first case, the results were 98.49%. They utilized the CRCHistoPhenotypes dataset, which includes a large number of microscopy images.
Rathore et al. [86] presented a complete approach for gland segmentation and for cancer classification and detection into three different colon cancer grades. For the segmentation of colon glands, they modeled the tissue parts as ellipsoids. For the process of detection and classification, they extracted multiscale features that encode the texture and the spatial architectural patterns of a gland apart from its cellular morphology. They evaluated their study using two different datasets for the classification into three cancer grades.
Dragicevic et al. [87] presented a colon detection model on the basis of a new imaging method called Optomagnetic Imaging Spectroscopy (OMIS). In comparison with a histopathological imaging model, the OMIS showed results with an accuracy of 92.59% using MPNN as a classifier and 89.87% using Naïve Bayes.
Shanmuga et al. [88] showed a CAD system that utilizes the WCE method for screening to determine tumors of colon cancer. In the proposed method, the images are entered to the preprocessing stage using filtering and ROI-based histograms. Then, the tumor region is detected using an algorithm of K-means clustering. From the segmented regions, features are extracted using spatial gray level dependence matrices (SGLDM). Finally, a support vector machine is applied for tumor multilevel classification into benign, malignant, or normal. This detection method achieved an accuracy of 95%.
Babu et al. [89] proposed a multi-level threshold image segmentation approach based on 2DReCA. In addition, they extracted two sets of textures from the preprocessed grayscale colon images. They evaluated the quality of the presented model using a random forest classifier on different images data of colon cell sets with different magnification factors containing malignant and normal labels.
Fahami et al. [90] employed methods of machine learning, such as KNNs and DT, to determine the properties of tumors of this cancer. The main task in the process of colon cancer diagnosis using HIs is the prediction of cancerous genes. To this end, various algorithms of ML have been utilized on the data of colon cancer. This research utilized supervised and unsupervised ML methods to predict the top active genes in patients of colon cancer. They categorized the patients into two main sections and explored the most effective 20 genes of the vital status in each section. The experimental results had an accuracy of 97.49 ± 2.92 on the HTSeq-FPKM-U dataset.
Jansen-Winkeln et al. [91] proposed an approach of colon cancer detection using HSI optical imaging technology. They utilized a four-layer perceptron neural network to classify the image into three classes: adenomatous margin close to the central tumor, cancer, and healthy mucosa. They evaluated their work using images collected from patients between July 2019 and May 2020 using a hyperspectral camera. Their results reached a sensitivity of 86%.
Talukder et al. [92] showed a combination of deep-leaning and machine-learning techniques for the detection of colon and lung cancers. They combined the deep features extracted using deep-learning techniques with ensemble learning machine-learning classifiers. They evaluated their model using the LC25000 dataset for lung and colon cancers. Experiments were performed for colon and lung cancer with accuracy ratios of 100% and 99.30%, respectively.
Chehade et al. [93] presented a CAD system that classifies HIs of colon and lung cancer into five different classes. In this model, HIs were preprocessed using image preprocessing techniques, and then the discriminative features were extracted. Finally, they fed the extracted features into six machine-leaning models: MLP, SVM, LDA, XGBoost, RF, and LightGBM.
Alqudah et al. [94] presented an ML-based model for the detection of colon cancer. They utilized 3D GLCM matrices of three different color spaces to extract texture features from the input HIs. Then, the extracted features were fed into five different ML algorithms: SVM, ANN, KNN, QDA, and CDT. This model was evaluated on a private dataset containing eight different classes of HIs: tumors, debris, lymphoma, adipose, complex, empty, mucosa, and stroma.
4.2. Deep-Learning Methods
DL methods have successfully produced many models for processing images, [95] and for processing voice/sound [96]. Recently, researchers presented that the DL can also be utilized in the processing of medical images, such as MRI [97], CT [98], biopsy [99], and endoscopy [100] images. Generally, datasets of digital pathology have become increasingly available and public. It has became possible and feasible to evaluate DL techniques to enhance the quality and efficiency of histological diagnosis.
Recently, DL techniques have been used in various fields and have achieved superior results compared to traditional ML methods (for example, automated analysis for HIs, natural language processing (NLP), and biomedical fields). With DL, abstract representations are presented in a meaningful way and can be quickly understood. CNN is considered a typical instance of applied structure. When using techniques of DL, several measures can be utilized to manage histopathology depending on the task settings.
HIs styles consider the primary features that the scaling stages can determine. There are two primary factors: patch size, which is network related, and impure homogeneity for whole-slide images (WSI) [48]. The network structure shows the main position. However, predefined system structures are maintained in many studies. Figure 11 presents the main steps for the segmentation and classification of colon cancer using a DL-based Convolutional Neural Network (CNN) architecture.
The following paragraphs will review the common DL-based research for colon cancer diagnosis. A summary of these studies is presented in Table 8, and a comparison identifying their main strengths and limitations is presented in Table 9.
Shapcott et al. [101] used a cell-identification DL algorithm in TCGA for colon cancer imaging, which improved the performance without loss of accuracy when sampling the image [102]. The extracted features were related to various variables, including: venous invasion, lymphatic invasion, metastasis, and residual tumors. The local dataset was used to train the DL algorithm, and then TCGA images were used for testing. In each part, they identified the tissues. The average number of slides in an image containing cells in this application was 900.
De et al. [103] showed a method for automatic polyp insertion detection in colonoscopy images. They utilized ETIS-LaribPolypDB as a testing set and the CVC-ClinicDB database as a training set. The results of their method showed that the process of polyp insertion is useful to reduce false positive (FP) and that the traditional augmentation of data can be effective. The results showed a low false positive rate (FPR) while maintaining a substantial sensitivity/recall. The final results showed that the F1-Score was 91.4% and the FPR was 0.079 with their modified version of a training set over the ETIS-LaribPolypDB testing dataset.
Kang et al. [104] presented an ensemble transfer-learning model based on the union of two classified masks by bitwise operations for the segmentation of colorectal polyps. They used the CVC-ClinicDB, CVC-ColonDB, and ETIS-Larib datasets. The results of their experiments demonstrated the superiority of their approach against state-of-the-art approaches to segmenting polyps.
Sornapudi et al. [105] presented a modified R-CNN by creating masks around the detection of tissues from frames. This approach was developed on the basis of the R-CNN. The generated feature maps utilized ResNet-101 and produced further details using FPN for polyp images compared to ResNet-50. The proposed model can be segmented and detected the polyps in images successfully. This approach can preform a segmentation process accurately for each polyp. This produced better quality on the WCE video frames compared with images of colonoscopy. The results showed better polyp localization compared with recent DL and traditional methods.
Zhang et al. [106] presented SSD-GPNet, which is an improved SSD for gastric polyp detection in real-time with 50 FPS using Titan, which is a CNN that is produced based on SSD architecture. They utilized images of colonoscopy containing two independent datasets and a special dataset consisting of 2484 images. The experimental results presented that the improved SSD for the detection of gastric polyps can be applied for real-time polyp detection with 50 FPS and can enhance the mAP from 88.5% to 90.4% with low performance times.
Zobel et al. [107] applied an R-CNN. They utilized three colonoscopy independent datasets, including 2484 HD labeled tissue images from their clinic, as well as two public datasets from the MICCAI 2015 detection challenge for polyps, containing 194 HD labeled images and 612 SD with polyps. The experimental results showed that the three datasets were investigated with precision = 0.86, recall = 0.92, F1 = 0.89 (dataset A), precision = 0.80, recall = 0.86, F1 = 0.82 (dataset B) and precision = 0.74, recall = 0.83, and F1 = 0.79 (dataset C).
Ma et al. [108] proposed a DL model using a CNN for efficiently classifying and detecting colorectal polyps from images of colonoscopy. They trained their model using a dataset that is a benchmark and showed results of 92% accuracy and efficient computational speed for all sizes of polyps, which might be overlooked in colonoscopy. Blanes-Vidal et al. [109] introduced an algorithm to objectively quantify the similarity between predicted polyps and those classified by OC, CCE, and HP, depending on their morphology, location, and size. They also proposed a CNN for the autonomous localization and detection of colorectal polyps in WCE. They used WCE images from datasets, and the results produced unexpectedly high sensitivity (97.1%), accuracy (96.4%), and specificity (93.3%).
Wang et al. [110] showed a CAD real-time system based on DL directed to maximize the detection rates of adenoma in a low-prevalent ADR region in colorectal tissue. Given fidelity, stability and high accuracy, their system can be applied in clinical practice for better quality detection of colon polyps.
Yuan et al. [111] produced a model of DenseNet-UDCS to detect tissues from the WCE images, considering small inter-class variances in the dataset, the image unbalanced problem, and large intra-class differences. Their results found a tissue recognition accuracy of 93.19%, presenting that the proposed DenseNet-UDCS could detect polyps from the images and could classify the endoscopic images accurately.
Jia et al. [112] proposed PLPNet, which is a two-stage framework for the detection of pixel-accurate tissues in images of colonoscopy that achieved accuracy using a CNN. They utilized the MICCAI 2015 dataset with results that improved on the generality and effectiveness of the produced system. PLPNet is effective, simple, and fast at inference and can be suggested for applications in clinical practice.
Tripathi et al. [113] presented a method using histopathological images that combined deep and handcrafted features utilizing medical datasets (ImageNet). Two datasets of colon cancer nuclei were used. They combined methods of DL in different ways, which led to the best approach that used AlexNet, VGG16, VGG19, ResNet50, DenseNet121, and InceptionV3 methods. Then, they combined handcrafted features that directly depended on raw images instead of object-level features.
For better performance, they used weak descriptor features to remove the artifacts present around the nuclei and background. To reduce space and computational complexity, they combined techniques of handcrafted and deep networks. They utilized an experimental dataset by randomly categorizing the dataset into testing, validation, and training subsets of 15%, 70%, and 15% respectively, and the network was enhanced by 15% on the validation sets and 70% on the training set.
Javed et al. [70] showed a detection algorithm for a cellular community with semi-supervised phenotyping of tissue. This depended on polyp classification, clustering, and the detection of image patches into communities with meaning. For cell classification and detection, they first used deep neural networks and then utilized tissue–tissue links between these tissues for computing feature vectors at the slide level. For constructing a network at patch level, they used these feature vectors through the chi-square distance, where the weights of each node and edge were inversely proportional to the distance between the vectors of the feature.
They proved that their algorithm is for both handcrafted and deep-learning features that complement each other. The results were: specificity 0.920%, accuracy 0.898%, recall 0.898%, precision 0.936%, and F1 0.914% for the Etis-Larib dataset. The results for the CVC-ClinicDB dataset were: specificity 0.994%, accuracy 0.985%, precision 0.985%, F1 0.985%, and recall 0.985%.
Shaban et al. [64] presented a context-aware CNN for cancer staging capable of a context that was 64-times larger than normal CNN-based slide classifiers. The quantitative and qualitative results showed that their method enhanced domain-oriented techniques, methodologies of classification based on patches, and existing methods of context.
Nadimi et al. [114] presented a CNN for autonomous colorectal tissue detection in images captured during WCE in the evolution of colorectal cancer with the risk of malignancy. They utilized Kvasir datasets and WCE images from independent datasets, and the results showed an unprecedented sensitivity of 98.1%, a high accuracy of 98.0%, and a specificity of 96.3%.
Mostafiz et al. [115] presented a powerful detection system of gastrointestinal polyps in endoscopic videos. The presented method explains an automatic system depending on an extraction of new schemes of colored features as support for the gastrointestinal detection of polyps. Their system showed higher accuracy from the analysis of ROC. The experimental results on standard public databases produced that the presented system outperformed the previous conventional approaches, obtaining a sensitivity of 99.91%, accuracy of 99.53%, and specificity of 99.15%.
Ozawa et al. [116] used a Single-Shot Multi-Box Detector, which is a CNN. They utilized 4013 images of normal colorectums and 16,418 images from 4752 CPs for training, and then using 7077 colonoscopy images, considering 1172 CP images from 309 different kinds of CP for validating. The speed of diagnostics for the classification and detection of CP were measured as a factor of quality of the trained model. The trained network detected 1246 CP with a PPV of 86% and a sensitivity of 92%. The PPV and sensitivity were 83% and 90%, respectively, for the white light images, and 98% and 97% for the narrowband images.
Table 8.
Summary of DL-based studies for colorectal cancer diagnosis.
| Author (Year) | Topic | Imaging Modality | DL Architecture | Datasets Availability | Results |
|---|---|---|---|---|---|
| Hou et al. [50] (2019) | Polyp segmentation | HIs | CNN | Public | Reduce the error of segmentation by 7.8%, 5.4%, and 3.2%. |
| Janowczyk et al. [53] (2016) | Polyp Detection | Digital-Pathology (DP) | NIA | Public | TPR: 86% PPV: 64% |
| Tripathi et al. [113] (2020) | Polyp Detection | HIs | AlexNet VGG16 VGG19 ResNet50 DenseNet121 InceptionV3 | Public | Precision: 0.62% Recall: 0.63% AUC: 0.03% Loss: 0.0043 |
| Shapcott et al. [101] (2019) | Polyp detection | HIs | CNNs | Private | Accuracy: 65% |
| Ben Hamida et al. [117] (2021) | Polyp detection | Digital pathology (DP) | ALEXNET | Public | CRC-5000-Accuracy: 98.66% NCT-CRC-HE-Accuracy: 99.12% |
| Liewa et al. [118] (2021) | Polyp Detection CVC-ClinicDB | Endoscopic Images | ResNet-50 | Public | Accuracy: 99.10% Sensitivity: 98.82% Precision: 99.37% Specificity: 99.38% |
| Pacal et al. [20] (2020) | Polyp Detection | CT | RNNs, Autoencoders (AEs) | Public | sensitivity: 0.91 |
| De et al. [103] (2019) | Polyp Segmentation | Colonoscopy Images | CNNs | Public | F1-Score: 91.4% FPR: 0.079 |
| Javed et al. [70] (2020) | Detection of Polyp | Colonoscopy Images | CNN | Public | Specificity: 920% Accuracy: 89.8% F1: 91.4% Recall: 89.8% Precision: 93.6% |
| Sikder et al. [119] (2021) | Polyp Detection | MRI | CNN | Private | Accuracy: 93% |
| Kang et al. [104] (2019) | Polyp Segmentation | Colonoscopy | CNN | Public | Dataset results of Etis-Larib: recall: 74.37%, precision: 73.84%, IoU: 66.07% |
| Sornapudi et al. [105] (2019) | Detection of Polyp | WCE + Colonoscopy | CNN | Public | Dataset results of ResNet-101: F2: 78.70% recall: 80.29%, F1: 76.43%, precision: 72.93%. Dataset results of ResNet-50: recall: 67.79%, F2: 66.57%, precision: 62.11%, F1: 64.83% |
| Jia et al. [112] (2020) | Segmentation of Polyp | Colonoscopy | CNN | Public | recall: 81.7%, Precision: 63.9%, F2: 77.4%, F1: 71.7% |
| Ozawa et al. [116] (2020) | Polyp classification of colorectal and automated detection of endoscopic | Colonoscopy | CNN | Private | Detection: PPV: 86%, sensitivity: 92% Narrow-band images classification: 81% Conventional white-light Classification images: 83% |
| Zhang et al. [106] (2019) | Detection of Polyps | Colonoscopy | CNN | Private | F1: 84.24%, recall: 76.37%, Precision: 93.92% |
| Zobel et al. [107] (2019) | Polyp Detection | Colonoscopy | CNN | Private | F1: 89%, precision: 86%, Recall: 93% |
| Ma et al. [108] (2019) | Polyp Localization | Colonoscopy | CNN | Private | sensitivity: 93.67%, accuracy: 96%, AP: 94.92%, specificity: 98.36% |
| Shaban et al. [64] (2020) | Polyp Detection and Classification | Colonoscopy | CNN | Private | F2: 66.07%, F1: 68.72% |
| Blanes-Vidal et al. [109] (2019) | Polyp detection | WCE | CNN | Private | sensitivity: 97.1%, Accuracy: 96.4%, specificity: 93.3% |
| Wang et al. [110] (2019) | Real-time automatic detection system | Colonoscopy | CNN | Private | ADR Increment 9.1% vs. 20.3%, p < 0.001) |
| Mostafiz et al. [115] (2020) | Polyp Detection | Colonoscopy | CNN + CEMD | Public | sensitivity: 99.91%, Accuracy: 99.53%, specificity: 99.15% |
| Yuan et al. [111] (2019) | Polyp Recognition | WCE | CNN | Private | Accuracy: 0.9319, precision: 74.51%, recall: 90.21%, F1: 81.83% |
| Nadimi et al. [114] (2020) | Colorectal polyps Localization and Autonomous Detection | WCE | CNN | Private | sensitivity: 98.1%, Accuracy: 98%, specificity: 96.3% |
| Javed et al. [70] (2020) | Detection of Cellular Community for Issue Phenotyping | Histopathology | Handcrafted, CNN | Public | Patch level separation: average F-score for CCT dataset: 94.5%, average F-score for CRC-TP dataset: 91% Patient level separation: average F-score for CRC-TP dataset: 84% |
Table 9.
General strengths and limitations of DL studies.
| Author | Strengths | Limitations |
|---|---|---|
| Hou et al. [50] (2019) |
|
|
| Shapcott et al. [101] (2019) |
|
|
| Ben Hamida et al. [117] (2021) |
|
|
| Liewa et al. [118] (2021) | Their approaches are robust enough to assist in CAD | Their classification system can misclassify images taken by colonoscopy/endoscopy according to the structure and image color characteristics, which are naturally irregular in the colon. |
| Pacal et al. [20] (2020) | Presented a comprehensive survey with all overviews. | Their model did not determine a common experimental setup and evaluation criteria. |
| Sikder et al. [119] (2021) |
|
|
| Kang et al. [104] (2019) |
|
|
| Sornapudi et al. [105] (2019) |
|
|
| Jia et al., [112] (2020) |
|
|
| Zobel et al. [107] (2019) |
|
|
| Ma et al. [108] (2019) |
|
|
| Shaban et al. [64] (2020) |
|
|
| Blanes-Vidal et al. [109] (2019) |
|
|
| Wang et al. [120] (2020) |
|
|
| Mostafiz et al. [115] (2020) |
|
|
| Yuan et al. [111] (2019) |
|
|
| Nadimi et al. [114] (2020) |
|
|
| Ozawa et al. [116] (2020) |
|
|
Ben Hamida et al. [117] proposed and assessed state-of-the-art models of DL for the pixel- and patch-level classification of a sparsely annotated dataset for colorectal histopathology. They presented, from a dataset of generalized multimedia, the utilization of transfer learning to a specific context of histopathological images. They used available datasets, such as the AiCOLO, ImageNet, and the GlaS datasets, but still had certain limitations, including gradient-vanishing problems, the main weakness that classical CNNs suffer from, which can control their ability to provide representations of generic data. Consequently, various improved techniques were produced, called RNN and inception models [28,37,38].
Liewa et al. [118] showed a new aggregation of a PCA with modified deep-residual CNNs and an ensemble-learning model for a colonic classification system of polyp. They evaluated their model by computing the MCC, sensitivity, accuracy, specificity, and precision. In the experiment of 1517 images from a collection of three free databases that are public and accessible, they acquired beneficial results with 0.9819 MCC. The precision, specificity, accuracy, and sensitivity of tissue classification were 99.37%, 99.38%, 99.10%, and 98.82%, respectively. Therefore, these results produced approaches robust enough to help in CAD. They used some available datasets, including Kvasir, CVC-ClinicDB, and ETIS-LaribPolypDB.
5. Current Challenges
This survey provided an overview of colon cancer and its stages to be diagnosed to determine the appropriate treatment. ML and DL techniques are used in image-processing methods to accurately detect this type of cancer. These methods play an essential role in many applications, such as construction, image recognition, health assessments, medical diagnosis, and defect identification. However, there exist many challenges facing the colon cancer diagnosis process. In this section, we discuss the challenges related to the process of colon cancer diagnosis, which are classified into two main aspects as introduced below.
5.1. Challenges Related to Image Modalities
This survey discusses the different modalities used to image tumors. MIA is an active topic to research in the ML area. Colorectal cancer screening uses a common method, which is HIs, where images have been taken using microscopes to locate, examine, classify, and provide a comprehensive view of the grades of cancer. Each modality has its strengths. By merging images from multiple modalities, we combine their strengths; however, this also has its flaws as discussed in this survey. Below, we list the most common challenges related to different imaging modalities.
- CTC Images:These have several challenges when isolating and enumerating. The first is that the cells have various structures, which creates various results for each tool in the image’s manual review. Thus, we demand a consistent and clear explanation of classification of the CTC [121].
- MRI Images:MRI has a challenge, which is the discomfort for patients while capturing these images, particularly in the anal stenosis case as well as to the movement of the rectal wall, which also has effects on these images. In routine cancer grading, the use of phased array coils is recommended to handle these motifs because the pelvic coil has been shown to produce high accuracy rates of 59–95% in rectal cancer [122,123].
- PET Images:The challenge with PET is that it only works by absorbing glucose. Although glucose is widespread in most body cells and can be absorbed and predicted, unlike malignant cells, it is difficult to detect in certain other tissues using the PET modality [124].The use of a combination of CT with PET produces better results, particularly in oncology, to diagnose and detect the stage of cancer. However, this combination leads to several errors, such as:
- –
- Misdiagnosis of cancer or even its stage results from an unknown spatial shift between the PET and CT images. For example, it is difficult to identify whether a tumor in the lung is pleural, close to the chest wall, or invasive.
- –
- If any tissues absorb the radiation out of the PET, a second error occurs. This error is due to the large difference in attenuation, which is diverted to correct the attenuation, such as the skin’s surface or the upper part of the liver.
- HIs Images:Handling gray-scale images is considered a challenging issue of HIs. This can be handled with certain processes, such as the transformation between the color spaces, the change in the image sizes to adapt to the GPU, and the change in the resolution of the images [16]. There are other challenges in the analysis process of HIs, such as a few images to train, the representation of feature complexity, and the size of the HI being extremely large [125,126]. These challenges are briefly discussed in the following points:
- –
- The variance in histopathology from one cancer case to another points to a tangible variance in distributions of color, texture, scale, and morphology [127]. This makes it challenging to find a clear and consistent structure for the diagnosis of cancer and for all cases of cancer. Hence, one of the primary functions in high-level MIA is the feature representation as well as classification and segmentation.
- –
- The size of HIs is huge. This grows the database of this modality of image and, therefore, the computation complexity, making it a challenge to analyze the images. For a 100,000 × 100,000 pixel image, a full scan of the histopathology part of the model can be performed. This modality also includes two million objects. Generally, for every patient, 12 to 20 screen images are performed under the pathological section process. Furthermore, because the database range is large for HIs, a good model with high efficiency both in memory and time is required, and the algorithm for learning should be able to obtain a large amount of data from it [128,129].
5.2. Challenges Related to Datasets
Many publicly available datasets used to diagnose many diseases, particularly colon cancer, are briefly discussed here. Finally, DL and ML techniques help identify cancer in nearly stage, leading to early treatment and a lower mortality rate than after symptom development. Additionally, you can prevent colorectal cancer before it progresses by removing nonmalignant tissues, which can be achieved through screening tests to make it easier to diagnose the disease. Many challenges have arisen and are summarized in the following points:
- The image size is the first obstacle if it is little or not enough to train, specifically in the medical field.
- The medical image database is often small, making the available applications that use ML algorithms inefficient for handling new medical images.
- The process of collecting medical images is expensive due to the two following factors: [130]:
- The first is that the injury rate has decreased recently, and the size of MIs is associated with the number of injury cases directly; thus, it is also difficult to obtain the images.
- The other purpose is that MIs require manual feedback for clarity, which requires a great deal of effort. Furthermore, manual comments can also be vague, even if experts write them.
6. Future Research Directions
To detect and prevent colon cancer, the gold standard is colonoscopy. According to the reviewed research, often half of the studies contained reviews of colonoscopy, including polyp classification, detection, and segmentation. There are few studies on WCE that are based on endoscopy while there are many based on colonoscopy.
In the diagnosis process of colon cancer, colonoscopy is the main and common standard method used to confirm these data. Recently, studies are moving towards technology, such as DL, and studying or relying on the field of ML. DL can be utilized as a secondary tool for screening but not as an alternative for a specialized endoscopist. DL can also be used in the detection process of missed cells by maximizing the quality of endoscopists.In future work, researchers should consider the following research directions:
- MIA is an active topic to research in the ML area. For colorectal cancer screening using the common HI modality, it can be handled with certain processes, such as:
- –
- The transformation between the color spaces and the change resolution of the images to adapt them to the GPU.
- –
- The change in the resolution of the images to decrease the computation complexity, making it less complicated to analyze.
- –
- We need a consistent and clear of features definition due to the histopathology difference from one cancer stage to another. This results in a significant distribution difference of the color texture, morphology, and scale as well as segmentation and classification.
- We need available applications and platforms that use ML and DL algorithms efficiently for handling new medical images.
- A retroactive study in more than one institute.
- Applying the emerging DL techniques, such as transfer learning, autoencoders, and generative adversarial networks.
7. Conclusions
Generally, after diagnosing the presence of cancer, the next most important step is diagnosing the cancer stage, since an appropriate choice of treatment method and duration depends on this information. Identifying the cancer stage or grade mainly depends on analyzing the structure of the tissue region, which is performed using various tests for screening that can be utilized to explore polyps or colorectal cancer in images. This paper presented a comprehensive review regarding the diagnosis process for colon cancer. We presented different image modalities used for the analysis process.
The most common method used for colon cancer is HIs, which are captured by a microscope. The current state-of-the-art techniques (classified into ML and DL techniques) were reviewed, as these help to determine early-stage cancer, thus, leading to early treatment and lowering the mortality rate. These techniques can also aid in inhibiting the progress of colorectal cancer through the removal of nonmalignant cells after using screening tests to diagnosis the disease early.
Regarding the scientific efforts on this research topic, we also introduced many future research techniques to be investigated. In the future, we intend to implement a comparative study of the most prominent ML and DL techniques in a unified environment using a set of benchmark datasets and predefined evaluation metrics.
Author Contributions
Conceptualization, M.T., M.E., N.A.S., S.E.-S., H.S. and K.-S.K.; Formal analysis, M.E., S.E.-S., H.S. and K.-S.K.; Investigation, M.E., S.E.-S., H.S. and K.-S.K.; Methodology, M.T, M.E., N.A.S., and S.E.-S.; Project administration, M.E., N.A.S., S.E.-S., H.S. and K.-S.K.; Supervision, M.E., H.S. and N.A.S; Validation, M.E., N.A.S., S.E.-S. and K.-S.K.; Visualization, M.T. and N.A.S.; Writing—original draft, M.T., M.E., H.S. and N.A.S.; Writing—review and editing, M.T., M.E., N.A.S., S.E.-S., H.S. and K.-S.K. All authors have read and agreed to the published version of the manuscript.
Funding
This work was supported by the National Research Foundation of Korea through a grant funded by the Korean government (Ministry of Science and ICT)-NRF-2020R1A2B5B02002478.
Institutional Review Board Statement
Not applicable.
Informed Consent Statement
Not applicable.
Data Availability Statement
Not applicable.
Conflicts of Interest
The authors declare no conflict of interest.
References
- Allison, J.E. Colorectal cancer screening guidelines: The importance of evidence and transparency. Gastroenterology 2010, 138, 1648–1652. [Google Scholar] [CrossRef] [PubMed]
- An, F.P.; Liu, J.E. Medical Image Segmentation Algorithm Based on Optimized Convolutional Neural Network-Adaptive Dropout Depth Calculation. Complexity 2020, 2020, 1645479. [Google Scholar] [CrossRef]
- Araghi, M.; Soerjomataram, I.; Jenkins, M.; Brierley, J.; Morris, E.; Bray, F.; Arnold, M. Global trends in colorectal cancer mortality: Projections to the year 2035. Int. J. Cancer 2019, 144, 2992–3000. [Google Scholar] [CrossRef] [PubMed] [Green Version]
- Barish, M.A.; Soto, J.A.; Ferrucci, J.T. Consensus on current clinical practice of virtual colonoscopy. Am. J. Roentgenol. 2005, 184, 786–792. [Google Scholar] [CrossRef] [PubMed] [Green Version]
- Thun, M.J.; Calle, E.E.; Namboodiri, M.M.; Flanders, W.D.; Coates, R.J.; Byers, T.; Boffetta, P.; Garfinkel, L.; Heath, C.W., Jr. Risk factors for fatal colon cancer in a large prospective study. JNCI J. Natl. Cancer Inst. 1992, 84, 1491–1500. [Google Scholar] [CrossRef] [PubMed]
- Rathore, S.; Hussain, M.; Ali, A.; Khan, A. A recent survey on colon cancer detection techniques. IEEE/ACM Trans. Comput. Biol. Bioinform. 2013, 10, 545–563. [Google Scholar] [CrossRef] [PubMed]
- Baxter, N.N.; Goldwasser, M.A.; Paszat, L.F.; Saskin, R.; Urbach, D.R.; Rabeneck, L. Association of colonoscopy and death from colorectal cancer. Ann. Intern. Med. 2009, 150, 1–8. [Google Scholar] [CrossRef] [PubMed]
- Bera, K.; Schalper, K.A.; Rimm, D.L.; Velcheti, V.; Madabhushi, A. Artificial intelligence in digital pathology—New tools for diagnosis and precision oncology. Nat. Rev. Clin. Oncol. 2019, 16, 703–715. [Google Scholar] [CrossRef] [PubMed]
- Kitayama, J.; Nagawa, H.; Tsuno, N.; Osada, T.; Hatano, K.; Sunami, E.; Saito, H.; Muto, T. Laminin mediates tethering and spreading of colon cancer cells in physiological shear flow. Br. J. Cancer 1999, 80, 1927–1934. [Google Scholar] [CrossRef] [Green Version]
- Burdan, F.; Sudol-Szopinska, I.; Staroslawska, E.; Kolodziejczak, M.; Klepacz, R.; Mocarska, A.; Caban, M.; Zelazowska-Cieslinska, I.; Szumilo, J. Magnetic resonance imaging and endorectal ultrasound for diagnosis of rectal lesions. Eur. J. Med. Res. 2015, 20, 1–14. [Google Scholar] [CrossRef] [PubMed]
- Bychkov, D.; Linder, N.; Turkki, R.; Nordling, S.; Kovanen, P.E.; Verrill, C.; Walliander, M.; Lundin, M.; Haglund, C.; Lundin, J. Deep learning based tissue analysis predicts outcome in colorectal cancer. Sci. Rep. 2018, 8, 3395. [Google Scholar] [CrossRef] [PubMed] [Green Version]
- Levin, B.; Lieberman, D.A.; McFarland, B.; Andrews, K.S.; Brooks, D.; Bond, J.; Dash, C.; Giardiello, F.M.; Glick, S.; Johnson, D.; et al. Screening and surveillance for the early detection of colorectal cancer and adenomatous polyps, 2008: A joint guideline from the American Cancer Society, the US Multi-Society Task Force on Colorectal Cancer, and the American College of Radiology. Gastroenterology 2008, 134, 1570–1595. [Google Scholar] [CrossRef] [PubMed] [Green Version]
- Chaddad, A.; Tanougast, C.; Dandache, A.; Al Houseini, A.; Bouridane, A. Improving of colon cancer cells detection based on Haralick’s features on segmented histopathological images. In Proceedings of the 2011 IEEE International Conference on Computer Applications and Industrial Electronics (ICCAIE), Penang, Malaysia, 21–22 May 2011; pp. 87–90. [Google Scholar]
- Hur, C.; Chung, D.C.; Schoen, R.E.; Gazelle, G.S. The management of small polyps found by virtual colonoscopy: Results of a decision analysis. Clin. Gastroenterol. Hepatol. 2007, 5, 237–244. [Google Scholar] [CrossRef] [PubMed]
- Gunduz-Demir, C.; Kandemir, M.; Tosun, A.B.; Sokmensuer, C. Automatic segmentation of colon glands using object-graphs. Med. Image Anal. 2010, 14, 1–12. [Google Scholar] [CrossRef] [PubMed] [Green Version]
- Wang, D.; Foran, D.J.; Ren, J.; Zhong, H.; Kim, I.Y.; Qi, X. Exploring automatic prostate histopathology image gleason grading via local structure modeling. In Proceedings of the 2015 37th Annual International Conference of the IEEE Engineering in Medicine and Biology Society (EMBC), Milano, Italy, 25–29 August 2015; pp. 2649–2652. [Google Scholar]
- Dal Molin, M.; Matthaei, H.; Wu, J.; Blackford, A.; Debeljak, M.; Rezaee, N.; Wolfgang, C.L.; Butturini, G.; Salvia, R.; Bassi, C.; et al. Clinicopathological correlates of activating GNAS mutations in intraductal papillary mucinous neoplasm (IPMN) of the pancreas. Ann. Surg. Oncol. 2013, 20, 3802–3808. [Google Scholar] [CrossRef]
- Masud, M.; Sikder, N.; Nahid, A.A.; Bairagi, A.K.; AlZain, M.A. A machine learning approach to diagnosing lung and colon cancer using a deep learning-based classification framework. Sensors 2021, 21, 748. [Google Scholar] [CrossRef]
- Demir, C.; Yener, B. Automated Cancer Diagnosis Based on Histopathological Images: A Systematic Survey; Dept. of Computer Science, Rensselaer Polytechnic Inst.: New York, NY, USA, 2005. [Google Scholar]
- Pacal, I.; Karaboga, D.; Basturk, A.; Akay, B.; Nalbantoglu, U. A comprehensive review of deep learning in colon cancer. Comput. Biol. Med. 2020, 126, 104003. [Google Scholar] [CrossRef]
- Davri, A.; Birbas, E.; Kanavos, T.; Ntritsos, G.; Giannakeas, N.; Tzallas, A.T.; Batistatou, A. Deep Learning on Histopathological Images for Colorectal Cancer Diagnosis: A Systematic Review. Diagnostics 2022, 12, 837. [Google Scholar] [CrossRef] [PubMed]
- Elazab, N.; Soliman, H.; El-Sappagh, S.; Islam, S.; Elmogy, M. Objective Diagnosis for Histopathological Images Based on Machine Learning Techniques: Classical Approaches and New Trends. Mathematics 2020, 8, 1863. [Google Scholar] [CrossRef]
- Bar-Shalom, R.; Valdivia, A.Y.; Blaufox, M.D. PET imaging in oncology. Semin. Nucl. Med. 2000, 30, 150–185. [Google Scholar] [CrossRef] [PubMed]
- DeBarros, M.; Steele, S.R. Colorectal cancer screening in an equal access healthcare system. J. Cancer 2013, 4, 270. [Google Scholar] [CrossRef]
- Horton, K.M.; Abrams, R.A.; Fishman, E.K. Spiral CT of colon cancer: Imaging features and role in management. Radiographics 2000, 20, 419–430. [Google Scholar] [CrossRef] [Green Version]
- Ding, H.; Pan, Z.; Cen, Q.; Li, Y.; Chen, S. Multi-scale fully convolutional network for gland segmentation using three-class classification. Neurocomputing 2020, 380, 150–161. [Google Scholar] [CrossRef]
- Hartmann, D.; Bassler, B.; Schilling, D.; Adamek, H.E.; Jakobs, R.; Pfeifer, B.; Eickhoff, A.; Zindel, C.; Riemann, J.F.; Layer, G. Colorectal polyps: Detection with dark-lumen MR colonography versus conventional colonoscopy. Radiology 2006, 238, 143–149. [Google Scholar] [CrossRef] [PubMed]
- Kekelidze, M.; D’Errico, L.; Pansini, M.; Tyndall, A.; Hohmann, J. Colorectal cancer: Current imaging methods and future perspectives for the diagnosis, staging and therapeutic response evaluation. World J. Gastroenterol. 2013, 19, 8502. [Google Scholar] [CrossRef] [PubMed]
- Esgiar, A.N.; Naguib, R.N.; Sharif, B.S.; Bennett, M.K.; Murray, A. Fractal analysis in the detection of colonic cancer images. IEEE Trans. Inf. Technol. Biomed. 2002, 6, 54–58. [Google Scholar] [CrossRef] [PubMed]
- Geiger, T.M.; Ricciardi, R. Screening options and recommendations for colorectal cancer. Clin. Colon Rectal Surg. 2009, 22, 209. [Google Scholar] [CrossRef] [PubMed] [Green Version]
- Rathore, S.; Iftikhar, M.A.; Hussain, M.; Jalil, A. Classification of colon biopsy images based on novel structural features. In Proceedings of the 2013 IEEE ninth International Conference on Emerging Technologies (ICET), Islamabad, Pakistan, 9–10 December 2013; pp. 1–6. [Google Scholar]
- Li, J.; Ye, G.; Das, A.; Zhao, R.; Gong, Y. Advancing acoustic-to-word CTC model. In Proceedings of the 2018 IEEE International Conference on Acoustics, Speech and Signal Processing (ICASSP), Calgary, AB, Canada, 15–20 April 2018; pp. 5794–5798. [Google Scholar]
- Lustig, M.; Donoho, D.L.; Santos, J.M.; Pauly, J.M. Compressed sensing MRI. IEEE Signal Process. Mag. 2008, 25, 72–82. [Google Scholar] [CrossRef]
- Nerad, E.; Lambregts, D.M.; Kersten, E.L.; Maas, M.; Bakers, F.C.; van den Bosch, H.C.; Grabsch, H.I.; Beets-Tan, R.G.; Lahaye, M.J. MRI for local staging of colon cancer: Can MRI become the optimal staging modality for patients with colon cancer? Dis. Colon Rectum 2017, 60, 385–392. [Google Scholar] [CrossRef] [PubMed]
- Hanasono, M.M.; Kunda, L.D.; Segall, G.M.; Ku, G.H.; Terris, D.J. Uses and limitations of FDG positron emission tomography in patients with head and neck cancer. Laryngoscope 1999, 109, 880–885. [Google Scholar] [CrossRef]
- Sena, P.; Fioresi, R.; Faglioni, F.; Losi, L.; Faglioni, G.; Roncucci, L. Deep learning techniques for detecting preneoplastic and neoplastic lesions in human colorectal histological images. Oncol. Lett. 2019, 18, 6101–6107. [Google Scholar] [CrossRef] [PubMed] [Green Version]
- Noorbakhsh, J.; Farahmand, S.; Namburi, S.; Caruana, D.; Rimm, D.; Soltanieh-ha, M.; Zarringhalam, K.; Chuang, J.H. Deep learning-based cross-classifications reveal conserved spatial behaviors within tumor histological images. Nat. Commun. 2020, 11, 6367. [Google Scholar] [CrossRef] [PubMed]
- Babu, T.; Singh, T.; Gupta, D.; Hameed, S. Colon cancer prediction on histological images using deep learning features and Bayesian optimized SVM. J. Intell. Fuzzy Syst. 2021, 41, 5275–5286. [Google Scholar] [CrossRef]
- Goggi, J.L.; Hartimath, S.V.; Xuan, T.Y.; Khanapur, S.; Jieu, B.; Chin, H.X.; Ramasamy, B.; Cheng, P.; Rong, T.J.; Fong, Y.F.; et al. Granzyme B PET Imaging of Combined Chemotherapy and Immune Checkpoint Inhibitor Therapy in Colon Cancer. Mol. Imaging Biol. 2021, 23, 714–723. [Google Scholar] [CrossRef] [PubMed]
- Salvatore, L.; Imperatori, M.; Arnoldi, E.; Carnaghi, C.; Cordio, S.; Cosimelli, M.; Cremolini, C.; Maiello, E.; Martinelli, E.; Normanno, N.; et al. Management of patients with early-stage colon cancer: Guidelines of the Italian Medical Oncology Association. ESMO Open 2020, 5, e001001. [Google Scholar] [CrossRef] [PubMed]
- Hodolic, M.; Ambrosini, V.; Fanti, S. Potential use of radiolabelled neurotensin in PET imaging and therapy of patients with pancreatic cancer. Nucl. Med. Commun. 2020, 41, 411–415. [Google Scholar] [CrossRef] [PubMed]
- Godkhindi, A.M.; Gowda, R.M. Automated detection of polyps in CT colonography images using deep learning algorithms in colon cancer diagnosis. In Proceedings of the 2017 International Conference on Energy, Communication, Data Analytics and Soft Computing (ICECDS), Chennai, India, 1–2 August 2017; pp. 1722–1728. [Google Scholar]
- Mukai, K.; Ishida, Y.; Okajima, K.; Isozaki, H.; Morimoto, T.; Nishiyama, S. Usefulness of preoperative FDG-PET for detection of gastric cancer. Gastric Cancer 2006, 9, 192–196. [Google Scholar] [CrossRef] [PubMed] [Green Version]
- Moroz, M.A.; Kochetkov, T.; Cai, S.; Wu, J.; Shamis, M.; Nair, J.; De Stanchina, E.; Serganova, I.; Schwartz, G.K.; Banerjee, D.; et al. Imaging colon cancer response following treatment with AZD1152: A preclinical analysis of [18F] fluoro-2-deoxyglucose and fluorothymidine imaging. Clin. Cancer Res. 2011, 17, 1099–1110. [Google Scholar] [CrossRef] [PubMed] [Green Version]
- Kalkan, H.; Nap, M.; Duin, R.P.; Loog, M. Automated classification of local patches in colon histopathology. In Proceedings of the Proceedings of the 21st International Conference on Pattern Recognition (ICPR2012); Tsukuba, Japan, 11–15 November 2012, pp. 61–64.
- Greenspan, H.; Van Ginneken, B.; Summers, R.M. Guest editorial deep learning in medical imaging: Overview and future promise of an exciting new technique. IEEE Trans. Med. Imaging 2016, 35, 1153–1159. [Google Scholar] [CrossRef]
- Doi, K. Computer-aided diagnosis in medical imaging: Historical review, current status and future potential. Comput. Med. Imaging Graph. 2007, 31, 198–211. [Google Scholar] [CrossRef] [PubMed]
- Hamilton, P.W.; Bartels, P.H.; Thompson, D.; Anderson, N.H.; Montironi, R.; Sloan, J.M. Automated location of dysplastic fields in colorectal histology using image texture analysis. J. Pathol. J. Pathol. Soc. Great Br. Irel. 1997, 182, 68–75. [Google Scholar] [CrossRef]
- Jia, X.; Xing, X.; Yuan, Y.; Xing, L.; Meng, M.Q.H. Wireless capsule endoscopy: A new tool for cancer screening in the colon with deep-learning-based polyp recognition. Proc. IEEE 2019, 108, 178–197. [Google Scholar] [CrossRef]
- Hou, L.; Agarwal, A.; Samaras, D.; Kurc, T.M.; Gupta, R.R.; Saltz, J.H. Robust histopathology image analysis: To label or to synthesize? In Proceedings of the IEEE/CVF Conference on Computer Vision and Pattern Recognition, Long Beach, CA, USA, 15–20 June 2019; pp. 8533–8542. [Google Scholar]
- Cheng, A.S.; Leung, S.C.; Gao, D.; Burugu, S.; Anurag, M.; Ellis, M.J.; Nielsen, T.O. Mismatch repair protein loss in breast cancer: Clinicopathological associations in a large British Columbia cohort. Breast Cancer Res. Treat. 2020, 179, 3–10. [Google Scholar] [CrossRef] [Green Version]
- Kim, H.O.; Kim, J.S.; Kim, S.O.; Chae, S.Y.; Oh, S.J.; Seo, M.; Lee, S.H.; Oh, J.S.; Ryu, J.S.; Huh, J.r.; et al. Clinicopathological characteristics of primary central nervous system lymphoma with low 18F-fludeoxyglucose uptake on brain positron emission tomography. Medicine 2020, 99, e20140. [Google Scholar] [CrossRef]
- Janowczyk, A.; Madabhushi, A. Deep learning for digital pathology image analysis: A comprehensive tutorial with selected use cases. J. Pathol. Inform. 2016, 7, 9. [Google Scholar] [CrossRef] [PubMed]
- Burt, R.W. Strategies for colon cancer screening with considerations of cost and access to care. J. Natl. Compr. Cancer Netw. 2010, 8, 2–5. [Google Scholar] [CrossRef]
- Fakoor, R.; Ladhak, F.; Nazi, A.; Huber, M. Using deep learning to enhance cancer diagnosis and classification. In Proceedings of the International Conference on Machine Learning, New York, NY, USA, 15–20 July 2013; Volume 28. [Google Scholar]
- Awan, R.; Sirinukunwattana, K.; Epstein, D.; Jefferyes, S.; Qidwai, U.; Aftab, Z.; Mujeeb, I.; Snead, D.; Rajpoot, N. Glandular morphometrics for objective grading of colorectal adenocarcinoma histology images. Sci. Rep. 2017, 7, 1–12. [Google Scholar] [CrossRef] [Green Version]
- Gamper, J.; Koohbanani, N.A.; Benes, K.; Graham, S.; Jahanifar, M.; Khurram, S.A.; Azam, A.; Hewitt, K.; Rajpoot, N. Pannuke dataset extension, insights and baselines. arXiv 2020, arXiv:2003.10778. [Google Scholar]
- Sirinukunwattana, K.; Snead, D.R.; Rajpoot, N.M. A stochastic polygons model for glandular structures in colon histology images. IEEE Trans. Med. Imaging 2015, 34, 2366–2378. [Google Scholar] [CrossRef] [Green Version]
- Graham, S.; Vu, Q.D.; Raza, S.E.A.; Azam, A.; Tsang, Y.W.; Kwak, J.T.; Rajpoot, N. Hover-net: Simultaneous segmentation and classification of nuclei in multi-tissue histology images. Med. Image Anal. 2019, 58, 101563. [Google Scholar] [CrossRef] [PubMed] [Green Version]
- Jha, D.; Smedsrud, P.H.; Riegler, M.A.; Halvorsen, P.; de Lange, T.; Johansen, D.; Johansen, H.D. Kvasir-seg: A segmented polyp dataset. In Proceedings of the International Conference on Multimedia Modeling, Daejeon, Republic of Korea, 5–8 January 2020; pp. 451–462. [Google Scholar]
- Sirinukunwattana, K.; Raza, S.E.A.; Tsang, Y.W.; Snead, D.R.; Cree, I.A.; Rajpoot, N.M. Locality sensitive deep learning for detection and classification of nuclei in routine colon cancer histology images. IEEE Trans. Med. Imaging 2016, 35, 1196–1206. [Google Scholar] [CrossRef] [PubMed]
- Lewer, D.; Bourne, T.; George, A.; Abi-Aad, G.; Taylor, C.; George, J. Data Resource: The Kent Integrated Dataset (KID). Int. J. Popul. Data Sci. 2018, 3, 427. [Google Scholar] [CrossRef] [Green Version]
- Mesejo, P.; Pizarro, D.; Abergel, A.; Rouquette, O.; Beorchia, S.; Poincloux, L.; Bartoli, A. Computer-aided classification of gastrointestinal lesions in regular colonoscopy. IEEE Trans. Med. Imaging 2016, 35, 2051–2063. [Google Scholar] [CrossRef] [PubMed] [Green Version]
- Shaban, M.; Awan, R.; Fraz, M.M.; Azam, A.; Tsang, Y.W.; Snead, D.; Rajpoot, N.M. Context-aware convolutional neural network for grading of colorectal cancer histology images. IEEE Trans. Med. Imaging 2020, 39, 2395–2405. [Google Scholar] [CrossRef] [PubMed] [Green Version]
- Pogorelov, K.; Randel, K.R.; Griwodz, C.; Eskeland, S.L.; de Lange, T.; Johansen, D.; Spampinato, C.; Dang-Nguyen, D.T.; Lux, M.; Schmidt, P.T.; et al. Kvasir: A multi-class image dataset for computer aided gastrointestinal disease detection. In Proceedings of the eighth ACM on Multimedia Systems Conference, Taipei, Taiwan, 20–23 June 2017; pp. 164–169. [Google Scholar]
- Leenhardt, R.; Li, C.; Le Mouel, J.P.; Rahmi, G.; Saurin, J.C.; Cholet, F.; Boureille, A.; Amiot, X.; Delvaux, M.; Duburque, C.; et al. CAD-CAP: A 25,000-image database serving the development of artificial intelligence for capsule endoscopy. Endosc. Int. Open 2020, 8, E415–E420. [Google Scholar] [CrossRef] [PubMed] [Green Version]
- Bernal, J.; Tajkbaksh, N.; Sanchez, F.J.; Matuszewski, B.J.; Chen, H.; Yu, L.; Angermann, Q.; Romain, O.; Rustad, B.; Balasingham, I.; et al. Comparative validation of polyp detection methods in video colonoscopy: Results from the MICCAI 2015 endoscopic vision challenge. IEEE Trans. Med. Imaging 2017, 36, 1231–1249. [Google Scholar] [CrossRef] [PubMed]
- Vázquez, D.; Bernal, J.; Sánchez, F.J.; Fernández-Esparrach, G.; López, A.M.; Romero, A.; Drozdzal, M.; Courville, A. A benchmark for endoluminal scene segmentation of colonoscopy images. J. Healthc. Eng. 2017, 2017, 4037190. [Google Scholar] [CrossRef] [Green Version]
- Bernal, J.; Sánchez, F.J.; Fernández-Esparrach, G.; Gil, D.; Rodríguez, C.; Vilariño, F. WM-DOVA maps for accurate polyp highlighting in colonoscopy: Validation vs. saliency maps from physicians. Comput. Med. Imaging Graph. 2015, 43, 99–111. [Google Scholar] [CrossRef] [PubMed]
- Javed, S.; Mahmood, A.; Fraz, M.M.; Koohbanani, N.A.; Benes, K.; Tsang, Y.W.; Hewitt, K.; Epstein, D.; Snead, D.; Rajpoot, N. Cellular community detection for tissue phenotyping in colorectal cancer histology images. Med. Image Anal. 2020, 63, 101696. [Google Scholar] [CrossRef]
- Kather, J.N.; Krisam, J.; Charoentong, P.; Luedde, T.; Herpel, E.; Weis, C.A.; Gaiser, T.; Marx, A.; Valous, N.A.; Ferber, D.; et al. Predicting survival from colorectal cancer histology slides using deep learning: A retrospective multicenter study. PLoS Med. 2019, 16, e1002730. [Google Scholar] [CrossRef] [PubMed]
- Kainz, P.; Pfeiffer, M.; Urschler, M. Segmentation and classification of colon glands with deep convolutional neural networks and total variation regularization. PeerJ 2017, 5, e3874. [Google Scholar] [CrossRef] [PubMed]
- Puig, D. Assessing the Impact of a Preprocessing Stage on Deep Learning Architectures for Breast Tumor Multi-class Classification with Histopathological Images. In Proceedings of the High Performance Computing: Sixth Latin American Conference, CARLA 2019, Turrialba, Costa Rica, 25–27 September 2019; Revised Selected Papers. Springer Nature: Cham, Switzerland, 2020; Volume 1087, p. 262. [Google Scholar]
- Jang, H.J.; Lee, A.; Kang, J.; Song, I.H.; Lee, S.H. Prediction of clinically actionable genetic alterations from colorectal cancer histopathology images using deep learning. World J. Gastroenterol. 2020, 26, 6207. [Google Scholar] [CrossRef]
- Kaminski, M.F.; Regula, J.; Kraszewska, E.; Polkowski, M.; Wojciechowska, U.; Didkowska, J.; Zwierko, M.; Rupinski, M.; Nowacki, M.P.; Butruk, E. Quality indicators for colonoscopy and the risk of interval cancer. N. Engl. J. Med. 2010, 362, 1795–1803. [Google Scholar] [CrossRef] [Green Version]
- Khatun, R.; Chatterjee, S. Machine learning approach for segmenting glands in colon histology images using local intensity and texture features. In Proceedings of the 2018 IEEE eighth International Advance Computing Conference (IACC), Greater Noida, India, 14–15 December 2018; pp. 314–320. [Google Scholar]
- Constantinescu, A.F.; Ionescu, M.; Rogoveanu, I.; Ciurea, M.E.; Streba, C.T.; Iovanescu, V.F.; Artene, S.A.; Vere, C.C. Analysis of wireless capsule endoscopy images using local binary patterns. Appl. Med. Inform. 2015, 36, 31–42. [Google Scholar]
- Alwan, M.G.; AL-Brazinji, S.M.; Mosslah, A.A. Automatic panoramic medical image stitching improvement based on feature-based approach. Period. Eng. Nat. Sci. 2022, 10, 155–163. [Google Scholar] [CrossRef]
- Wargnier-Dauchelle, V.; Chane, C.S.; Histace, A. Saliency maps of video-colonoscopy images for the analysis of their content and the prevention of colorectal cancer risks. In Proceedings of the Biosignals 2020, Valetta, Malta, 6–7 May 2020. [Google Scholar]
- Kieffer, B.; Babaie, M.; Kalra, S.; Tizhoosh, H.R. Convolutional neural networks for histopathology image classification: Training vs. using pre-trained networks. In Proceedings of the 2017 Seventh International Conference on Image Processing Theory, Tools and Applications (IPTA), Montreal, QC, Canada, 28 November–1 December 2017; pp. 1–6. [Google Scholar]
- Niazi, M.K.K.; Parwani, A.V.; Gurcan, M.N. Digital pathology and artificial intelligence. Lancet Oncol. 2019, 20, e253–e261. [Google Scholar] [CrossRef]
- Rasti, P.; Wolf, C.; Dorez, H.; Sablong, R.; Moussata, D.; Samiei, S.; Rousseau, D. Machine Learning-Based Classification of the Health State of Mice Colon in Cancer Study from Confocal Laser Endomicroscopy. Sci. Rep. 2019, 9, 20010. [Google Scholar] [CrossRef] [Green Version]
- Na, K.S. Prediction of future cognitive impairment among the community elderly: A machine-learning based approach. Sci. Rep. 2019, 9, 3335. [Google Scholar] [CrossRef] [Green Version]
- Singh, S.P.; Janjuha, S.; Chaudhuri, S.; Reinhardt, S.; Kränkel, A.; Dietz, S.; Eugster, A.; Bilgin, H.; Korkmaz, S.; Zararsız, G.; et al. Machine learning based classification of cells into chronological stages using single-cell transcriptomics. Sci. Rep. 2018, 8, 17156. [Google Scholar] [CrossRef] [PubMed]
- Min, X.; Yu, B.; Wang, F. Predictive modeling of the hospital readmission risk from patients’ claims data using machine learning: A case study on COPD. Sci. Rep. 2019, 9, 2362. [Google Scholar] [CrossRef] [PubMed] [Green Version]
- Rathore, S.; Iftikhar, M.A.; Chaddad, A.; Niazi, T.; Karasic, T.; Bilello, M. Segmentation and grade prediction of colon cancer digital pathology images across multiple institutions. Cancers 2019, 11, 1700. [Google Scholar] [CrossRef] [Green Version]
- Dragicevic, A.; Matija, L.; Krivokapic, Z.; Dimitrijevic, I.; Baros, M.; Koruga, D. Classification of healthy and cancer states of colon epithelial tissues using opto-magnetic imaging spectroscopy. J. Med. Biol. Eng. 2019, 39, 367–380. [Google Scholar] [CrossRef]
- Shanmuga Sundaram, P.; Santhiyakumari, N. An enhancement of computer aided approach for colon cancer detection in WCE images using ROI based color histogram and SVM2. J. Med. Syst. 2019, 43, 29. [Google Scholar] [CrossRef] [PubMed]
- Babu, T.; Singh, T.; Gupta, D. Colon cancer prediction using 2DR e CA segmentation and hybrid features on histopathology images. IET Image Process. 2020, 14, 4144–4157. [Google Scholar] [CrossRef]
- Fahami, M.A.; Roshanzamir, M.; Izadi, N.H.; Keyvani, V.; Alizadehsani, R. Detection of effective genes in colon cancer: A machine learning approach. Inform. Med. Unlocked 2021, 24, 100605. [Google Scholar] [CrossRef]
- Jansen-Winkeln, B.; Barberio, M.; Chalopin, C.; Schierle, K.; Diana, M.; Köhler, H.; Gockel, I.; Maktabi, M. Feedforward artificial neural network-based colorectal cancer detection using hyperspectral imaging: A step towards automatic optical biopsy. Cancers 2021, 13, 967. [Google Scholar] [CrossRef] [PubMed]
- Talukder, M.A.; Islam, M.M.; Uddin, M.A.; Akhter, A.; Hasan, K.F.; Moni, M.A. Machine learning-based lung and colon cancer detection using deep feature extraction and ensemble learning. Expert Syst. Appl. 2022, 205, 117695. [Google Scholar] [CrossRef]
- Hage Chehade, A.; Abdallah, N.; Marion, J.M.; Oueidat, M.; Chauvet, P. Lung and colon cancer classification using medical imaging: A feature engineering approach. Phys. Eng. Sci. Med. 2022, 45, 729–746. [Google Scholar] [CrossRef]
- Alqudah, A.M.; Alqudah, A. Improving machine learning recognition of colorectal cancer using 3D GLCM applied to different color spaces. Multimed. Tools Appl. 2022, 81, 10839–10860. [Google Scholar] [CrossRef]
- Deng, J.; Dong, W.; Socher, R.; Li, L.J.; Li, K.; Fei-Fei, L. Imagenet: A large-scale hierarchical image database. In Proceedings of the 2009 IEEE Conference on Computer Vision and Pattern Recognition, Miami, FL, USA, 20–21 June 2009; pp. 248–255. [Google Scholar]
- Sutskever, I.; Vinyals, O.; Le, Q.V. Sequence to sequence learning with neural networks. Adv. Neural Inf. Process. Syst. 2014, 27, 1–9. [Google Scholar]
- Sarraf, S.; Tofighi, G. Deep learning-based pipeline to recognize Alzheimer’s disease using fMRI data. In Proceedings of the 2016 Future Technologies Conference (FTC), San Francisco, CA, USA, 6–7 December 2016; pp. 816–820. [Google Scholar]
- Shan, H.; Padole, A.; Homayounieh, F.; Kruger, U.; Khera, R.D.; Nitiwarangkul, C.; Kalra, M.K.; Wang, G. Competitive performance of a modularized deep neural network compared to commercial algorithms for low-dose CT image reconstruction. Nat. Mach. Intell. 2019, 1, 269–276. [Google Scholar] [CrossRef] [PubMed] [Green Version]
- Liu, Y.; Gadepalli, K.; Norouzi, M.; Dahl, G.E.; Kohlberger, T.; Boyko, A.; Venugopalan, S.; Timofeev, A.; Nelson, P.Q.; Corrado, G.S.; et al. Detecting cancer metastases on gigapixel pathology images. arXiv 2017, arXiv:1703.02442. [Google Scholar]
- Min, J.K.; Kwak, M.S.; Cha, J.M. Overview of deep learning in gastrointestinal endoscopy. Gut Liver 2019, 13, 388. [Google Scholar] [CrossRef] [PubMed] [Green Version]
- Shapcott, M.; Hewitt, K.J.; Rajpoot, N. Deep learning with sampling in colon cancer histology. Front. Bioeng. Biotechnol. 2019, 7, 52. [Google Scholar] [CrossRef]
- Esgiar, A.N.; Naguib, R.N.; Sharif, B.S.; Bennett, M.K.; Murray, A. Microscopic image analysis for quantitative measurement and feature identification of normal and cancerous colonic mucosa. IEEE Trans. Inf. Technol. Biomed. 1998, 2, 197–203. [Google Scholar] [CrossRef]
- de Almeida Thomaz, V.; Sierra-Franco, C.A.; Raposo, A.B. Training data enhancements for robust polyp segmentation in colonoscopy images. In Proceedings of the 2019 IEEE 32nd International Symposium on Computer-Based Medical Systems (CBMS), Córdoba, Spain, 5–7 June 2019; pp. 192–197. [Google Scholar]
- Kang, J.; Gwak, J. Ensemble of instance segmentation models for polyp segmentation in colonoscopy images. IEEE Access 2019, 7, 26440–26447. [Google Scholar] [CrossRef]
- Sornapudi, S.; Meng, F.; Yi, S. Region-based automated localization of colonoscopy and wireless capsule endoscopy polyps. Appl. Sci. 2019, 9, 2404. [Google Scholar] [CrossRef] [Green Version]
- Zhang, X.; Chen, F.; Yu, T.; An, J.; Huang, Z.; Liu, J.; Hu, W.; Wang, L.; Duan, H.; Si, J. Real-time gastric polyp detection using convolutional neural networks. PLoS ONE 2019, 14, e0214133. [Google Scholar] [CrossRef] [Green Version]
- Wittenberg, T.; Zobel, P.; Rathke, M.; Mühldorfer, S. Computer aided detection of polyps in whitelight-colonoscopy images using deep neural networks. Curr. Dir. Biomed. Eng. 2019, 5, 231–234. [Google Scholar] [CrossRef]
- Ma, Y.; Li, Y.; Yao, J.; Chen, B.; Deng, J.; Yang, X. Polyp location in colonoscopy based on deep learning. In Proceedings of the 2019 eighth international symposium on next generation electronics (ISNE), Zhengzhou, China, 9–10 October 2019; pp. 1–3. [Google Scholar]
- Blanes-Vidal, V.; Baatrup, G.; Nadimi, E.S. Addressing priority challenges in the detection and assessment of colorectal polyps from capsule endoscopy and colonoscopy in colorectal cancer screening using machine learning. Acta Oncol. 2019, 58, S29–S36. [Google Scholar] [CrossRef]
- Wang, P.; Berzin, T.M.; Brown, J.R.G.; Bharadwaj, S.; Becq, A.; Xiao, X.; Liu, P.; Li, L.; Song, Y.; Zhang, D.; et al. Real-time automatic detection system increases colonoscopic polyp and adenoma detection rates: A prospective randomised controlled study. Gut 2019, 68, 1813–1819. [Google Scholar] [CrossRef] [PubMed] [Green Version]
- Yuan, Y.; Qin, W.; Ibragimov, B.; Zhang, G.; Han, B.; Meng, M.Q.H.; Xing, L. Densely connected neural network with unbalanced discriminant and category sensitive constraints for polyp recognition. IEEE Trans. Autom. Sci. Eng. 2019, 17, 574–583. [Google Scholar] [CrossRef]
- Jia, X.; Mai, X.; Cui, Y.; Yuan, Y.; Xing, X.; Seo, H.; Xing, L.; Meng, M.Q.H. Automatic polyp recognition in colonoscopy images using deep learning and two-stage pyramidal feature prediction. IEEE Trans. Autom. Sci. Eng. 2020, 17, 1570–1584. [Google Scholar] [CrossRef]
- Tripathi, S.; Singh, S.K. Ensembling handcrafted features with deep features: An analytical study for classification of routine colon cancer histopathological nuclei images. Multimed. Tools Appl. 2020, 79, 34931–34954. [Google Scholar] [CrossRef]
- Nadimi, E.S.; Buijs, M.M.; Herp, J.; Kroijer, R.; Kobaek-Larsen, M.; Nielsen, E.; Pedersen, C.D.; Blanes-Vidal, V.; Baatrup, G. Application of deep learning for autonomous detection and localization of colorectal polyps in wireless colon capsule endoscopy. Comput. Electr. Eng. 2020, 81, 106531. [Google Scholar] [CrossRef]
- Mostafiz, R.; Hasan, M.; Hossain, I.; Rahman, M.M. An intelligent system for gastrointestinal polyp detection in endoscopic video using fusion of bidimensional empirical mode decomposition and convolutional neural network features. Int. J. Imaging Syst. Technol. 2020, 30, 224–233. [Google Scholar] [CrossRef]
- Ozawa, T.; Ishihara, S.; Fujishiro, M.; Kumagai, Y.; Shichijo, S.; Tada, T. Automated endoscopic detection and classification of colorectal polyps using convolutional neural networks. Ther. Adv. Gastroenterol. 2020, 13, 1756284820910659. [Google Scholar] [CrossRef] [PubMed] [Green Version]
- Hamida, A.B.; Devanne, M.; Weber, J.; Truntzer, C.; Derangère, V.; Ghiringhelli, F.; Forestier, G.; Wemmert, C. Deep learning for colon cancer histopathological images analysis. Comput. Biol. Med. 2021, 136, 104730. [Google Scholar] [CrossRef] [PubMed]
- Liew, W.S.; Tang, T.B.; Lin, C.H.; Lu, C.K. Automatic colonic polyp detection using integration of modified deep residual convolutional neural network and ensemble learning approaches. Comput. Methods Programs Biomed. 2021, 206, 106114. [Google Scholar] [CrossRef]
- Sikder, J.; Das, U.K.; Chakma, R.J. Supervised learning-based cancer detection. Int. J. Adv. Comput. Sci. Appl. 2021, 12, 863–869. [Google Scholar] [CrossRef]
- Wang, W.; Tian, J.; Zhang, C.; Luo, Y.; Wang, X.; Li, J. An improved deep learning approach and its applications on colonic polyp images detection. BMC Med. Imaging 2020, 20, 83. [Google Scholar] [CrossRef]
- Tellez, D.; Litjens, G.; Bándi, P.; Bulten, W.; Bokhorst, J.M.; Ciompi, F.; van der Laak, J. Quantifying the effects of data augmentation and stain color normalization in convolutional neural networks for computational pathology. Med. Image Anal. 2019, 58, 101544. [Google Scholar] [CrossRef] [Green Version]
- Tjoa, M.P.; Krishnan, S.M. Feature extraction for the analysis of colon status from the endoscopic images. Biomed. Eng. Online 2003, 2, 9. [Google Scholar] [CrossRef] [Green Version]
- van Roon, A.H.; van Dam, L.; Spaander, M.C.; Lansdorp-Vogelaar, I.; Dekker, E.; van Leerdam, M.E. Different modalities for colorectal cancer screening: Experiences in The Netherlands so far. Color. Cancer 2016, 5, 9–19. [Google Scholar] [CrossRef]
- Griffeth, L.K. Use of PET/CT scanning in cancer patients: Technical and practical considerations. Proc. (Bayl. Univ. Med. Cent.) 2005, 18, 321–330. [Google Scholar] [CrossRef]
- Winawer, S.J.; Zauber, A.G.; Ho, M.N.; O’brien, M.J.; Gottlieb, L.S.; Sternberg, S.S.; Waye, J.D.; Schapiro, M.; Bond, J.H.; Panish, J.F.; et al. Prevention of colorectal cancer by colonoscopic polypectomy. N. Engl. J. Med. 1993, 329, 1977–1981. [Google Scholar] [CrossRef] [PubMed]
- Xu, Y.; Jia, Z.; Wang, L.B.; Ai, Y.; Zhang, F.; Lai, M.; Eric, I.; Chang, C. Large scale tissue histopathology image classification, segmentation, and visualization via deep convolutional activation features. BMC Bioinform. 2017, 18, 281. [Google Scholar] [CrossRef] [PubMed] [Green Version]
- Yao, Y.; Gou, S.; Tian, R.; Zhang, X.; He, S. Automated Classification and Segmentation in Colorectal Images Based on Self-Paced Transfer Network. BioMed Res. Int. 2021, 2021, 6683931. [Google Scholar] [CrossRef] [PubMed]
- Zauber, A.G.; van Ballegooijen, M.; Petitti, D.; Lansdorp-Vogelaar, I. United States Preventive Services Task Force recommendations: Age to end screening misunderstood. Dis. Colon Rectum 2010, 53, 1453. [Google Scholar] [CrossRef] [PubMed]
- Zhang, X.; Liu, W.; Dundar, M.; Badve, S.; Zhang, S. Towards large-scale histopathological image analysis: Hashing-based image retrieval. IEEE Trans. Med. Imaging 2014, 34, 496–506. [Google Scholar] [CrossRef]
- Xu, Y.; Mo, T.; Feng, Q.; Zhong, P.; Lai, M.; Eric, I.; Chang, C. Deep learning of feature representation with multiple instance learning for medical image analysis. In Proceedings of the 2014 IEEE International Conference on Acoustics, Speech and Signal Processing (ICASSP), Florence, Italy, 4–9 May 2014; pp. 1626–1630. [Google Scholar]
Figure 1.
The different stages of colon cancer.

Figure 2.
The structure of the survey.

Figure 3.
Frequency-based analysis of technique types in percentages.

Figure 4.
Frequency-based analysis of sub-technique types in percentages.

Figure 5.
Inclusion and exclusion criteria.

Figure 6.
Different images of CT colonoscopy: (a) Axial. (b) Sagittal images. (c) Image of virtual colonoscopy. (d) Image colonoscopy showing the polyp with true-positive findings.
Figure 6.
Different images of CT colonoscopy: (a) Axial. (b) Sagittal images. (c) Image of virtual colonoscopy. (d) Image colonoscopy showing the polyp with true-positive findings.

Figure 7.
HI analysis pipeline.

Figure 8.
Original data and associated manual annotation from ETIS-Larib polyp DB. (a) the original image and (b) the annotation.
Figure 8.
Original data and associated manual annotation from ETIS-Larib polyp DB. (a) the original image and (b) the annotation.

Figure 9.
(a–c) The original images. (d–f) The corresponding ground truth.

Figure 10.
The main stages of conventional ML methods for HI analysis.

Figure 11.
The segmentation and classification process using deep learning.

Table 1.
Comparison between symptoms of tumor spread across various organs at the fourth stage.
| No. | Spread to Various Organs | Symptoms |
|---|---|---|
| 1 | Liver |
|
| 2 | Lung |
|
| 3 | Bone |
|
| 4 | Lymph nodes |
|
Table 2.
A list of abbreviations with the corresponding definitions used in this survey.
| Abbreviation | Definition | Abbreviation | Definition |
|---|---|---|---|
| ML | Machine Learning | DL | Deep Learning |
| ACS | American Cancer Society | MIA | Medical Image Analysis |
| AI | Artificial Intelligence | DIP | Digital Image Processing |
| HC | Hand Crafted | CT | Computed Tomography |
| ERUS | Endorectal Ultrasound | CTC | Computed Tomography Colonoscopy |
| PET | Positron Emission Tomography | CRC | Colorectal Cancer |
| CAD | Computer-Aided Diagnosis | CBIR | Content Based Image Retrieval |
| PACs | Polycyclic Aromatic Compounds | WSIs | Whole-Slide Images |
| CNN | Convolutional Neural Network | MMR | Mismatch Repair |
| PCNSL | Primary Central Nervous System Lymphomas | FDG | Fluoro-2-Deoxy-d-Glucose |
| GlaS | Gland Segmentation | KID | Kent Integrated Dataset |
| NBI | Narrow-Band Imaging | TP | True Positive |
| FP | False Positive | TN | True Negative |
| FN | False Negative | FPR | False positive rate |
| PPV | Positive Predictive Value | ROC | Receiver Operating Characteristic |
| H&E | Hematoxylin Eosin | LBP | Local Binary Patterns |
| SIFT | Scale Invariant Feature Transform | HOG | Histogram Of Gradient |
| GBM | Glioblastoma | SVM | Support Vector Machine |
| OMIS | Opto-magnetic Imaging Spectro-scop | WCE | Wireless Capsule Endo-scop |
| ROI | Region of Interest | SGLDM | Spatial Gray Level Dependence Matrices |
| 2DReCA | Two-dimensional entropy with a Cultural Algorithm | KNN | K-Nearest Neighbor |
| HSI | Hyper-Spectral Imaging | LDA | Linear Discriminant Analysis |
| MLP | Multi-Layer Perceptron | RF | Random Forest |
| GLCM | Gray Level Co-occurrence Matrix | ANN | Artificial Neural Network |
| QDA | Quadratic Discriminant Analysis | CDT | Decision Tree |
| NLP | Natural Language Processing | TCGA | The Cancer Genome Atlas |
| R-CNN | Region-based Convolutional Neural Network | SSD | Single Shot Multi-Box Detector |
| RNN | Recurrent Neural Network | PCA | Principal Component Analysis |
Table 3.
Academic databases.
| No. | Academic Journals | Link (Accessed on 1 November 2022) |
|---|---|---|
| 1 | MDPI | https://www.mdpi.com/ |
| 2 | IEEE Explore | https://ieeexplore.ieee.org/Xplore/home.jsp |
| 3 | HINDAWI | https://www.hindawi.com/ |
| 4 | ELSEVIER | https://www.elsevier.com/en-xm |
| 5 | SPRINGER | https://jast-journal.springeropen.com/ |
| 6 | NATURE | https://www.nature.com/ |
| 7 | THE SCIENCE AND INFORMATION | https://thesai.org/ |
| 8 | FRONTIERS | https://www.frontiersin.org/ |
Table 6.
Summary of ML-based studies for colorectal cancer diagnosis.
| Author (Year) | Imaging Modality | Pre-Processing | Feature Extraction | Classification | Dataset | Results |
|---|---|---|---|---|---|---|
| Niazi et al. [81] (2019) | Microscopy Images | Stain Normalization, Contrast enhancement using Limited Adaptive Histogram Equalization | K-means, clustering | MLP, SVM, KNNs, Kernel Discriminant model | CRCHisto-Phenotypes | Accuracy: 99.8% |
| Rasti et al. [82] (2019) | Endomicroscopy Images | mean, standard deviation, variance, and the skewness of the raw pixel values | clustering | SVM | ImageNet/ILSVRC | Accuracy: 99.93% |
| Na et al. [83,84,85] (2019) | Neuro-imaging | SMOTE technique | GBM | Decision tree classifier | KLoSA | Sensitivity: 96.7% Specificity: 0.825 AUC: 92.1% |
| Rathore et al. [86] (2019) | Colon tissue histology images | Segmentation using | Qualification of tissue morphology on the basis of image, local, and gland features | Detection: RBF kernel of SVM Classification: using majority voting based on the predictions of linear, RBF, and sigmoid kernel of SVM. | -GlaS, -RMC | For Detection (Train GlaS − Test RMC = 93.7%, Train RMC − Test GlaS = 94.5%), For Classification: (Train GlaS −Test RMC = 95%, Train RMC − Test GlaS = 95%) |
| Dragicevic et al. [87] (2019) | Opto-magnetic Imaging Spectroscopy (OMIS) | Spectral image processing | N/A | Detection: Multilayer Perceptron Neural Network and Naïve Bayes | The First Surgical Clinic, Clinical Centre of Belgrade, Serbia. | Accuracy of 92.59% using Multilayer Perceptron Neural Network Accuracy of 89.87% using Naïve Bayes |
| Sundaram et al. [88] (2019) | Wireless Capsule Endoscopy (WCE) | Weiner filtering, ROI-based color histogram | Segmentation: K-means clustering Feature Extraction: Spatial gray level dependence matrices (SGLDM) | Detection: SVM Classification: SVM | N/A | Sensitivity 96% Specificity 95.4% Accuracy 95.7% |
| Babu et al. [89] (2020) | Colon biopsy images | Stain Normalization. Contrast enhancement using Limited Adaptive Histogram Equalization. | Segmentation: 2DReCA entropy-based thresholding Feature Extraction: Shape and texture descriptors. | A random forest classifier | GlaS. | Accuracy of: dataset A 98.50% dataset B 96.48% dataset C 95% dataset D 96% |
| Fahami et al. [90] (2021) | HIs | Normalization, Dimension reduction | Clustering | KNNs, Decision Tree | HTSeq-FPKM-UQ | Accuracy: 97.49 ± 2.92% Percision: 100.0 ± 90.00% Recall: 95.00 ± 5.83% |
| Jansen-Winkeln et al. [91] (2021) | Hyper-spectral imaging (HSI) | Image smoothing using Savitzky–Golay filter normalization, balancing using down-sampling | N/A | Detection: Multilayer Perceptron Neural Network, SVM, and RF. | Paper-specific dataset | Sensitivity of 86% Specificity of 95% With Multilayer Perceptron Neural Network |
| Talukder et al. [92] (2022) | HIs. | Image Resizing Feature scaling | Feature Extraction: Transfer learning, such as VGG16, VGG19, DenseNet169, DenseNet201 | RF, SVM, LR, MLP, XGB, and LGB | LC25000 | Accuracy of colon: 99.05%, lung: 100%, colon and lung: 99.30% |
| Chehade et al. [93] (2022) | HIs. | Unsharp masking, Stain normalization | Feature Extraction: First order statistics GLCM, Hu invariant moments Feature Selection: Recursive feature elimination (RFE) | SVM RF, XGBoost LightGBM, LDA, MLP | LC25000 | F1-score of 98.8%, Accuracy of 99% |
| Alqudah et al. [94] (2022) | HIs. | Represent input images in three different color spaces: RGB, HSV, and L*A*B* color spaces | Feature Extraction: 3D GLCM of RGB, HSV, and L*A*B | SVM, ANN, KNN, QDA, and CDT. | Multi-class colorectal histology images | Accuracy and sensitivity using RGB color space:QDA: 97.32, 97.30KNN: 92.10, 91.71SVM: 94.68, 94.62ANN: 92.58, 92.40CDT: 91.92, 91.75 |
Table 7.
General strengths and limitations of ML studies.
| Author (Year) | Strengths | Limitations |
|---|---|---|
| Rasti et al. [82] (2019) |
|
|
| Rathore et al. [86] (2019) |
|
|
| Sundaram et al. [88] (2019) |
|
|
| Babu et al. [89] (2020) |
|
|
| Fahami et al. [90] (2021) |
|
|
| Jansen-Winkeln et al. [91] (2021) |
|
|
| Talukder et al. [92] (2022) |
|
|
| Chehade et al. [93] (2022) |
|
|
| Alqudah et al. [94] (2022) |
|
|
Publisher’s Note: MDPI stays neutral with regard to jurisdictional claims in published maps and institutional affiliations. |
© 2022 by the authors. Licensee MDPI, Basel, Switzerland. This article is an open access article distributed under the terms and conditions of the Creative Commons Attribution (CC BY) license (https://creativecommons.org/licenses/by/4.0/).
Share and Cite
MDPI and ACS Style
Tharwat, M.; Sakr, N.A.; El-Sappagh, S.; Soliman, H.; Kwak, K.-S.; Elmogy, M. Colon Cancer Diagnosis Based on Machine Learning and Deep Learning: Modalities and Analysis Techniques. Sensors 2022, 22, 9250. https://doi.org/10.3390/s22239250
AMA Style
Tharwat M, Sakr NA, El-Sappagh S, Soliman H, Kwak K-S, Elmogy M. Colon Cancer Diagnosis Based on Machine Learning and Deep Learning: Modalities and Analysis Techniques. Sensors. 2022; 22(23):9250. https://doi.org/10.3390/s22239250
Chicago/Turabian StyleTharwat, Mai, Nehal A. Sakr, Shaker El-Sappagh, Hassan Soliman, Kyung-Sup Kwak, and Mohammed Elmogy. 2022. "Colon Cancer Diagnosis Based on Machine Learning and Deep Learning: Modalities and Analysis Techniques" Sensors 22, no. 23: 9250. https://doi.org/10.3390/s22239250
Note that from the first issue of 2016, this journal uses article numbers instead of page numbers. See further details here.