
Automated Non-Contact Respiratory Rate Monitoring of Neonates Based on Synchronous Evaluation of a 3D Time-of-Flight Camera and a Microwave Interferometric Radar Sensor

 , ,
, ,
Abstract
:1. Introduction
1.1. Current Monitoring on the NICU
1.2. State of the Art
1.2.1. 2D Imaging Methods
1.2.2. Optical Depth Measurements
1.2.3. Radar
1.2.4. Laser Doppler Vibrometer
1.2.5. Combination of Time-of-Flight and Radar
1.2.6. Neonatal Simulation System
2. Materials and Methods
2.1. Concept and Theoretical Approach
2.1.1. 3D Time-of-Flight Camera
2.1.2. Microwave Interferometric Radar Sensor
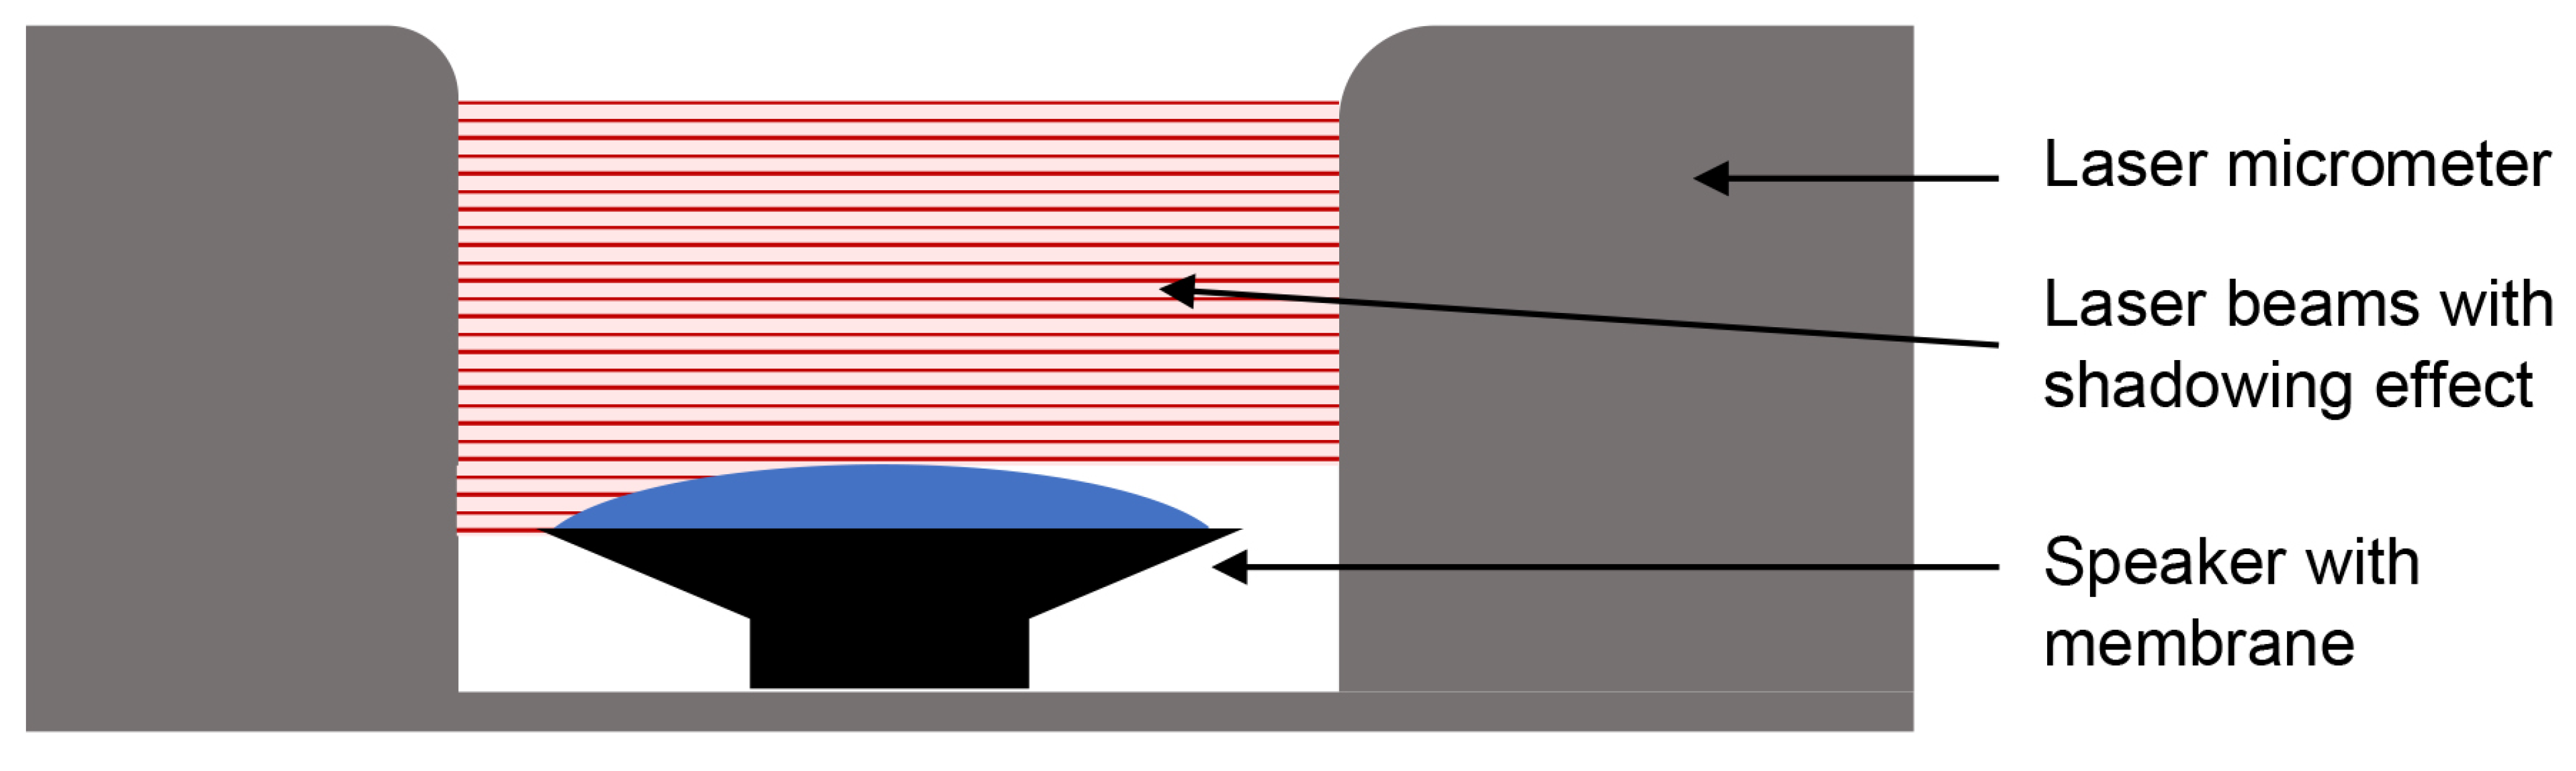
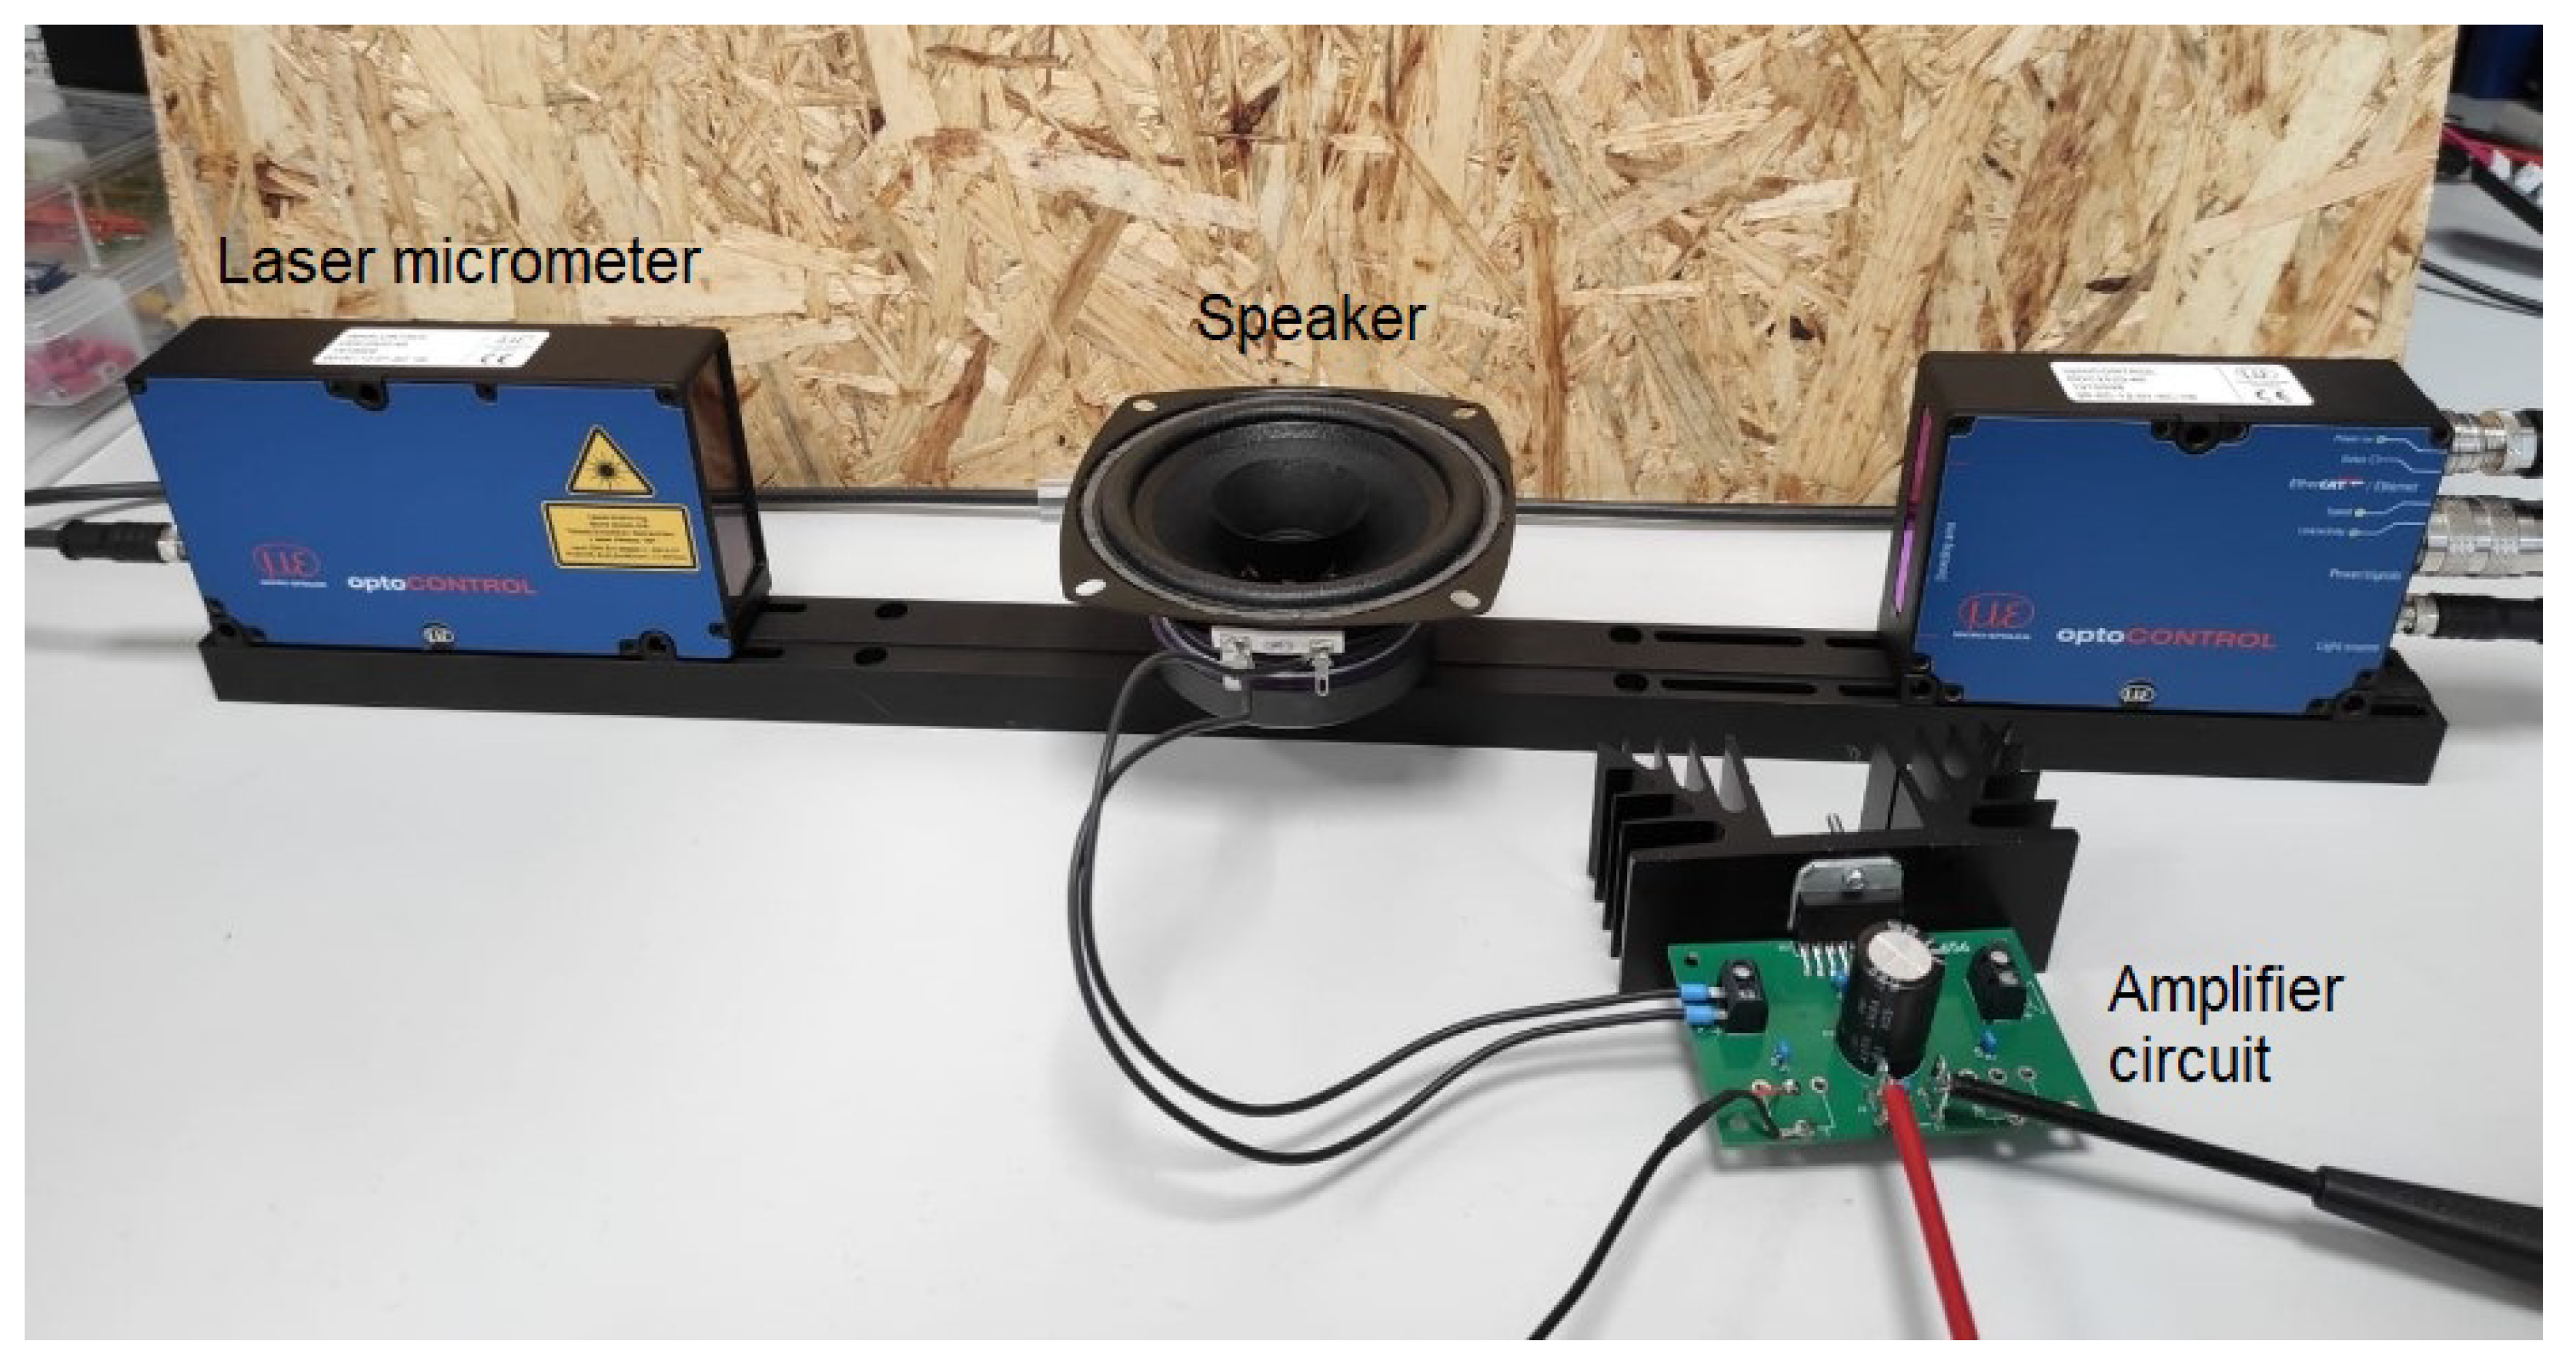
2.1.3. Neonatal Simulator
- Size of preterm neonate: thorax area with a diameter of 70–100 mm
- Mean stroke of mm for the respiration and a mean stroke of mm for the heartbeat
- Frequencies between 0.083 and Hz (5–250 BPM)
- Variable stroke size
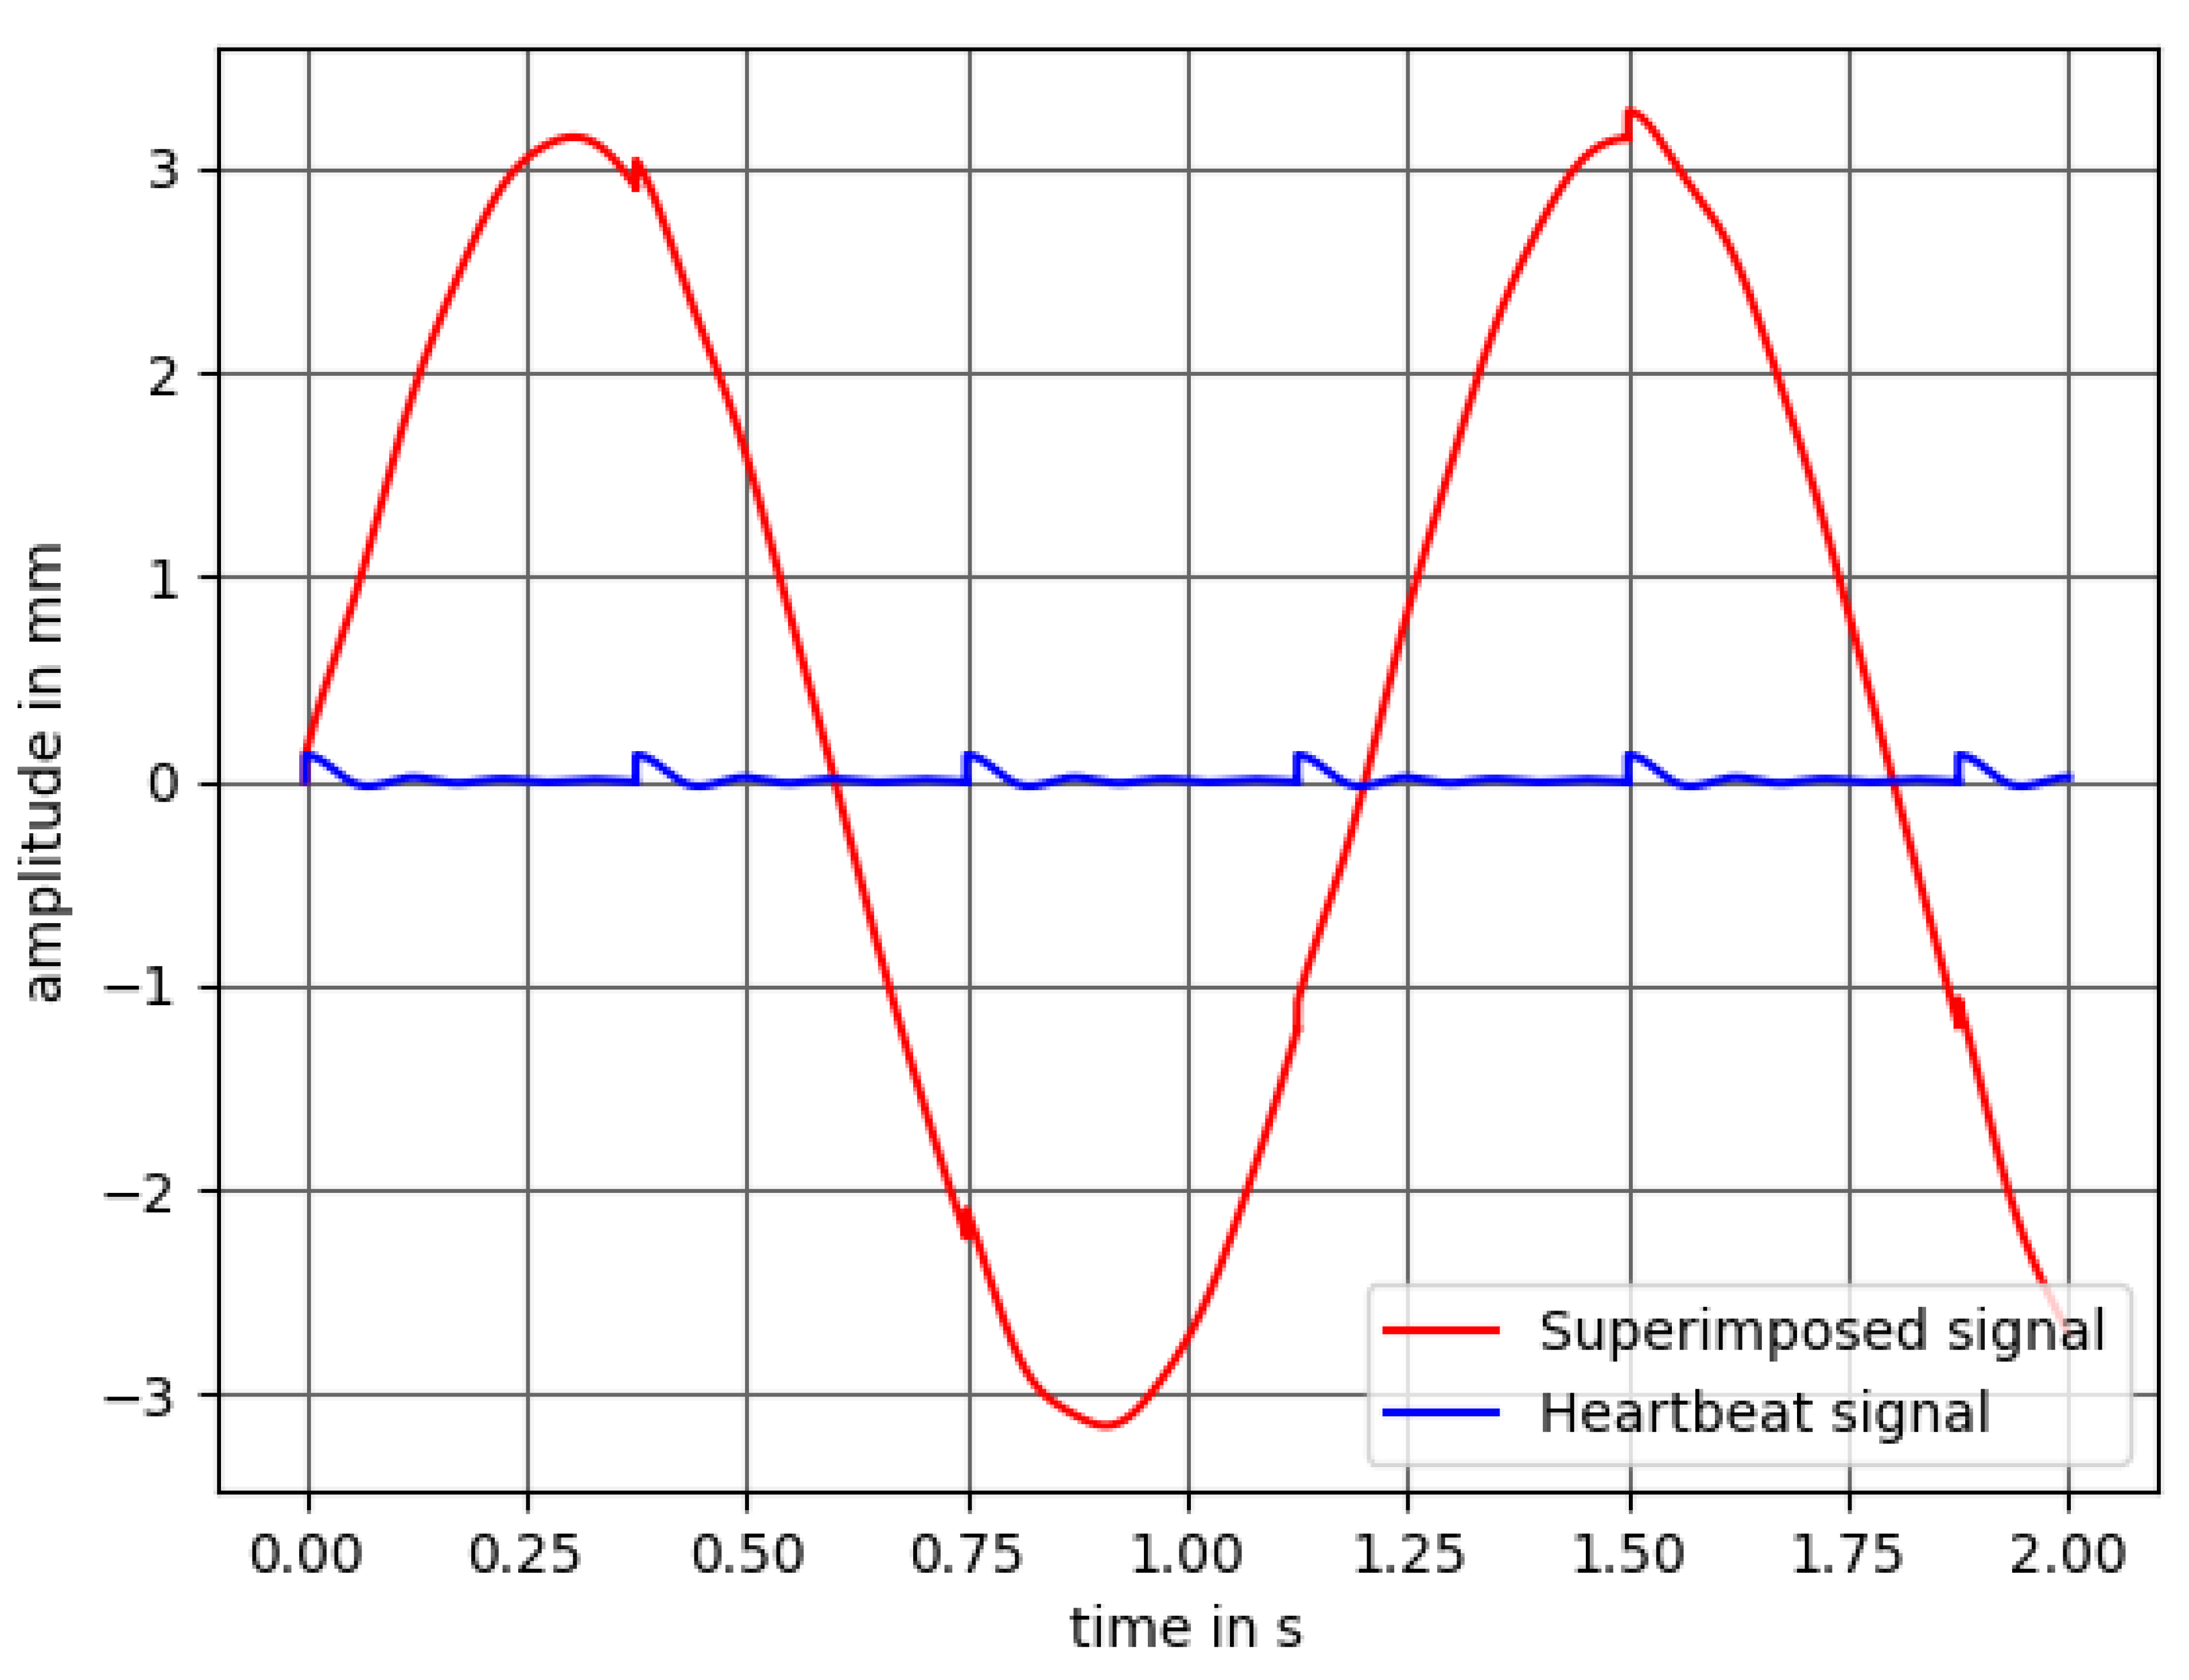
- Displacement due to respiration and heartbeat
- Superimposition of both signals needs to be possible
- Different respiratory patterns such as deep and normal breathing
Mechanical Approach
Electro-Mechanical Approach
2.1.4. Synchronous Evaluation for the Detection of the Respiratory Rate
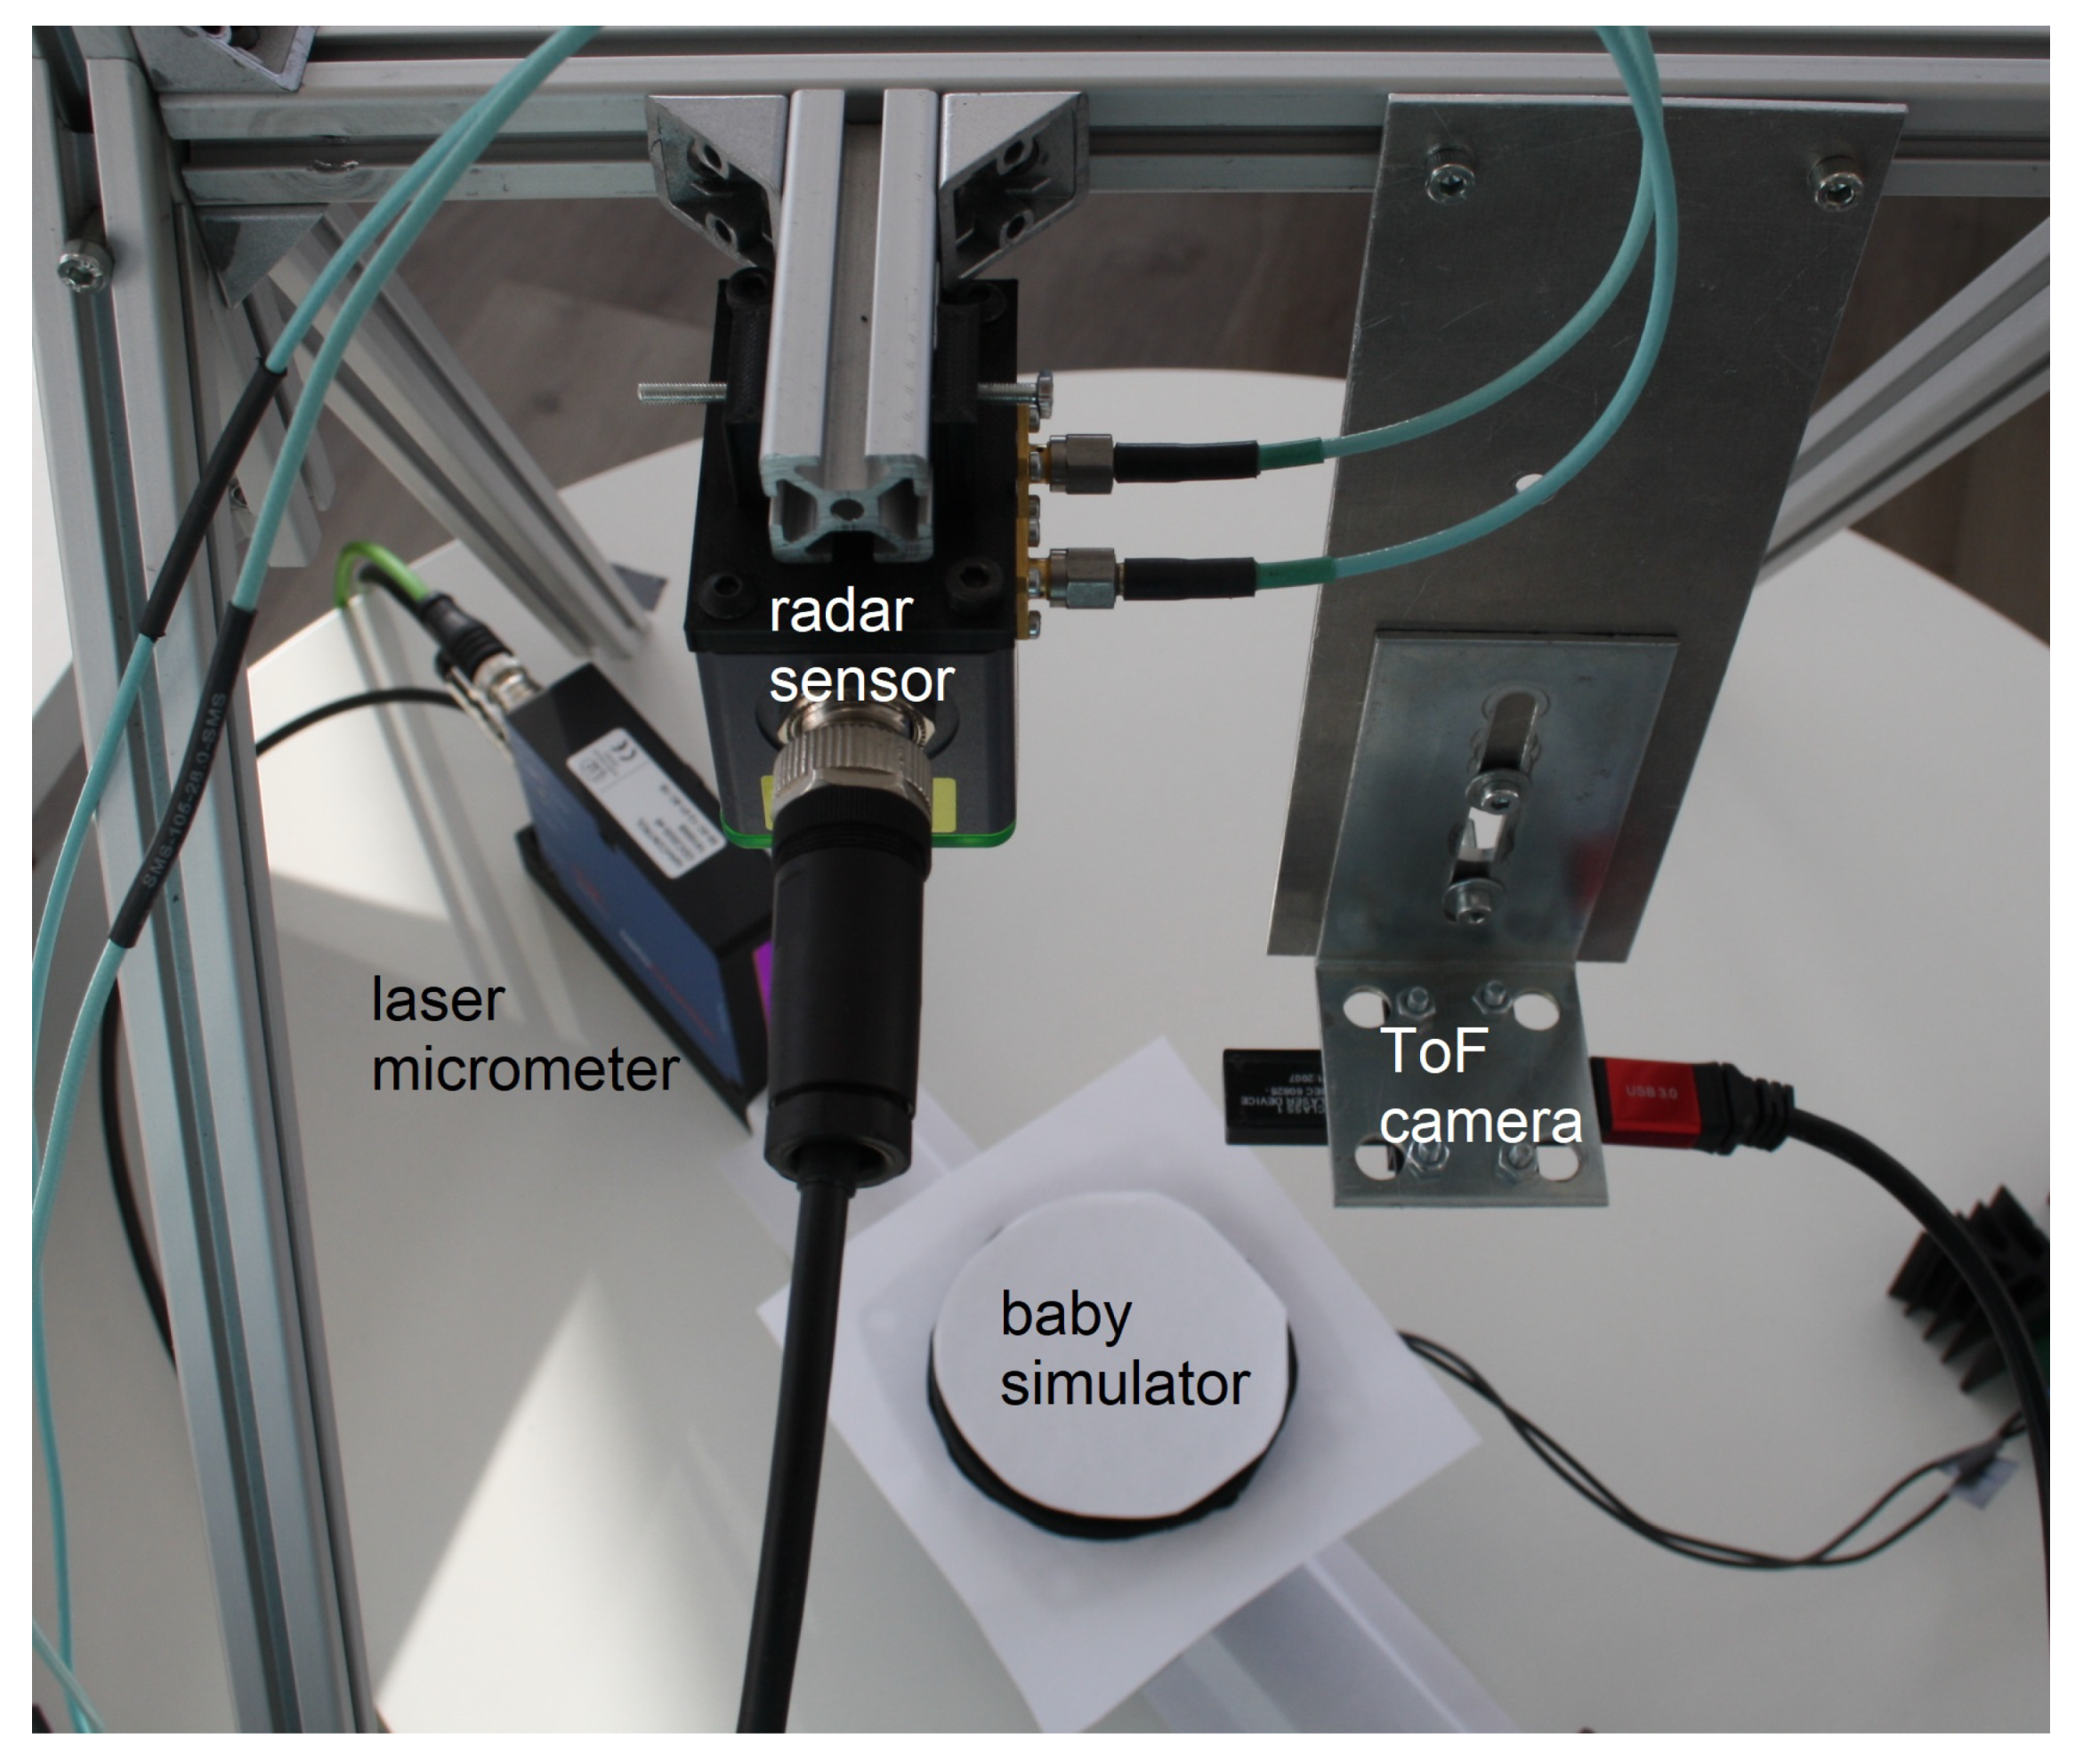
2.2. Hardware Setup
2.2.1. 3D Time-of-Flight Camera
2.2.2. Microwave Interferometric Radar Sensor
2.2.3. Neonatal Simulator
2.3. Software Algorithms
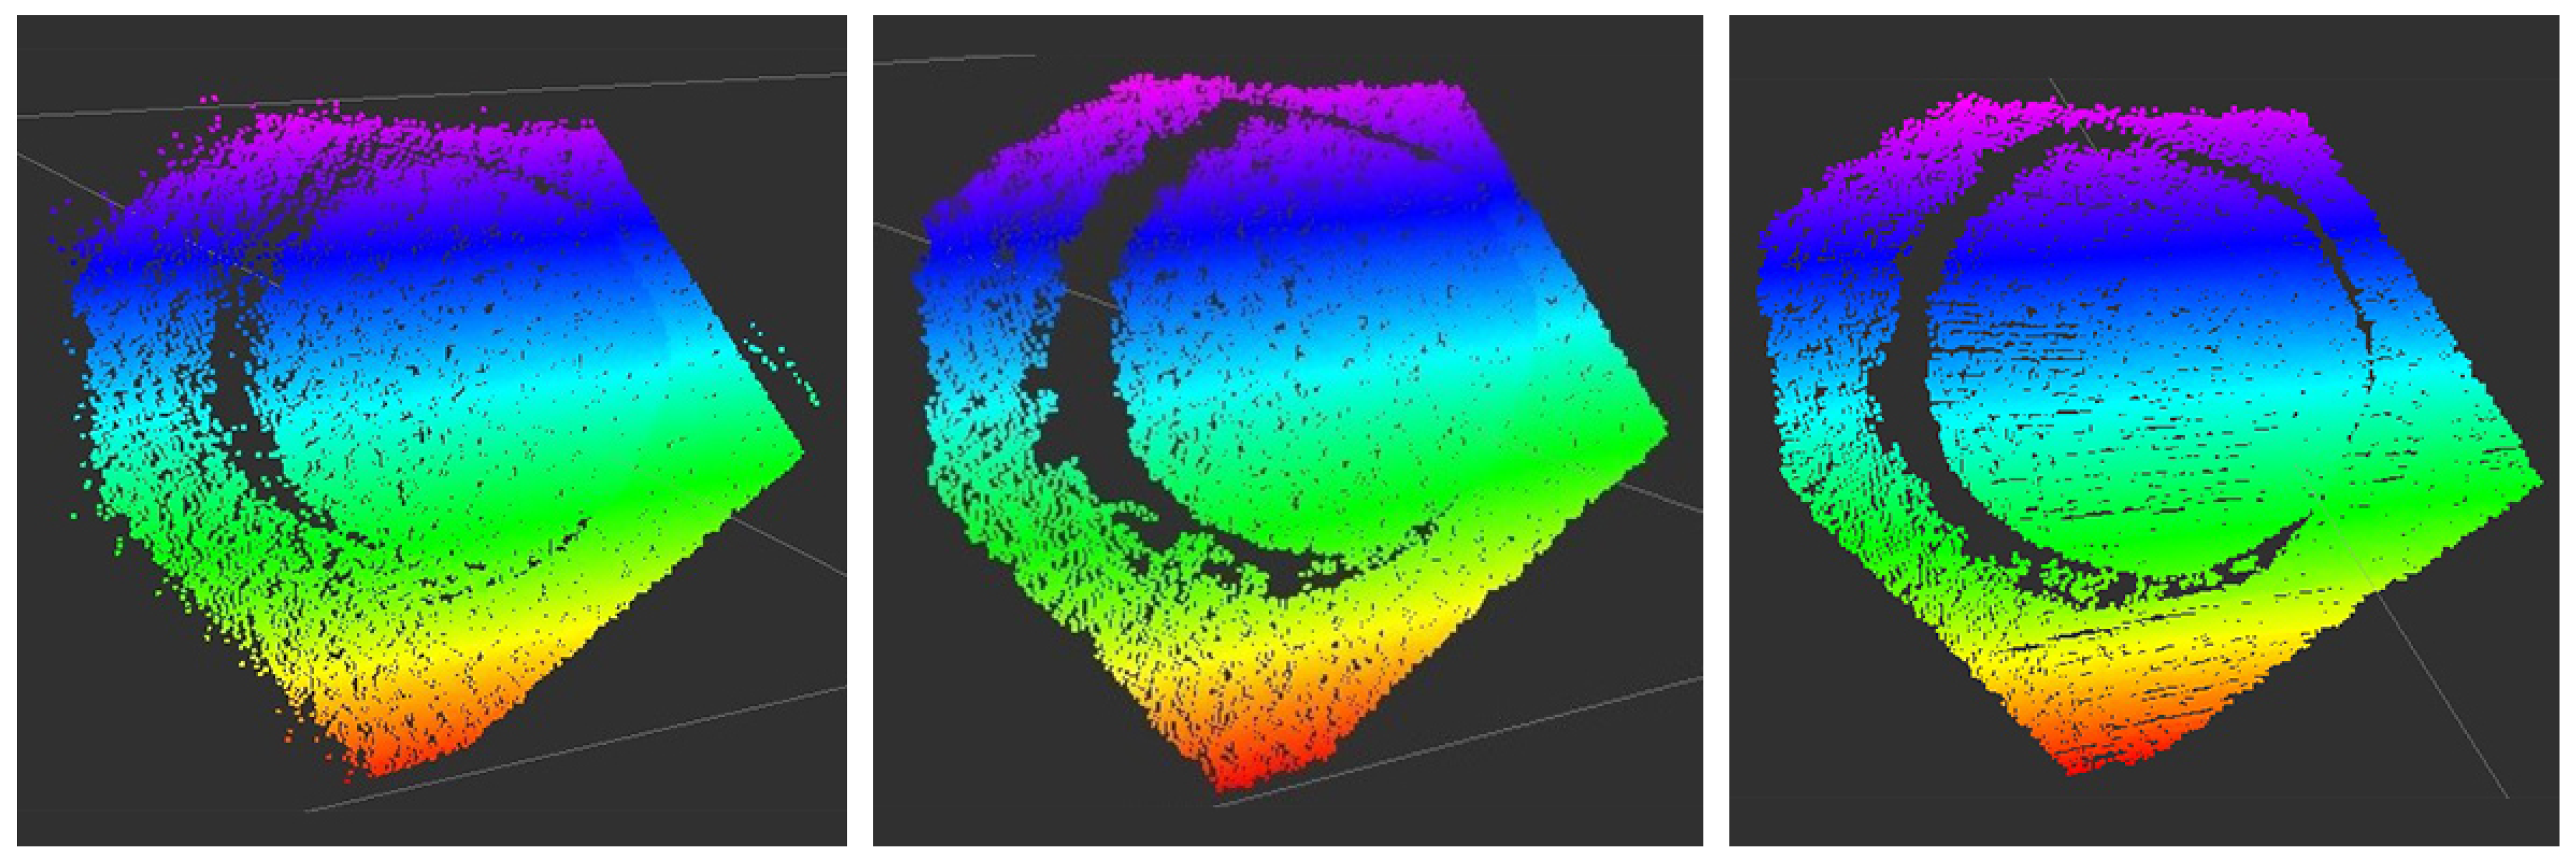
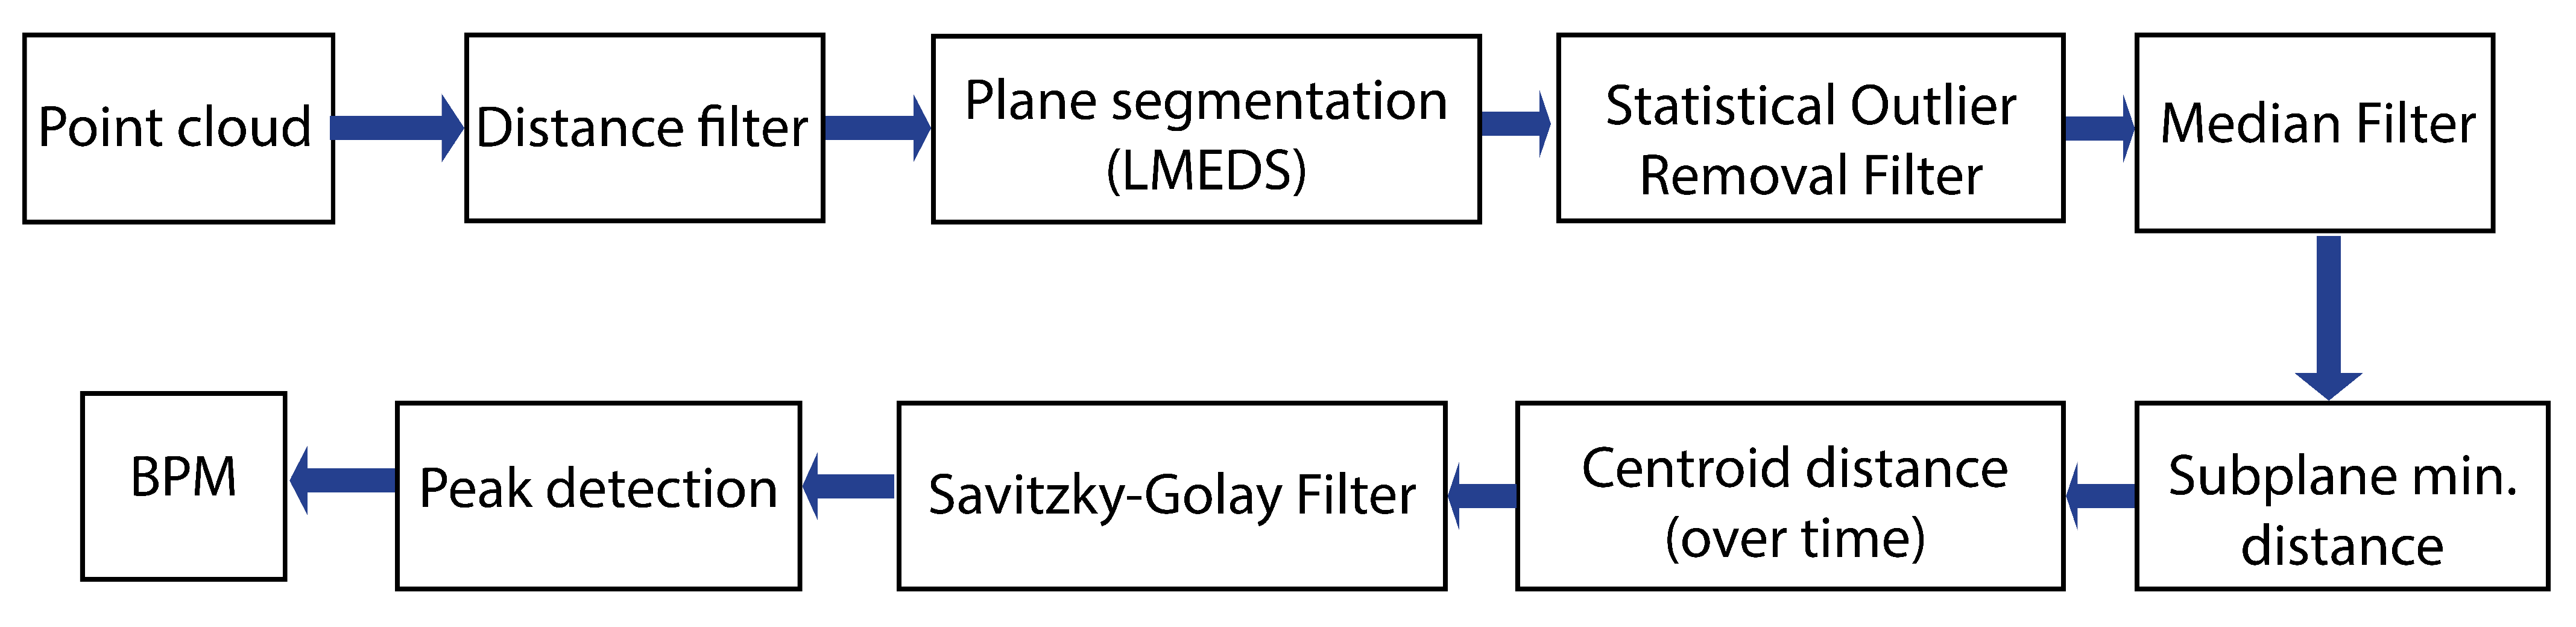
2.3.1. Time-of-Flight Camera for the Detection of the Respiratory Rate
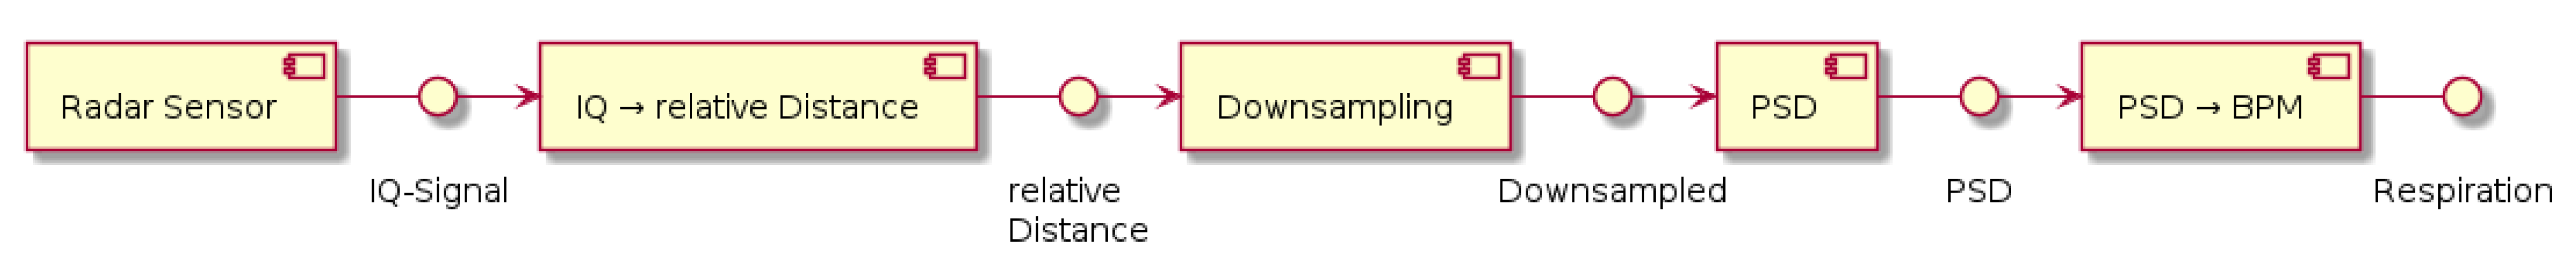
2.3.2. Radar Sensor for the Detection of the Respiratory Rate
2.3.3. Time Synchronization of the Different Sensors
2.4. Measurement Series
3. Results
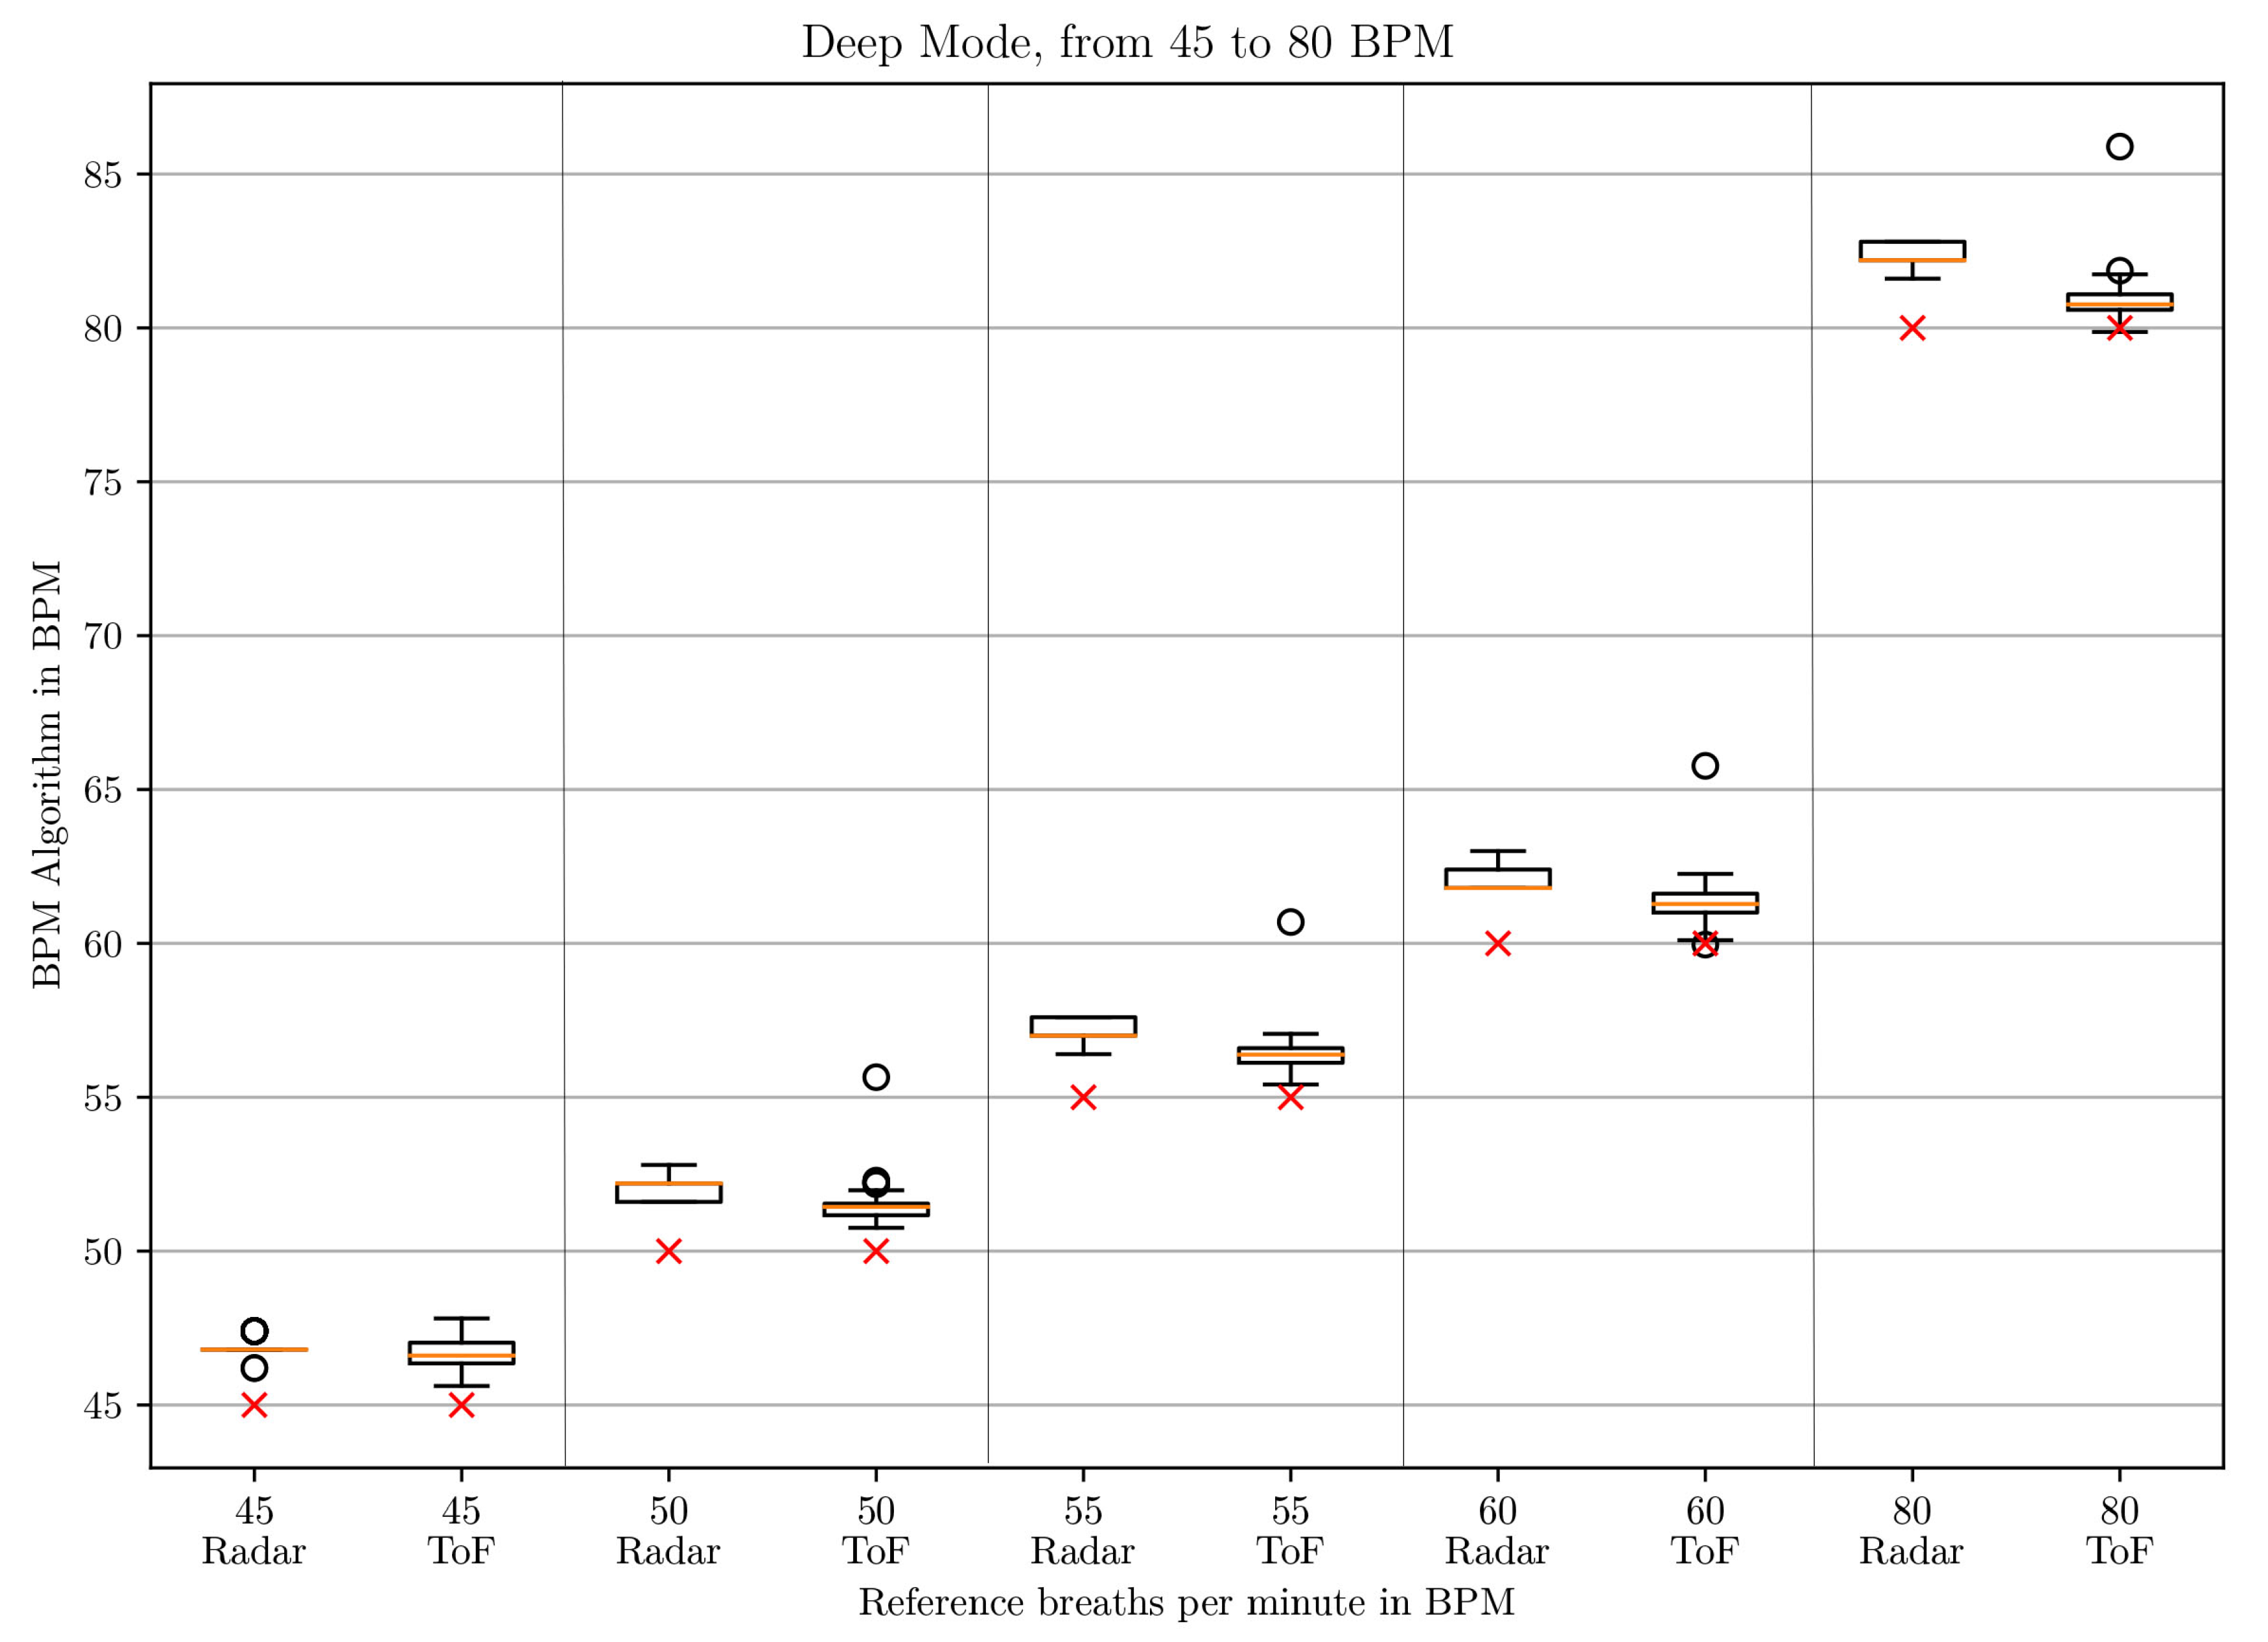
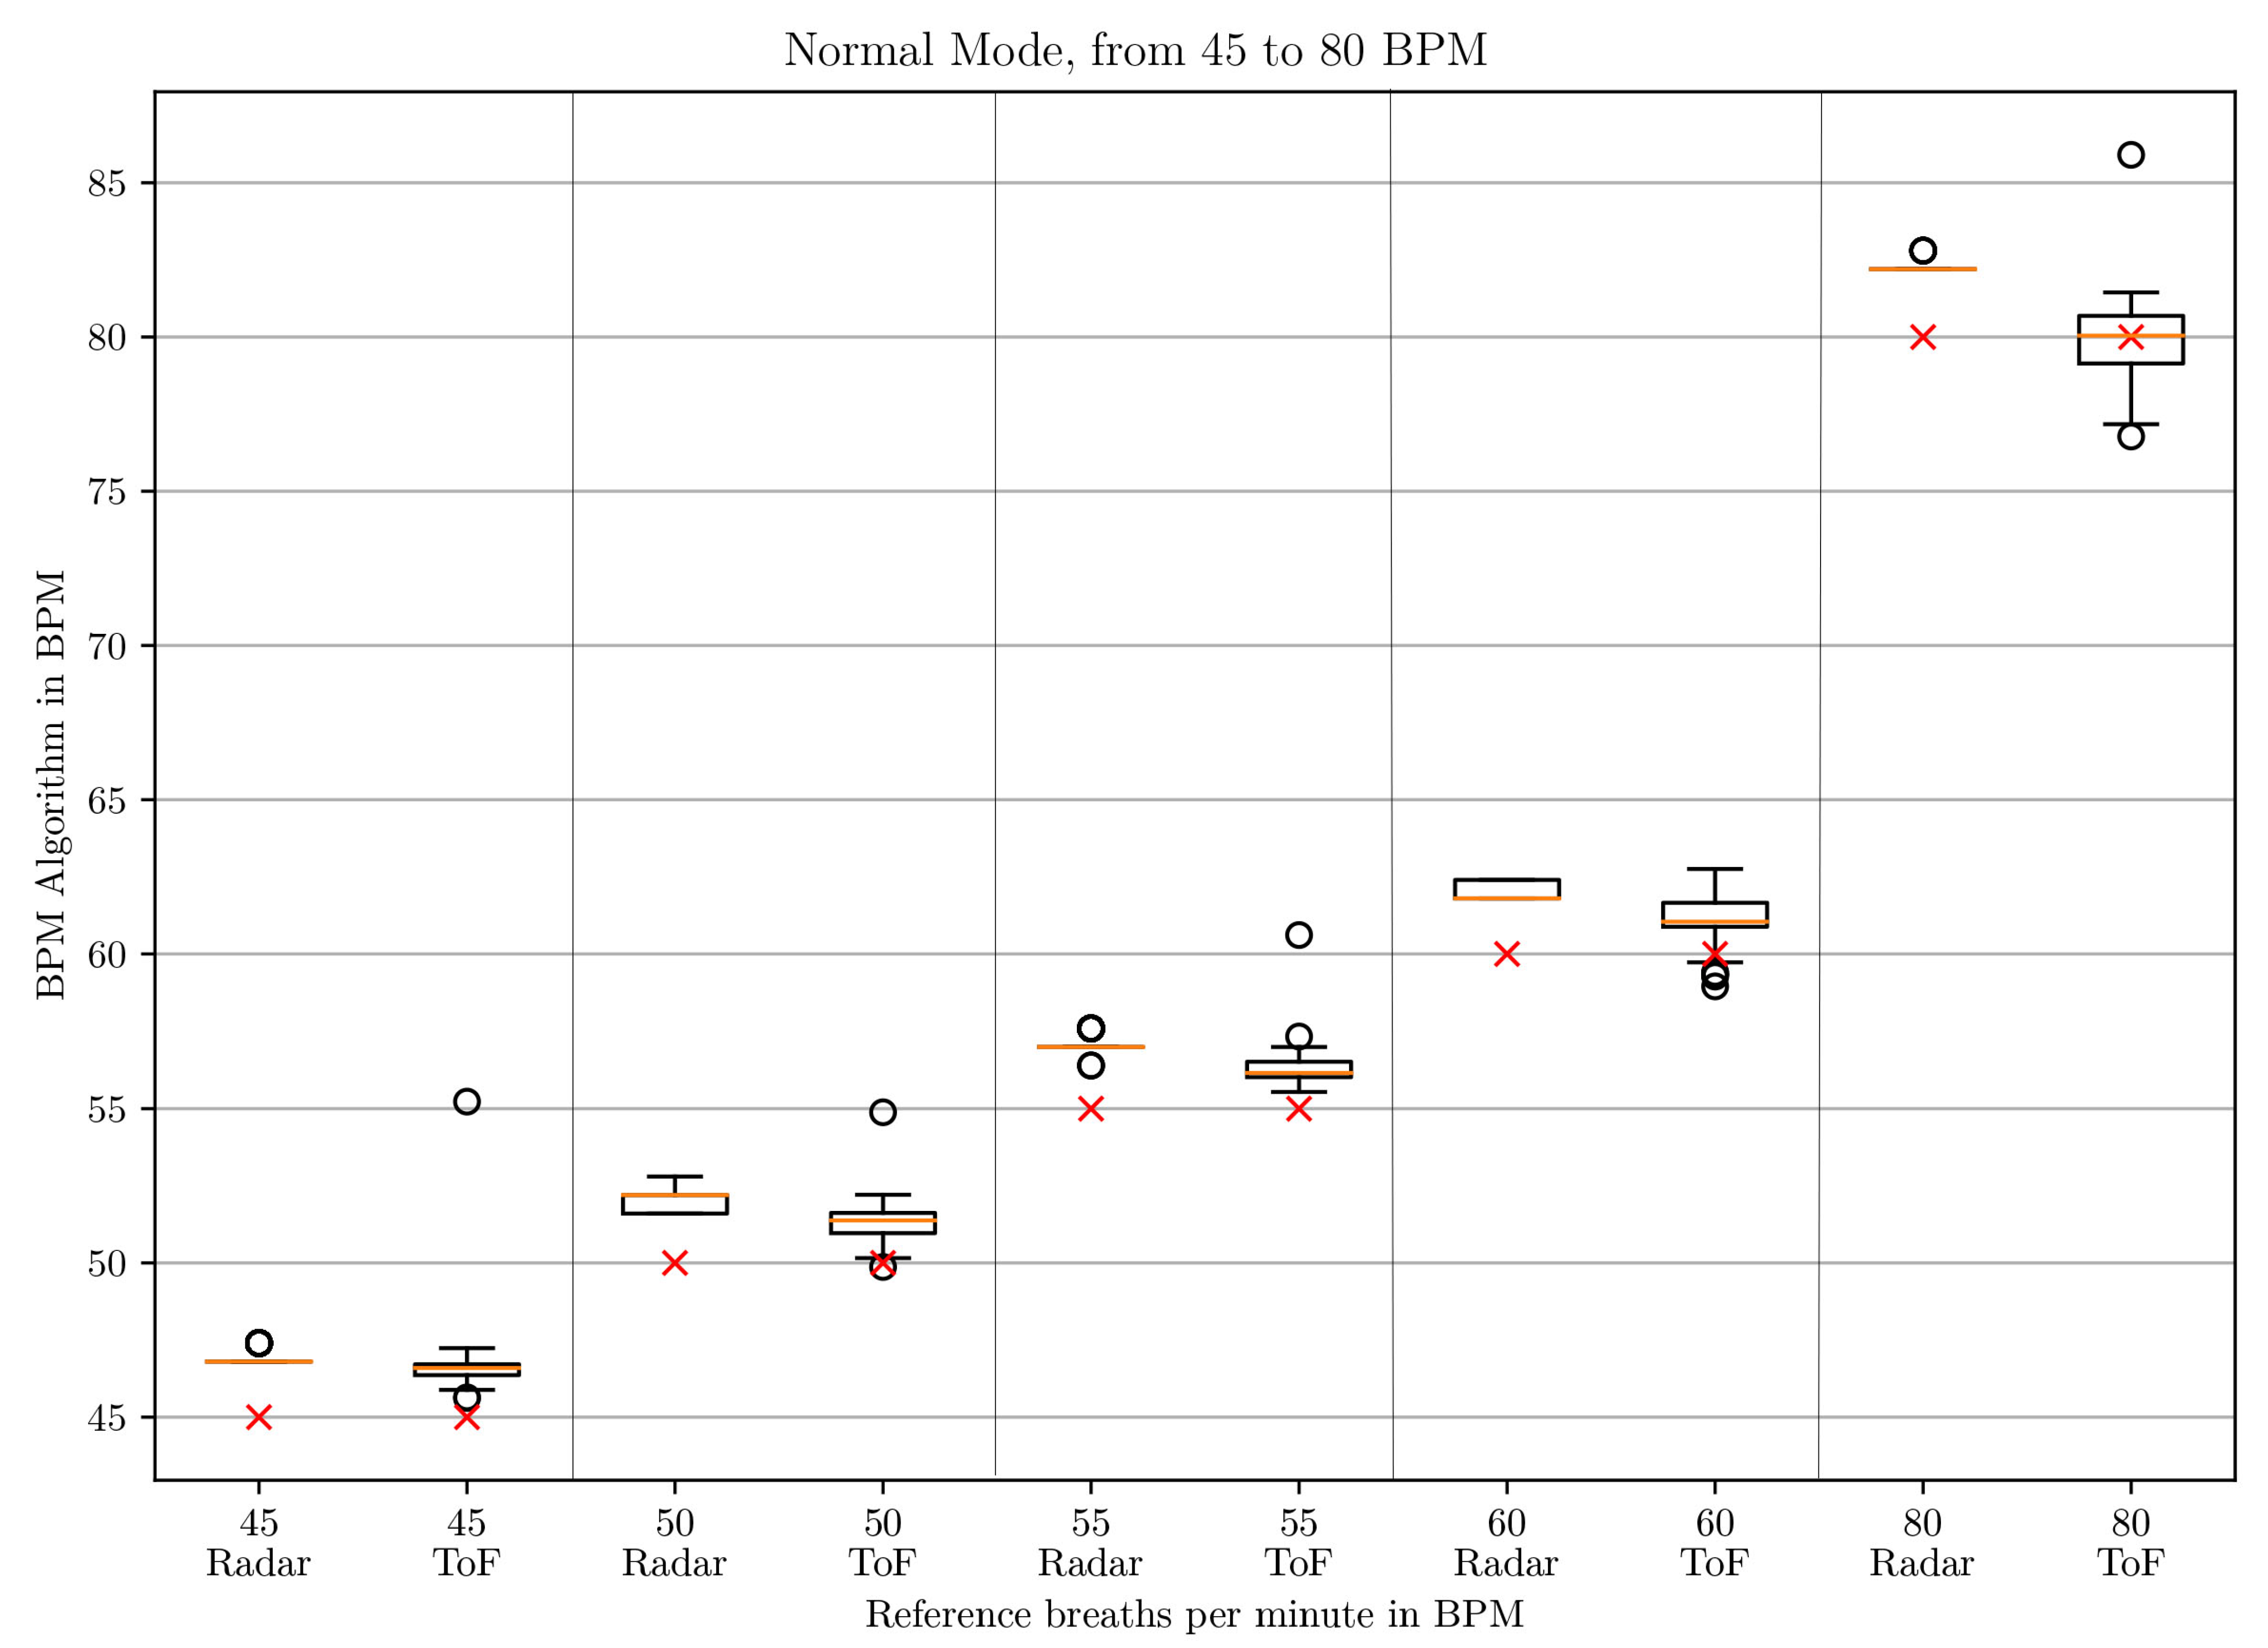
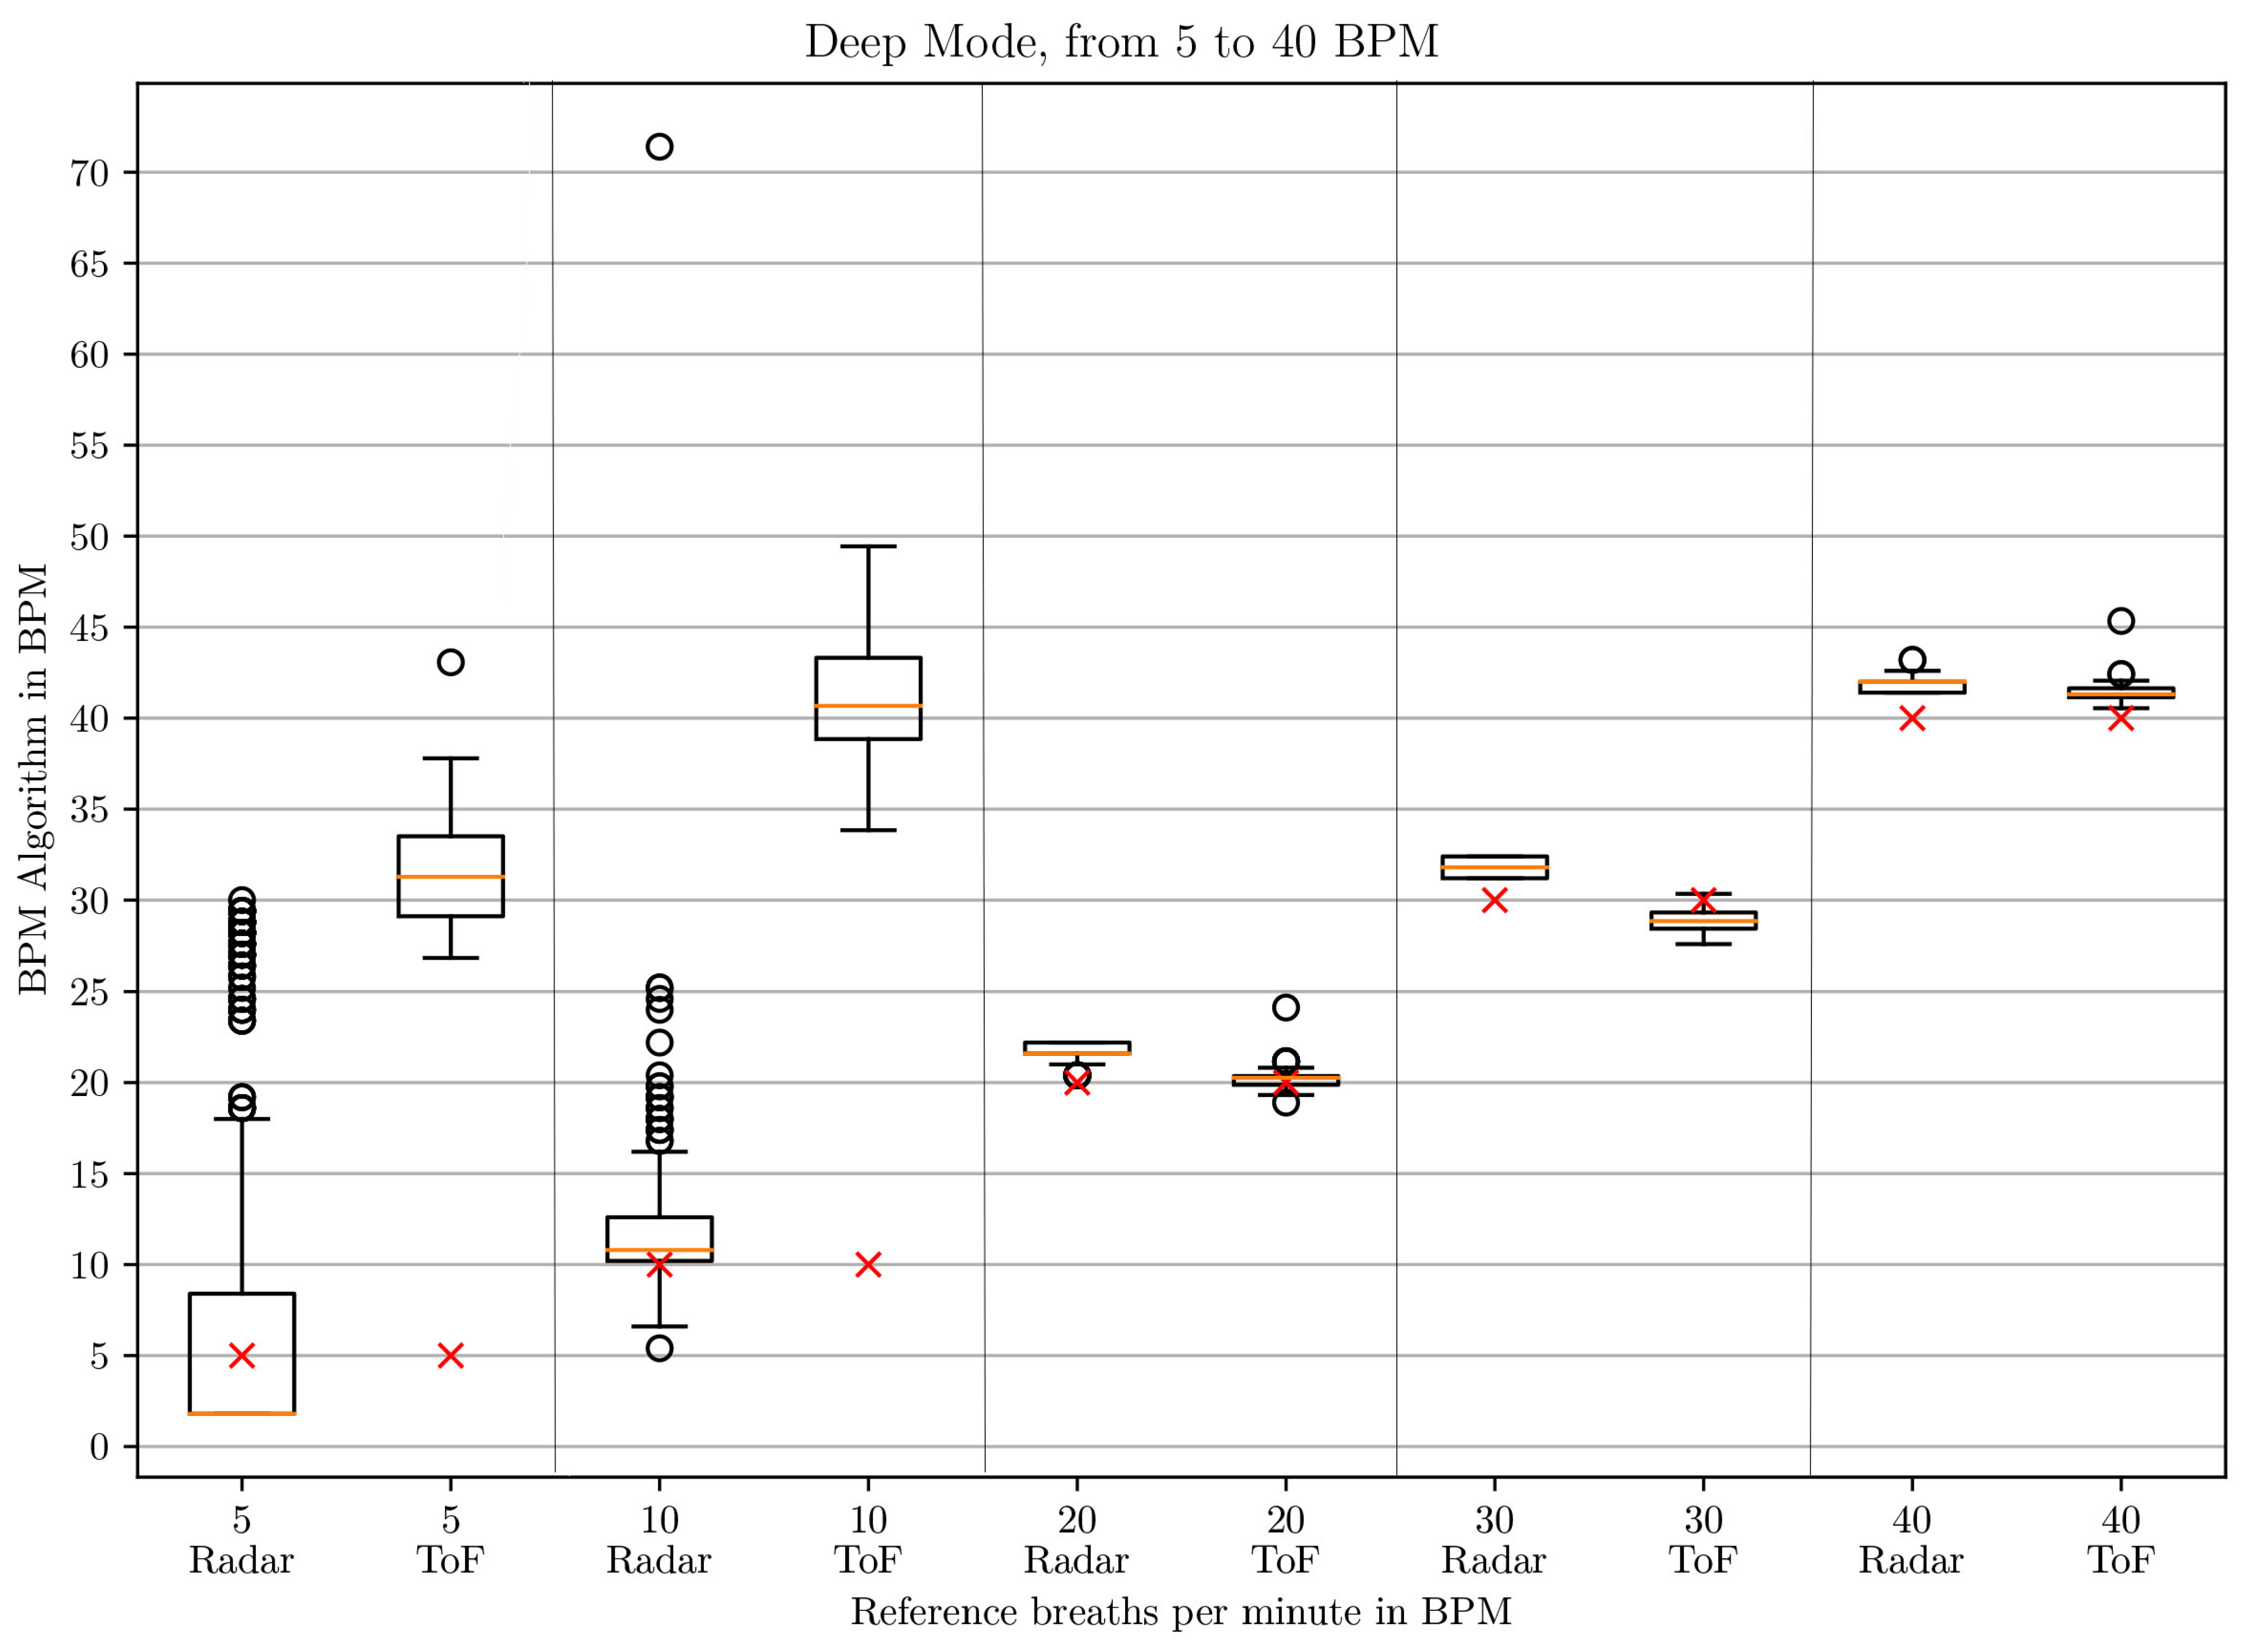
3.1. BPM Comparison
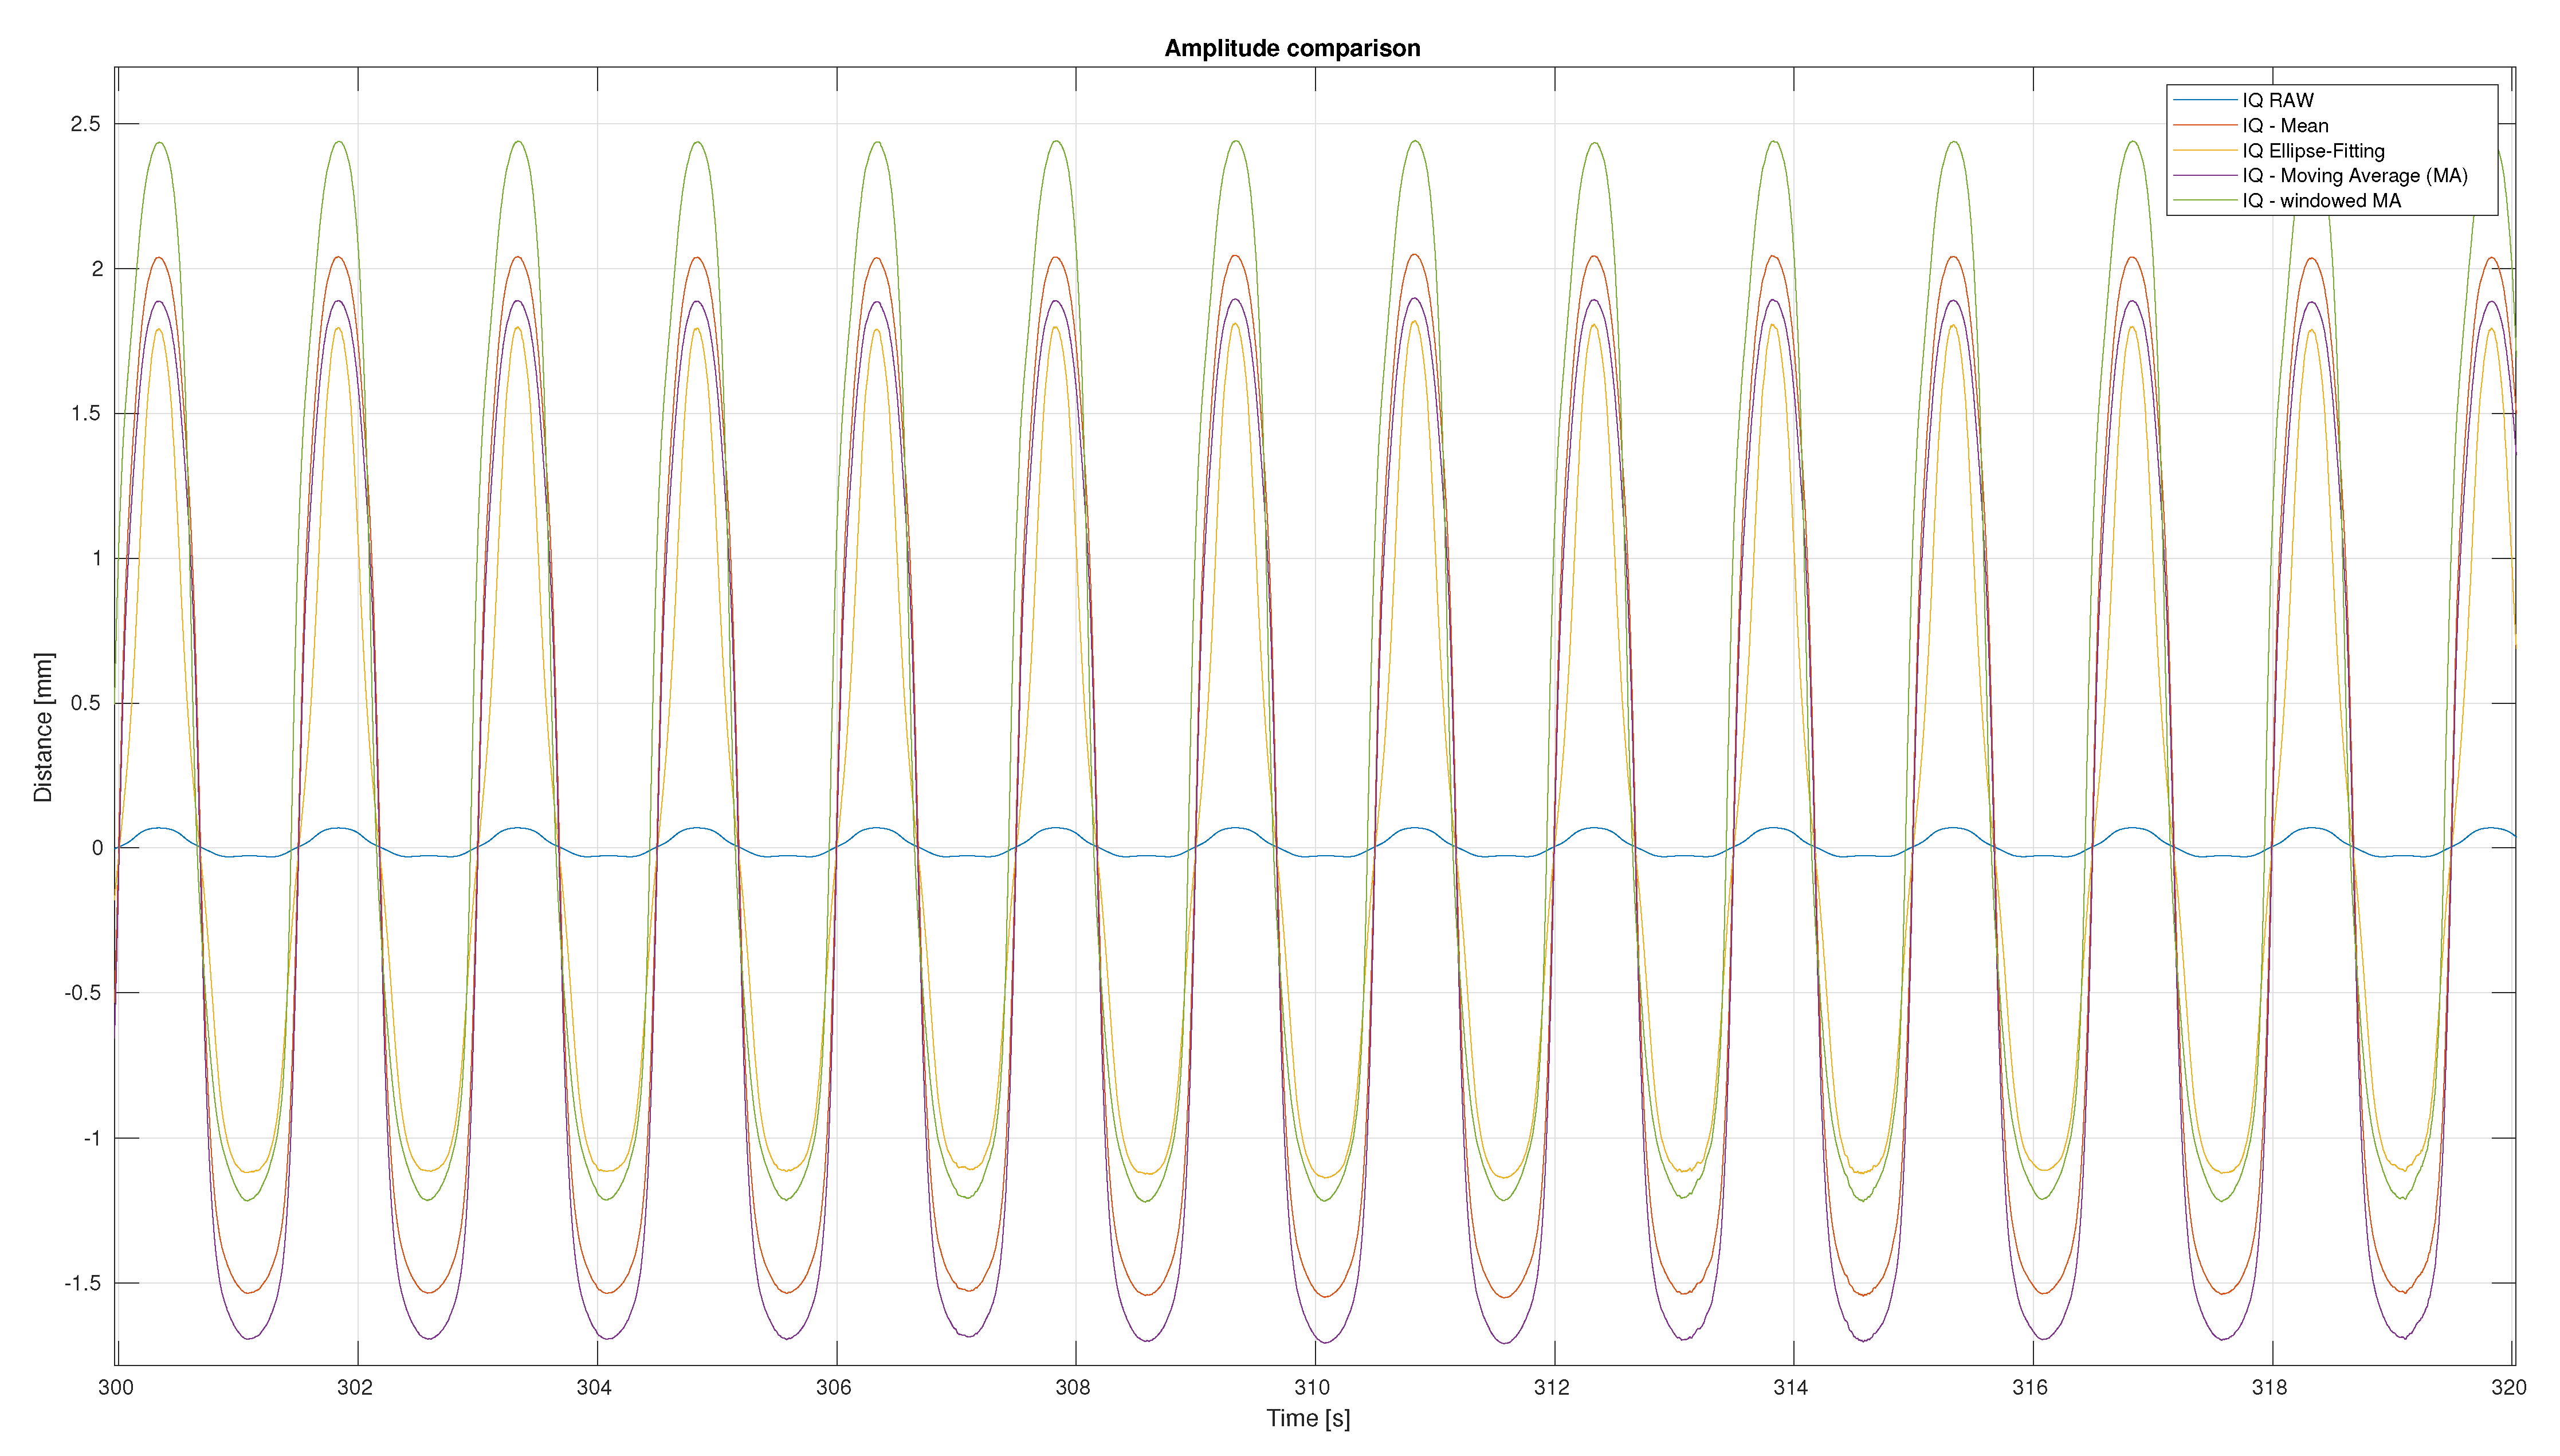
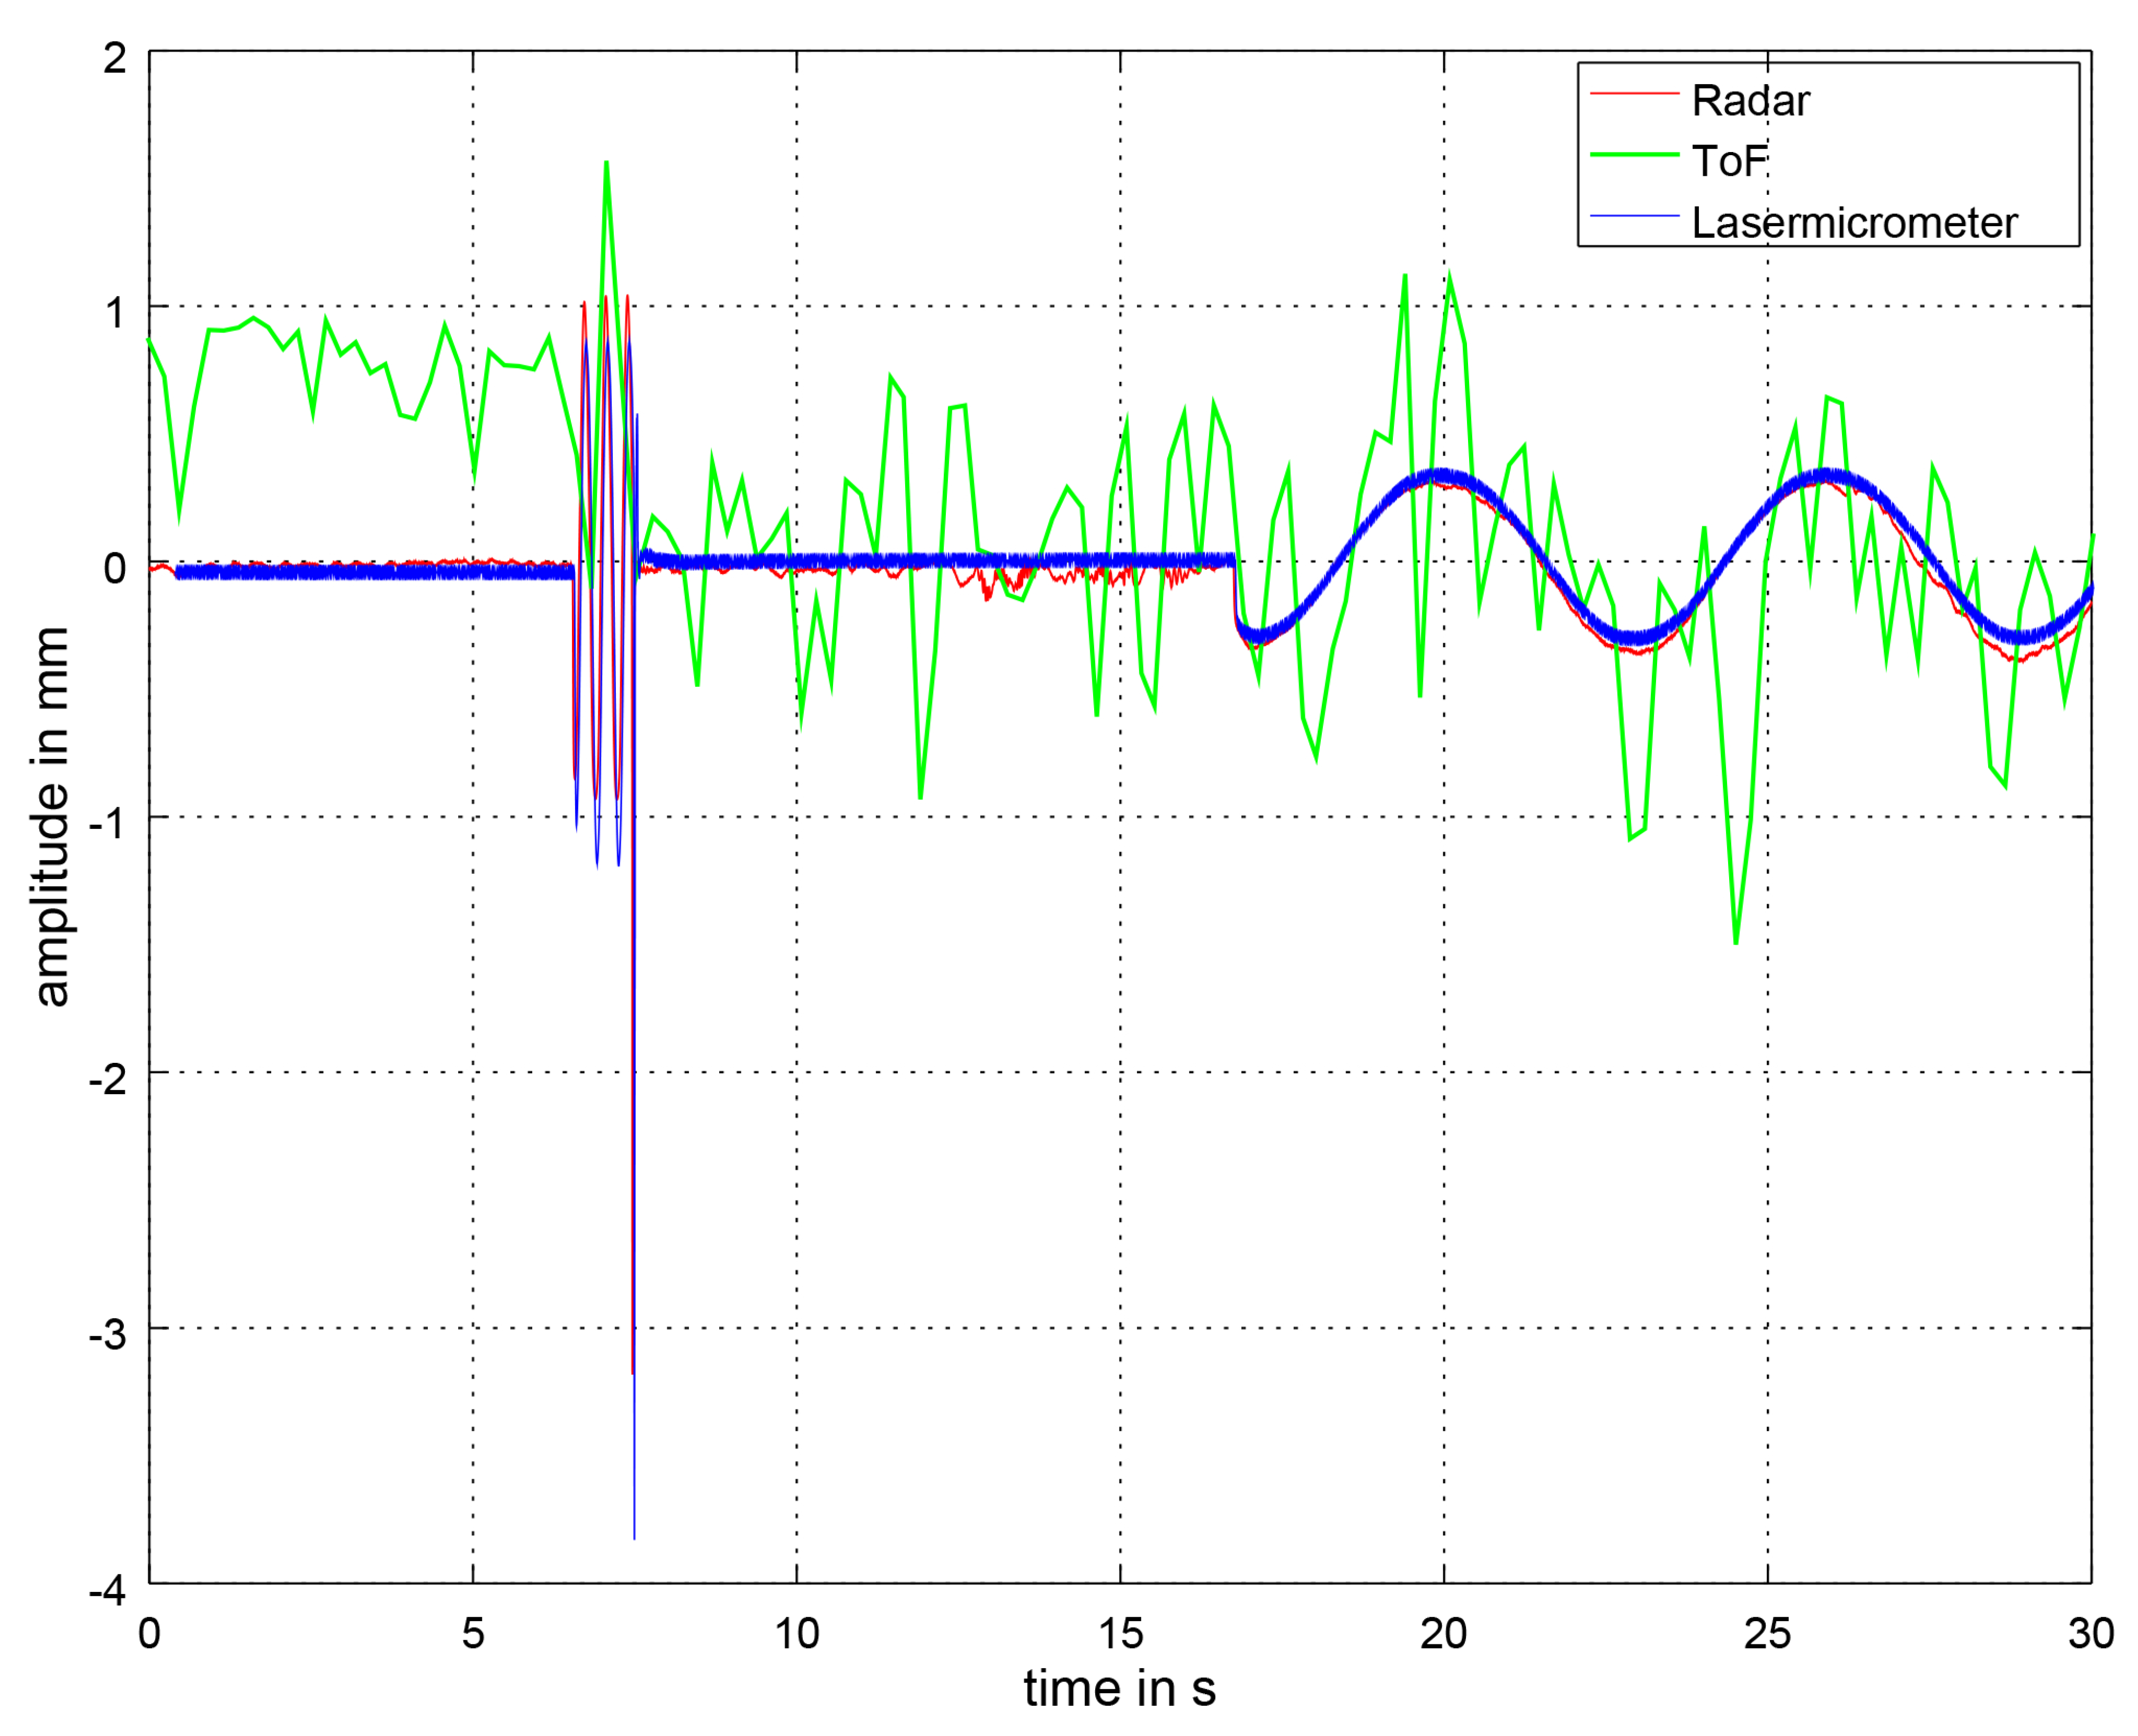
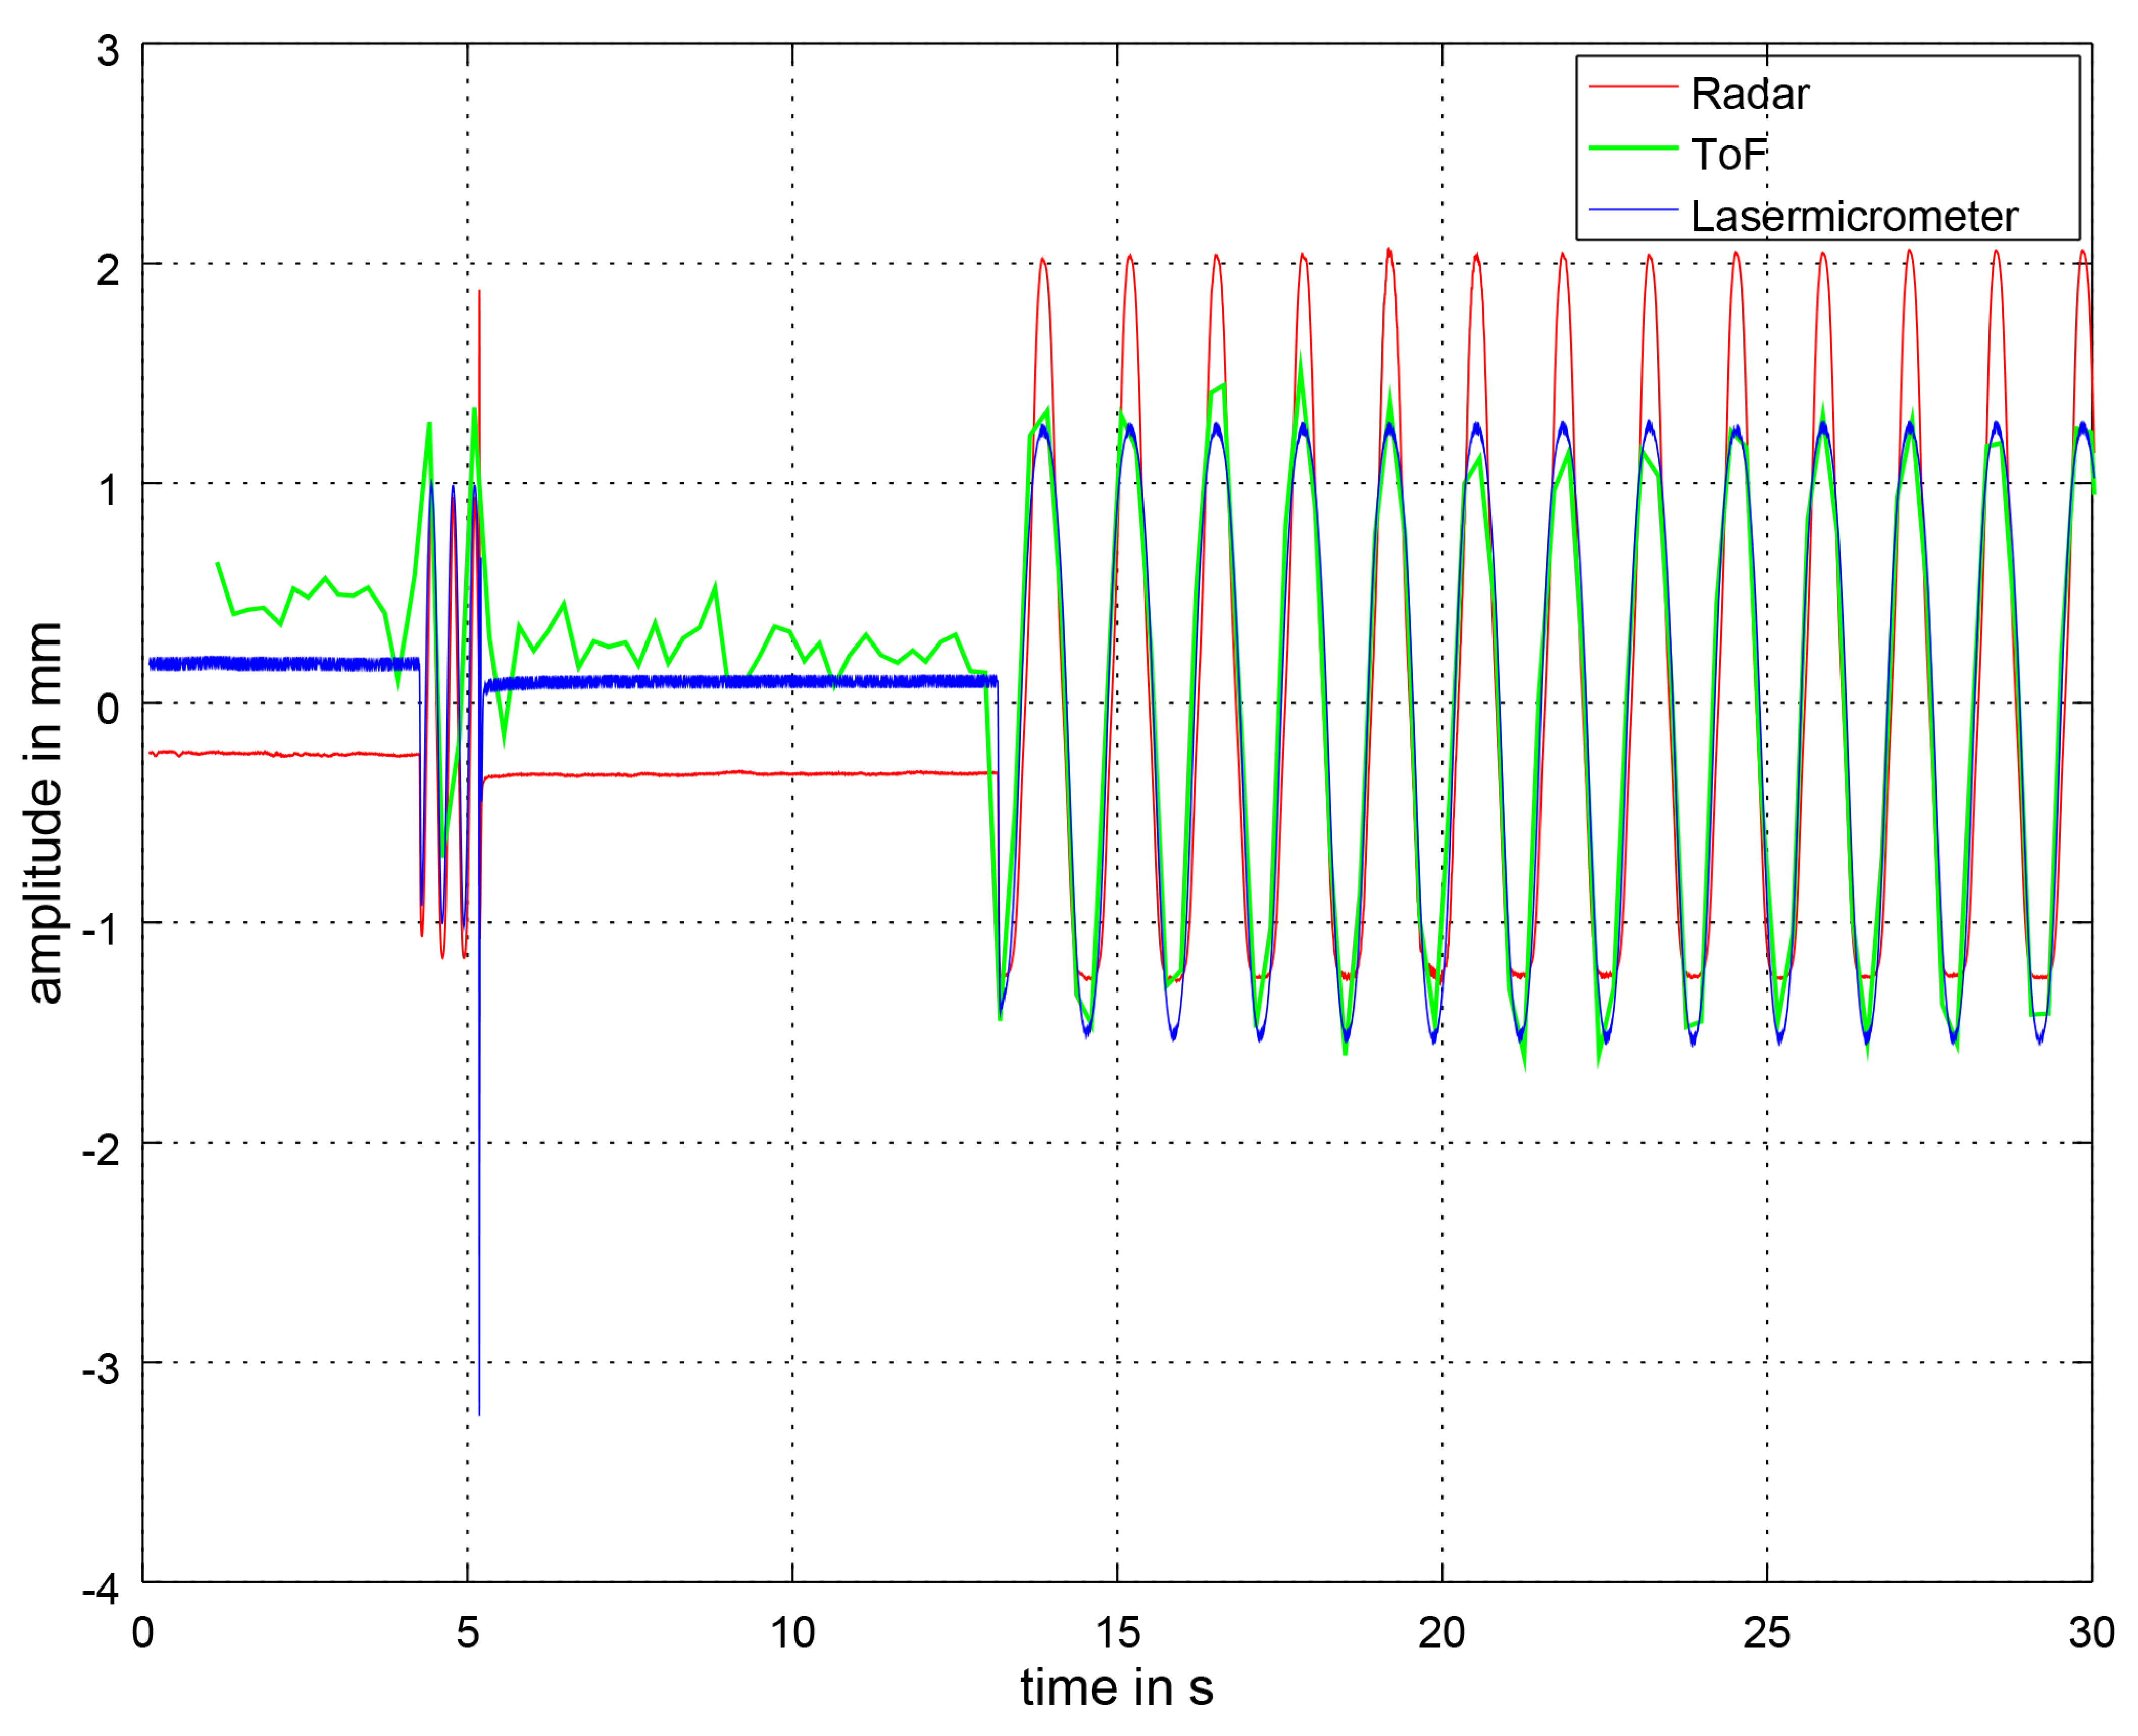
3.2. Distance Signal Comparison
4. Discussion
4.1. Comparison with the Theoretical Approach
4.2. Comparison with the State of the Art
5. Conclusions
Author Contributions
Funding
Acknowledgments
Conflicts of Interest
Abbreviations
| ADC | analog-to-digital converter |
| BPM | breaths per minute |
| CW | Continuous Wave |
| FFT | Fast Fourier Transform |
| FMCW | Frequency Modulated Continuous Wave |
| FoV | field of view |
| GUI | Graphical user interface |
| IQ | in-phase and quadrature |
| ISM | Industrial, Scientific and Medical |
| IR-UWB | Impulse-Radio Ultra-Wideband |
| NICU | Neonatal Intensive Care Unit |
| PCL | Point Cloud Library |
| PSD | Power Spectral Density |
| RGB | Red Green Blue |
| RGB-D | Red, Green, Blue -Depth |
| ROS | Robot Operating System |
| SMIL | self- and mutually injection-locked |
| SNR | Signal-to-noise ratio |
| ToF | time-of-flight |
| UDP | User Datagram Protocol |
| UWB | Ultra-Wideband |
References
- Abbas, A.K.; Heimann, K.; Jergus, K.; Orlikowsky, T.; Leonhardt, S. Neonatal non-contact respiratory monitoring based on real-time infrared thermography. BioMed. Eng. OnLine 2011, 5, 1124–1135. [Google Scholar] [CrossRef] [PubMed] [Green Version]
- Blanik, N.; Abbas, A.K.; Venema, B.; Blazek, V.; Leonhardt, S. Hybrid optical imaging technology for long-term remote monitoring of skin perfusion and temperature behavior. J. Biomed. Opt. 2014, 19, 016012. [Google Scholar] [CrossRef] [PubMed] [Green Version]
- Pereira, C.B.; Heimann, K.; Venema, B.; Blazek, V.; Czaplik, M.; Leonhardt, S. Estimation of respiratory rate from thermal videos of preterm infants. In Proceedings of the Annual International Conference of the IEEE Engineering in Medicine and Biology Society, EMBS, Jeju, Korea, 11–15 July 2017; pp. 3818–3821. [Google Scholar] [CrossRef]
- Pereira, C.B.; Yu, X.; Member, S.; Goos, T.; Reiss, I.; Orlikowsky, T.; Heimann, K.; Venema, B.; Blazek, V.; Leonhardt, S.; et al. Noncontact Monitoring of Respiratory Rate in Newborn Infants Using Thermal Imaging. IEEE Trans. Biomed. Eng. 2019, 66, 1105–1114. [Google Scholar] [CrossRef] [PubMed]
- Klaessens, J.H.; van den Born, M.; van der Veen, A.; Sikkens-van de Kraats, J.; van den Dungen, F.A.; Verdaasdonk, R.M. Development of a baby friendly non-contact method for measuring vital signs: First results of clinical measurements in an open incubator at a neonatal intensive care unit. Proc. SPIE 2014, 8935, 89351P. [Google Scholar] [CrossRef]
- Jorge, J.; Villarroel, M.; Chaichulee, S.; Guazzi, A.; Davis, S.; Green, G.; McCormick, K.; Tarassenko, L. Non-Contact Monitoring of Respiration in the Neonatal Intensive Care Unit. In Proceedings of the 12th IEEE International Conference on Automatic Face and Gesture Recognition, Washington, DC, USA, 30 May–3 June 2017; pp. 286–293. [Google Scholar] [CrossRef]
- Al-Naji, A.; Chahl, J. Remote respiratory monitoring system based on developing motion magnification technique. Biomed. Signal Process. Control 2016, 29, 1–10. [Google Scholar] [CrossRef]
- Lorato, I.; Stuijk, S.; Meftah, M.; Verkruijsse, W.; De Haan, G. Camera-based on-line short cessation of breathing detection. In Proceedings of the 2019 International Conference on Computer Vision Workshop, ICCVW 2019, Seoul, Korea, 27–28 October 2019; pp. 1656–1663. [Google Scholar] [CrossRef] [Green Version]
- Wu, H.Y.; Rubinstein, M.; Shih, E.; Guttag, J.; Durand, F.; Freeman, W. Eulerian video magnification for revealing subtle changes in the world. ACM Trans. Graph. 2012, 31, 1–8. [Google Scholar] [CrossRef]
- Wijenayake, U.; Park, S.Y. Real-time external respiratory motion measuring technique using an RGB-D camera and principal component analysis. Sensors 2017, 17, 1840. [Google Scholar] [CrossRef] [PubMed] [Green Version]
- Procházka, A.; Schätz, M.; Vyšata, O.; Vališ, M. Microsoft Kinect visual and depth sensors for breathing and heart rate analysis. Sensors 2016, 16, 996. [Google Scholar] [CrossRef] [PubMed] [Green Version]
- Bernacchia, N.; Scalise, L.; Casacanditella, L.; Ercoli, I.; Marchionni, P.; Tomasini, E.P. Non contact measurement of heart and respiration rates based on Kinect™. In Proceedings of the IEEE International Symposium on Medical Measurements and Applications MeMeA), Lisboa, Portugal, 11–12 June 2014; pp. 1–5. [Google Scholar] [CrossRef]
- Rihana, S.; Younes, E.; Visvikis, D.; Fayad, H. Kinect2—Respiratory movement detection study. In Proceedings of the 2016 38th Annual International Conference of the IEEE Engineering in Medicine and Biology Society (EMBC), Orlando, FL, USA, 16–20 August 2016. [Google Scholar]
- Benetazzo, F.; Freddi, A.; Monteriù, A.; Longhi, S. Respiratory rate detection algorithm based on RGB-D camera: Theoretical background and experimental results. Healthcare Technol. Lett. 2014, 1, 81–86. [Google Scholar] [CrossRef] [PubMed] [Green Version]
- Lauhkonen, E.; Cooper, B.G.; Iles, R. Mini review shows that structured light plethysmography provides a non-contact method for evaluating breathing patterns in children. Acta Paediat. Int. J. Paediat. 2019, 1398–1405. [Google Scholar] [CrossRef] [PubMed]
- Ghezzi, M.; Tenero, L.; Piazza, M.; Bodini, A.; Piacentini, G. Structured Light Plethysmography (SLP): Management and follow up of a paediatric patient with pneumonia. Resp. Med. Case Rep. 2017, 22, 67–69. [Google Scholar] [CrossRef] [PubMed]
- Hmeidi, H.; Motamedi-Fakhr, S.; Chadwick, E.K.; Gilchrist, F.J.; Lenney, W.; Iles, R.; Wilson, R.C.; Alexander, J. Tidal breathing parameters measured by structured light plethysmography in children aged 2–12 years recovering from acute asthma/wheeze compared with healthy children. Physiol. Rep. 2018, 6, 1–13. [Google Scholar] [CrossRef] [PubMed]
- Hesse, N.; Pujades, S.; Black, M.J.; Arens, M.; Hofmann, U.G.; Schroeder, A.S. Learning and tracking the 3d body shape of freely moving infants from rgb-d sequences. arXiv 2018, arXiv:1810.07538. [Google Scholar] [CrossRef] [Green Version]
- Giancola, S.; Valenti, M.; Sala, R. State-of-the-Art Devices Comparison. In A Survey on 3D Cameras: Metrological Comparison of Time-of-Flight, Structured-Light and Active Stereoscopy Technologies; SpringerBriefs in Computer Science; Springer: Cham, Switzerland, 2018; pp. 29–39. [Google Scholar] [CrossRef]
- Martinez, M.; Stiefelhagen, R. Breathing rate monitoring during sleep from a depth camera under real-life conditions. In Proceedings of the 2017 IEEE Winter Conference on Applications of Computer Vision, WACV 2017, Santa Rosa, CA, USA, 24–31 March 2017; pp. 1168–1176. [Google Scholar] [CrossRef]
- Penne, J.; Schaller, C.; Hornegger, J.; Kuwert, T. Robust real-time 3D respiratory motion detection using time-of-flight cameras. Int. J. Comput. Assisted Radiol. Surg. 2008, 3, 427–431. [Google Scholar] [CrossRef] [Green Version]
- Coronel, C.; Wiesmeyr, C.; Garn, H.; Kohn, B.; Wimmer, M.; Mandl, M.; Glos, M.; Penzel, T.; Klosch, G.; Stefanic-Kejik, A.; et al. 3D Camera and Pulse Oximeter for Respiratory Events Detection. IEEE J. Biomed. Health Inform. 2020, 1. [Google Scholar] [CrossRef]
- Rehouma, H.; Noumeir, R.; Jouvet, P.; Bouachir, W.; Essouri, S. A computer vision method for respiratory monitoring in intensive care environment using RGB-D cameras. In Proceedings of the 7th International Conference on Image Processing Theory, Tools and Applications, IPTA 2017, Montreal, QC, Canada, 28 November–1 December 2017; pp. 1–6. [Google Scholar] [CrossRef]
- Rehouma, H.; Noumeir, R.; Bouachir, W.; Jouvet, P.; Essouri, S. 3D imaging system for respiratory monitoring in pediatric intensive care environment. Comput. Med. Imag. Graph. 2018, 70, 17–28. [Google Scholar] [CrossRef] [PubMed]
- Cenci, A.; Liciotti, D.; Frontoni, E.; Mancini, A.; Zingaretti, P. Non-Contact monitoring of preterm infants using rgb-D camera. In Proceedings of the ASME Design Engineering Technical Conference, Boston, MA, USA, 2–5 August 2015; Volume 9. [Google Scholar] [CrossRef]
- Gleichauf, J.; Niebler, C.; Koelpin, A. Automatic non-contact monitoring of the respiratory rate of neonates using a structured light camera. In Proceedings of the 2020 42nd Annual International Conference of the IEEE Engineering in Medicine Biology Society (EMBC), Montreal, QC, Canada, 20–24 July 2020; pp. 4118–4121. [Google Scholar] [CrossRef]
- Wolff, C. radartutorial.eu. Available online: https://www.radartutorial.eu/ (accessed on 18 November 2020).
- Kim, J.D.; Lee, W.H.; Lee, Y.; Lee, H.J.; Cha, T.; Kim, S.H.; Song, K.M.; Lim, Y.H.; Cho, S.H.; Cho, S.H.; et al. Non-contact respiration monitoring using impulse radio ultrawideband radar in neonates. R. Soc. Open Sci. 2019, 6, 190149. [Google Scholar] [CrossRef] [PubMed] [Green Version]
- Schleicher, B.; Nasr, I.; Trasser, A.; Schumacher, H. IR-UWB radar demonstrator for ultra-fine movement detection and vital-sign monitoring. IEEE Trans. Microw. Theor. Techniq. 2013, 61, 2076–2085. [Google Scholar] [CrossRef] [Green Version]
- Tupin, J.P. Ultra Wideband (UWB) Baby Monitors for Detection of Infant Cardiopulmonary Distress. U.S. Patent Application No. 2012/0059268 A1, 8 March 2012. [Google Scholar]
- Wang, S.; Pohl, A.; Jaeschke, T.; Czaplik, M.; Kony, M.; Leonhardt, S.; Pohl, N. A novel ultra-wideband 80 GHz FMCW radar system for contactless monitoring of vital signs. In Proceedings of the Annual International Conference of the IEEE Engineering in Medicine and Biology Society, EMBS, Milan, Italy, 25–29 August 2015; pp. 4978–4981. [Google Scholar] [CrossRef]
- Matthews, G.; Sudduth, B.; Burrow, M. A Non-Contact Vital Signs Monitor. Crit. Rev. Biomed. Eng. 2000, 28, 173–178. [Google Scholar] [CrossRef]
- Marnach, A.; Schmiech, D.; DIewald, A.R. Verification of algorithm for an I/Q-radar system for breathing detection in an incubator. In Proceedings of the 2019 21st International Conference on Electromagnetics in Advanced Applications, ICEAA 2019, Granada, Spain, 9–13 September 2019; pp. 1275–1278. [Google Scholar] [CrossRef]
- Schmiech, D.; Marnach, A.; Diewald, A.R. Verification and first test measurement of a microwave-based vital sign monitor. Adv. Radio Sci. 2019, 17, 249–256. [Google Scholar] [CrossRef]
- Li, C.; Cummings, J.; Lam, J.; Graves, E.; Wu, W. Radar remote monitoring of vital signs. IEEE Microw. Mag. 2009, 10, 47–56. [Google Scholar] [CrossRef]
- Yan, Y.; Li, C.; Yu, X.; Weiss, M.D.; Lin, J. Verification of a non-contact vital sign monitoring system using an infant simulator. In Proceedings of the 31st Annual International Conference of the IEEE Engineering in Medicine and Biology Society, Minneapolis, MN, USA, 3–6 September 2009; pp. 4836–4839. [Google Scholar] [CrossRef]
- Pisa, S.; Bernardi, P.; Cicchetti, R.; Giusto, R.; Pittella, E.; Piuzzi, E.; Testa, O. Comparison between UWB and CW radar sensors for breath activity monitoring. Radar Sens. Technol. 2014, 9077, 907711. [Google Scholar] [CrossRef]
- Linz, S.; Vinci, G.; Mann, S.; Lindner, S.; Barbon, F.; Weigel, R.; Koelpin, A. A compact, versatile six-port radar module for industrial and medical applications. J. Electric. Comput. Eng. 2013, 2013. [Google Scholar] [CrossRef] [Green Version]
- Koelpin, A.; Vinci, G.; Laemmle, B.; Kissinger, D.; Weigel, R.; Koelpin, A.; Vinci, G.; Laemmle, B.; Kissinger, D.; Weigel, R. The Six-Port in Modern Society. IEEE Microw. Mag. 2010, 11, 35–43. [Google Scholar] [CrossRef]
- Vinci, G.; Lenhard, T.; Will, C.; Koelpin, A. Microwave interferometer radar-based vital sign detection for driver monitoring systems. In Proceedings of the 2015 IEEE MTT-S International Conference on Microwaves for Intelligent Mobility, ICMIM 2015, Heidelberg, Germany, 27–29 April 2015. [Google Scholar] [CrossRef]
- Vinci, G.; Lindner, S.; Barbon, F.; Mann, S.; Hofmann, M.; Duda, A.; Weigel, R.; Koelpin, A. Six-port radar sensor for remote respiration rate and heartbeat vital-sign monitoring. IEEE Trans. Microw. Theor. Techniq. 2013, 61, 2093–2100. [Google Scholar] [CrossRef]
- Marchionni, P.; Scalise, L.; Ercoli, I.; Tomasini, E.P. An optical measurement method for the simultaneous assessment of respiration and heart rates in preterm infants. Rev. Sci. Instrum. 2013, 84, 121705. [Google Scholar] [CrossRef] [PubMed]
- Nguyen, P.; Transue, S.; Choi, M.H.; Halbower, A.C.; Vu, T. WiKiSpiro: Non-contact respiration volume monitoring during sleep. In Proceedings of the Annual International Conference on Mobile Computing and Networking, MOBICOM, New York City, NY, USA, 3–7 October 2016; pp. 27–29. [Google Scholar] [CrossRef]
- Will, C.; Shi, K.; Weigel, R.; Koelpin, A. Advanced Template Matching Algorithm for Instantaneous Heartbeat Detection using Continuous Wave Radar Systems. In Proceedings of the 2017 First IEEE MTT-S International Microwave Bio Conference (IMBIOC), Gothenburg, Sweden, 15–17 May 2017; pp. 1–4. [Google Scholar]
- Shi, K.; Will, C.; Steigleder, T.; Michler, F.; Weigel, R.; Ostgathe, C.; Koelpin, A. A contactless system for continuous vital sign monitoring in palliative and intensive care. In Proceedings of the 12th Annual IEEE International Systems Conference, SysCon 2018, Vancouver, BC, Canada, 23–26 April 2018; pp. 1–8. [Google Scholar] [CrossRef]
- Tang, M.; Kuo, C.; Wun, D.; Wang, F.; Horng, T. A Self- and Mutually Injection-Locked Radar System for Monitoring Vital Signs in Real Time With Random Body Movement Cancellation. IEEE Trans. Microw. Theor. Techniq. 2016, 64, 4812–4822. [Google Scholar] [CrossRef]
- SIMCharacters. SIMCharacters High Emotion Simulation. Available online: https://www.simcharacters.com/jart/prj3/sim/main.jart?rel=de&content-id=1543323934281&reserve-mode=active (accessed on 2 November 2020).
- Laerdal. Premature Anne. Available online: https://laerdal.com/de/products/simulation-training/obstetrics-paediatrics/premature-anne/ (accessed on 11 November 2020).
- BabySIM User Guide. Available online: https://caehealthcare.com/media/files/User_Guides/BabySIM-User-Guide.pdf (accessed on 19 November 2020).
- XeThru Bot Simulates Breathing for Sensor Testing: Built from Lego. Available online: https://www.eenewseurope.com/news/xethru-bot-simulates-breathing-sensor-testing-built-lego (accessed on 2 November 2020).
- Innovativer Inkubator für Frühgeborene (SINOPE-NEO). Available online: https://www.gesundheitsforschung-bmbf.de/de/innovativer-inkubator-fur-fruhgeborene-sinope-neo-8623.php (accessed on 2 December 2020).
- pmd FAQ. Available online: https://pmdtec.com/picofamily/faq/ (accessed on 19 November 2020).
- May, S. 3D Time-of-Flight Ranging for Robotic Perception in Dynamic Environments. Ph.D. Thesis, University of Osnabrück, Düsseldorf, Germany, 2009. [Google Scholar]
- Lange, R. 3D Time-of-Flight Distance Measurement with Custom Solid-State Image Sensors in CMOS/CCD-Technology. Ph.D. Thesis, Universität Siegen, Siegen, Germany, 2000. [Google Scholar]
- Rusu, R.B.; Marton, Z.C.; Blodow, N.; Dolha, M.; Beetz, M. Towards 3D Point cloud based object maps for household environments. Robot. Autonom. Syst. 2008, 56, 927–941. [Google Scholar] [CrossRef]
- Ramachandran, G.; Singh, M. Three-dimensional reconstruction of cardiac displacement patterns on the chest wall during the P, QRS and T-segments of the ECG by laser speckle inteferometry. Med. Biol. Eng. Comput. 1989, 27, 525–530. [Google Scholar] [CrossRef]
- Betts, J.; Desaix, P.; Johnson, E.; Johnson, J.; Korol, O.; Kruse, D.; Poe, B.; College, O.; Wise, J.; Womble, M.; et al. Anatomy & Physiology; Open Textbook Library, OpenStax; Rice University: Houston, TX, USA, 2013. [Google Scholar]
- Reimann, K. Interview: “Das Herz eines Neugeborenen ist nicht größer als eine Walnuss”. Available online: http://www.gesundheitsberater-berlin.de/praxis/krankheiten-von-a-z/kardiologie-fur-kinder/interview-das-herz-eines-neugeborenen-ist-nicht-grosser-als-eine-walnuss--2 (accessed on 23 February 2021).
- Glossary, optoCONTROL. Available online: https://www.micro-epsilon.co.uk/service/glossar/optoCONTROL.html (accessed on 25 November 2020).
- Operating Instructions optoCONTROL 2520. Available online: https://www.micro-epsilon.co.uk/download/manuals/man--optoCONTROL-2520--en.pdf (accessed on 25 November 2020).
- Wiedemeyer, T. PMD CamBoard Pico Flexx Driver. Available online: https://github.com/code-iai/pico_flexx_driver (accessed on 18 November 2020).
- CamBoard Pico Flexx. Available online: https://pmdtec.com/picofamily/wp-content/uploads/2018/03/PMD_DevKit_Brief_CB_pico_flexx_CE_V0218-1.pdf (accessed on 18 November 2020).
- GUARDIAN—Berührungslose Vitalparameterüberwachung Bietet mehr Lebensqualität für Pflegebedürftige Menschen. Available online: https://www.technik-zum-menschen-bringen.de/projekte/guardian (accessed on 2 December 2020).
- Conrad Components Stereo-Verstärker Bausatz 9 V/DC, 12 V/DC, 18 V/DC 35 W 2 Ohm. Available online: https://www.conrad.de/de/p/conrad-components-stereo-verstaerker-bausatz-9-v-dc-12-v-dc-18-v-dc-35-w-2-1216582.html (accessed on 3 December 2020).
- Visaton FR 10 4 Zoll 10.16 cm Breitband Lautsprecher-Chassis 20 W 4 Ohm. Available online: https://www.conrad.de/de/p/visaton-fr-10-4-zoll-10-16-cm-breitband-lautsprecher-chassis-20-w-4-303634.html (accessed on 3 December 2020).
- High Performance Laser Micrometer. Available online: https://www.micro-epsilon.co.uk/2D_3D/optical-micrometer/micrometer/optoCONTROL_2520/ (accessed on 25 November 2020).
- Plane Model Segmentation. Available online: http://www.pointclouds.org/documentation/tutorials/planar_segmentation.html (accessed on 10 February 2021).
- Module Sample_Consensus. Available online: https://pointclouds.org/documentation/group__sample__consensus.html (accessed on 10 February 2021).
- PCL. pcl::RadiusOutlierRemoval< pcl::PCLPointCloud2 >. Available online: https://pointclouds.org/documentation/classpcl_1_1_radius_outlier_removal_3_01pcl_1_1_p_c_l_point_cloud2_01_4.html (accessed on 10 February 2021).
- Ichim, A.E. pcl::MedianFilter< PointT > Class Template Reference. Available online: https://pointclouds.org/documentation/classpcl_1_1_median_filter.html (accessed on 20 January 2021).
- Find-Peaks. Available online: https://github.com/claydergc/find-peaks (accessed on 10 February 2021).
- Gorry, P.A. General least-squares smoothing and differentiation by the convolution (Savitzky-Golay) method. Anal. Chem. 1990, 62, 570–573. [Google Scholar] [CrossRef]
- C++ Implementation of Savitzky-Golay filtering based on Gram polynomials. Available online: https://github.com/arntanguy/gram_savitzky_golay (accessed on 11 February 2021).
- FFTW. Available online: http://fftw.org/index.html (accessed on 11 February 2021).
- fit_ellipse. Available online: https://www.mathworks.com/matlabcentral/fileexchange/3215-fit_ellipse (accessed on 12 February 2021).


| BPM | Window Size | Polynomial Order |
|---|---|---|
| ≤19 | 11 | 10 |
| 19–32 | 3 | 2 |
| >32 | None | None |
| BPM | Stroke in mm Deep Mode | Stroke in mm Normal Mode |
|---|---|---|
| 5 | 0.305 | 0.136 |
| 10 | 0.644 | 0.273 |
| 20 | 1.344 | 0.589 |
| 30 | 1.965 | 0.928 |
| 40 | 2.591 | 1.285 |
| 45 | 2.797 | 1.394 |
| 50 | 3.047 | 1.66 |
| 55 | 3.285 | 1.72 |
| 60 | 3.472 | 1.917 |
| 80 | 4.068 | 2.481 |
Publisher’s Note: MDPI stays neutral with regard to jurisdictional claims in published maps and institutional affiliations. |
© 2021 by the authors. Licensee MDPI, Basel, Switzerland. This article is an open access article distributed under the terms and conditions of the Creative Commons Attribution (CC BY) license (https://creativecommons.org/licenses/by/4.0/).
Share and Cite
Gleichauf, J.; Herrmann, S.; Hennemann, L.; Krauss, H.; Nitschke, J.; Renner, P.; Niebler, C.; Koelpin, A. Automated Non-Contact Respiratory Rate Monitoring of Neonates Based on Synchronous Evaluation of a 3D Time-of-Flight Camera and a Microwave Interferometric Radar Sensor. Sensors 2021, 21, 2959. https://doi.org/10.3390/s21092959
Gleichauf J, Herrmann S, Hennemann L, Krauss H, Nitschke J, Renner P, Niebler C, Koelpin A. Automated Non-Contact Respiratory Rate Monitoring of Neonates Based on Synchronous Evaluation of a 3D Time-of-Flight Camera and a Microwave Interferometric Radar Sensor. Sensors. 2021; 21(9):2959. https://doi.org/10.3390/s21092959
Chicago/Turabian StyleGleichauf, Johanna, Sven Herrmann, Lukas Hennemann, Hannes Krauss, Janina Nitschke, Philipp Renner, Christine Niebler, and Alexander Koelpin. 2021. "Automated Non-Contact Respiratory Rate Monitoring of Neonates Based on Synchronous Evaluation of a 3D Time-of-Flight Camera and a Microwave Interferometric Radar Sensor" Sensors 21, no. 9: 2959. https://doi.org/10.3390/s21092959