Is a Wearable Sensor-Based Characterisation of Gait Robust Enough to Overcome Differences Between Measurement Protocols? A Multi-Centric Pragmatic Study in Patients with Multiple Sclerosis

 , , ,
, , ,
Abstract
:1. Introduction
2. Materials and Methods
2.1. Participants
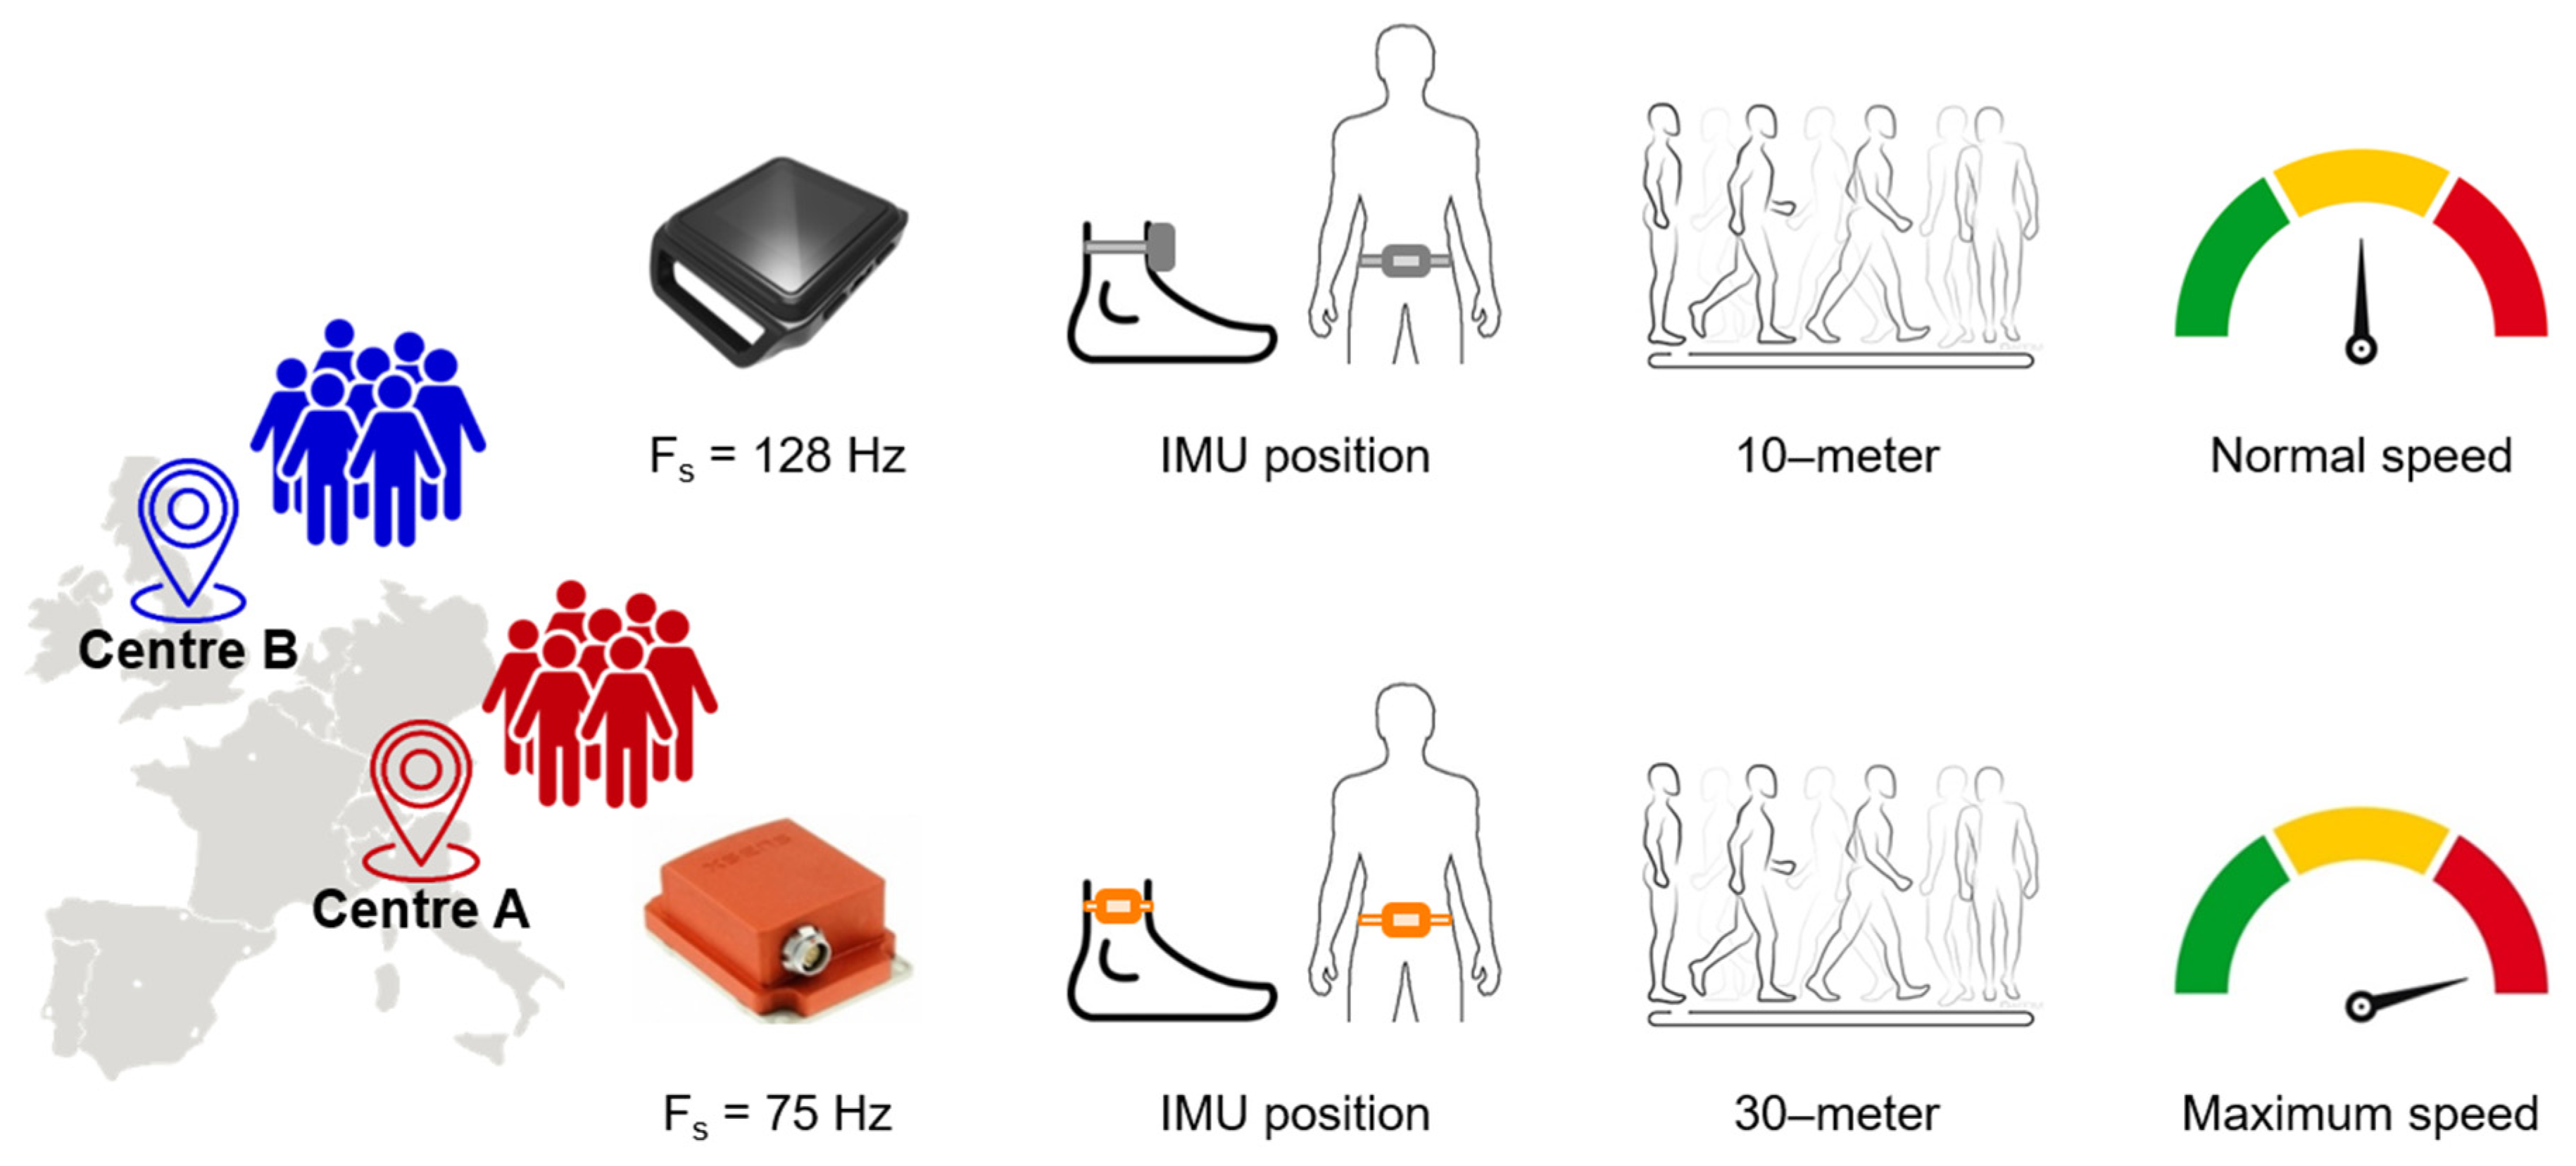
2.2. Experimental Protocol
2.3. Data Processing
2.4. Statistical Analysis
3. Results
3.1. Effect of Sampling Frequency
3.2. Between-Day Test-Retest Reliability
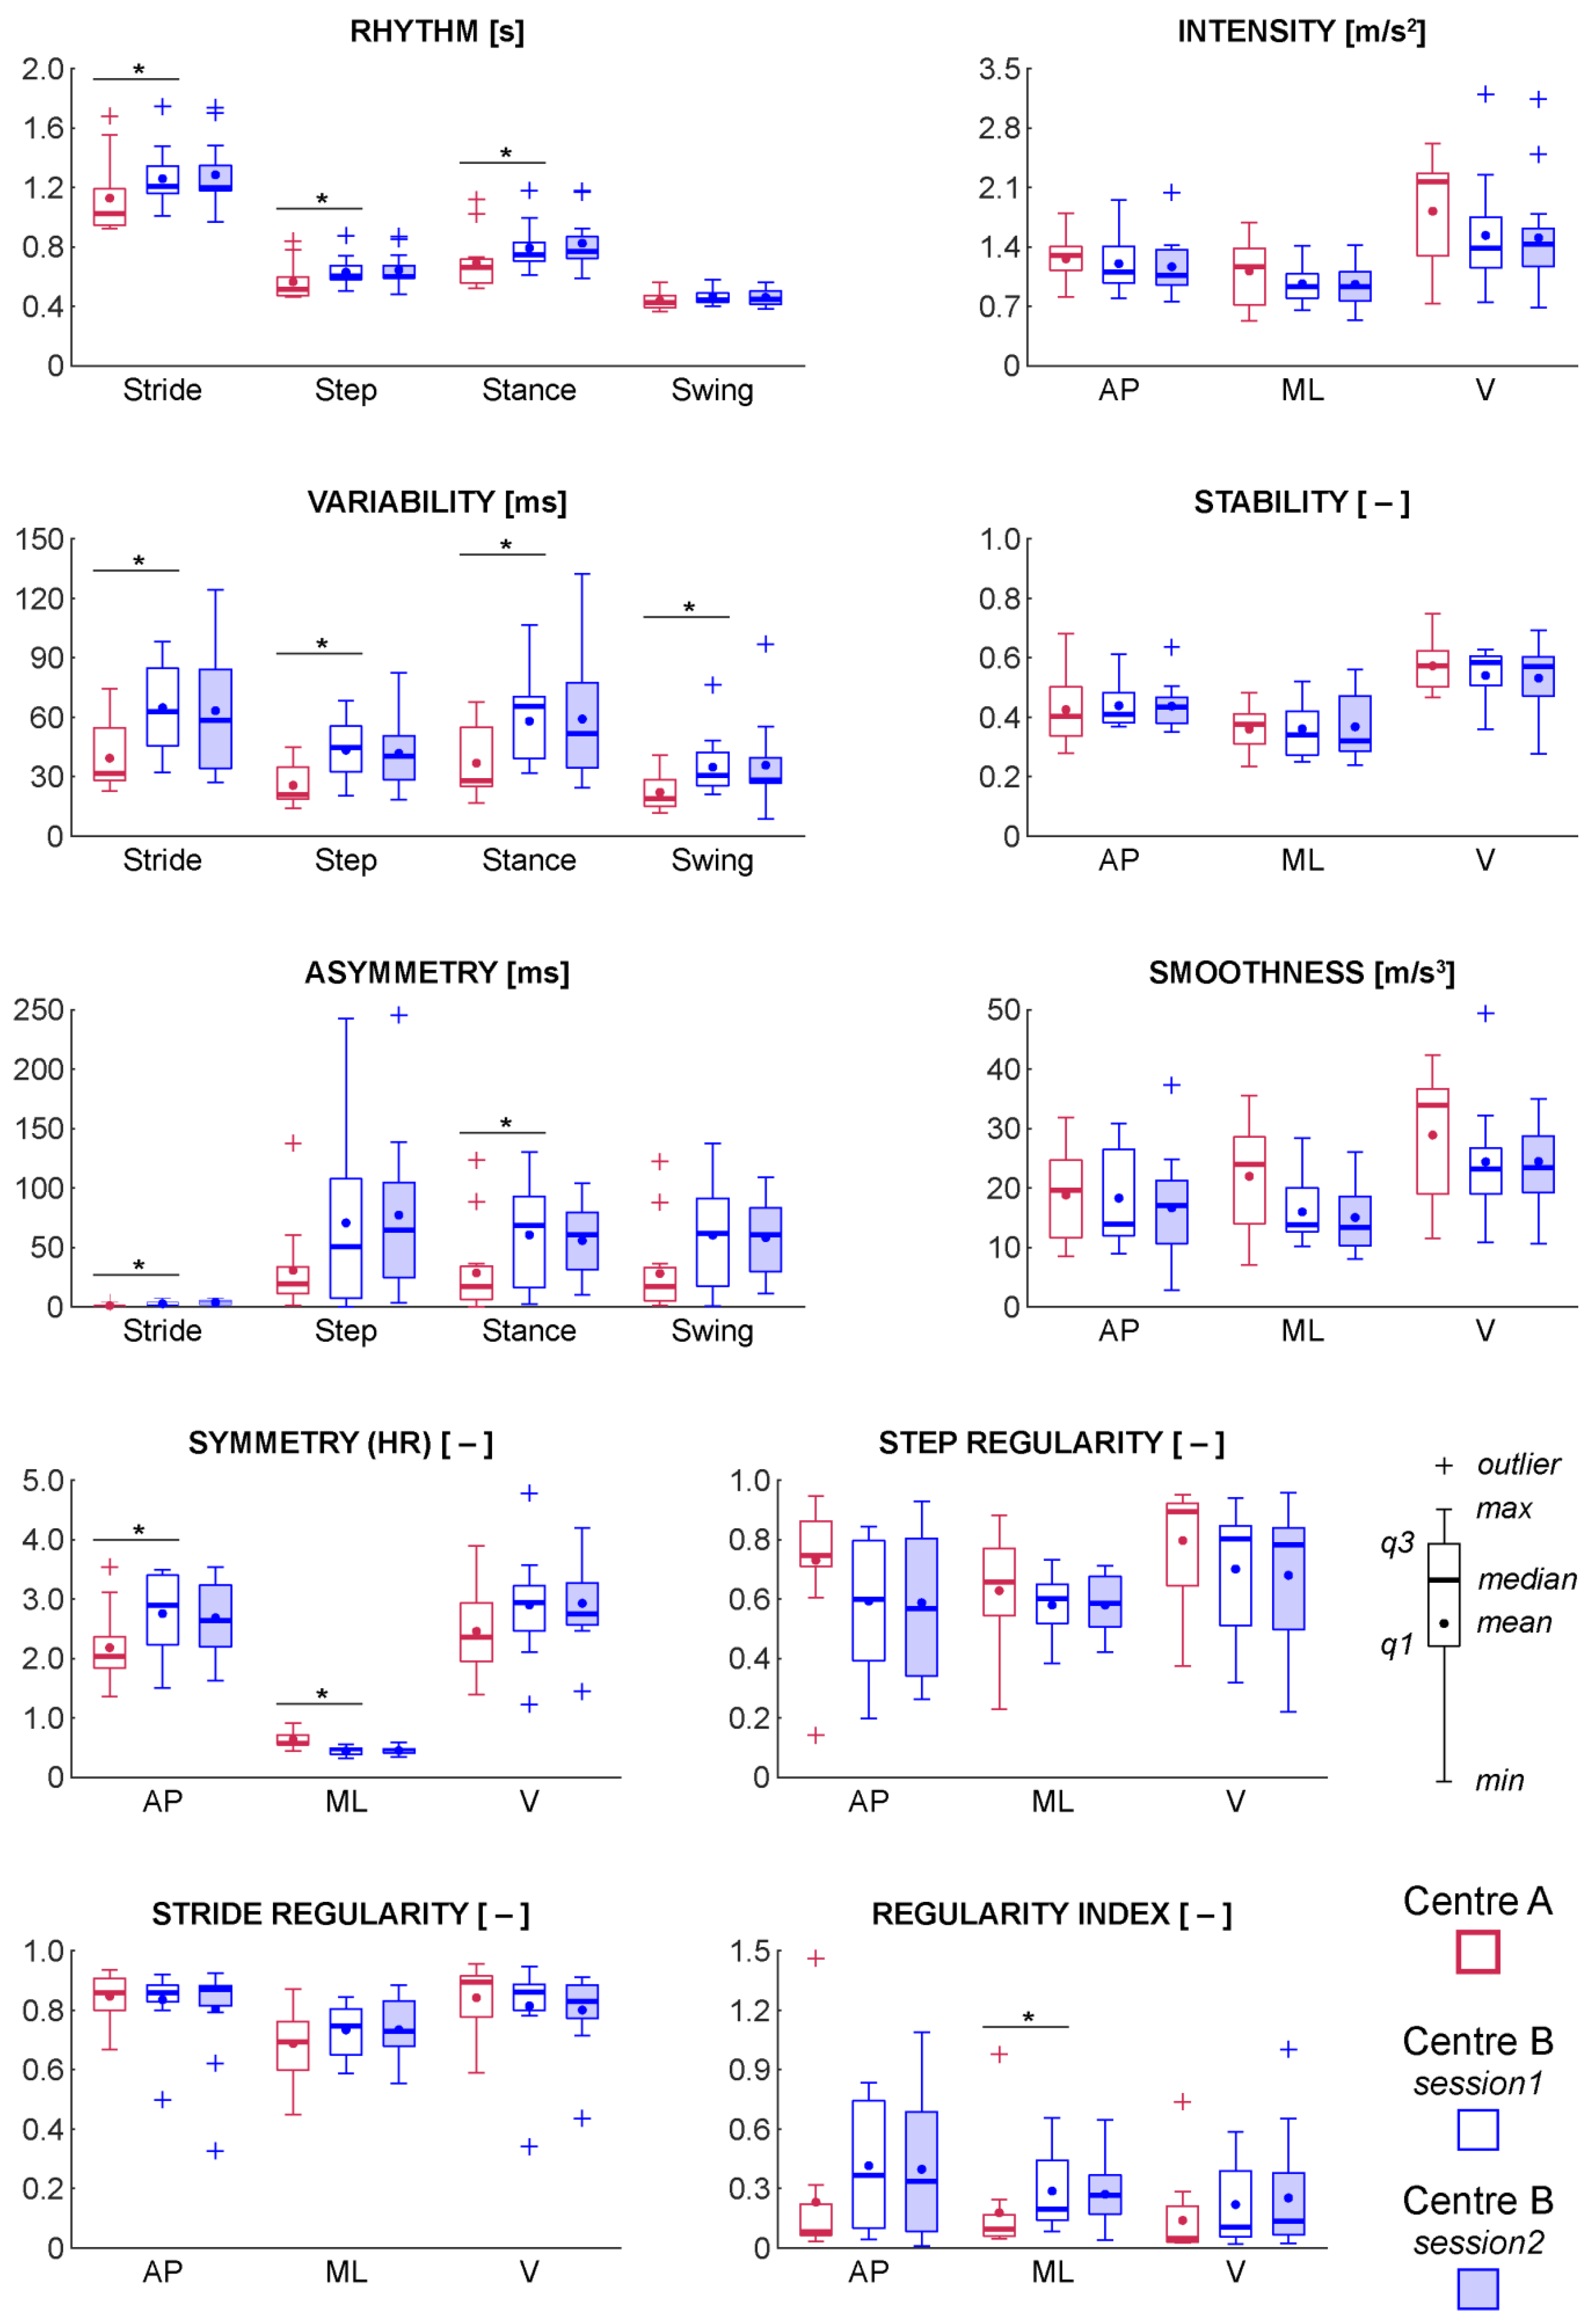
3.3. Between-Centre Differences
4. Discussion
5. Conclusions
Author Contributions
Funding
Acknowledgments
Conflicts of Interest
Data Availability
References
- Browne, P.; Chandraratna, D.; Angood, C.; Tremlett, H.; Baker, C.; Taylor, B.V.; Thompson, A.J. Atlas of Multiple Sclerosis 2013: A growing global problem with widespread inequity. Neurology 2014, 83, 1022–1024. [Google Scholar] [CrossRef] [Green Version]
- Pugliatti, M.; Rosati, G.; Carton, H.; Riise, T.; Drulovic, J.; Vécsei, L.; Milanov, I. The epidemiology of multiple sclerosis in Europe. Eur. J. Neurol. 2006, 13, 700–722. [Google Scholar] [CrossRef] [Green Version]
- Cattaneo, D.; Lamers, I.; Bertoni, R.; Feys, P.; Jonsdottir, J. Participation Restriction in People with Multiple Sclerosis: Prevalence and Correlations With Cognitive, Walking, Balance, and Upper Limb Impairments. Arch. Phys. Med. Rehabil. 2017, 98, 1308–1315. [Google Scholar] [CrossRef]
- Martin, C.L.; Phillips, B.A.; Kilpatrick, T.J.; Butzkueven, H.; Tubridy, N.; McDonald, E.; Galea, M.P. Gait and balance impairment in early multiple sclerosis in the absence of clinical disability. Mult. Scler. J. 2006, 12, 620–628. [Google Scholar] [CrossRef]
- LaRocca, N.G. Impact of Walking Impairment in Multiple Sclerosis. Patient Patient-Cent. Outcomes Res. 2011, 4, 189–201. [Google Scholar] [CrossRef]
- Donzé, C. Update on rehabilitation in multiple sclerosis. La Presse Med. 2015, 44, e169–e176. [Google Scholar] [CrossRef]
- Kurtzke, J.F. Rating neurologic impairment in multiple sclerosis. Neurology 1983, 33, 1444. [Google Scholar] [CrossRef] [Green Version]
- Sebastião, E.; Sandroff, B.M.; Learmonth, Y.C.; Motl, R.W. Validity of the Timed Up and Go Test as a Measure of Functional Mobility in Persons with Multiple Sclerosis. Arch. Phys. Med. Rehabil. 2016, 97, 1072–1077. [Google Scholar] [CrossRef]
- Phan-Ba, R.; Pace, A.; Calay, P.; Grodent, P.; Douchamps, F.; Hyde, R.; Hotermans, C.; Delvaux, V.; Hansen, I.; Moonen, G.; et al. Comparison of the timed 25-foot and the 100-meter walk as performance measures in multiple sclerosis. Neurorehabil. Neural Repair. 2011, 25, 672–679. [Google Scholar] [CrossRef]
- Goldman, M.D.; Marrie, R.A.; Cohen, J.A. Evaluation of the six-minute walk in multiple sclerosis subjects and healthy controls. Mult. Scler. J. 2008, 14, 383–390. [Google Scholar] [CrossRef]
- Horak, F.; King, L.; Mancini, M. Role of body-worn movement monitor technology for balance and gait rehabilitation. Phys. Ther. 2015, 95, 461–470. [Google Scholar] [CrossRef] [Green Version]
- Kaufman, M.; Moyer, D.; Norton, J. The significant change for the Timed 25-Foot Walk in the Multiple Sclerosis Functional Composite. Mult. Scler. J. 2000, 6, 286–290. [Google Scholar] [CrossRef]
- Kragt, J.J.; van der Linden, F.A.; Nielsen, J.M.; Uitdehaag, B.M.; Polman, C.H. Clinical impact of 20% worsening on Timed 25-foot Walk and 9-hole Peg Test in multiple sclerosis. Mult. Scler. J. 2006, 12, 594–598. [Google Scholar] [CrossRef]
- Nieuwenhuis, M.M.; Van Tongeren, H.; Sorensen, P.S.; Ravnborg, M. The six spot step test: A new measurement for walking ability in multiple sclerosis. Mult. Scler. J. 2006, 12, 495–500. [Google Scholar] [CrossRef]
- Spain, R.I.; St. George, R.J.; Salarian, A.; Mancini, M.; Wagner, J.M.; Horak, F.B.; Bourdette, D. Body-worn motion sensors detect balance and gait deficits in people with multiple sclerosis who have normal walking speed. Gait Posture 2012, 35, 573–578. [Google Scholar] [CrossRef] [Green Version]
- Liparoti, M.; Della Corte, M.; Rucco, R.; Sorrentino, P.; Sparaco, M.; Capuano, R.; Minino, R.; Lavorgna, L.; Agosti, V.; Sorrentino, G.; et al. Gait abnormalities in minimally disabled people with Multiple Sclerosis: A 3D-motion analysis study. Mult. Scler. Relat. Disord. 2019, 29, 100–107. [Google Scholar] [CrossRef]
- Pau, M.; Mandaresu, S.; Pilloni, G.; Porta, M.; Coghe, G.; Marrosu, M.G.; Cocco, E. Smoothness of gait detects early alterations of walking in persons with multiple sclerosis without disability. Gait Posture 2017, 58, 307–309. [Google Scholar] [CrossRef]
- Muro-de-la-Herran, A.; Garcia-Zapirain, B.; Mendez-Zorrilla, A. Gait analysis methods: an overview of wearable and non-wearable systems, highlighting clinical applications. Sensors 2014, 14, 3362–3394. [Google Scholar] [CrossRef] [Green Version]
- Vienne-Jumeau, A.; Quijoux, F.; Vidal, P.P.; Ricard, D. Wearable inertial sensors provide reliable biomarkers of disease severity in multiple sclerosis: A systematic review and meta-analysis. Ann. Phys. Rehabil. Med. 2019. [Google Scholar] [CrossRef]
- Vienne, A.; Barrois, R.P.; Buffat, S.; Ricard, D.; Vidal, P.P. Inertial Sensors to Assess Gait Quality in Patients with Neurological Disorders: A Systematic Review of Technical and Analytical Challenges. Front. Psychology 2017, 8, 817. [Google Scholar] [CrossRef] [Green Version]
- Motl, R.W.; Pilutti, L.; Sandroff, B.M.; Dlugonski, D.; Sosnoff, J.J.; Pula, J.H. Accelerometry as a measure of walking behavior in multiple sclerosis. Acta Neurol. Scand. 2013, 127, 384–390. [Google Scholar] [CrossRef]
- Storm, F.A.; Nair, K.P.S.; Clarke, A.J.; Van der Meulen, J.M.; Mazzà, C. Free-living and laboratory gait characteristics in patients with multiple sclerosis. PLoS ONE 2018, 13, e0196463. [Google Scholar] [CrossRef] [Green Version]
- Huisinga, J.M.; Mancini, M.; St George, R.J.; Horak, F.B. Accelerometry reveals differences in gait variability between patients with multiple sclerosis and healthy controls. Ann. Biomed. Eng. 2013, 41, 1670–1679. [Google Scholar] [CrossRef] [Green Version]
- Moon, Y.; Wajda, D.A.; Motl, R.W.; Sosnoff, J.J. Stride-Time Variability and Fall Risk in Persons with Multiple Sclerosis. Mult. Scler. Int. 2015, 2015, 7. [Google Scholar] [CrossRef] [Green Version]
- Motta, C.; Palermo, E.; Studer, V.; Germanotta, M.; Germani, G.; Centonze, D.; Cappa, P.; Rossi, S.; Rossi, S. Disability and Fatigue Can Be Objectively Measured in Multiple Sclerosis. PLoS ONE 2016, 11, e0148997. [Google Scholar] [CrossRef]
- Engelhard, M.M.; Dandu, S.R.; Patek, S.D.; Lach, J.C.; Goldman, M.D. Quantifying six-minute walk induced gait deterioration with inertial sensors in multiple sclerosis subjects. Gait Posture 2016, 49, 340–345. [Google Scholar] [CrossRef] [Green Version]
- Psarakis, M.; Greene, D.A.; Cole, M.H.; Lord, S.R.; Hoang, P.; Brodie, M. Wearable technology reveals gait compensations, unstable walking patterns and fatigue in people with multiple sclerosis. Phys. Meas. 2018, 39, 075004. [Google Scholar] [CrossRef]
- Moon, Y.; McGinnis, R.S.; Seagers, K.; Motl, R.W.; Sheth, N.; Wright, J.A., Jr.; Ghaffari, R.; Sosnoff, J.J. Monitoring gait in multiple sclerosis with novel wearable motion sensors. PLoS ONE 2017, 12, e0171346. [Google Scholar] [CrossRef]
- Craig, J.J.; Bruetsch, A.P.; Lynch, S.G.; Huisinga, J.M. The relationship between trunk and foot acceleration variability during walking shows minor changes in persons with multiple sclerosis. Clin. Biomech. 2017, 49, 16–21. [Google Scholar] [CrossRef]
- Corporaal, S.H.A.; Gensicke, H.; Kuhle, J.; Kappos, L.; Allum, J.H.J.; Yaldizli, Ö. Balance control in multiple sclerosis: Correlations of trunk sway during stance and gait tests with disease severity. Gait Posture 2013, 37, 55–60. [Google Scholar] [CrossRef]
- Anastasi, D.; Carpinella, I.; Gervasoni, E.; Matsuda, P.N.; Bovi, G.; Ferrarin, M.; Cattaneo, D. Instrumented Version of the Modified Dynamic Gait Index in Patients with Neurologic Disorders. PM&R 2019. [Google Scholar] [CrossRef]
- Pau, M.; Corona, F.; Pilloni, G.; Porta, M.; Coghe, G.; Cocco, E. Texting while walking differently alters gait patterns in people with multiple sclerosis and healthy individuals. Mult. Scler. Relat. Disord. 2018, 19, 129–133. [Google Scholar] [CrossRef]
- Carpinella, I.; Gervasoni, E.; Anastasi, D.; Lencioni, T.; Cattaneo, D.; Ferrarin, M. Instrumental Assessment of Stair Ascent in People with Multiple Sclerosis, Stroke, and Parkinson’s Disease: A Wearable-Sensor-Based Approach. IEEE Trans. Neural Syst. Rehabil. Eng. 2018, 26, 2324–2332. [Google Scholar] [CrossRef]
- Craig, J.J.; Bruetsch, A.P.; Lynch, S.G.; Horak, F.B.; Huisinga, J.M. Instrumented balance and walking assessments in persons with multiple sclerosis show strong test-retest reliability. J. Neuroeng. Rehabil. 2017, 14, 43. [Google Scholar] [CrossRef]
- Riva, F.; Grimpampi, E.; Mazzà, C.; Stagni, R. Are gait variability and stability measures influenced by directional changes? Biomed. Eng. Online 2014, 13, 56. [Google Scholar] [CrossRef] [Green Version]
- Brønd, J.C.; Arvidsson, D. Sampling frequency affects the processing of Actigraph raw acceleration data to activity counts. J. Appl. Physiol. 2015, 120, 362–369. [Google Scholar] [CrossRef] [Green Version]
- England, S.A.; Granata, K.P. The influence of gait speed on local dynamic stability of walking. Gait Posture 2007, 25, 172–178. [Google Scholar] [CrossRef] [Green Version]
- Brodie, M.A.D.; Menz, H.B.; Lord, S.R. Age-associated changes in head jerk while walking reveal altered dynamic stability in older people. Exp. Brain Res. 2014, 232, 51–60. [Google Scholar] [CrossRef]
- Mazzà, C.; Iosa, M.; Pecoraro, F.; Cappozzo, A. Control of the upper body accelerations in young and elderly women during level walking. J. Neuroengineering Rehabil. 2008, 5, 30. [Google Scholar] [CrossRef] [Green Version]
- Brach, J.S.; McGurl, D.; Wert, D.; Vanswearingen, J.M.; Perera, S.; Cham, R.; Studenski, S. Validation of a measure of smoothness of walking. J. Gerontology. Ser. A Biol. Sci. Med. Sci. 2010, 66, 136–141. [Google Scholar] [CrossRef]
- Helbostad, J.L.; Moe-Nilssen, R. The effect of gait speed on lateral balance control during walking in healthy elderly. Gait Posture 2003, 18, 27–36. [Google Scholar] [CrossRef]
- Rabuffetti, M.; Scalera, M.G.; Ferrarin, M. Effects of Gait Strategy and Speed on Regularity of Locomotion Assessed in Healthy Subjects Using a Multi-Sensor Method. Sensors 2019, 19, 513. [Google Scholar] [CrossRef] [PubMed] [Green Version]
- Latt, M.D.; Menz, H.B.; Fung, V.S.; Lord, S.R. Walking speed, cadence and step length are selected to optimize the stability of head and pelvis accelerations. Exp. Brain Res. 2008, 184, 201–209. [Google Scholar] [CrossRef]
- Menz, H.B.; Lord, S.R.; Fitzpatrick, R.C. Acceleration patterns of the head and pelvis when walking on level and irregular surfaces. Gait Posture 2003, 18, 35–46. [Google Scholar] [CrossRef]
- Lowry, K.A.; Lokenvitz, N.; Smiley-Oyen, A.L. Age- and speed-related differences in harmonic ratios during walking. Gait Posture 2012, 35, 272–276. [Google Scholar] [CrossRef]
- Pecoraro, F.; Mazzà, C.; Cappozzo, A.; Thomas, E.E.; Macaluso, A. Reliability of the intrinsic and extrinsic patterns of level walking in older women. Gait Posture 2007, 26, 386–392. [Google Scholar] [CrossRef]
- Cappozzo, A. Analysis of the linear displacement of the head and trunk during walking at different speeds. J. Biomech. 1981, 14, 411–425. [Google Scholar] [CrossRef]
- Moe-Nilssen, R. A new method for evaluating motor control in gait under real-life environmental conditions. Part 1: The instrument. Clin. Biomech. 1998, 13, 320–327. [Google Scholar] [CrossRef]
- Salarian, A.; Horak, F.B.; Zampieri, C.; Carlson-Kuhta, P.; Nutt, J.G.; Aminian, K. iTUG, a Sensitive and Reliable Measure of Mobility. IEEE Trans. Neural Syst. Rehabil. Eng. 2010, 18, 303–310. [Google Scholar] [CrossRef] [Green Version]
- Killick, R.; Fearnhead, P.; Eckley, I.A. Optimal Detection of Changepoints With a Linear Computational Cost. J. Am. Stat. Assoc. 2012, 107, 1590–1598. [Google Scholar] [CrossRef]
- Palmerini, L.; Rocchi, L.; Mazilu, S.; Gazit, E.; Hausdorff, J.M.; Chiari, L. Identification of Characteristic Motor Patterns Preceding Freezing of Gait in Parkinson’s Disease Using Wearable Sensors. Front. Neurol. 2017, 8, 394. [Google Scholar] [CrossRef] [PubMed] [Green Version]
- Lord, S.; Galna, B.; Rochester, L. Moving forward on gait measurement: toward a more refined approach. Movement Disorders 2013, 28, 1534–1543. [Google Scholar] [CrossRef] [PubMed]
- Buckley, C.; Galna, B.; Rochester, L.; Mazzà, C. Upper body accelerations as a biomarker of gait impairment in the early stages of Parkinson’s disease. Gait Posture 2019, 71, 289–295. [Google Scholar] [CrossRef] [PubMed]
- Salarian, A.; Russmann, H.; Vingerhoets, F.J.; Dehollain, C.; Blanc, Y.; Burkhard, P.R.; Aminian, K. Gait assessment in Parkinson’s disease: toward an ambulatory system for long-term monitoring. IEEE Trans. Biomed. Eng. 2004, 51, 1434–1443. [Google Scholar] [CrossRef] [PubMed]
- Galna, B.; Lord, S.; Rochester, L. Is gait variability reliable in older adults and Parkinson’s disease? Towards an optimal testing protocol. Gait Posture 2013, 37, 580–585. [Google Scholar] [CrossRef]
- Godfrey, A.; Del Din, S.; Barry, G.; Mathers, J.C.; Rochester, L. Instrumenting gait with an accelerometer: A system and algorithm examination. Med. Eng. Phys. 2015, 37, 400–407. [Google Scholar] [CrossRef]
- Pasciuto, I.; Bergamini, E.; Iosa, M.; Vannozzi, G.; Cappozzo, A. Overcoming the limitations of the Harmonic Ratio for the reliable assessment of gait symmetry. J. Biomech. 2017, 53, 84–89. [Google Scholar] [CrossRef]
- Sekine, M.; Tamura, T.; Yoshida, M.; Suda, Y.; Kimura, Y.; Miyoshi, H.; Kijima, Y.; Higashi, Y.; Fujimoto, T. A gait abnormality measure based on root mean square of trunk acceleration. J. Neuroeng. Rehabil. 2013, 10, 118. [Google Scholar] [CrossRef] [Green Version]
- Fazio, P.; Granieri, G.; Casetta, I.; Cesnik, E.; Mazzacane, S.; Caliandro, P.; Pedrielli, F.; Granieri, E. Gait measures with a triaxial accelerometer among patients with neurological impairment. Neurol. Sci. 2013, 34, 435–440. [Google Scholar] [CrossRef]
- Gage, S.H. Microscopy in America (1830–1945). Trans. Am. Microsc. Soc. 1964, 83, 1–125. [Google Scholar] [CrossRef]
- Smidt, G.L.; Arora, J.S.; Johnston, R.C. Accelerographic analysis of several types of walking. Am. J. Phys. Med. Rehabil. 1971, 50, 285–300. [Google Scholar]
- Moe-Nilssen, R.; Helbostad, J.L. Estimation of gait cycle characteristics by trunk accelerometry. J. Biomech. 2004, 37, 121–126. [Google Scholar] [CrossRef]
- R Core Team. R: A Language and Environment for Statistical Computing; R Foundation for Statistical Computing: Vienna, Austria; Available online: http://cran.fhcrc.org/web/packages/dplR/vignettes/intro-dplR.pdf (accessed on 20 December 2019).
- Li, L.; Zeng, L.; Lin, Z.-J.; Cazzell, M.; Liu, H. Tutorial on use of intraclass correlation coefficients for assessing intertest reliability and its application in functional near-infrared spectroscopy–based brain imaging. J. Biomed. Opt. 2015, 20, 050801. [Google Scholar] [CrossRef] [PubMed]
- Cicchetti, D.V. Methodological Commentary The Precision of Reliability and Validity Estimates Re-Visited: Distinguishing Between Clinical and Statistical Significance of Sample Size Requirements. J. Clin. Exp. Neuropsychology 2001, 23, 695–700. [Google Scholar] [CrossRef]
- Almarwani, M.; Perera, S.; VanSwearingen, J.M.; Sparto, P.J.; Brach, J.S. The test–retest reliability and minimal detectable change of spatial and temporal gait variability during usual over-ground walking for younger and older adults. Gait Posture 2016, 44, 94–99. [Google Scholar] [CrossRef] [Green Version]
- Cohen, J. CHAPTER 3—The Significance of a Product Moment rs. In Statistical Power Analysis for the Behavioral Sciences; Available online: http://www.utstat.toronto.edu/~brunner/oldclass/378f16/readings/CohenPower.pdf (accessed on 20 December 2019).
- Compston, A.; Coles, A. Multiple sclerosis. Lancet 2008, 372, 1502–1517. [Google Scholar] [CrossRef]
- Dujmovic, I.; Radovanovic, S.; Martinovic, V.; Dackovic, J.; Maric, G.; Mesaros, S.; Pekmezovic, T.; Kostic, V.; Drulovic, J. Gait pattern in patients with different multiple sclerosis phenotypes. Mult. Scler. Relat. Disord. 2017, 13, 13–20. [Google Scholar] [CrossRef]
- Cole, M.H.; Sweeney, M.; Conway, Z.J.; Blackmore, T.; Silburn, P.A. Imposed Faster and Slower Walking Speeds Influence Gait Stability Differently in Parkinson Fallers. Arch. Phys. Med. Rehabil. 2017, 98, 639–648. [Google Scholar] [CrossRef] [Green Version]
- Riva, F.; Bisi, M.C.; Stagni, R. Gait variability and stability measures: Minimum number of strides and within-session reliability. Comput. Biol. Med. 2014, 50, 9–13. [Google Scholar] [CrossRef]
- Shema-Shiratzky, S.; Gazit, E.; Sun, R.; Regev, K.; Karni, A.; Sosnoff, J.J.; Herman, T.; Mirelman, A.; Hausdorff, J.M. Deterioration of specific aspects of gait during the instrumented 6-min walk test among people with multiple sclerosis. J. Neurol. 2019, 266, 3022–3030. [Google Scholar] [CrossRef]

| Centre A (n = 13) | Centre B (n = 13) | Statistics | |
|---|---|---|---|
| Age [years] | 51 (35–63) | 57 (34–64) | U = 58, p = 0.18 |
| Gender [men/women] | 3/10 | 3/10 | X2(1) = 0.00, p = 1.00 |
| EDSS score (0–10) | 4.5 (2.0–6.5) | 4.5 (2.5–6.5) | U = 83, p = 0.93 |
| Mild (2.0–2.5) | 1 | 1 | |
| Moderate (3.0–4.5) | 6 | 6 | |
| Severe (5.0–6.5) | 6 | 6 | |
| Assistive devices | |||
| Walker | 1 pwMS | 1 pwMS | – |
| Cane | 2 pwMS | 2 pwMS | – |
| Walking speed [m/s] | 1.1 (0.5–1.4) | 0.7 (0.4–1.0) | U = 31, p < 0.01 * |
| Domain | Fs of 128 Hz | Fs of 75 Hz | z | p | r |
|---|---|---|---|---|---|
| Rhythm [s] | |||||
| Stride duration | 1.20 (1.01–1.74) | 1.21 (1.01–1.74) | −0.82 | 0.41 | −0.16 |
| Step duration | 0.60 (0.51–0.87) | 0.60 (0.50–0.87) | 0.00 | 1.00 | 0.00 |
| Stance duration | 0.75 (0.61–1.18) | 0.75 (0.61–1.18) | −1.83 | 0.07 | −0.36 |
| Swing duration | 0.44 (0.40–0.58) | 0.44 (0.40–0.58) | −1.85 | 0.06 | −0.36 |
| Variability [ms] | |||||
| Stride duration | 61 (32–100) | 63 (32–98) | −1.55 | 0.12 | −0.30 |
| Step duration | 46 (20–69) | 45 (20–68) | −1.33 | 0.18 | −0.26 |
| Stance duration | 65 (34–105) | 65 (32–106) | −0.18 | 0.86 | −0.04 |
| Swing duration | 29 (23–74) | 30 (21–76) | −0.41 | 0.68 | −0.08 |
| Asymmetry [ms] | |||||
| Stride duration | 2 (0–7) | 2 (1–7) | −0.09 | 0.93 | −0.02 |
| Step duration | 56 (0–238) | 51 (0–242) | −1.49 | 0.14 | −0.29 |
| Stance duration | 61 (3–149) | 69 (2–130) | −1.58 | 0.11 | −0.31 |
| Swing duration | 54 (1–155) | 62 (0–138) | −1.33 | 0.18 | −0.26 |
| Intensity [m/s2] | |||||
| Antero-Posterior | 1.10 (0.80–1.96) | 1.10 (0.80–1.95) | −0.94 | 0.34 | −0.19 |
| Medio-Lateral | 0.93 (0.65–1.41) | 0.93 (0.65–1.41) | −1.44 | 0.15 | −0.28 |
| Vertical | 1.37 (0.76–3.16) | 1.38 (0.75–3.20) | −1.28 | 0.20 | −0.25 |
| Stability [–] | |||||
| Antero-Posterior | 0.41 (0.37–0.61) | 0.41 (0.37–0.61) | −0.30 | 0.77 | −0.06 |
| Medio-Lateral | 0.34 (0.25–0.52) | 0.34 (0.25–0.52) | −0.89 | 0.37 | −0.18 |
| Vertical | 0.58 (0.36–0.62) | 0.58 (0.36–0.63) | −0.29 | 0.77 | −0.06 |
| Smoothness [m/s3] | |||||
| Antero-Posterior | 13.97 (8.86–30.75) | 13.95 (8.93–30.82) | 0.00 | 1.00 | 0.00 |
| Medio-Lateral | 13.92 (10.13–28.61) | 13.87 (10.19–28.45) | −1.06 | 0.29 | −0.21 |
| Vertical | 23.31 (11.06–48.81) | 23.21 (10.89–49.38) | −0.75 | 0.45 | −0.15 |
| Symmetry (HR) [–] | |||||
| Antero-Posterior | 2.94 (1.49–3.73) | 2.89 (1.50–3.49) | −2.32 | 0.02 * | −0.45 |
| Medio-Lateral | 0.44 (0.32–0.56) | 0.45 (0.32–0.56) | −2.19 | 0.03 * | −0.43 |
| Vertical | 3.01 (1.21–4.84) | 2.94 (1.23–4.78) | −3.01 | 0.00 * | −0.59 |
| Regularity [–] | |||||
| Step regularity | |||||
| Antero-Posterior | 0.60 (0.20–0.85) | 0.60 (0.20–0.84) | −1.70 | 0.09 | −0.33 |
| Medio-Lateral | −0.62 (−0.74–−0.37) | −0.60 (−0.73–−0.38) | −1.89 | 0.06 | −0.37 |
| Vertical | 0.81 (0.32–0.95) | 0.80 (0.32–0.94) | −1.44 | 0.15 | −0.28 |
| Stride regularity | |||||
| Anterior-Posterior | 0.86 (0.50–0.93) | 0.86 (0.50–0.92) | 0.00 | 1.00 | 0.00 |
| Medio-Lateral | 0.77 (0.58–0.85) | 0.75 (0.59–0.85) | −1.67 | 0.09 | −0.33 |
| Vertical | 0.86 (0.34–0.95) | 0.86 (0.34–0.95) | −1.80 | 0.07 | −0.35 |
| Regularity index | |||||
| Antero-Posterior | 0.37 (0.04–0.82) | 0.37 (0.04–0.83) | −1.10 | 0.27 | −0.22 |
| Medio-Lateral | −0.20 (−0.70–−0.08) | −0.20 (−0.66–−0.08) | −0.41 | 0.68 | −0.08 |
| Vertical | 0.11 (0.02–0.59) | 0.11 (0.02–0.59) | 0.00 | 1.00 | 0.00 |
| Domains | ICC | 95% CI | SEM | MDC | |
|---|---|---|---|---|---|
| Lower | Upper | ||||
| Rhythm [s] | |||||
| Stride duration | 0.97 | 0.90 | 0.99 | 0.04 | 0.10 |
| Step duration | 0.97 | 0.90 | 0.99 | 0.02 | 0.05 |
| Stance duration | 0.96 | 0.86 | 0.99 | 0.03 | 0.09 |
| Swing duration | 0.97 | 0.91 | 0.99 | 0.01 | 0.03 |
| Variability [ms] | |||||
| Stride duration | 0.92 | 0.73 | 0.97 | 8 | 21 |
| Step duration | 0.92 | 0.74 | 0.98 | 5 | 13 |
| Stance duration | 0.94 | 0.80 | 0.98 | 6 | 18 |
| Swing duration | 0.95 | 0.85 | 0.99 | 4 | 11 |
| Asymmetry [ms] | |||||
| Stride duration | 0.72 | 0.13 | 0.91 | 1 | 4 |
| Step duration | 0.98 | 0.93 | 0.99 | 10 | 29 |
| Stance duration | 0.90 | 0.67 | 0.97 | 12 | 33 |
| Swing duration | 0.89 | 0.62 | 0.97 | 13 | 36 |
| Intensity [m/s2] | |||||
| Antero-Posterior | 0.97 | 0.90 | 0.99 | 0.06 | 0.16 |
| Medio-Lateral | 0.98 | 0.93 | 0.99 | 0.04 | 0.11 |
| Vertical | 0.97 | 0.92 | 0.99 | 0.10 | 0.29 |
| Stability [–] | |||||
| Antero-Posterior | 0.93 | 0.78 | 0.98 | 0.02 | 0.05 |
| Medio-Lateral | 0.93 | 0.76 | 0.98 | 0.03 | 0.08 |
| Vertical | 0.91 | 0.69 | 0.97 | 0.03 | 0.09 |
| Smoothness [m/s3] | |||||
| Antero-Posterior | 0.92 | 0.73 | 0.97 | 2.46 | 6.83 |
| Medio-Lateral | 0.93 | 0.79 | 0.98 | 1.55 | 4.29 |
| Vertical | 0.95 | 0.82 | 0.98 | 2.31 | 6.41 |
| Symmetry (HR) [–] | |||||
| Antero-Posterior | 0.95 | 0.85 | 0.99 | 0.14 | 0.38 |
| Medio-Lateral | 0.75 | 0.15 | 0.92 | 0.04 | 0.10 |
| Vertical | 0.92 | 0.74 | 0.98 | 0.21 | 0.59 |
| Regularity [–] | |||||
| Step regularity | |||||
| Antero-Posterior | 0.91 | 0.70 | 0.97 | 0.07 | 0.19 |
| Medio-Lateral | 0.86 | 0.52 | 0.96 | 0.04 | 0.11 |
| Vertical | 0.97 | 0.92 | 0.99 | 0.04 | 0.10 |
| Stride regularity | |||||
| Antero-Posterior | 0.88 | 0.64 | 0.96 | 0.05 | 0.13 |
| Medio-Lateral | 0.85 | 0.50 | 0.96 | 0.04 | 0.10 |
| Vertical | 0.93 | 0.77 | 0.98 | 0.04 | 0.10 |
| Regularity index | |||||
| Antero-Posterior | 0.76 | 0.17 | 0.93 | 0.17 | 0.47 |
| Medio-Lateral | 0.88 | 0.62 | 0.96 | 0.06 | 0.17 |
| Vertical | 0.89 | 0.63 | 0.97 | 0.09 | 0.24 |
| Domain | Centre B (session1) | Centre B (session2) | z | p | r |
|---|---|---|---|---|---|
| Rhythm [s] | |||||
| Stride duration | 1.21 (1.01–1.74) | 1.20 (0.97–1.74) | −0.70 | 0.48 | −0.14 |
| Step duration | 0.60 (0.50–0.87) | 0.60 (0.48–0.87) | −0.56 | 0.58 | −0.11 |
| Stance duration | 0.75 (0.61–1.18) | 0.77 (0.59–1.18) | −1.57 | 0.12 | −0.31 |
| Swing duration | 0.44 (0.40–0.58) | 0.45 (0.38–0.56) | −1.99 | 0.05 | −0.39 |
| Variability [ms] | |||||
| Stride duration | 63 (32–98) | 58 (27–124) | −0.35 | 0.72 | −0.07 |
| Step duration | 45 (20–68) | 40 (18–83) | −0.35 | 0.72 | −0.07 |
| Stance duration | 65 (32–106) | 52 (24–132) | −0.03 | 0.97 | −0.01 |
| Swing duration | 30 (21–76) | 28 (9–97) | −0.53 | 0.60 | −0.10 |
| Asymmetry [ms] | |||||
| Stride duration | 2 (1–7) | 4 (0–7) | −1.34 | 0.18 | −0.26 |
| Step duration | 51 (0–242) | 65 (4–245) | −1.30 | 0.20 | −0.25 |
| Stance duration | 69 (2–130) | 61 (10–104) | −0.52 | 0.60 | −0.10 |
| Swing duration | 62 (0–138) | 61 (12–109) | −0.38 | 0.70 | −0.08 |
| Intensity [m/s2] | |||||
| Antero-Posterior | 1.10 (0.80–1.95) | 1.07 (0.76–2.04) | −1.22 | 0.22 | −0.24 |
| Medio-Lateral | 0.93 (0.65–1.41) | 0.93 (0.53–1.42) | −0.08 | 0.94 | −0.02 |
| Vertical | 1.38 (0.75–3.20) | 1.43 (0.68–3.14) | −0.38 | 0.70 | −0.08 |
| Stability [–] | |||||
| Antero-Posterior | 0.41 (0.37–0.61) | 0.43 (0.35–0.64) | −0.28 | 0.78 | −0.05 |
| Medio-Lateral | 0.34 (0.25–0.52) | 0.32 (0.24–0.56) | 0.00 | 1.00 | 0.00 |
| Vertical | 0.58 (0.36–0.63) | 0.57 (0.28–0.69) | −0.27 | 0.79 | −0.05 |
| Smoothness [m/s3] | |||||
| Antero-Posterior | 13.95 (8.93–30.82) | 17.11 (2.76–37.32) | −1.17 | 0.24 | −0.23 |
| Medio-Lateral | 13.87 (10.19–28.45) | 13.42 (8.04–26.07) | −1.24 | 0.22 | −0.24 |
| Vertical | 23.21 (10.89–49.38) | 23.43 (10.67–50.74) | −0.41 | 0.68 | −0.08 |
| Symmetry (HR) [–] | |||||
| Antero-Posterior | 2.89 (1.50–3.49) | 2.64 (1.62–3.54) | −0.31 | 0.75 | −0.06 |
| Medio-Lateral | 0.45 (0.32–0.56) | 0.46 (0.34–0.59) | −0.82 | 0.41 | −0.16 |
| Vertical | 2.94 (1.23–4.78) | 2.75 (1.45–4.19) | −0.51 | 0.61 | −0.10 |
| Regularity [–] | |||||
| Step regularity | |||||
| Antero-Posterior | 0.60 (0.20–0.84) | 0.57 (0.26–0.93) | −0.12 | 0.91 | −0.02 |
| Medio-Lateral | −0.60 (−0.73–−0.38) | −0.58 (−0.71–−0.42) | −0.07 | 0.94 | −0.01 |
| Vertical | 0.80 (0.32–0.94) | 0.78 (0.22–0.96) | −1.26 | 0.21 | −0.25 |
| Stride regularity | |||||
| Anterior-Posterior | 0.86 (0.50–0.92) | 0.87 (0.33–0.92) | −0.98 | 0.33 | −0.19 |
| Medio-Lateral | 0.75 (0.59–0.85) | 0.73 (0.55–0.88) | −0.03 | 0.97 | −0.01 |
| Vertical | 0.86 (0.34–0.95) | 0.83 (0.44–0.91) | −0.52 | 0.60 | −0.10 |
| Regularity index | |||||
| Antero-Posterior | 0.37 (0.04–0.83) | 0.34 (0.01–1.09) | −0.04 | 0.97 | −0.01 |
| Medio-Lateral | −0.20 (−0.66–−0.08) | −0.27 (−0.65–−0.04) | −0.14 | 0.89 | −0.03 |
| Vertical | 0.11 (0.02–0.59) | 0.14 (0.02–1.00) | −0.43 | 0.67 | −0.08 |
| Domain | Centre A | Centre B | U | p | r |
|---|---|---|---|---|---|
| Rhythm [s] | |||||
| Stride duration | 1.03 (0.92–1.68) | 1.21 (1.01–1.74) | 43.5 | 0.04 * | 0.41 |
| Step duration | 0.51 (0.46–0.84) | 0.60 (0.50–0.87) | 44.0 | 0.04 * | 0.41 |
| Stance duration | 0.66 (0.52–1.12) | 0.75 (0.61–1.18) | 40.0 | 0.02 * | 0.45 |
| Swing duration | 0.43 (0.37–0.56) | 0.44 (0.40–0.58) | 57.0 | 0.17 | 0.28 |
| Variability [ms] | |||||
| Stride duration | 32 (23–74) | 63 (32–98) | 26.0 | 0.00 * | 0.59 |
| Step duration | 21 (14–45) | 45 (20–68) | 27.5 | 0.00 * | 0.57 |
| Stance duration | 28 (17–68) | 65 (32–106) | 30.0 | 0.01 * | 0.55 |
| Swing duration | 19 (12–41) | 30 (21–76) | 33.0 | 0.01 * | 0.52 |
| Asymmetry [ms] | |||||
| Stride duration | 1 (0–4) | 2 (1–7) | 45.0 | 0.04 * | 0.40 |
| Step duration | 19 (1–138) | 51 (0–242) | 68.0 | 0.40 | 0.17 |
| Stance duration | 17 (0–123) | 69 (2–130) | 46.0 | 0.04 * | 0.39 |
| Swing duration | 17 (1–122) | 62 (0–138) | 48.0 | 0.06 | 0.37 |
| Intensity [m/s2] | |||||
| Antero-Posterior | 1.30 (0.81–1.80) | 1.10 (0.80–1.95) | 68.0 | 0.41 | 0.17 |
| Medio-Lateral | 1.17 (0.53–1.69) | 0.93 (0.65–1.41) | 62.0 | 0.26 | 0.23 |
| Vertical | 2.17 (0.73–2.62) | 1.38 (0.75–3.20) | 59.5 | 0.21 | 0.25 |
| Stability [–] | |||||
| Antero-Posterior | 0.40 (0.28–0.68) | 0.41 (0.37–0.61) | 69.0 | 0.44 | 0.16 |
| Medio-Lateral | 0.38 (0.23–0.48) | 0.34 (0.25–0.52) | 83.0 | 0.96 | 0.02 |
| Vertical | 0.57 (0.47–0.75) | 0.58 (0.36–0.63) | 72.5 | 0.55 | 0.12 |
| Smoothness [m/s3] | |||||
| Antero-Posterior | 19.68 (8.56–31.85) | 13.95 (8.93–30.82) | 82.0 | 0.92 | 0.03 |
| Medio-Lateral | 24.01 (7.04–35.54) | 13.87 (10.19–28.45) | 52.5 | 0.11 | 0.32 |
| Vertical | 33.90 (11.56–42.39) | 23.21 (10.89–49.38) | 59.0 | 0.20 | 0.26 |
| Symmetry (HR) [–] | |||||
| Antero-Posterior | 2.04 (1.36–3.54) | 2.89 (1.50–3.49) | 43.5 | 0.04 * | 0.41 |
| Medio-Lateral | 0.57 (0.44–0.91) | 0.45 (0.32–0.56) | 14.0 | 0.00 * | 0.71 |
| Vertical | 2.35 (1.39–3.89) | 2.94 (1.23–4.78) | 52.5 | 0.11 | 0.32 |
| Regularity [–] | |||||
| Step regularity | |||||
| Antero-Posterior | 0.75 (0.14–0.95) | 0.60 (0.20–0.84) | 55.5 | 0.14 | 0.29 |
| Medio-Lateral | −0.66 (−0.88–−0.23) | −0.60 (−0.73–−0.38) | 63.0 | 0.28 | 0.22 |
| Vertical | 0.89 (0.37–0.95) | 0.80 (0.32–0.94) | 51.5 | 0.10 | 0.33 |
| Stride regularity | |||||
| Anterior-Posterior | 0.86 (0.67–0.93) | 0.86 (0.50–0.92) | 81.5 | 0.90 | 0.03 |
| Medio-Lateral | 0.69 (0.45–0.87) | 0.75 (0.59–0.85) | 63.0 | 0.28 | 0.22 |
| Vertical | 0.89 (0.59–0.96) | 0.86 (0.34–0.95) | 72.5 | 0.55 | 0.12 |
| Regularity index | |||||
| Antero-Posterior | 0.08 (0.03–1.46) | 0.37 (0.04–0.83) | 50.0 | 0.08 | 0.35 |
| Medio-Lateral | −0.10 (−0.98–−0.05) | −0.20 (−0.66–−0.08) | 40.5 | 0.03 * | 0.44 |
| Vertical | 0.05 (0.02–0.74) | 0.11 (0.02–0.59) | 51.5 | 0.09 | 0.33 |
© 2019 by the authors. Licensee MDPI, Basel, Switzerland. This article is an open access article distributed under the terms and conditions of the Creative Commons Attribution (CC BY) license (http://creativecommons.org/licenses/by/4.0/).
Share and Cite
Angelini, L.; Carpinella, I.; Cattaneo, D.; Ferrarin, M.; Gervasoni, E.; Sharrack, B.; Paling, D.; Nair, K.P.S.; Mazzà, C. Is a Wearable Sensor-Based Characterisation of Gait Robust Enough to Overcome Differences Between Measurement Protocols? A Multi-Centric Pragmatic Study in Patients with Multiple Sclerosis. Sensors 2020, 20, 79. https://doi.org/10.3390/s20010079
Angelini L, Carpinella I, Cattaneo D, Ferrarin M, Gervasoni E, Sharrack B, Paling D, Nair KPS, Mazzà C. Is a Wearable Sensor-Based Characterisation of Gait Robust Enough to Overcome Differences Between Measurement Protocols? A Multi-Centric Pragmatic Study in Patients with Multiple Sclerosis. Sensors. 2020; 20(1):79. https://doi.org/10.3390/s20010079
Chicago/Turabian StyleAngelini, Lorenza, Ilaria Carpinella, Davide Cattaneo, Maurizio Ferrarin, Elisa Gervasoni, Basil Sharrack, David Paling, Krishnan Padmakumari Sivaraman Nair, and Claudia Mazzà. 2020. "Is a Wearable Sensor-Based Characterisation of Gait Robust Enough to Overcome Differences Between Measurement Protocols? A Multi-Centric Pragmatic Study in Patients with Multiple Sclerosis" Sensors 20, no. 1: 79. https://doi.org/10.3390/s20010079