Sintering Conditions
The effects of sintering the MnZn ferrite pastes in air and vacuum have both been investigated. The sintering in air was conducted using a 6-zone belt furnace, according to the four different settings described in table 1. The belt speed was set at one inch/minute to allow the pastes to adjust to the changing temperature. Firing in vacuum was conducted using a vacuum tube furnace. The settings are shown in table 2. Initially, the pastes were heated in air at a ramp rate of 5°C/minute. There was a dwell time of 15 minutes while the vacuum was being created. The pastes were then sintered in vacuum at the same ramp rate.
Table 1.
Four different oven settings for sintering in air.
Table 1.
Four different oven settings for sintering in air.
| | Zone1/°C | Zone2/°C | Zone3/°C | Zone4/°C | Zone5/°C | Zone6/°C |
|---|
| 1 st | 200 | 250 | 400 | 400 | 350 | 300 |
| 2 nd | 250 | 350 | 600 | 600 | 550 | 500 |
| 3 rd | 400 | 550 | 700 | 700 | 600 | 500 |
| 4 th | 400 | 600 | 800 | 800 | 600 | 650 |
Table 2.
Four different oven settings for sintering in vacuum.
Table 2.
Four different oven settings for sintering in vacuum.
| | Air/°C | Air/°C | Vacuum/°C | Vacuum/°C | Vacuum/°C |
|---|
| 1 st | 25 | 600 | 1250 | 1250 | 25 |
| 2 nd | 25 | 500 | 1100 | 1100 | 25 |
| 3 rd | 25 | 400 | 900 | 900 | 25 |
| 4 th | 25 | 300 | 600 | 600 | 25 |
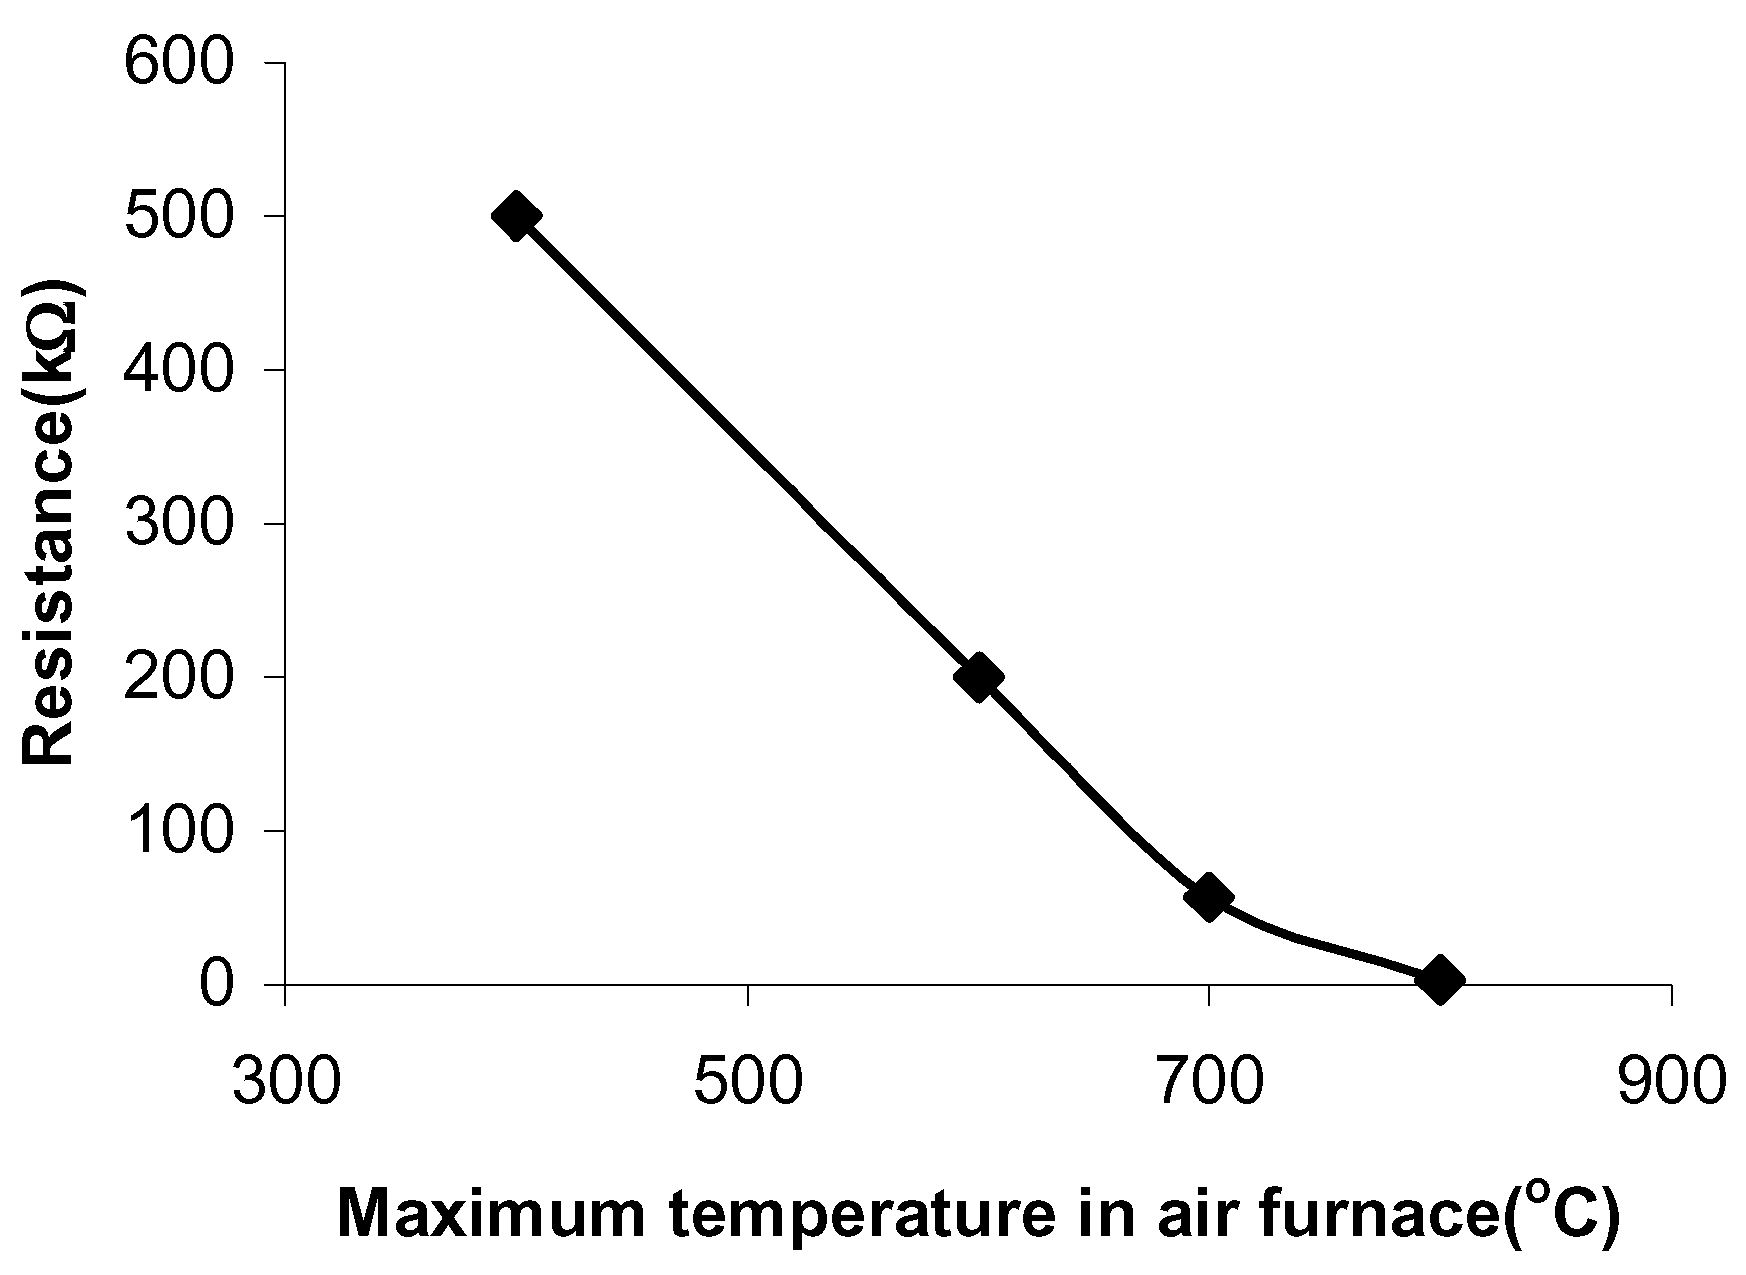
The pastes sintered in air have a resistance of 500kΩ, when fired at 400°C and a resistance of 3kΩ, when fired at 800°C (
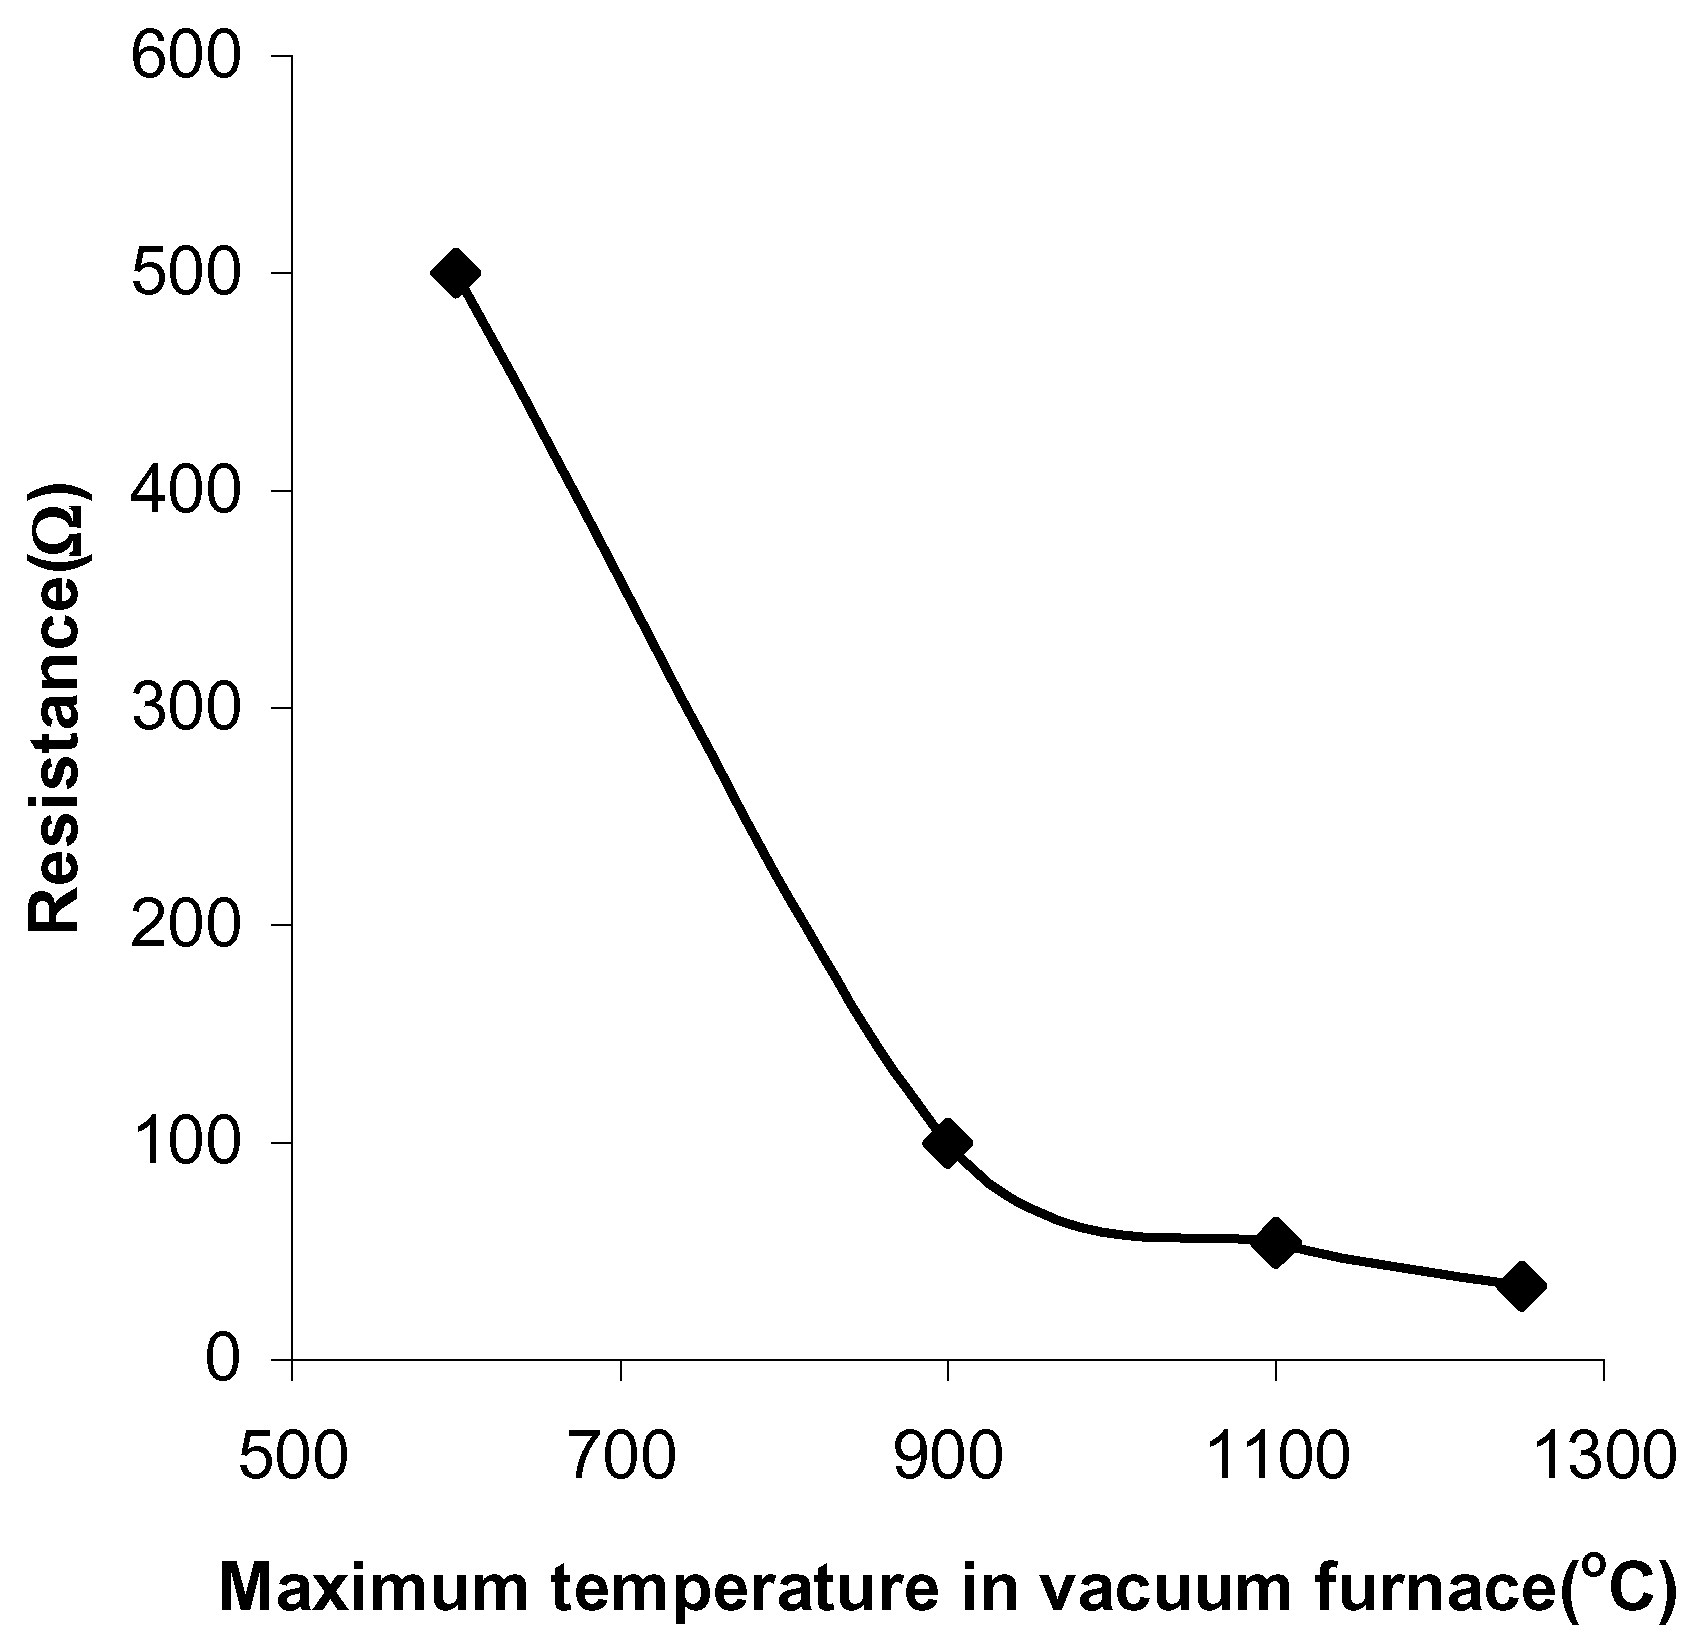
Figure 1). The pastes sintered in vacuum have a resistance of 500Ω at a firing temperature of 600°C and a resistance of 34Ω at a firing temperature of 1250°C (
Figure 2).
The pastes sintered in vacuum have shown a higher conductivity than those sintered in air. In general, firing in a reducing atmosphere increases the conductivity of most oxides due either to the production of oxygen vacancy donor states, which increases the density of states in the conduction band, or to the removal of surface oxygen traps, leading to a decrease in the number of conduction electrons being trapped. A low resistance device is commonly required for electronic circuit compatibility.
Figure 1.
The paste resistances at different sintering temperatures in air.
Figure 1.
The paste resistances at different sintering temperatures in air.
Figure 2.
The paste resistances at different sintering temperatures in vacuum.
Figure 2.
The paste resistances at different sintering temperatures in vacuum.
Temperature Sensitivity
The response of the sensor samples to increasing temperatures has been investigated. Temperature is an important interfering variable to document when measuring humidity. Humidity sensitive films are notorious for being temperature sensitive and usually require some form of temperature compensation. In general, ceramic thick films display higher thermal stability than polymer films, hence the trend towards using ceramic humidity sensors [
1]. The relative resistance of the samples decreased linearly with increasing temperatures over the range, 50-95°C.
This is in accordance with the relationship,
where R is the resistance, R
0 is the initial resistance, E
a is the activation energy and k is Boltzmann’s constant.
The temperature response can be given in terms of the relative variation, ΔR, of the sensor resistance to a given temperature,
where R
0 is the initial resistance of the sensor and R
t is the resistance at different temperatures. The calibration curves for the samples were obtained by plotting ΔR against the temperatures.
Figure 3 shows the changes in ΔR against temperature. The sensitivity of the samples to the temperatures was determined from the slope of ΔR.
Figure 3.
Variation in relative resistance ΔR of the samples as a function of the increasing temperature values.
Figure 3.
Variation in relative resistance ΔR of the samples as a function of the increasing temperature values.
The results have shown that sample 1 has the highest sensitivity to temperature, 0.77%/°C and sample 2 has a lower sensitivity of 0.37%/°C.
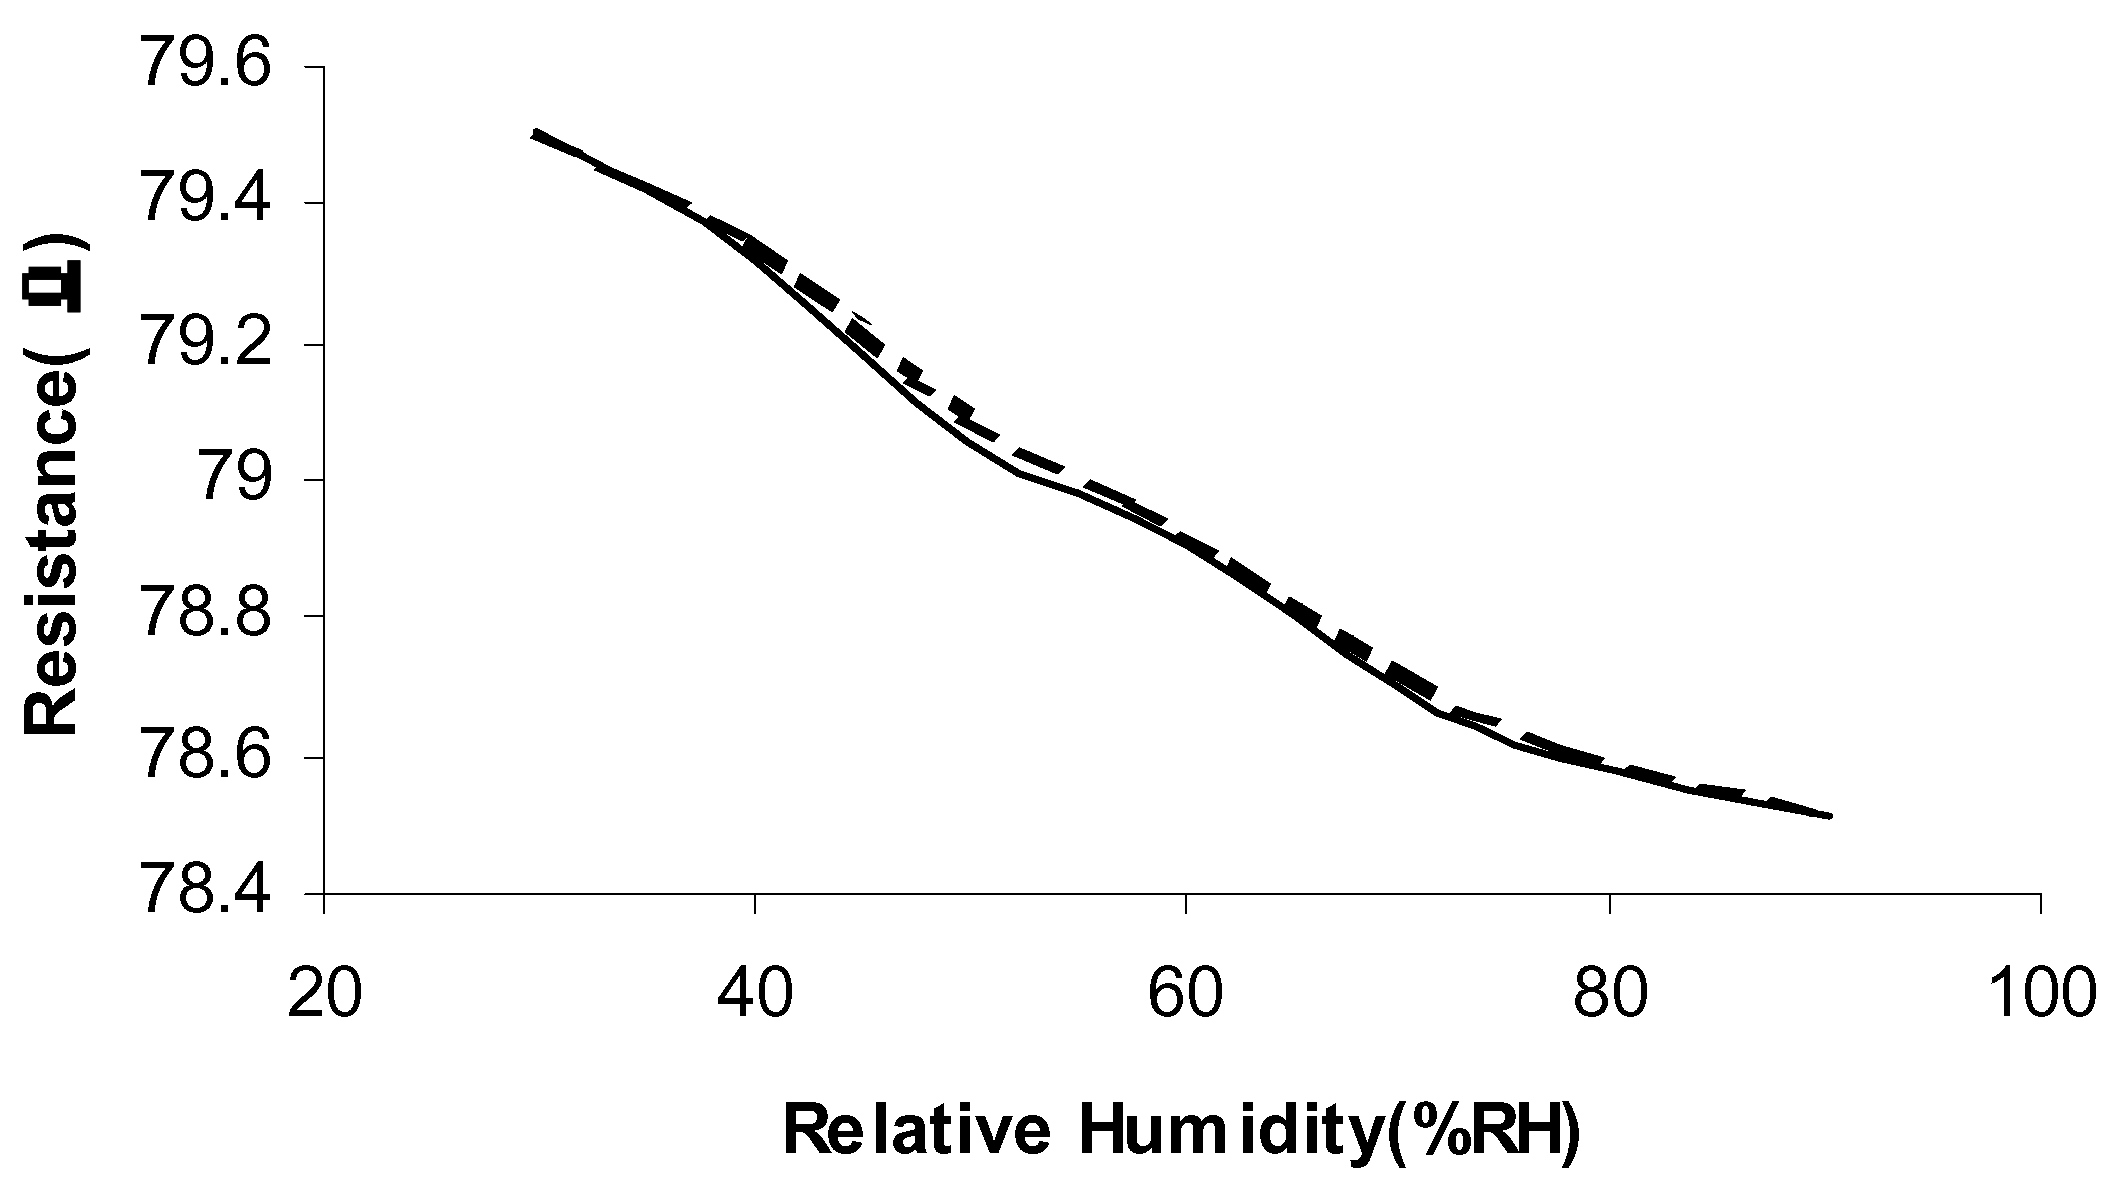
Humidity Sensitivity
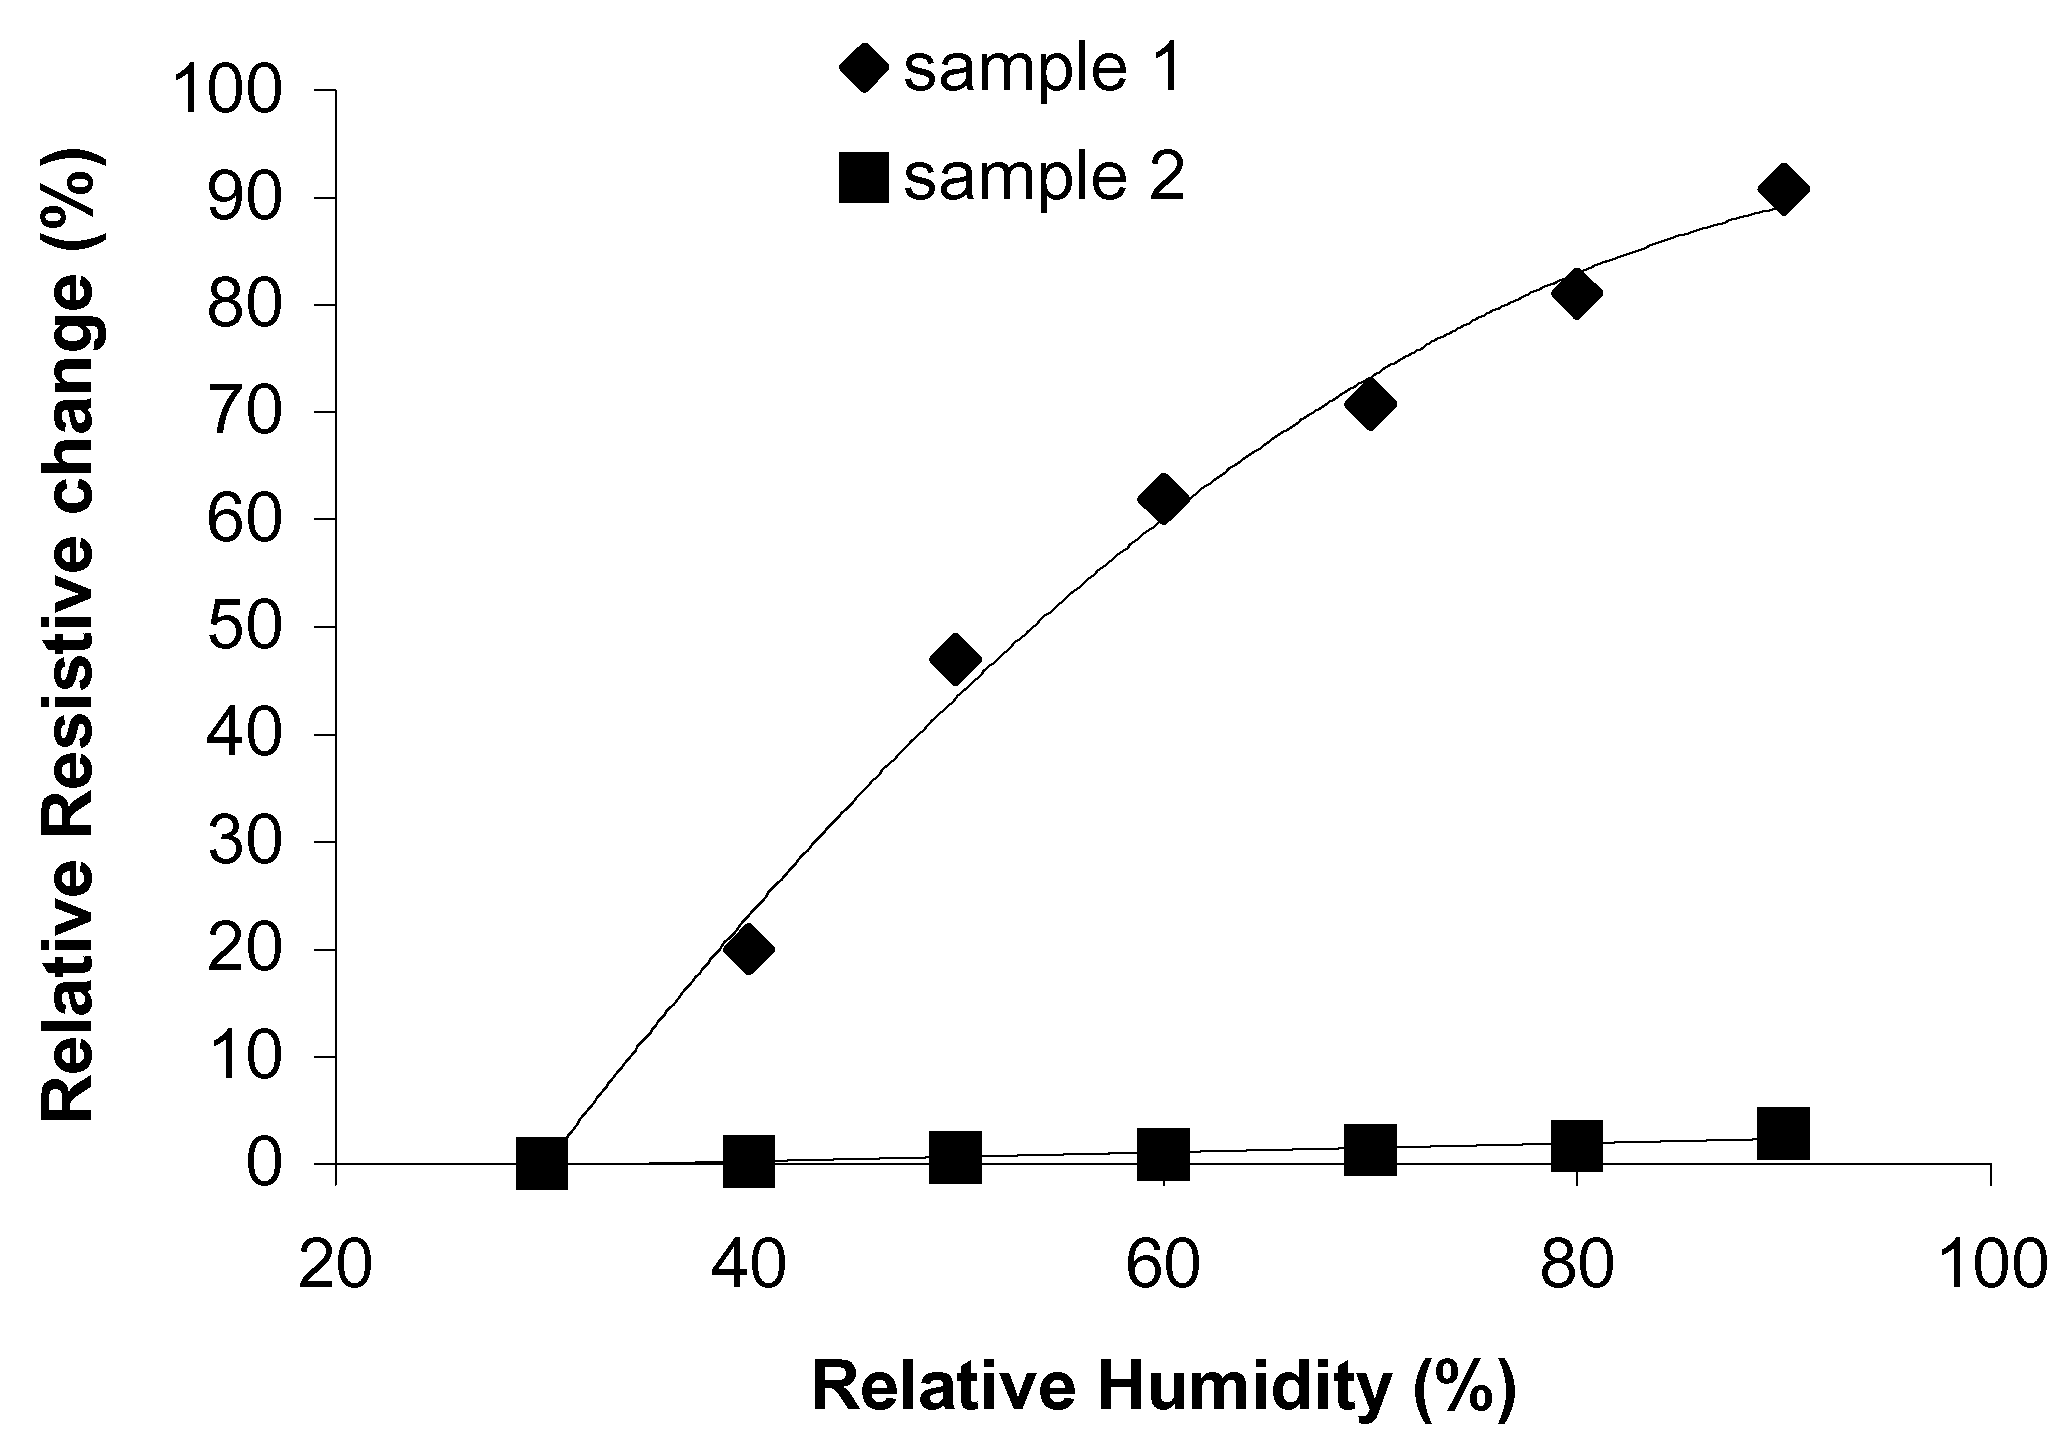
The humidity testing of the sensors was conducted using a dynamic humidity chamber. The humidity was increased from 30%RH to 95%RH in steps of 10%RH, at two different operating temperatures (30°C and 60°C). Since it takes around 20-30 minutes for the chamber to reach equilibrium, the readings are taken 30 minutes after a humidity setting has been changed. The humidity sensitivity is calculated in a similar manner to the temperature sensitivity. The changes in ΔR against the increasing relative humidity values are shown in
Figure 4 and
Figure 5. Overall, the sensitivity to humidity is greater at the lower operating temperature of 30°C, which could indicate that a room temperature operating temperature is sufficient.
Figure 4.
Variation in relative resistance ΔR of the samples as a function of the increasing relative humidity values, at 30°C.
Figure 4.
Variation in relative resistance ΔR of the samples as a function of the increasing relative humidity values, at 30°C.
Figure 5.
Variation in relative resistance ΔR of the samples as a function of the increasing relative humidity values, at 60°C
Figure 5.
Variation in relative resistance ΔR of the samples as a function of the increasing relative humidity values, at 60°C
The humidity results have indicated that sample 1 exhibits the highest humidity sensitivity, 1.7%/%RH and sample 2 has a much lower sensitivity, 0.036%/%RH. A reduction in humidity sensitivity normally occurs when a sample is fired in vacuum. This is because a parallel, non-humidity sensitive, conduction path has been added. For all the sensor samples a decrease in resistance is observed with increasing humidity levels.
At low relative humidity, water adsorption on the sample surface is likely the dominant factor for electronic conduction [
9]. Adsorbed water increases the surface electrical conductivity of the ceramic due to the increased charge carrier, protons, in the ceramic/water system [
8]. The conductivity is further increases by the presence of pores on the sample surface. In the first stage of water adsorption, a few water vapour molecules chemisorb on the grain surfaces by a dissociative mechanism to form two surface hydroxyls per water molecule. In this chemisorbed layer charge transport occurs by the hopping mechanism [
8]. With increasing humidity levels, water is physisorbed on top of the chemisorbed layer. Conduction probably occurs by the Grotthus transport mechanism [
10]. At these high humidity levels the layers of physisorbed water molecules tend to condense in capillary pores, with a radius below r
k, the Kelvin radius, given by,
where P is the water-vapour pressure, P
s is the water vapour pressure at saturation, and γ, ρ and M are the surface tension, density and molecular weight of water, respectively. An electrolytic conduction in condensed water will take place in addition to the protonic transport in the physisorbed layers [
11]. This succession of mechanisms leads to a rapid increase in conduction (decrease in resistance) with increasing humidity content.
The changes in the electronic conductance of the semiconductor in the presence of adsorbed water must also be considered. Water cannot directly inject a carrier into either the conduction or valence band of a metal oxide semiconductor [
10]. A number of mechanisms have been suggested to account for the apparent electron donation from water molecules to oxides, including, non-dissociative adsorption with on electron donation, dissociative adsorption with one electron donation, and dissociative adsorption with two electron donation [
12]. It has also been suggested that an indirect effect may occur involving the chemisorbed oxygen that has trapped a conduction band electron [
13]. Adsorption of water displaces the oxygen, causing it to release the electron back into the conduction band, hence increasing the conductivity of the n-type semiconductor.
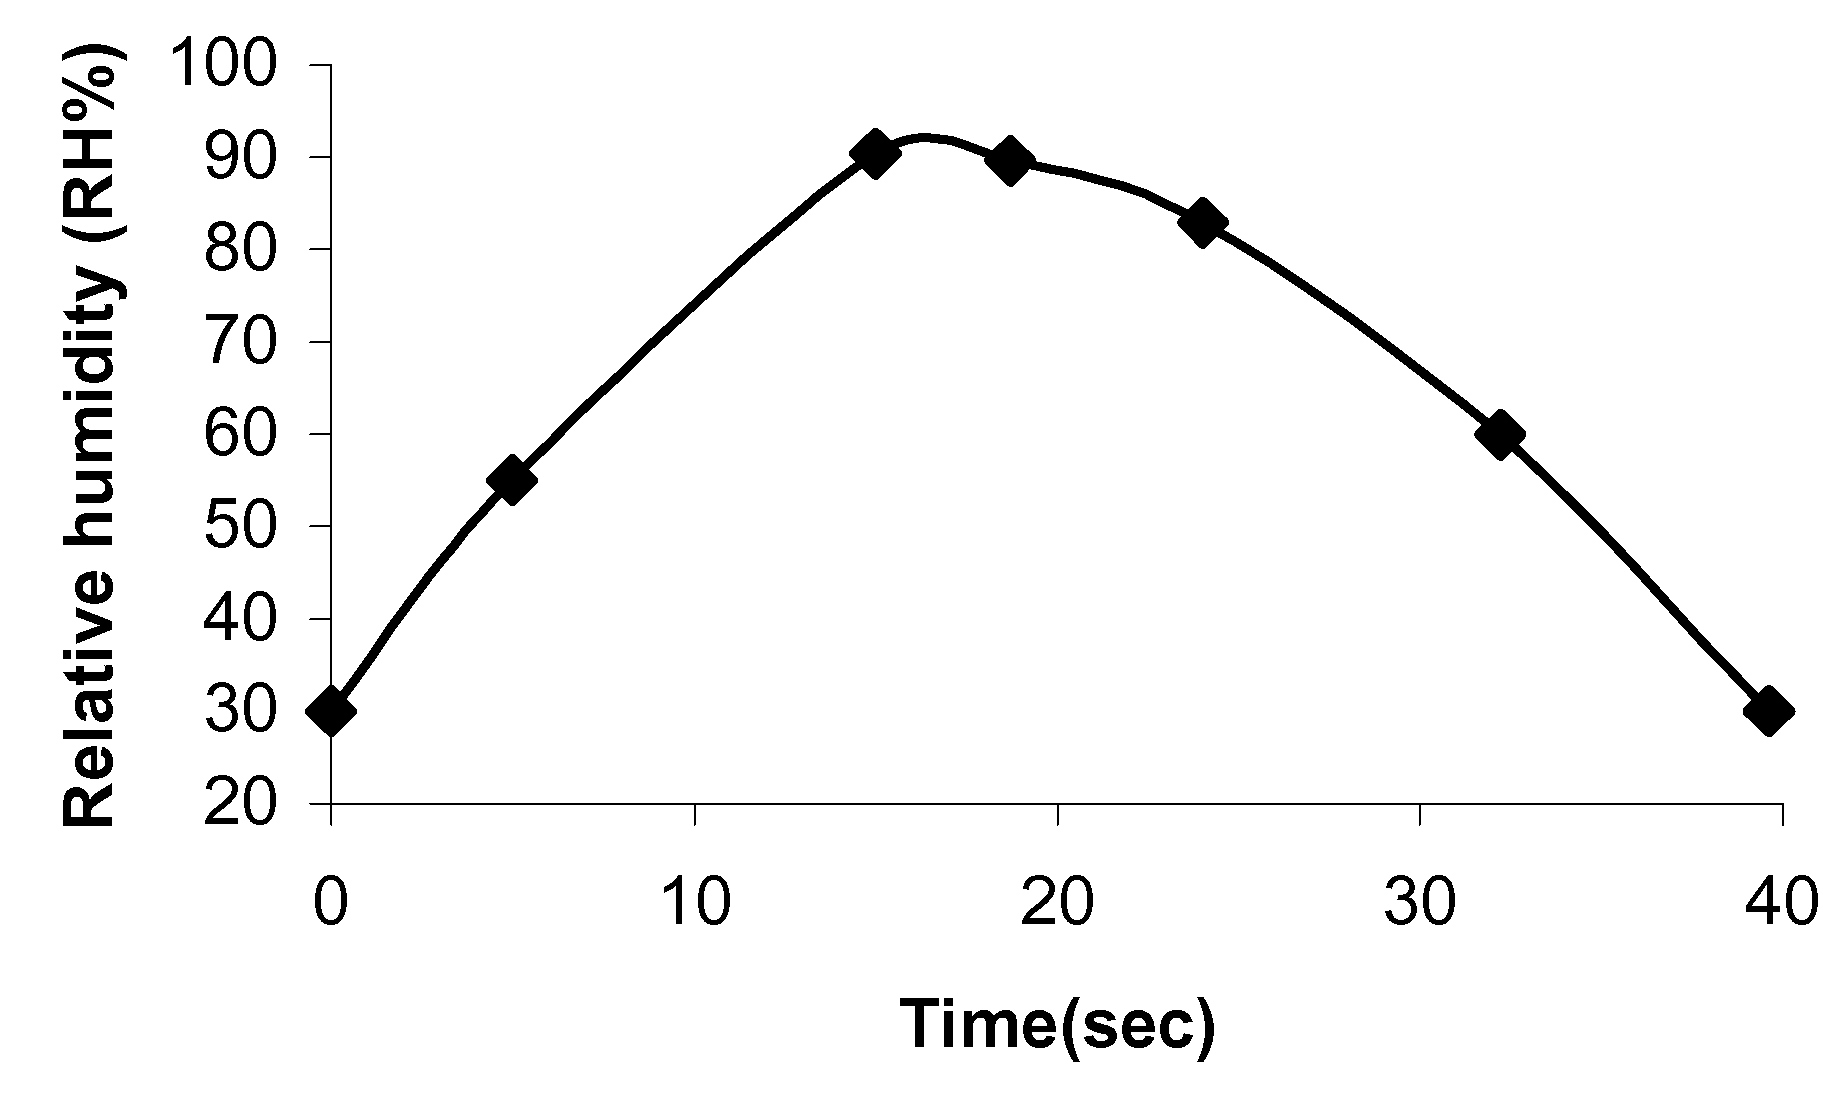
Time Response
The time response of a sensor can vary from seconds to hours and it is of great interest to determine it. Commercial sensors appear to have a wide range of time responses from seconds e.g. 15 seconds [
15], 30 seconds [
17] up to minutes, e.g. 60 minutes [
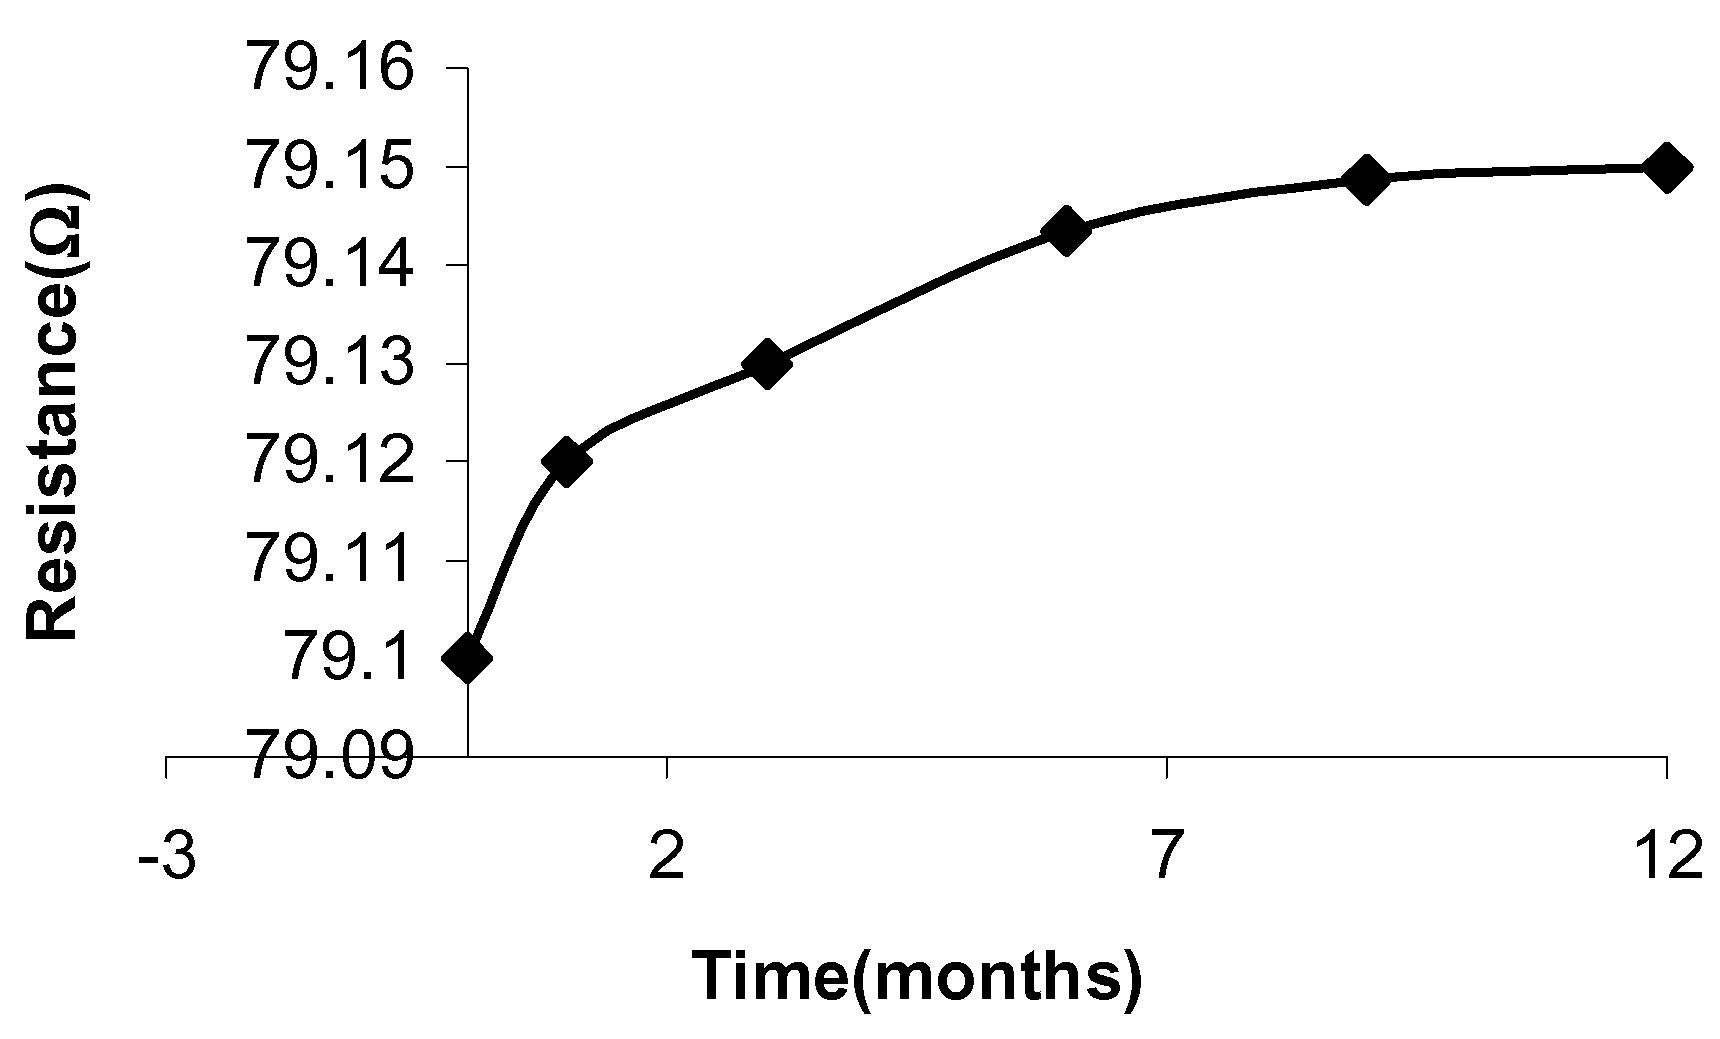
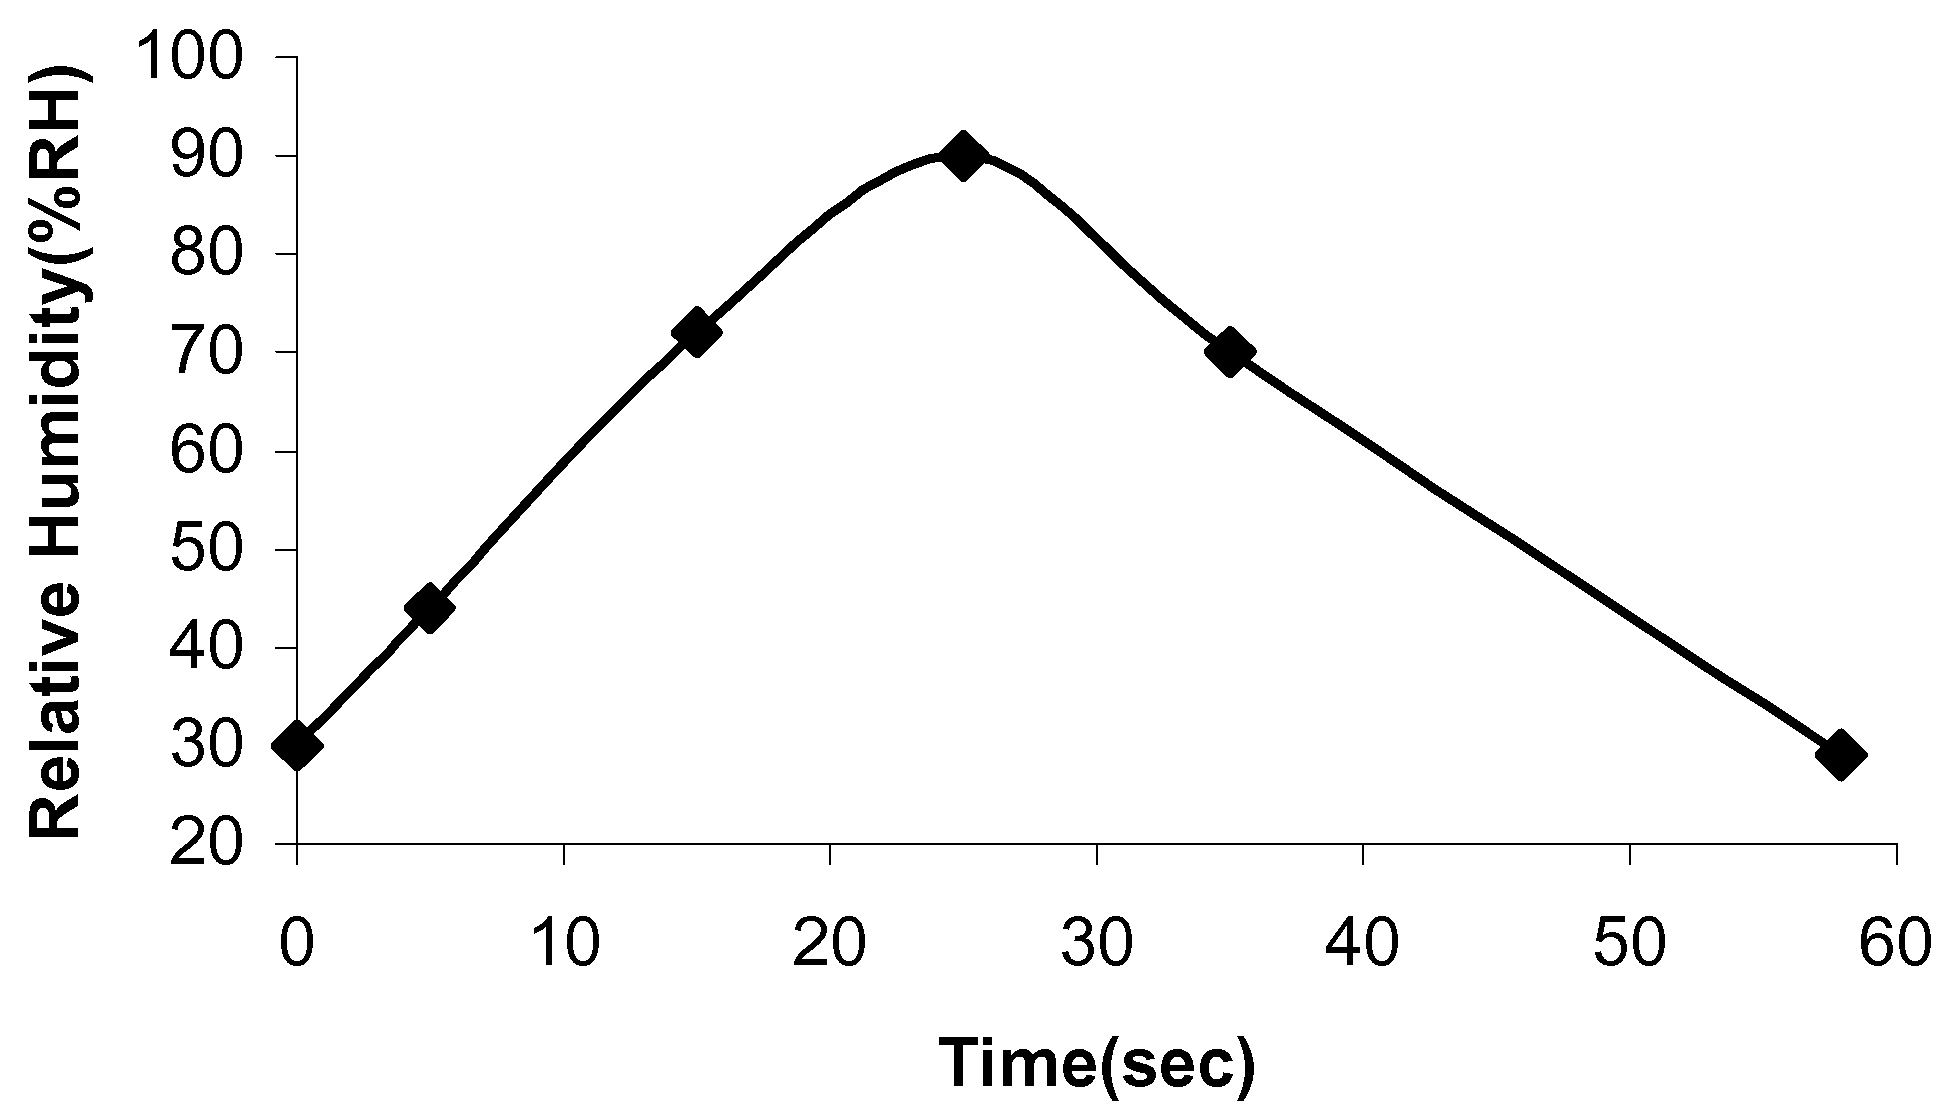
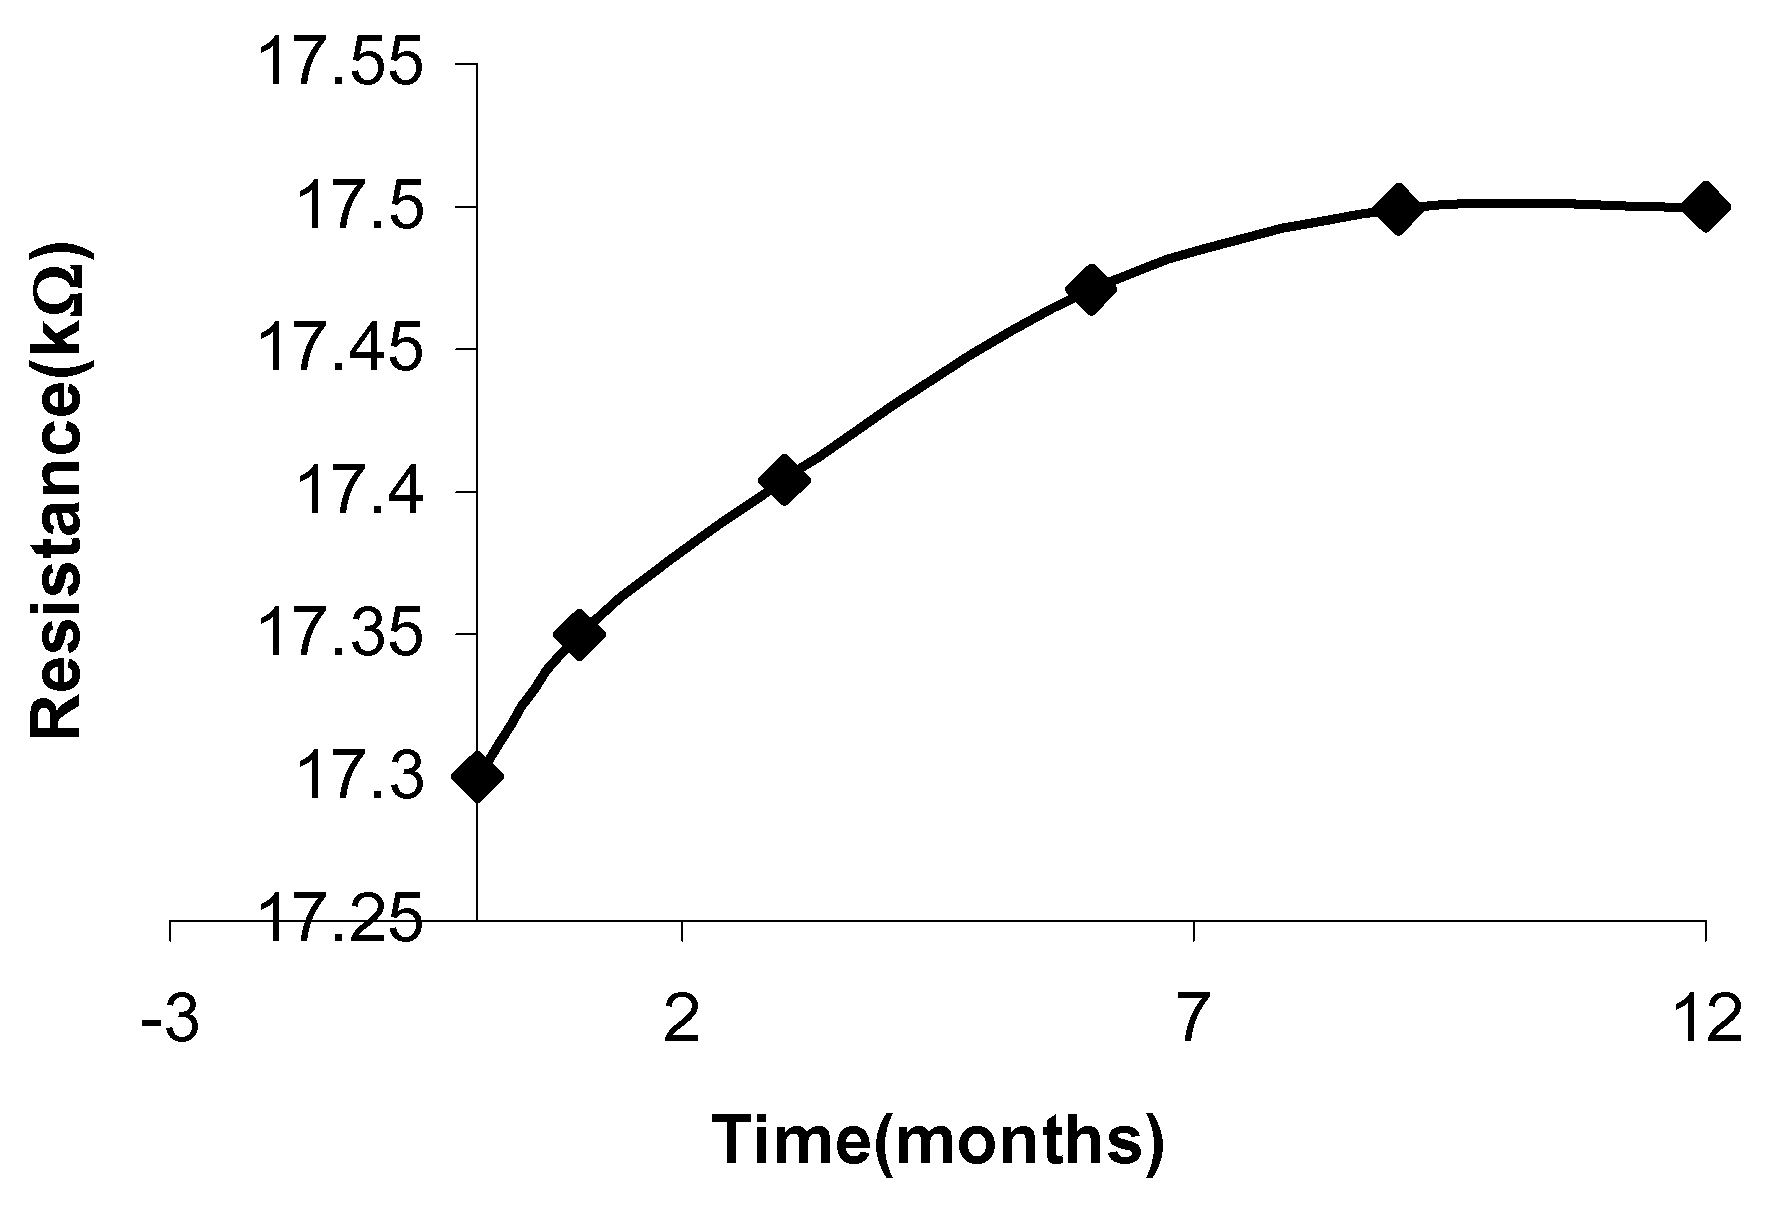
18]. The time response of the samples to RH% was determined by inserting the samples into the humidity chamber at the different settings and the time for the sensor samples to sense the correct RH% timed. Initially, the appropriate time was allowed for the chamber to reach equilibrium. The response and recovery times of the MnZn ferrite samples are indicated in
Figure 10 and
Figure 11.
Figure 10.
Time response of sample 1.
Figure 10.
Time response of sample 1.
The time response of sample 1 is 25 seconds and the recovery time is 33 seconds. The time response for sample 2 is 17 seconds and the recovery time is 25 seconds. Adsorption and desorption of the water molecules take place at different energy levels. Adsorption is an exothermic process, whereas desorption needs external energy for water molecules to depart from the sample surface [
19]. This explains why the recovery time is longer than the response time.
Figure 11.
Time response of sample 2.
Figure 11.
Time response of sample 2.

