3.1 Detection of DNA damage
The DNA redox marker [Co(phen)
3]
3+ can be accumulated effectively from its solution within the DNA layer on the electrode surface at both an open circuit [
19,
20,
21,
24,
25] as well as a polarization of the electrode by a positive potential which is often used to stimulate association interactions of DNA [
18,
26]. Voltammetric behavior of [Co(phen)
3]
3+ at the DNA-modified gold electrode [
24], glassy carbon electrode [
20], carbon paste electrode [
25,
26] as well as carbon-based screen-printed electrode [
18,
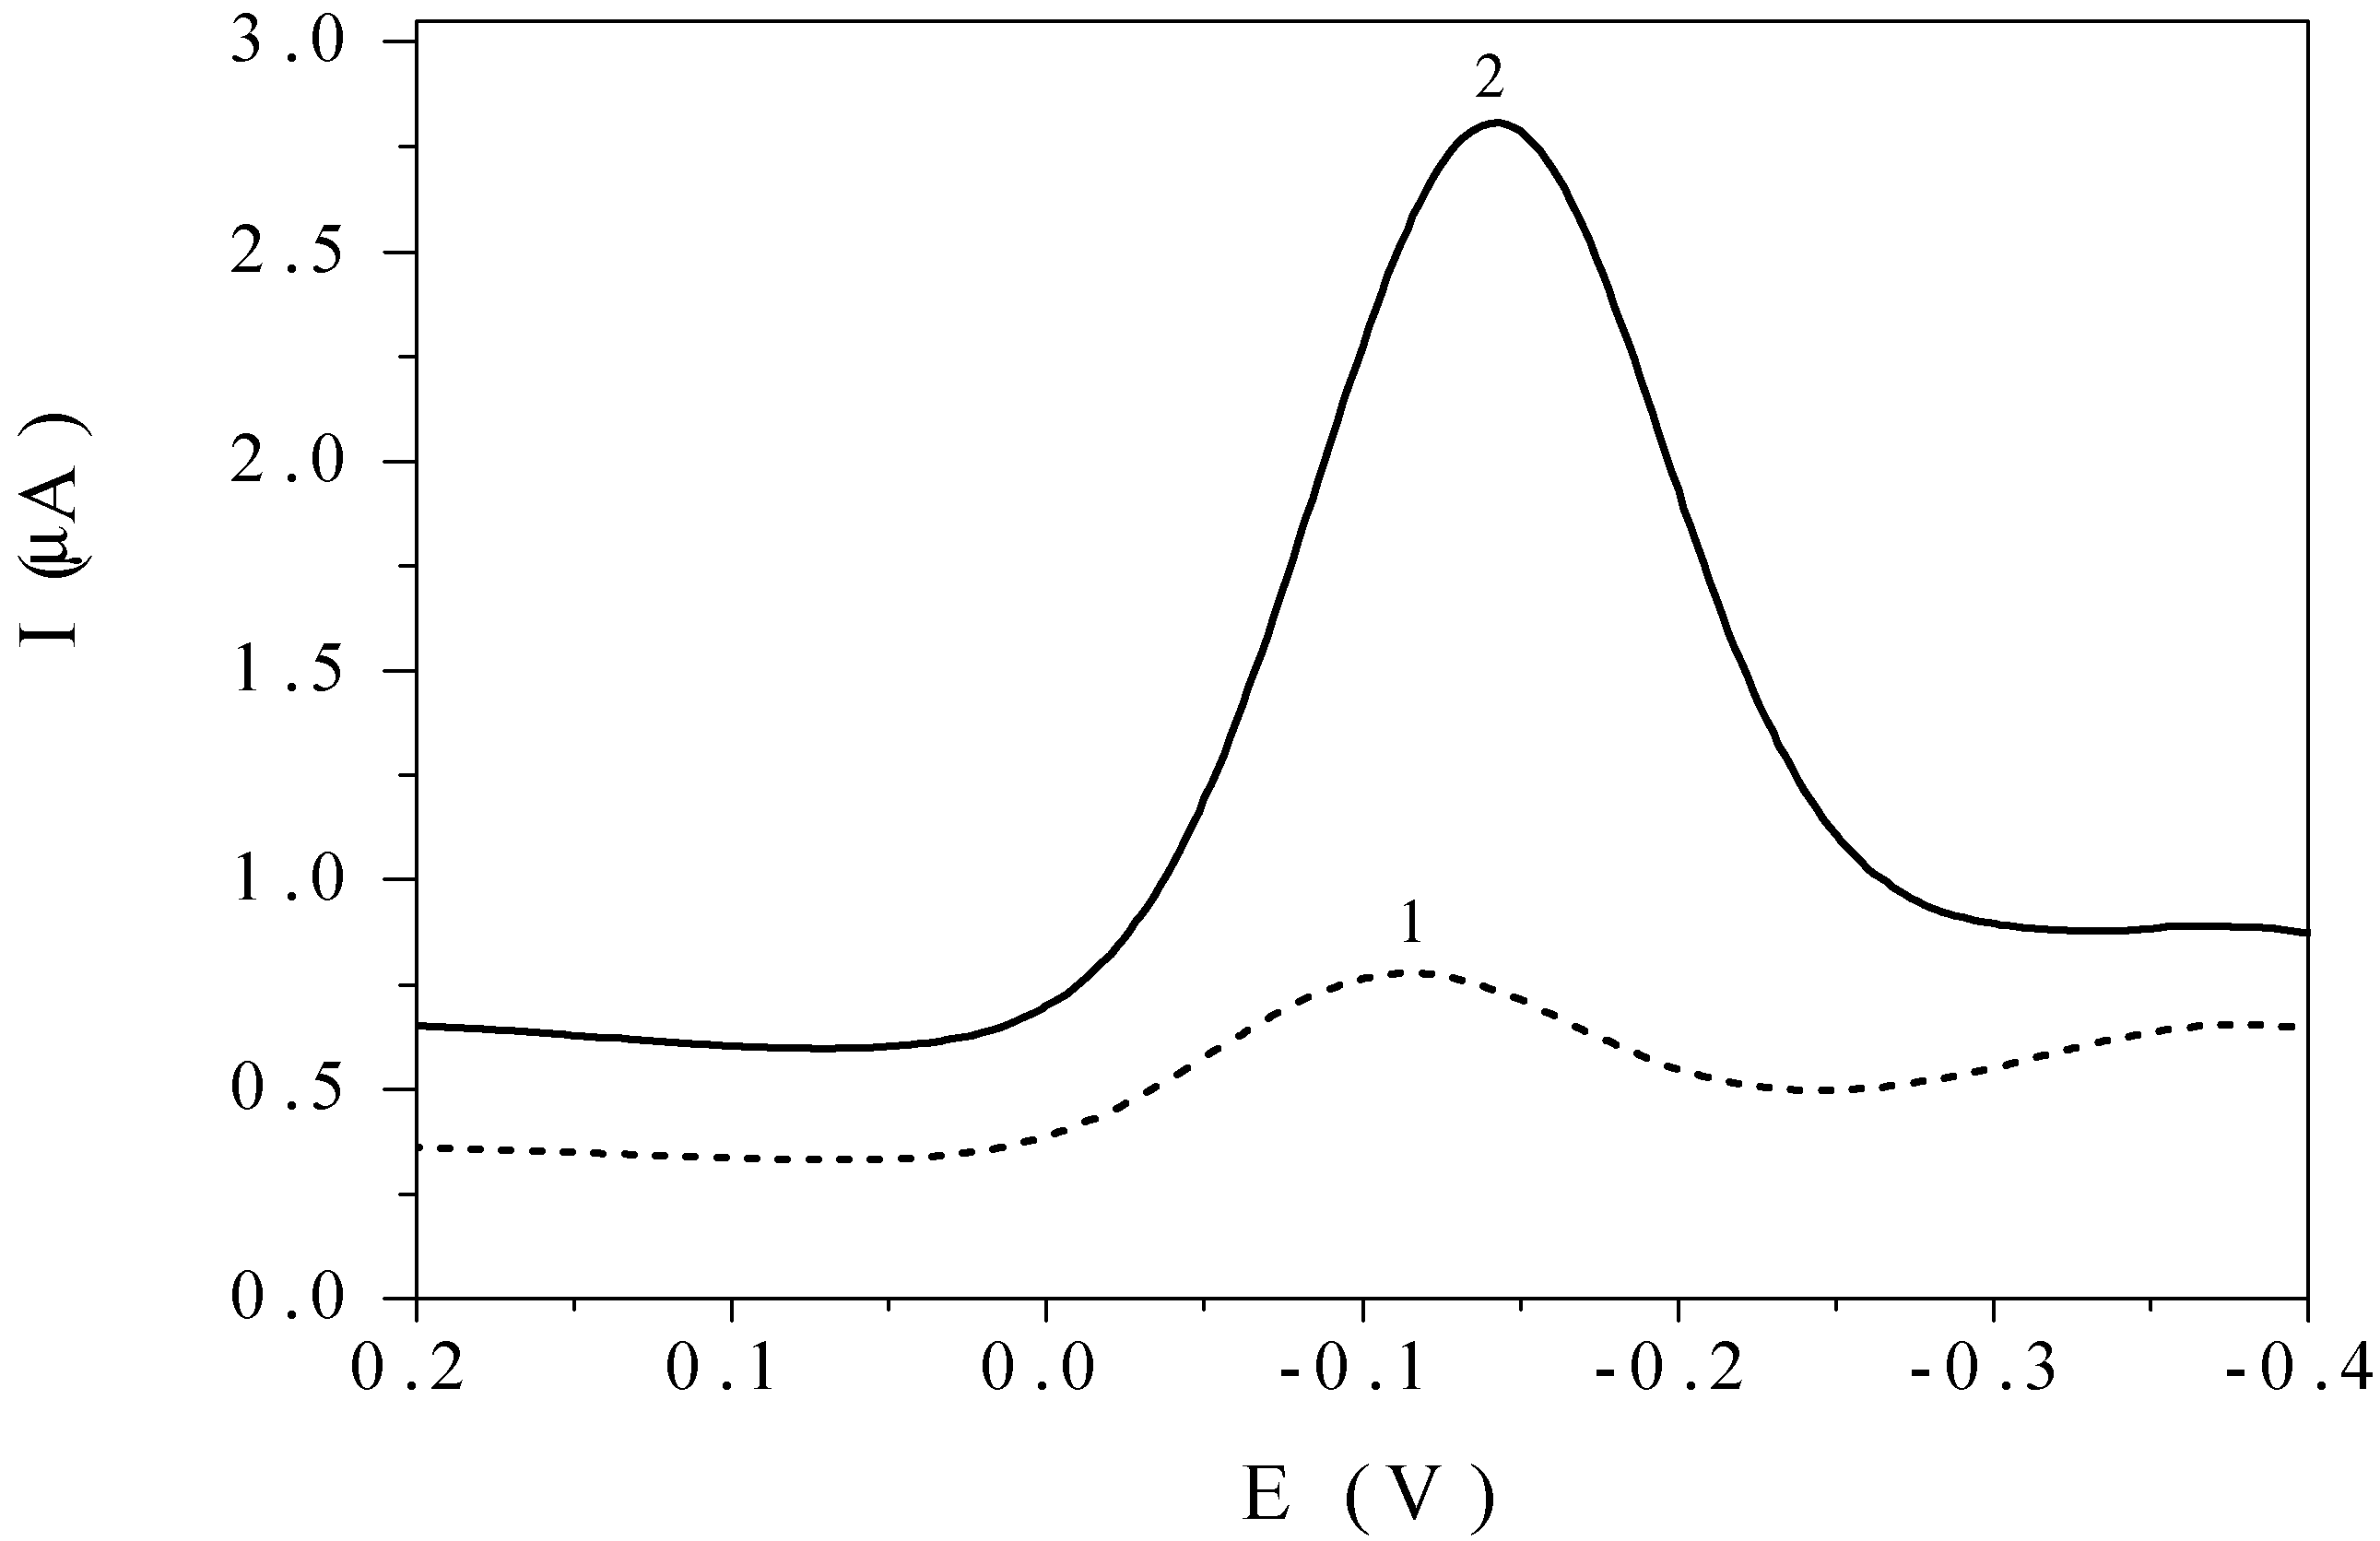
19] was reported previously. After the accumulation of the marker at DNA/SPE under the open circuit conditions, a good developed DPV peak of the complex appears at –0.130 V vs Ag/AgCl (
Fig. 1). Depending on an ionic strength of the medium, intercalation (predominantly at high ionic strength) and electrostatic forces (predominantly at low ionic strength) take part in binding of the marker particles [
20,
24]. The intercalation as well as electrostatic binding are equilibrium processes which can be utilized for a removal of [Co(phen)
3]
3+ from the DNA layer in solution without [Co(phen)
3]
3+ [
19,
20,
21].
The marker signal obtained with the bare SPE after 120 s in the solution of [Co(phen)
3]
3+ represents about 20 % of the signal measured after the complex accumulation at the DNA-modified SPE (
Fig. 1). Similarly to [
18,
19], it indicates a contribution of the [Co(phen)
3]
3+ diffusion and adsorption at the bare SPE to the total DPV signal at the DNA-modified electrode. To evaluate only signal of the redox marker accumulated at DNA (peak current I
0), the total DPV peak current of [Co(phen)
3]
3+ obtained at the DNA/SPE was corrected to its signal at the bare SPE by subtraction of the mean value of the last one.
Figure 1.
DPV curves of the [Co(phen)3]3+ complex in its 5×10⁻⁷ M solution obtained with SPE (1) and DNA/SPE (2) after 120 s accumulation at an open circuit, 10 mM phosphate buffer pH 7.0, pulse amplitude 100 mV, scan rate 25 mV/s.
Figure 1.
DPV curves of the [Co(phen)3]3+ complex in its 5×10⁻⁷ M solution obtained with SPE (1) and DNA/SPE (2) after 120 s accumulation at an open circuit, 10 mM phosphate buffer pH 7.0, pulse amplitude 100 mV, scan rate 25 mV/s.
The biosensor was immersed into 10 mM phosphate buffer containing 2x10⁻⁴ M [Fe(EDTA)]- ions and 9 mM H2O2 at aerobic conditions without bubbling air. With respect to the dominant presence of monoprotonated form of EDTA at pH 7.0 (pKa,2 = 6.7), its iron(II) complex is denoted here as [Fe(EDTA)]-. A negative polarization potential was switched on for 5 min to control the reduction/oxidation cycle of the iron atom. The signal obtained with DNA/SPE after such preliminary treatment of the sensor in the cleavage mixture followed by the transfer of the electrode to the [Co(phen)3]3+ solution and the accumulation of the marker decreases from the peak current I0 to I.
Utilizing an oxidation signal of the DNA guanine moiety it was shown previously that this decrease in the marker signal is due to a deep change in the dsDNA structure which involves DNA strand breaks and leads to a decrease of its ability to bind the [Co(phen)
3]
3+ [
16,
17,
18]. To compensate differences in the properties of individual strips of the DNA-modified screen-printed electrodes, one and the same DNA/SPE was used in our measurements for the evaluation of a couple of the I
0 and I peak currents corresponding to an individual composition of the cleavage mixture and the marker signal was expressed by its normalized (relative) value I/I
0.
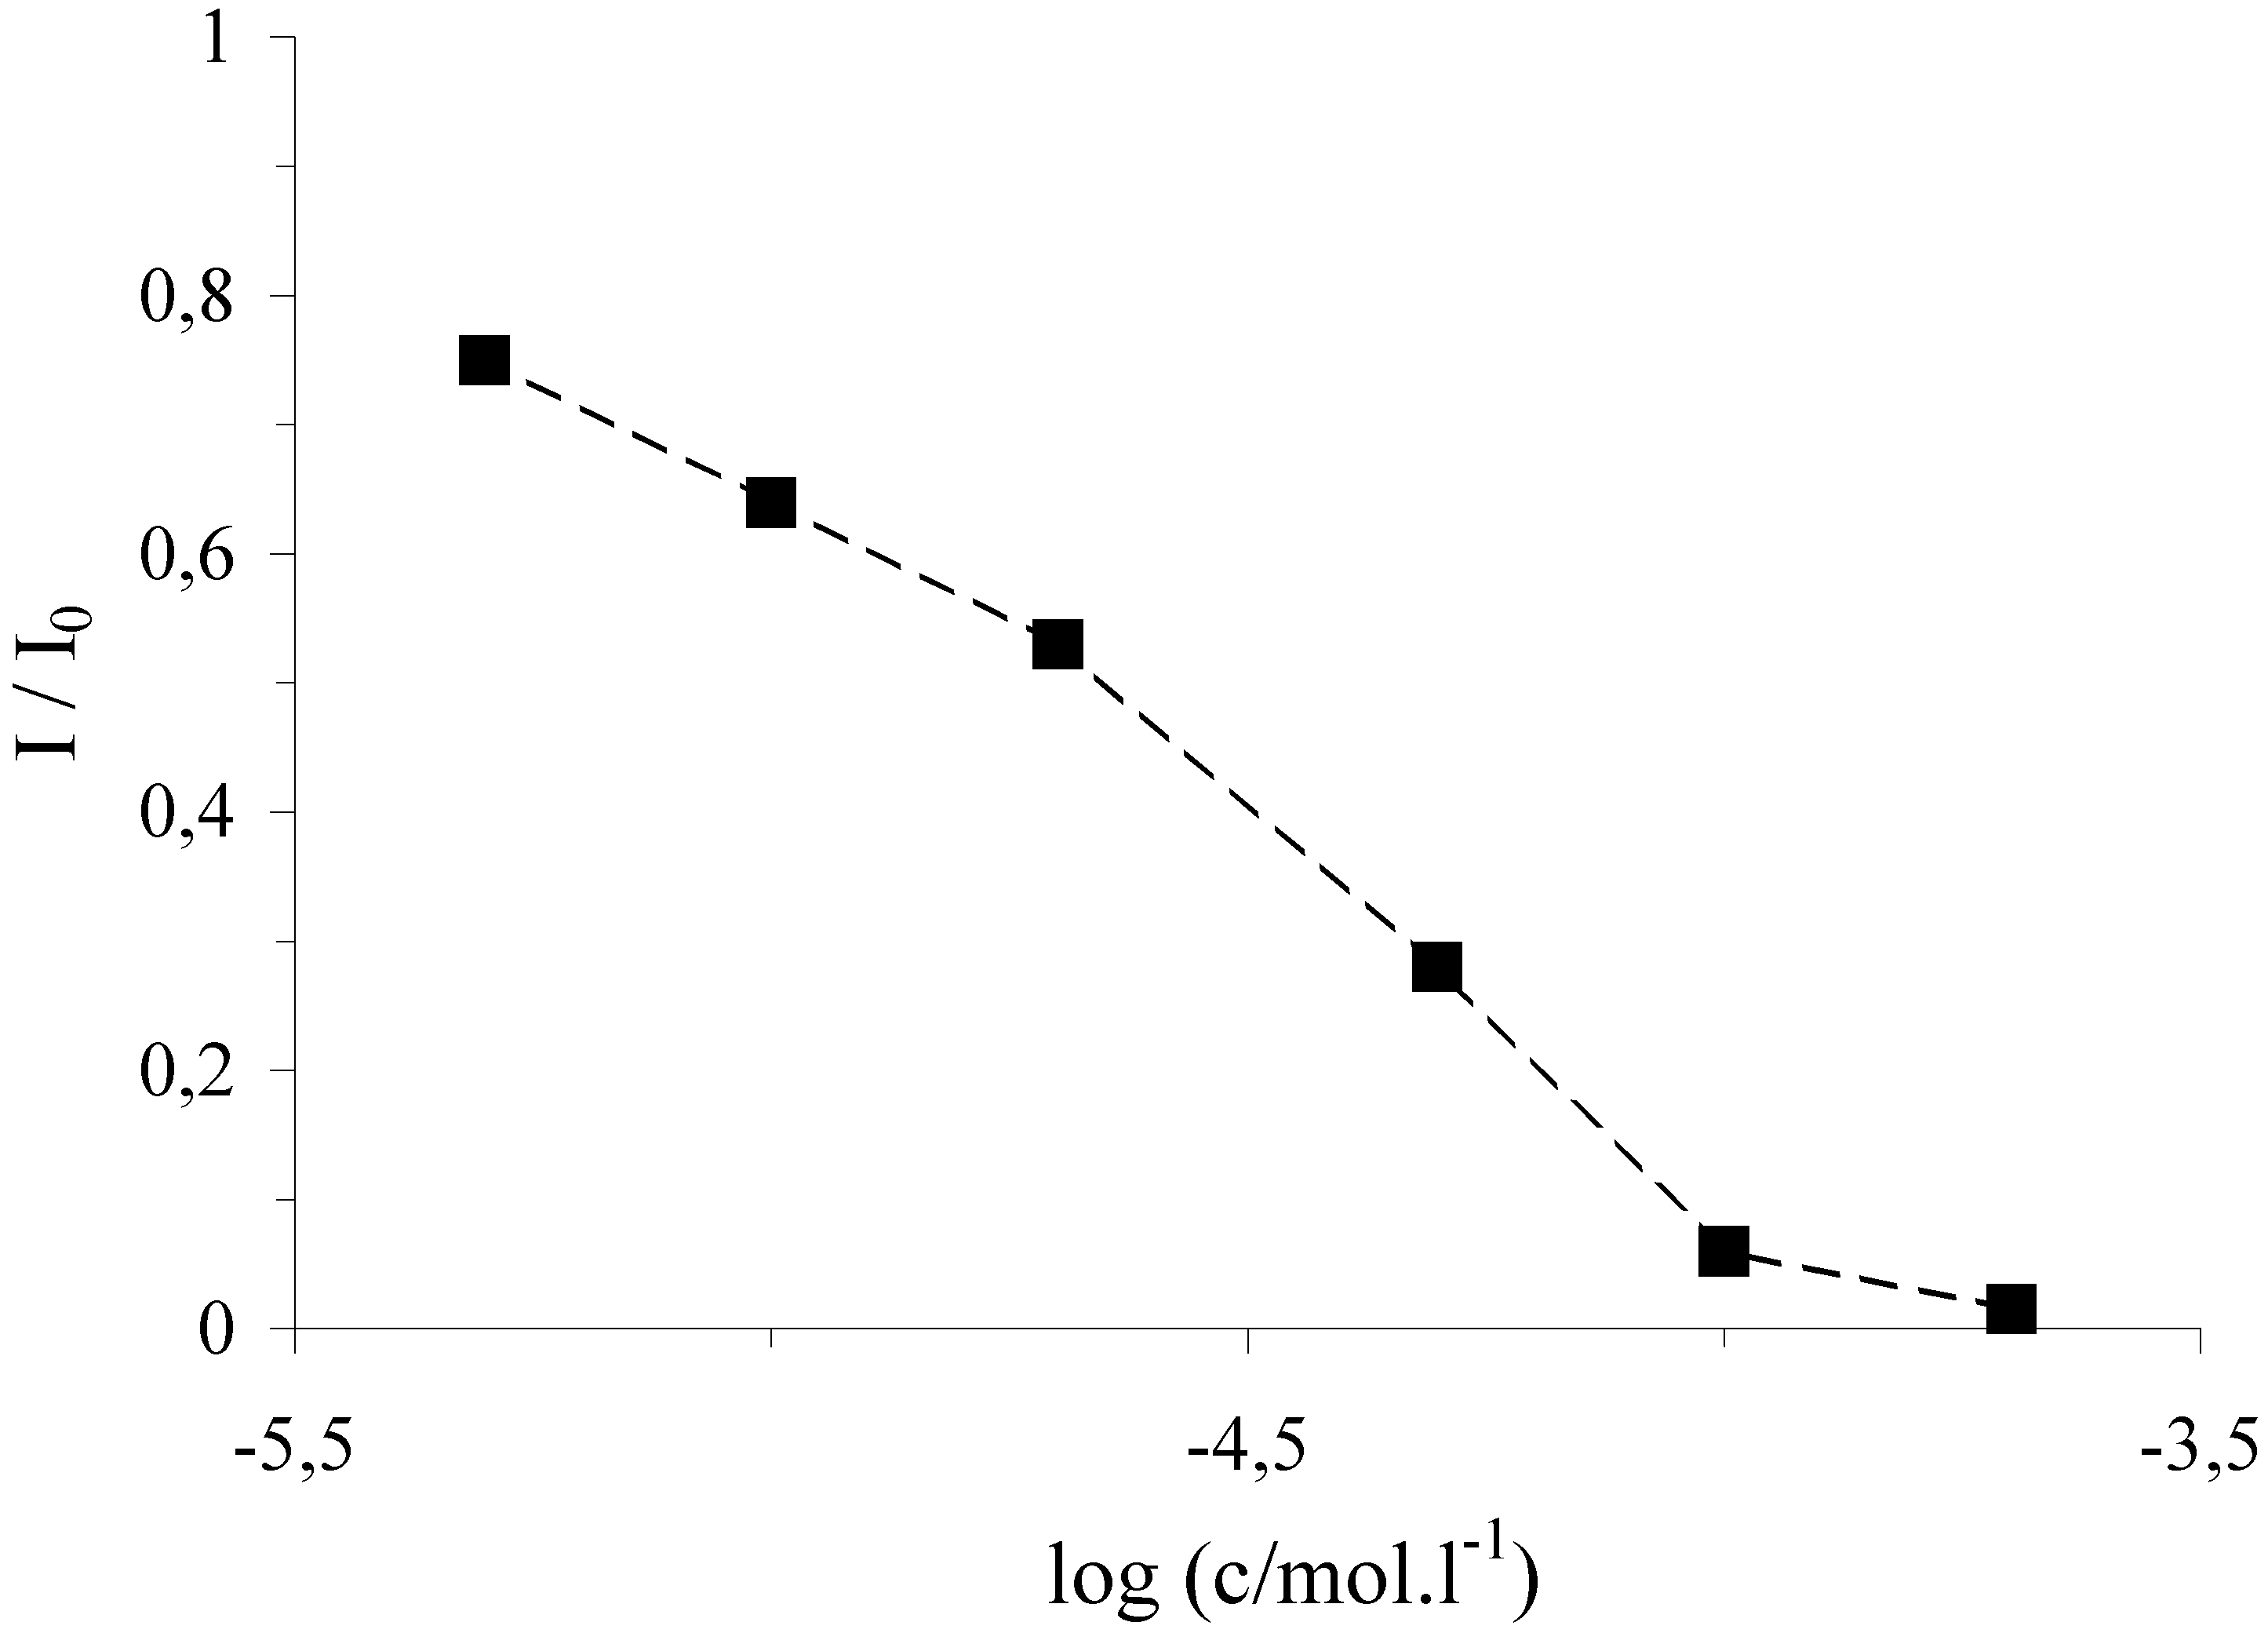
This I/I0 signal has reached the values of 0.79 and 0.02 for the potential of –0.3 and –0.5 V, respectively, applied to the biosensor during its treatment in the cleavage mixture. In blank solution containing oxygen and with an electrode potential of –0.5 V, the relative marker signal was 0.71, while with 9 mM H2O2 and the same electrode potential the signal decreased to 0.15. Thus, the application of the sufficiently negative electrode potential of –0.5 V can be utilized advantageously for the reduction of iron and simplification of the chemical composition of the cleavage mixture omitting chemical reductant. This is of interest particularly at the evaluation of mixed samples of the natural antioxidants containing also ascorbic acid.
Figure 2.
Dependence of the marker relative DPV signal at the DNA/SPE on the concentration of FeSO
4 in the cleavage mixture: FeSO
4, 4×10
-4 M EDTA, 9×10
-3 M H
2O
2 in 10 mM phosphate buffer pH 7.0, the electrode potential of –0.5 V, incubation for 5 min. Other conditions as in
Figure 1.
Figure 2.
Dependence of the marker relative DPV signal at the DNA/SPE on the concentration of FeSO
4 in the cleavage mixture: FeSO
4, 4×10
-4 M EDTA, 9×10
-3 M H
2O
2 in 10 mM phosphate buffer pH 7.0, the electrode potential of –0.5 V, incubation for 5 min. Other conditions as in
Figure 1.
The cleavage activity of the reaction medium against the DNA/SPE biosensor depends on the concentration of the iron ions. The calibration graph for the [Fe(EDTA)]
- complex ions is depicted on
Fig. 2. The strip-to-strip repeatability for the determination of 2×10
-4 M [Fe(EDTA)]
- at single-use DNA/SPE sensors was characterized by the relative standard deviation of 19 % (n=8). With respect to the high efficiency of 2×10
-4 M iron complex towards DNA damage, this concentration and the incubation time of 5 min were chosen for the evaluation of antioxidants.
3.2 Detection of antioxidative activity of standard materials and plant extracts
The rosmarinic and caffeic acids were found as the main constituents of phenolic acids in the plant extracts under study using the HPLC technique and the procedure reported previously [
22]. The concentrations of these acids are presented in
Table 1.
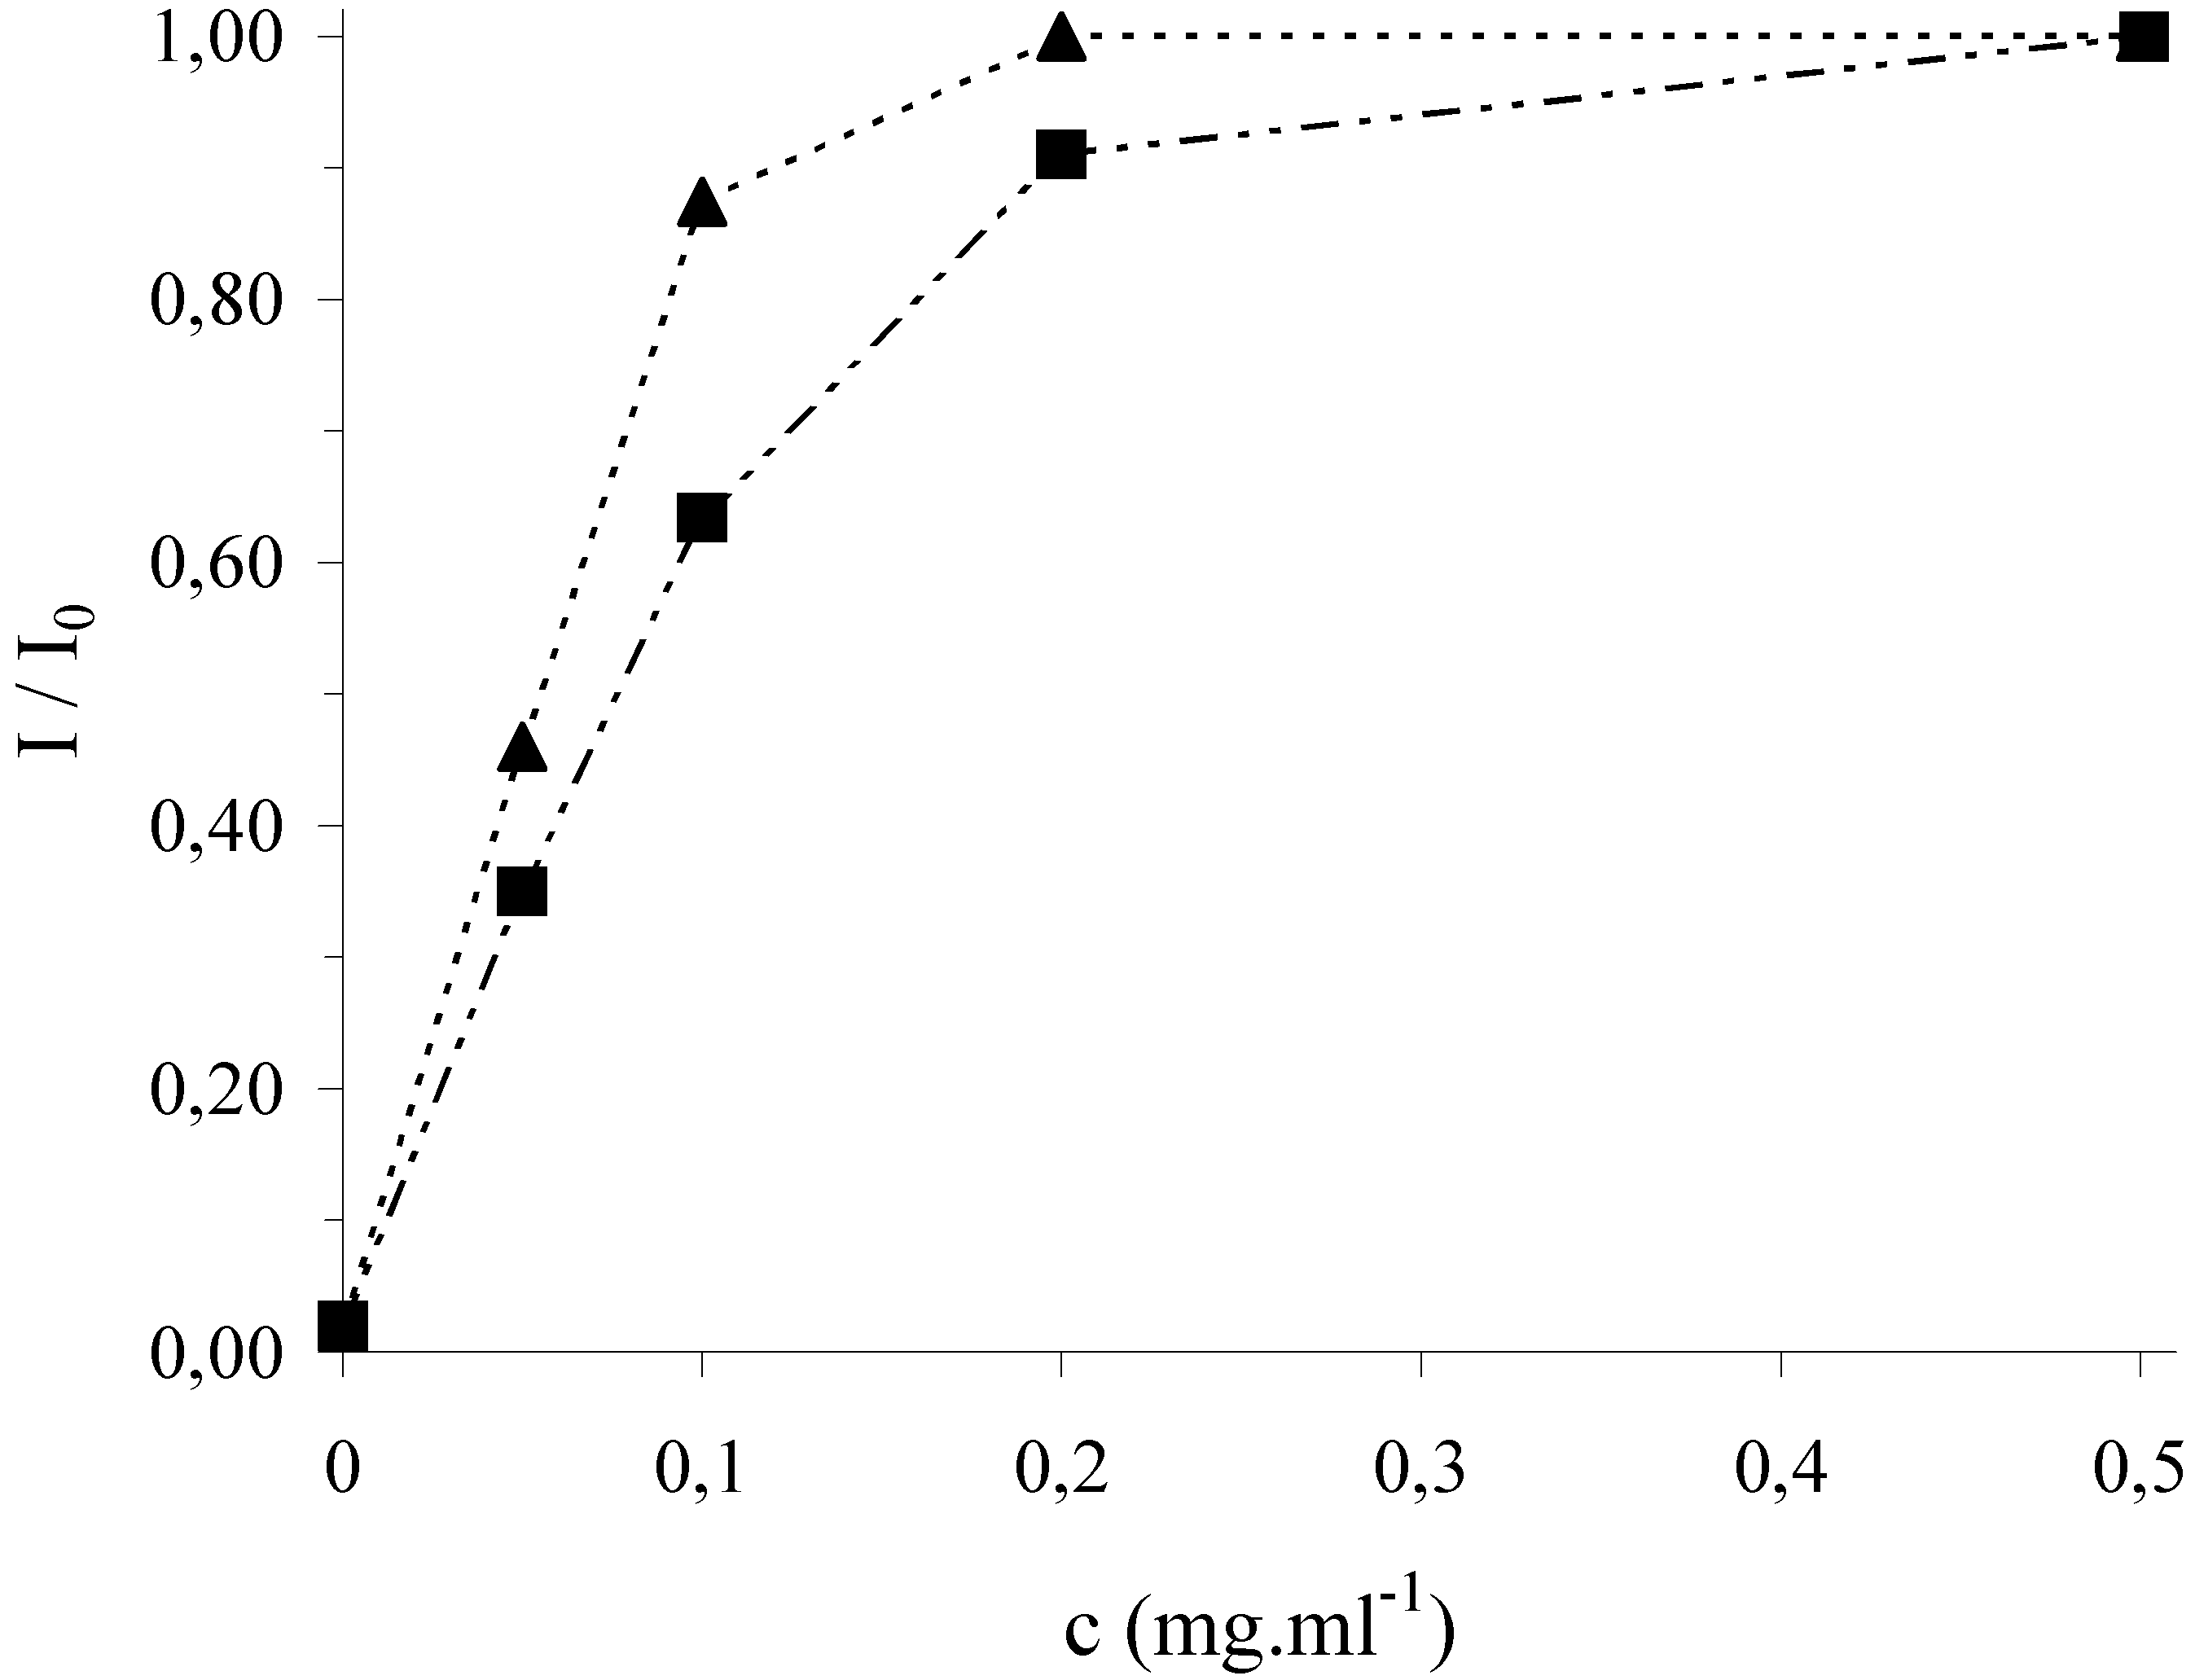
The antioxidative activities of rosmarinic and caffeic acids as the standards as well as that of four plant extracts were examined by addition to the cleavage mixture with 10 % methanol (
Fig. 3 and
Fig. 4). It was tested in a blank experiment that this methanol content has no effect on the DNA/SPE sensor and, consequently, the redox marker signal.
Figure 3.
Antioxidative effect of rosmarinic acid (▲) and caffeic acid (■) in cleavage mixture on the relative marker signal at the DNA/SPE. Incubation of the sensor in 2x10
-4 M FeSO
4, 4x10
-4 M EDTA, 9x10
-3 M H
2O
2 in 10 mM phosphate buffer pH 7.0 with10 % of methanol at the electrode potential of –0.5 V for 5 min. Other conditions as in
Figure 1.
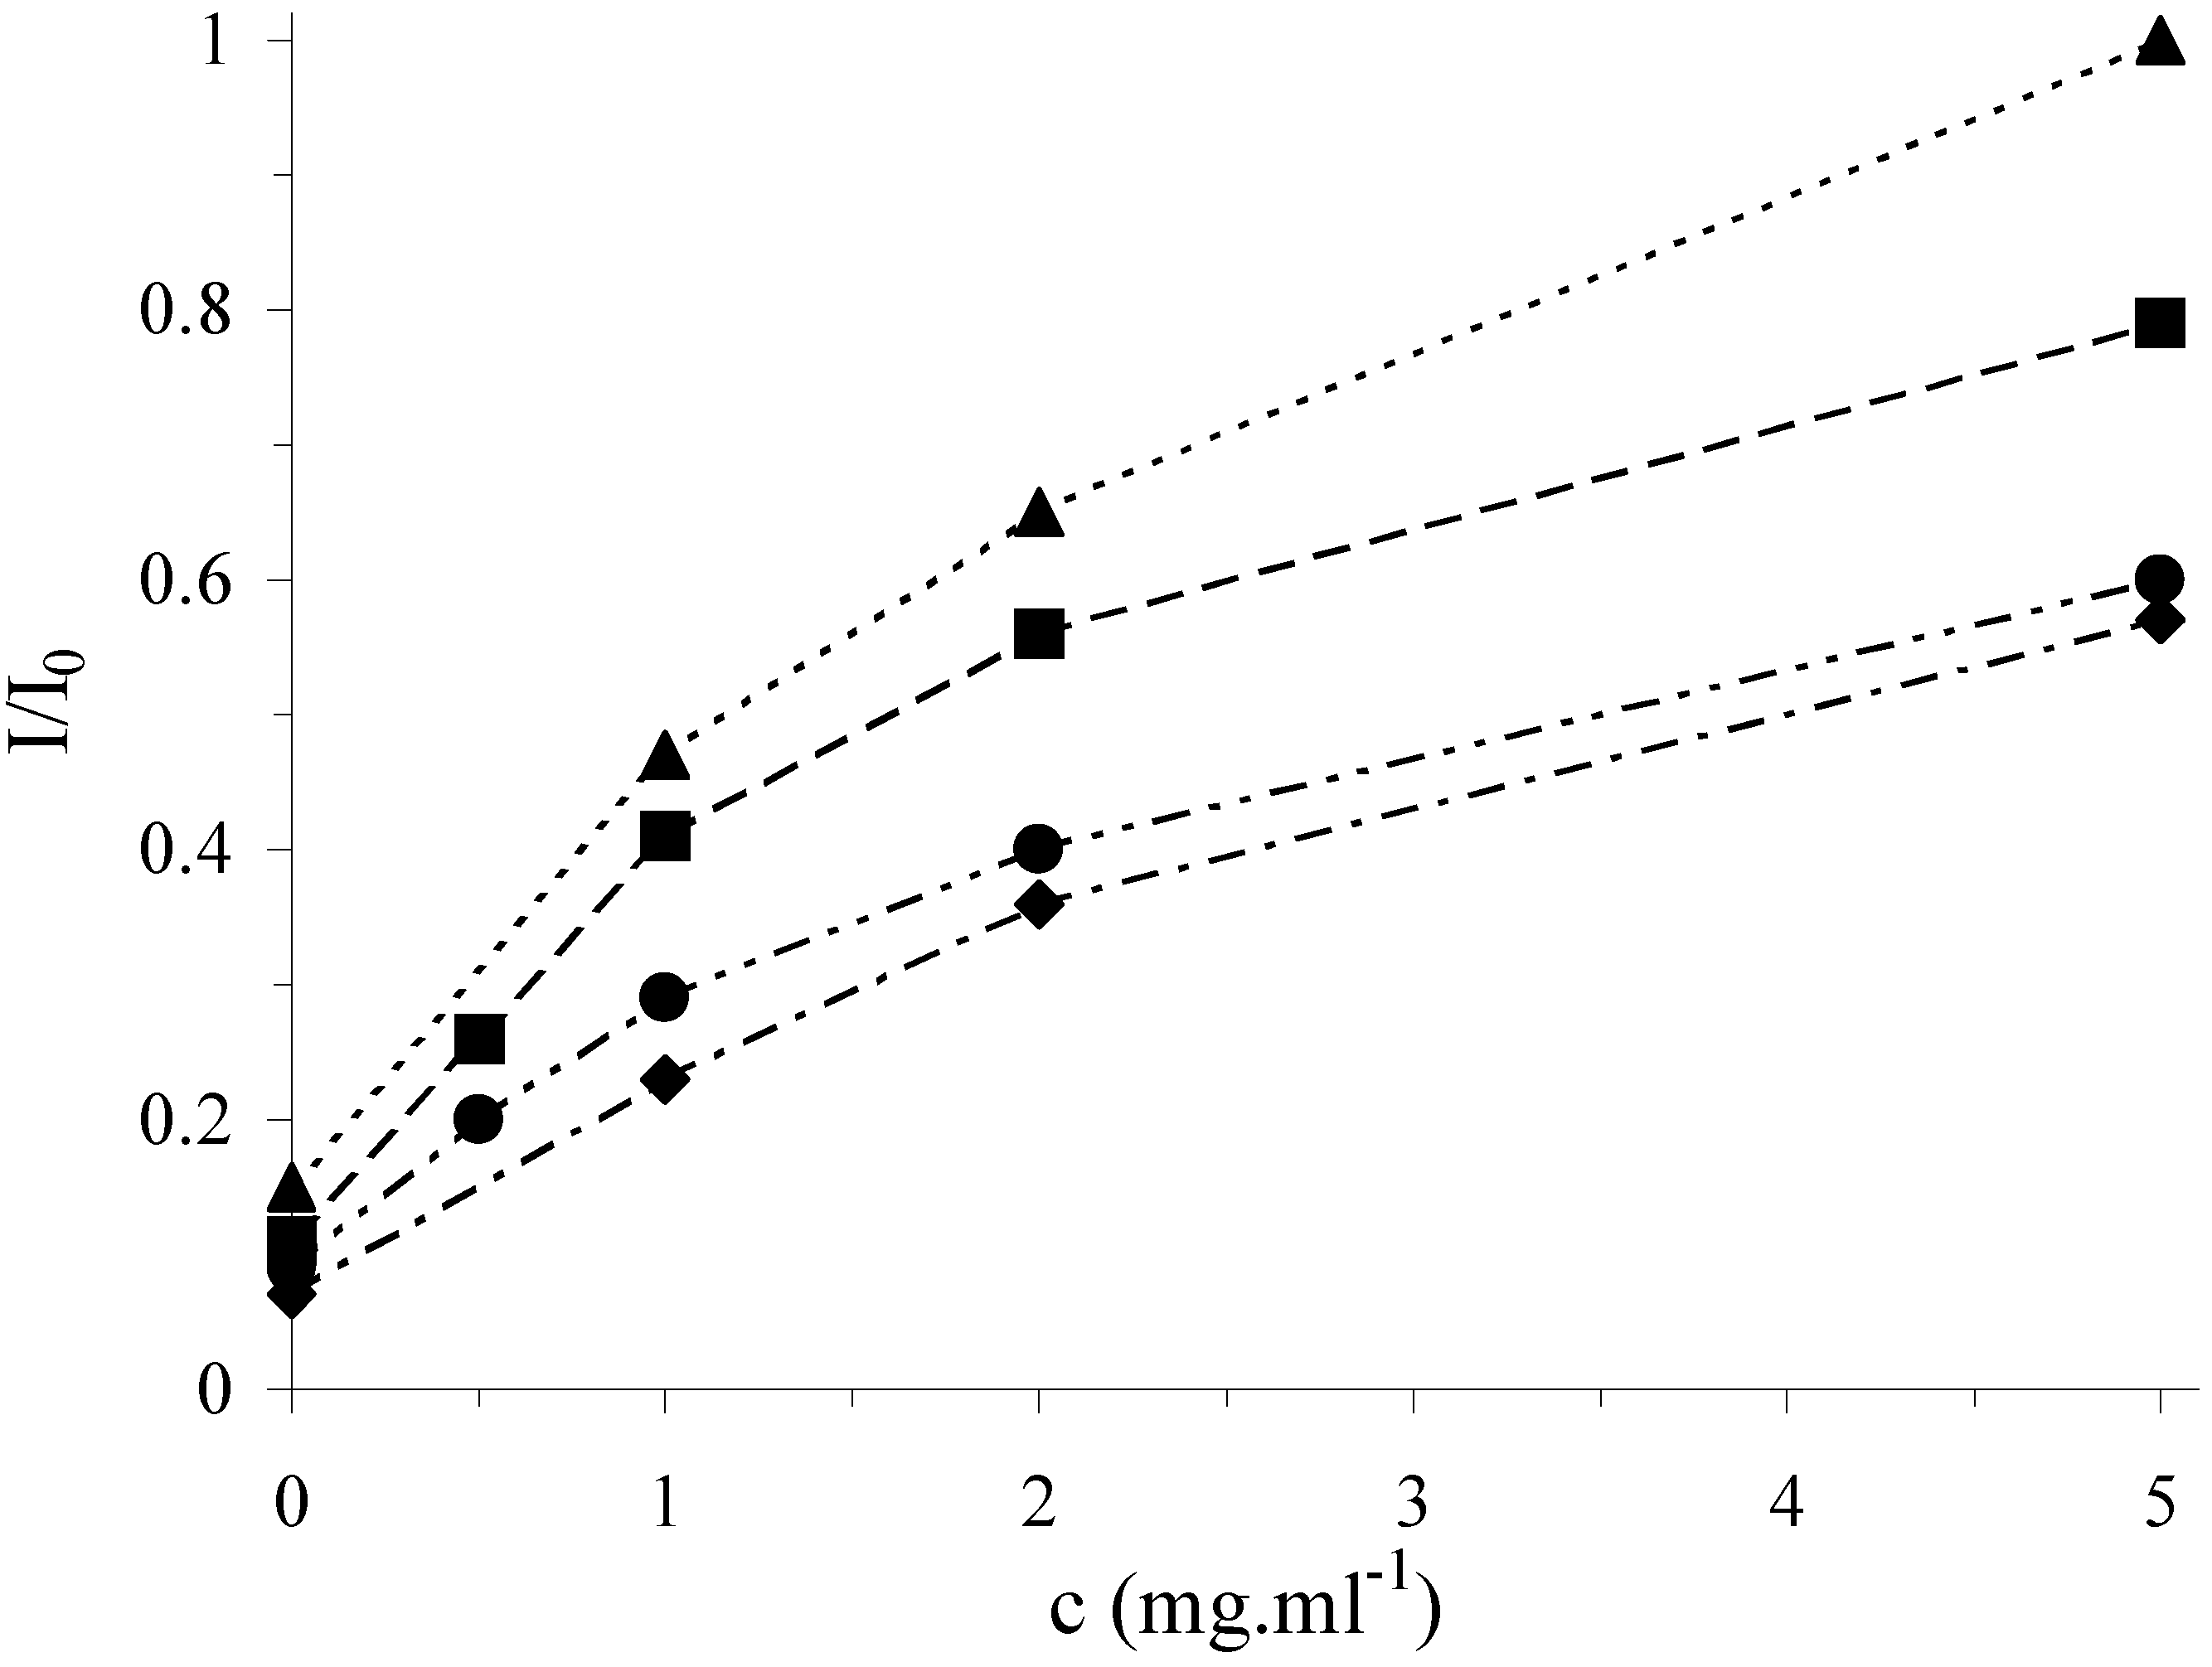
Figure 4.
Antioxidative effect of plant extracts in cleavage mixture on the relative marker signal at the DNA/SPE: lemon balm (▲), oregano (■), thyme (●) and agrimony (◆). Other conditions as in
Figure 3.
Figure 4.
Antioxidative effect of plant extracts in cleavage mixture on the relative marker signal at the DNA/SPE: lemon balm (▲), oregano (■), thyme (●) and agrimony (◆). Other conditions as in
Figure 3.
Table 1.
HPLC determination of the phenolic acids in the aqueous plant extracts (2g dry plant /100ml).
Table 1.
HPLC determination of the phenolic acids in the aqueous plant extracts (2g dry plant /100ml).
| Plant material | Concentration of acid (mg/g of the dry plant) |
| Rosmarinic acid | Caffeic acid |
| Lemon balm | 4.24 | 1.50 |
| Oregano | 25.70 | 2.12 |
| Thyme | not detectable | 1.19 |
| Agrimony | 0.16 | not detectable |
In
Fig. 3 and
Fig. 4, a strong protection of surface attached DNA from its damage is clearly shown which confirms the antioxidative activity of all tested samples. The effect of antioxidants increases with their concentration (given as mg of the dry plant added in the form of the extract per 1 ml of the cleavage mixture) and the curves level off at high concentrations. According to the saturation level, the activity of the plant extracts under study can be ordered as follows: lemon balm > oregano > thyme > agrimony. The antioxidative activity of the plant extracts for a given concentration of dry plant in the cleavage mixture, for instance, 1.0 mg/ml, was also expressed in the terms of the concentration of the standard (rosmarinic acid) which leads to the same I/I
0 value. The results obtained with the DNA biosensor are shown in
Table 2.
Table 2.
Antioxidative activity of the plant extracts with the concentration of 1.0 mg dry plant / ml in the cleavage mixture expressed in the terms of the concentration of rosmarinic acid in the cleavage mixture leading to the same value of the I/I
0 relative signal of the DNA marker (obtained using
Fig. 3 and
Fig. 4).
Table 2.
Antioxidative activity of the plant extracts with the concentration of 1.0 mg dry plant / ml in the cleavage mixture expressed in the terms of the concentration of rosmarinic acid in the cleavage mixture leading to the same value of the I/I0 relative signal of the DNA marker (obtained using Fig. 3 and Fig. 4).
| | Lemon balm | Oregano | Thyme | Agrimony |
|---|
| Equivalent of rosmarinic acid (mg/ml) | 0.046 | 0.039 | 0.028 | 0.021 |
Table 3.
Antiradical activity of the plant extracts determined spectrophotometrically with the DPPH radical. The efficient concentration (EC50, in g antioxidant/g DPPH) and the antiradical power (ARP = 1/EC50).
Table 3.
Antiradical activity of the plant extracts determined spectrophotometrically with the DPPH radical. The efficient concentration (EC50, in g antioxidant/g DPPH) and the antiradical power (ARP = 1/EC50).
| | Rosmarinic acid | Caffeic acid | Lemon balm | Oregano | Thyme | Agrimony |
|---|
| EC50 | 0.10 | 0.09 | 1.70 | 1.12 | 4.42 | 2.49 |
| ARP | 10.4 | 11.1 | 0.59 | 0.90 | 0.23 | 0.40 |
To validate the assay, antiradical measurements have been performed using the spectrophotometric method with the DPPH radical as reported previously [
6,
7]. The antiradical activity of the plant extracts was expressed using conventional parameters such as the efficient concentration necessary to decrease the initial DPPH concentration by 50 % (EC
50) and the antiradical power (ARP equal to 1/EC
50). The larger is ARP, the more efficient the antioxidant. The EC
50 and ARP values obtained are summarized in
Table 3. Taking into the account small differences in the antioxidative activity of both standard acids as well as some couples of the plant extracts (lemon balm - oregano and thyme - agrimony), the antioxidative activity determined with the electrochemical sensor follows generally the order of the antiradical activity found with DPPH. The orders of antiradical activity and antioxidative activity of the plant extracts follow quite good the concentration of the phenolic acids which can be taken as an evidence for their contribution to the above effects.
It is clear from the literature that the antioxidative activity is operationally defined. For instance, changes in order of the antioxidant activity of caffeic acid, rosmarinic acid and related compounds according to experimental conditions used at the lipid oxidation in the Rancimat method were reported [
27]. Moreover, a higher activity of rosmarinic acid than that of caffeic acid was also found using the DPPH method [
27].


