1. Introduction
Essential trace elements are known to play important roles in many biochemical processes, including the construction of biological tissues and the sustaining and adjusting of physiological systems [
1]. These elements show positive effects in physiological functions at optimal concentrations, whereas shortage or excessive concentrations affect biochemical processes and may evoke deficiency and toxicity. Because essential trace elements are both directly and indirectly related to diseases, detection with fluorescence imaging has become a useful tool in elucidating their distribution and dynamic states in living organisms, providing extensive information about diseases and facilitating the development of therapeutic strategies [
2].
Zinc is the second-most abundant trace element in the living body and is involved in vital physiological roles such as enzyme regulation, gene expression, immune system response, and neurotransmission [
2,
3,
4,
5,
6]. Most endogenous zinc is tightly bound to proteins for their structural and catalytic functions, whereas a small amount of zinc exists in free or labile forms in several tissues [
6,
7]. The disruption of zinc homeostasis causes serious damage related to neurodegenerative diseases, indicating that free and labile zinc plays an important role as an intracellular second messenger [
7,
8,
9].
To detect and visualize the complicated physiological and pathological functions of zinc, various fluorescence Zn
2+ sensors have been developed based on fluorophores such as coumarin, rhodamine, and cyanine [
2,
10,
11,
12]. These sensors have unique properties in selectivity and sensitivity. Recently, Zn
2+ high-specific sensors discriminating Zn
2+ from Cd
2+ have been reported [
13]. However, the details of zinc homeostatic processes are still unclear. Because the endogenous Zn
2+ concentration is low (subnanomolar to millimolar range), high background fluorescence in a probe is a significant drawback in imaging small amounts of Zn
2+ in living cells [
12]. We previously reported pyridine–pyridone-based fluorescent Zn
2+ sensors, in which the pyridine–pyridone core structure acted as both the chelating functionality for Zn
2+ and the fluorescent moiety, such that the sensor has a low molecular weight (below 500 g mol
−1) and has good cell membrane permeability [
14,
15,
16]. The fluorescence mechanism of pyridine–pyridone sensors is the formation of an intramolecular charge transfer (ICT) state, and the separation between the phenyl ring as an electron-donor and the pyridone ring as a fluorophore influenced the push–pull system of the sensors, weakening the ICT and resulting in a decrease in background fluorescence [
14]. The sensors could visualize the exogenously-added Zn
2+ in living cells; however, we realized that further reducing the background fluorescence of the Zn
2+ sensor was required to detect endogenous Zn
2+.
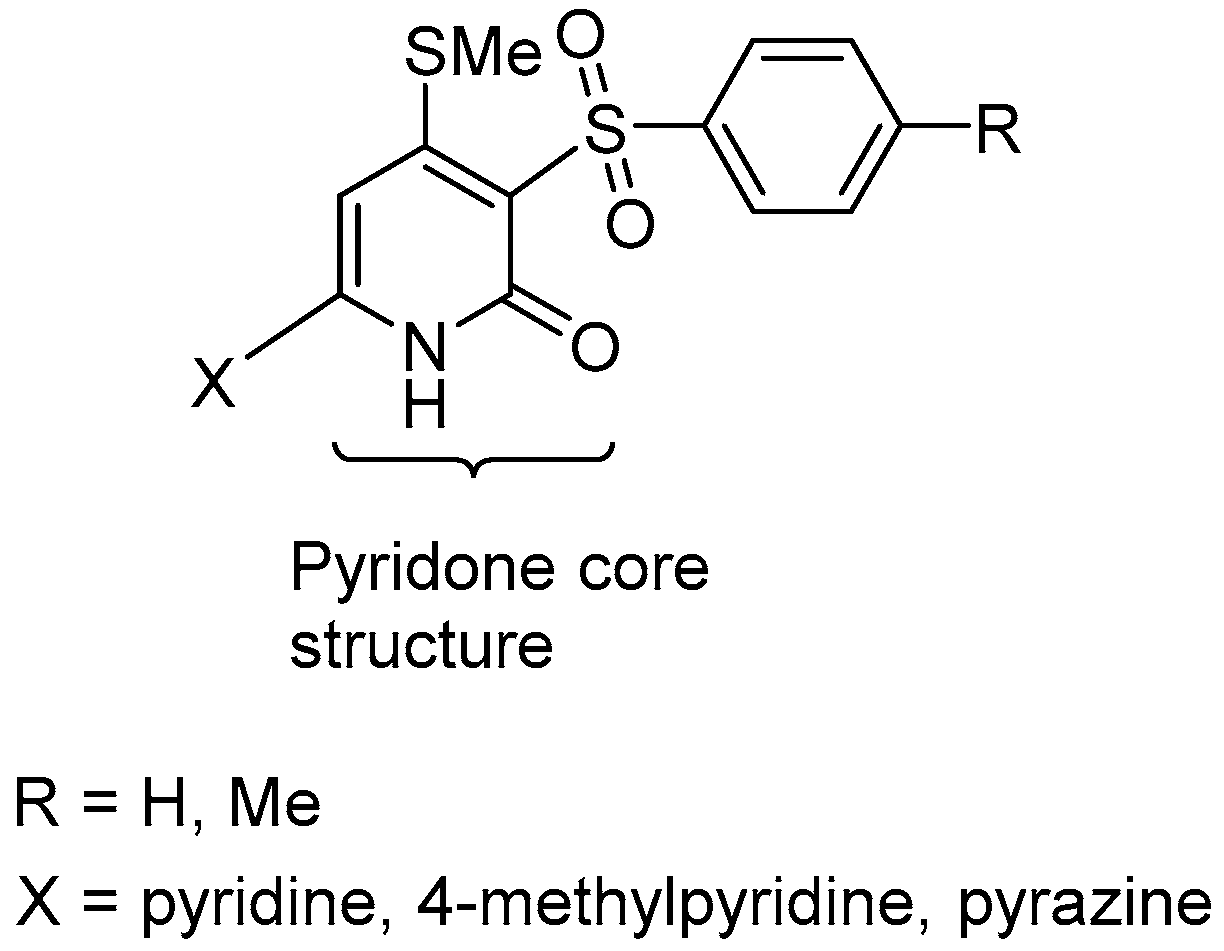
Herein, we reported novel biheteroaryl Zn2+ fluorescence compounds (3a,b, 4a,b, and 5a,b), which have a sulfonyl group as a strong electron-withdrawing group inhibiting the push–pull system, thus strongly reducing the background fluorescence of the sensors. The introduction of substituents also affected fluorescence properties such as intensity, excitation, and emission wavelength with or without Zn2+. From the structure–fluorescence relationship analysis of the substituent effects in the pyridone core structure, 3-(phenylsulfonyl)-pyrazine–pyridone (5b), with pyrazine and tosyl groups, exhibited favorable properties as a Zn2+ sensor. In this paper, we described the design and synthesis of fluorescence compounds and tested a biological application that successfully indicated that sensor 5b could detect endogenous Zn2+ in lung cancer cells.
2. Materials and Methods
2.1. Materials and Instruments
All chemicals were of the highest purity available. 1H-NMR was measured on a Varian Mercury-300 (300 MHz) with chemical shifts reported as ppm. Mass spectra (MS) and high-resolution MS (HRMS) were recorded on a Thermo Fisher Scientific Exactive spectrometer. Fluorescence spectra were obtained on a F7000 fluorescence spectrophotometer (Hitachi High-Tech, Tokyo, Japan) and a RF-5300PC fluorescence spectrophotometer (Shimadzu, Kyoto, Japan).
2.2. Synthesis of 4-(Methylsulfanyl)-5-(Phenylsulfonyl)-[2,2’-Bipyridin]-6(1H)-One (3a)
3,3-Bis(methylsulfanyl)-2-(phenylsulfonyl)acrylonitrile (
2a; 2.84 g, 10 mmol) [
17,
18] was slowly added to a solution of 2-acetylpyridine (
1a; 1.21 g, 10.0 mmol) and sodium hydroxide (0.56 g, 14 mmol) in DMSO over 30 min, and the mixture was stirred for 2 h at room temperature. After adding sodium hydroxide (0.56 g, 14 mmol), the mixture was stirred for an additional 3 h at room temperature. The reaction mixture was poured into 100 mL of water and adjusted to pH 3–4 with a 10% hydrochloric acid solution. The mixture was extracted with 100 mL of chloroform three times. Organic extracts were combined, washed with water, and dried over anhydrous sodium sulfate. After concentration in vacuo, the residue was refluxed in 1% hydrochloric acid solution for 1 h. The precipitate that appeared was collected by filtration, washed with water, and recrystallized from methanol to give
3a (0.27 g, 5.7 mmol, 7.5%) as brown crystals. Melting point (Mp) 331–332 °C.
1H-NMR (DMSO-d
6, 300 MHz): δ 2.71 (s, 3H), 7.01 (s, 1H), 7.55–7.64 (m, 3H), 7.90–7.98 (m, 3H), 8.18 (d,
J = 8.4 Hz, 2H), 8.74 (d,
J = 4.5 Hz, 1H), 11.76 (brs, 1H). MS m/z: 359 [M + H
+]. HRMS calcd. for C
17H
15N
2O
3S
2 [M + H
+]: 359.0524. Found: 359.0518.
2.3. Synthesis of 4-(Methylsulfanyl)-5-Tosyl-[2,2’-Bipyridin]-6(1H)-One (3b)
Compound 3b (0.67 g, 1.8 mmol) was prepared in 39% yield from 0.60 g (5.0 mmol) of 1a and 1.5 g (5.0 mmol) of 3,3-bis(methylsulfanyl)-2-tosylacrylonitrile (2b) in a manner similar to that described for the synthesis of 3a. An analytical sample was recrystallized from methanol to give dark gray crystals. Mp > 400 °C. 1H-NMR (DMSO-d6, 300 MHz): δ 2.41 (s, 3H), 2.71 (s, 3H), 6.98 (s, 1H), 7.46 (d, J = 8.4 Hz, 2H), 7.54–7.58 (m, 3H), 7.77 (d, J = 8.4 Hz, 2H), 8.71 (d, J = 3.9 Hz, 1H). MS m/z: 371 [M – H+]. HRMS calcd. for C18H15N2O3S2 [M – H+]: 371.0524. Found: 371.0532.
2.4. Synthesis of 4’-Methyl-4-(Methylsulfanyl)-5-(Phenylsulfonyl)-[2,2’-Bipyridin]-6(1H)-One (4a)
Compound 4a (1.14 g, 3.0 mmol) was prepared in 61% yield from 0.68 g (5.0 mmol) of 2-acetyl-4-methylpyridine (1b) and 1.42 g (5.0 mmol) of 2a in a manner similar to that described for the synthesis of 3a. An analytical sample was recrystallized from methanol to give dark gray crystals. Mp 221–222 °C. 1H-NMR (DMSO-d6, 300 MHz): δ 2.51 (s, 3H), 2.70 (s, 3H), 6.91 (s, 1H), 7.25 (d, J = 4.8 Hz, 1H), 7.48 (s, 1H), 7.55–7.62 (m, 3H), 7.75 (d, J = 7.8 Hz, 2H), 8.59 (d, J = 4.8 Hz, 1H). MS m/z: 371 [M – H+]. HRMS calcd. for C18H15N2O3S2 [M – H+]: 371.0524. Found: 371.0531.
2.5. Synthesis of 4’-Methyl-4-(Methylsulfanyl)-5-Tosyl-[2,2’-Bipyridin]-6(1H)-One (4b)
Compound 4b (0.31 g, 0.8 mmol) was prepared in 27% yield from 0.41 g (3.0 mmol) of 1b and 0.89 g (3.0 mmol) of 2b in a manner similar to that described for the synthesis of 3a. An analytical sample was recrystallized from methanol to give dark gray crystals. Mp > 400 °C. 1H-NMR (DMSO-d6, 300 MHz): δ 2.39 (s, 3H), 2.52 (s, 3H), 2.70 (s, 3H), 6.91 (s, 1H), 7.34–7.45 (m, 4H), 7.62 (d, J = 8.4 Hz, 2H), 8.59 (d, J = 4.2 Hz, 1H). MS m/z: 385 [M – H+]. HRMS calcd. for C19H17N2O3S2 [M – H+]: 385.0681. Found: 385.0689.
2.6. Synthesis of 4-(Methylsulfanyl)-3-(Phenylsulfonyl)-6-(Pyrazin-2-Yl)Pyridin-2(1H)-One (5a)
Compound 5a (0.16 g, 0.5 mmol) was prepared in 9% yield from 0.61 g (5.0 mmol) of 2-acetylpyrazine (1c) and 1.42 g (5.0 mmol) of 2a in a manner similar to that described for the synthesis of 3a. An analytical sample was recrystallized from methanol to give dark gray crystals. Mp 188–189 °C. 1H-NMR (DMSO-d6, 300 MHz): δ 2.73 (s, 3H), 7.09 (s, 1H), 7.60 (m, 2H), 7.66 (m, 1H), 7.70 (d, J = 7.2 Hz, 2H), 8.76 (d, J = 1.8 Hz, 1H), 8.83 (d, J = 1.5 Hz, 1H), 9.12 (s, 1H). MS m/z: 358 [M – H+]. HRMS calcd. for C16H12N3O3S2 [M – H+]: 358.0320. Found: 358.0331.
2.7. Synthesis of 4-(Methylsulfanyl)-6-(Pyrazin-2-Yl)-3-Tosylpyridin-2(1H)-One (5b)
Compound 5b (0.19 g, 0.5 mmol) was prepared in 10% yield from 0.61 g (5.0 mmol) of 1c and 1.50 g (5.0 mmol) of 2b in a manner similar to that described for the synthesis of 3a. An analytical sample was recrystallized from methanol to give dark gray crystals. Mp 232–233 °C. 1H-NMR (DMSO-d6, 300 MHz): δ 2.38 (s, 3H), 2.72 (s, 3H), 7.13 (s, 1H), 7.41 (d, J = 8.1 Hz, 2H), 7.82 (d, J = 8.4 Hz, 2H), 8.80 (d, J = 0.9 Hz, 1H), 8.83 (d, J = 1.5 Hz, 1H), 9.12 (s, 1H). MS m/z: 372 [M – H+]. HRMS calcd. for C17H14N3O2S2 [M – H+]: 372.0477. Found: 372.0484.
2.8. Spectral Measurement Studies
A stock solution of each compound (1 mM) was prepared by dissolving in DMSO. Solutions of perchlorate salts of metal ions (Al
3+, Ca
2+, Cd
2+, Co
2+, Cu
2+, Fe
2+, Fe
3+, K
+, Mg
2+, Mn
2+, Na
+, Pb
2+, and Zn
2+) were prepared by dissolving in distilled water. The fluorescence of test compounds (10
−5 M) in HEPES buffer (100 mM, 5% DMSO, pH = 7.4) were analyzed in the presence of Zn
2+. Job’s plot was used to investigate the binding stoichiometries of
3a,b,
4a,b, and
5a,b to Zn
2+. The dissociation constant (
Kd) values were investigated by the following Benesi–Hildebrand plot [
19,
20].
where
F is the fluorescence intensity,
F0 is the fluorescence intensity without Zn
2+, and
Fmax is the fluorescence in addition of excess Zn
2+. The association constant (
Ka) is the inverse of
Kd and is determined from the slope of the straight line of the plot of 1/(
F –
F0) against 1/[Zn
2+]. The selectivity of each compound was investigated in HEPES buffer (100 mM, 5% DMSO, pH = 7.4). The fluorescence quantum yields were measured with respect to a quinine sulfate solution (Φ = 0.54) as the standard.
2.9. Cellular Imaging by Fluorescence Microscope
A549 human lung cancer cells were cultured in Dulbecco’s modified Eagle’s medium (DMEM) that included 10% fetal bovine serum and 1% penicillin at 37 °C in a humidified atmosphere with 5% CO2. To investigate the cell-membrane permeability of 5b, the cells were incubated with 100 μM of 1:1 Zn2+/pyrithione in the culture media for 30 min at 37 °C. After washing with phosphate-buffered saline (PBS), the treated cells were incubated with 5b (100 μM) in the culture media for 30 min at 37 °C. The incubated cells were imaged with fluorescence microscopy (Nikon Eclipse Ti). For N,N,N’,N’-tetrakis(2-pyridylmethyl)ethylenediamine (TPEN) studies, the cells were incubated with 1:1 Zn2+/pyrithione (100 μM) in the culture media for 30 min at 37 °C and washed with PBS. After incubating with 5b (100 μM) in the culture media for 30 min at 37 °C and washing with PBS, the cells were incubated with 100 μM of TPEN for an additional 30 min at 37 °C and imaged with fluorescence microscopy (Nikon Eclipse Ti).
To detect endogenous Zn2+, the cells were incubated with hydrogen peroxide (200 μM) in DMEM for 24 h at 37 °C. After washing with PBS, the cells were incubated with 5b (100 μM) in the culture media for 30 min at 37 °C. The incubated cells were imaged with fluorescence microscopy (Nikon Eclipse Ti). For TPEN studies, the cells were incubated with hydrogen peroxide (H2O2, 200 μM) in the culture media for 24 h at 37 °C and washed with PBS. After incubation with 5b (100 μM) in culture media for 30 min at 37 °C and washing with PBS, the cells were incubated with 100 μM of TPEN for an additional 30 min at 37 °C and imaged with fluorescence microscopy (Nikon Eclipse Ti).
3. Results
Our previous research demonstrated that the NH/OH proton of the pyridone core structure acted as a fluorescence off–on switch and that the weakening of the electron transfer from the electron-donating group to the pyridone core structure reduced the background fluorescence of the Zn
2+ sensors [
14,
15]. Then, to develop a lower background fluorescence sensor, we introduced benzensulfonyl or tosyl groups at the two-position of the pyridone ring (
Figure 1). In addition, Zn
2+ was bound to the bipyridyl form. Therefore, we introduced pyridine, 4-methylpyridine, or pyrazine as an electron-withdrawing heteroaryl group at the six-position of the pyridone ring. Pyrazine is a nitrogen-containing, six-membered heterocycle, which has lower basicity and a higher π-acceptor ability than pyridine [
21]. Therefore, it was expected that the replacement of pyridine with pyrazine would affect the compound’s coordination ability and fluorescent property towards Zn
2+. Compound
3a was synthesized from a one-pot reaction of 2-acetylpyridine (
1a) with sulfonyl ketene dithioacetal (
2a) in the presence of NaOH as a base, followed by treatment with 1% HCl (
Scheme 1). In a similar manner, compound
3b, having a tosyl group on the two-position of the pyridone ring, was obtained in 39% yield. Compounds
4a and
4b, having a 4-methyl-2-pyridyl group, were prepared from the reaction of 2-acetyl-4-methylpyridine (
1b) and sulfonyl ketene dithioacetal (
2a,b). The reaction of 2-acetylpyrazine (
1c) with sulfonyl ketene dithioacetals (
2a,b) afforded pyrazine–pyridone compounds (
5a,b) in 9% and 10% yields, respectively.
Compounds
3a,b,
4a,b, and
5a,b were soluble in aqueous media after dilution of their DMSO stock solutions, and all spectroscopic measurements were performed in HEPES buffer (100 mM, 5% DMSO, pH 7.4).
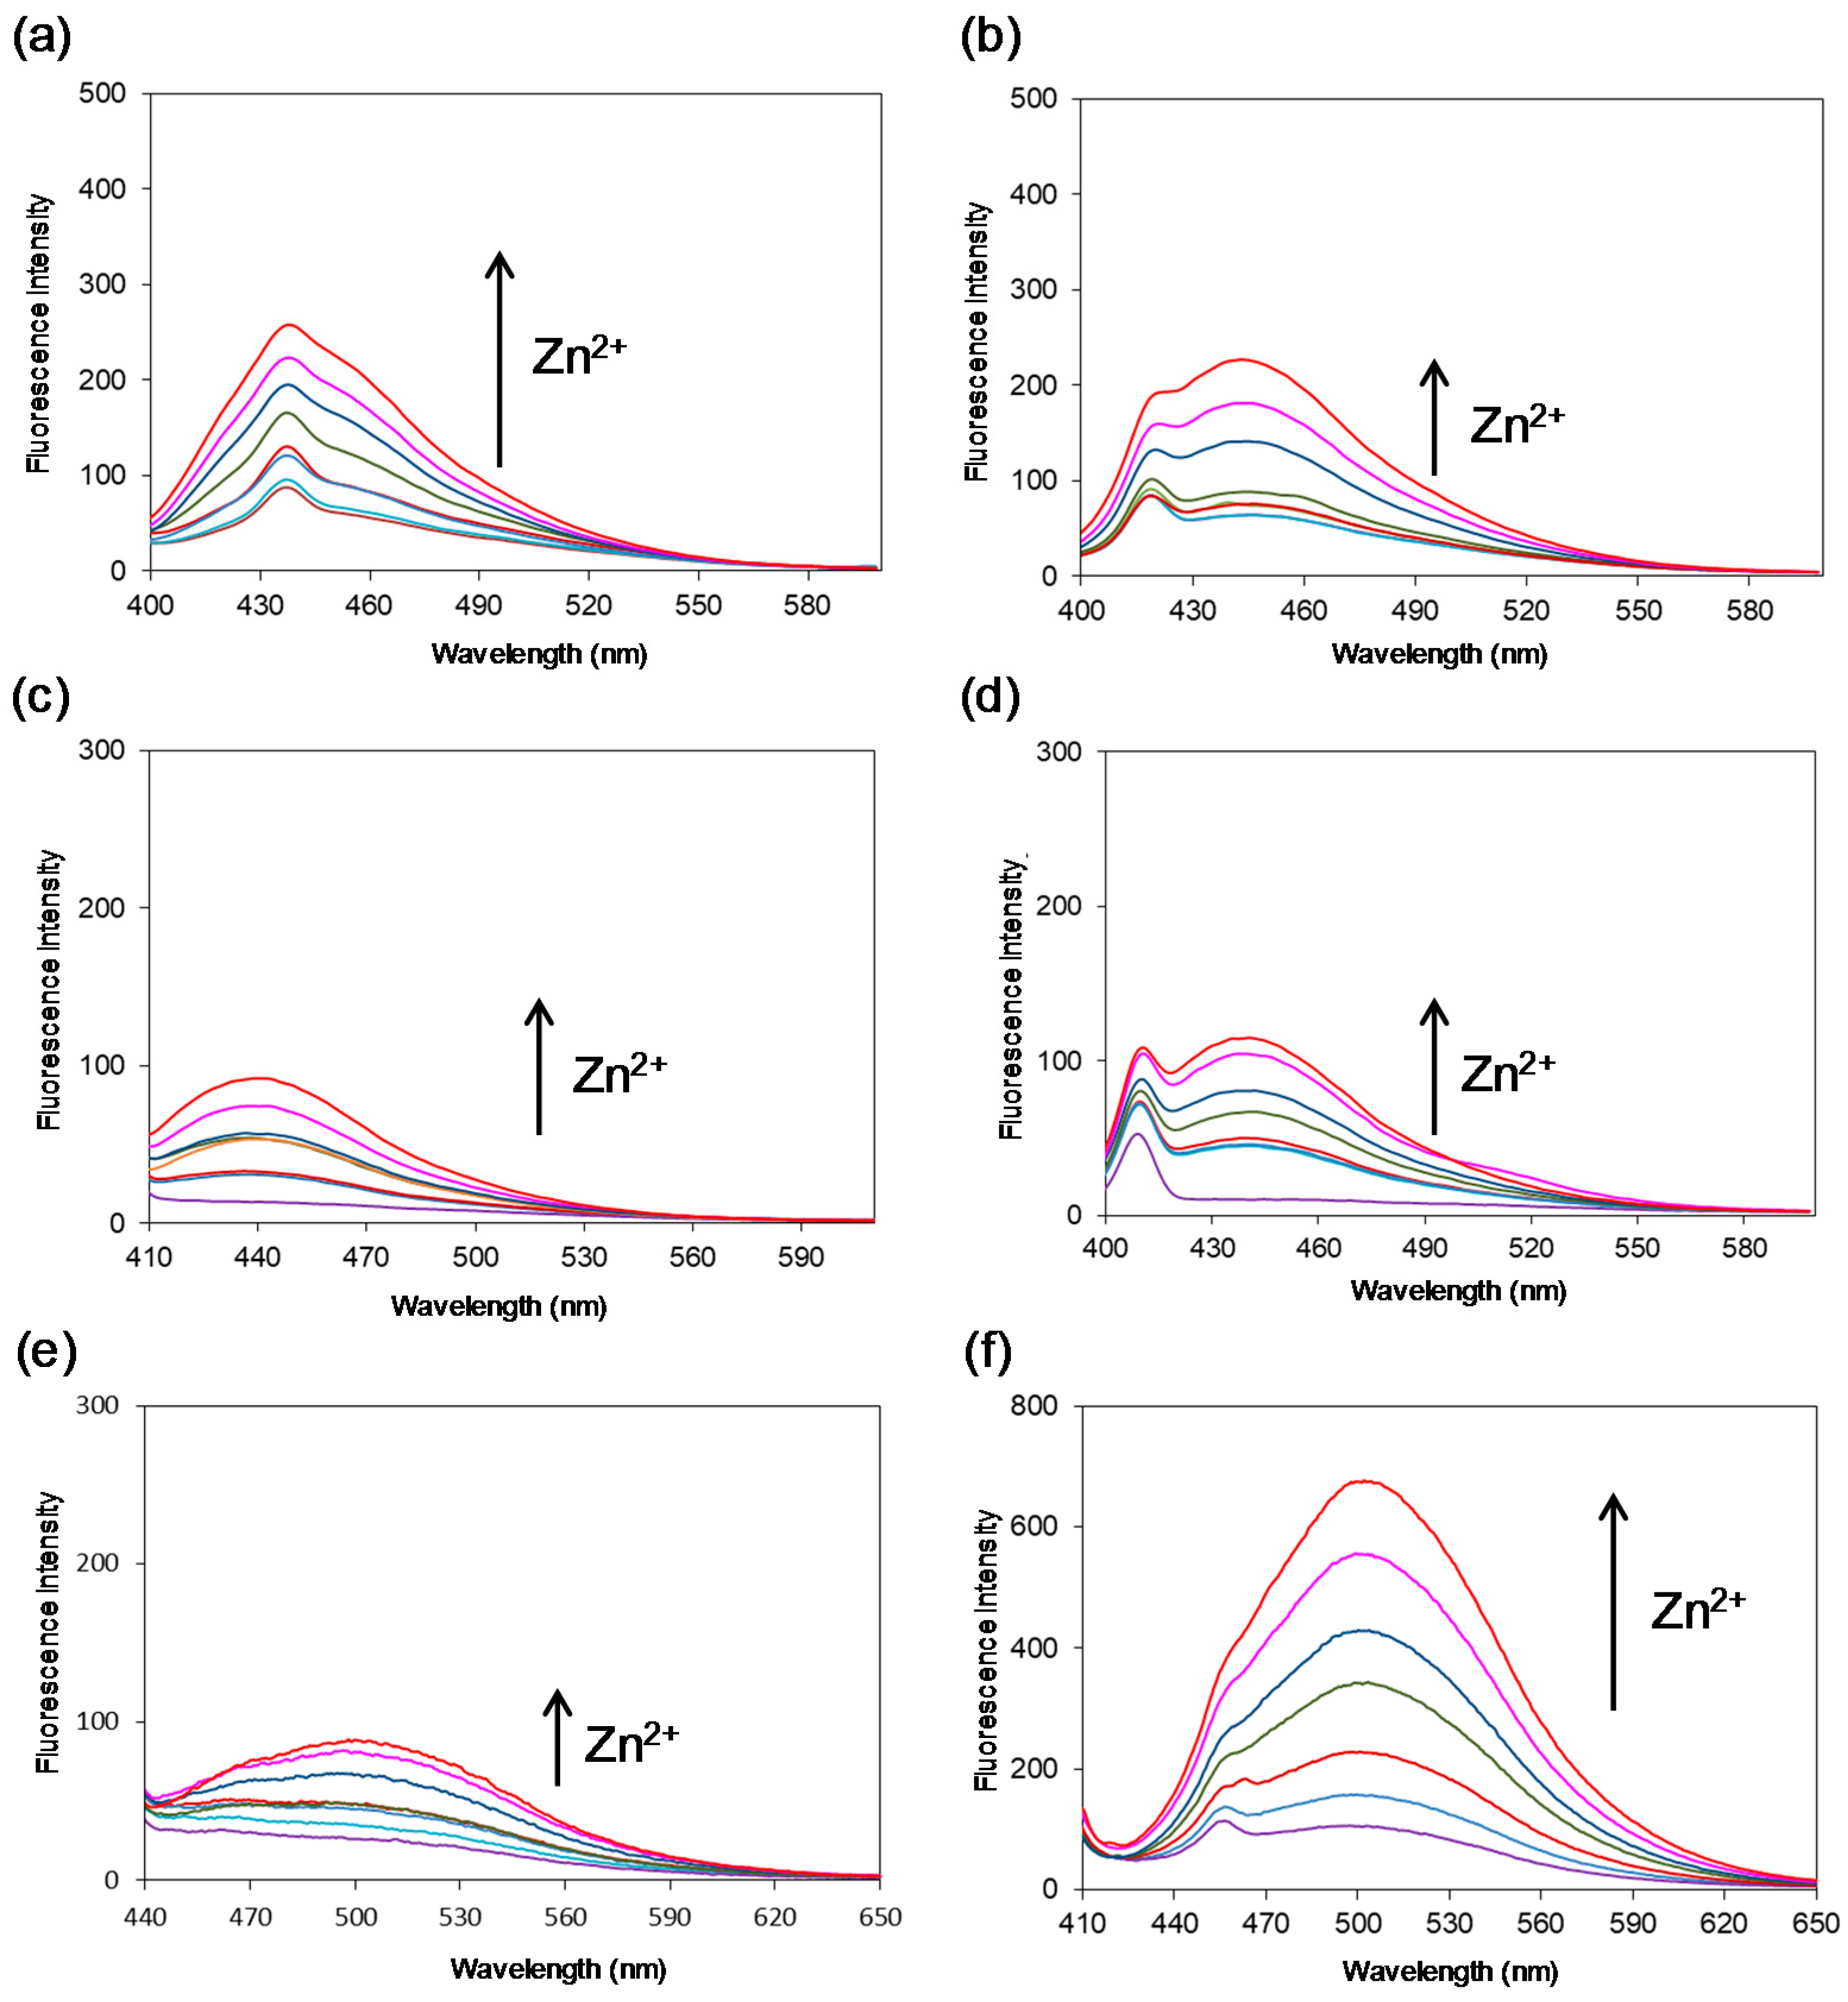
Figure 2 and
Table 1 show the fluorescence spectra and corresponding data of
3a,b,
4a,b, and
5a,b. All compounds were excited by 353–395 nm light, and the background fluorescence quantum yields (Φ) of the compounds were in the range of 4.1 × 10
−4–9.8 × 10
−4, which were considerably lower than previously reported pyridine–pyridone type compounds without a sulfonyl group [
14,
15,
16]. As expected, these results suggested that introduction of a sulfonyl group between the pyridone core structure inhibits electron transfer from the electron-donating group and reduces the background fluorescence of
3a,b,
4a,b, and
5a,b. After the addition of Zn
2+, the fluorescence intensities of all compounds gradually increased in a concentration-dependent manner with Zn
2+. Compounds
3a,b and
4a,b exhibited blue fluorescence at 430–442 nm, and the emission maximum wavelengths of
3b and
4b exhibited 4–5 nm bathochromic shifts by the introduction of a methyl group at the para position of the phenyl ring. In contrast, the methyl group of the 4-methyl-2-pyrigyl ring of
4a,b induced 7–8 nm hypsochromic shifts in the emission maximum wavelengths. In pyrazine compounds
5a,b, small bathochromic shifts were observed by introduction of the methyl group at the para position of the phenyl ring. On the other hand, the emission maximum wavelengths of compounds
5a,b showed large bathochromic shifts, approximately 60–70 nm, compared to compounds
3a,b and
4a,b with pyridyl moieties, and
5a,b emitted blue–green fluorescence around 500 nm. Since the emission maximum wavelengths of all previously reported pyridine–pyridone-type compounds were near 400–450 nm [
14,
15,
16], it is noteworthy that the emission wavelength could be tuned by the simple replacement of pyridine with pyrazine. In addition, compounds
5a,b showed very large Stokes shifts (over 100 nm), which became an advantage for detecting Zn
2+ without too much interference from the excitation light. The binding analysis of compounds
3a,b,
4a,b, and
5a,b and Zn
2+ indicated that the complex formations had 1:1 stoichiometries (
Supplementary data). We also calculated the dissociation constants (
Kd) of
3a,b,
4a,b, and
5a,b from the Benesi–Hildebrand equation [
18,
19] using fluorescent titration data (
Supplementary data). The
Kd values of
5a and
5b were 59 × 10
−5 M and 32 × 10
−5 M, respectively, which were higher than those of
3a,b and
4a,b (1.6 × 10
−5–9.4 × 10
−5 M). These results indicated that the replacement of pyridine with pyrazine obviously influenced the compound’s coordination ability and fluorescent property with Zn
2+. To investigate the selectivity of these compounds, various cations including Al
3+, Ca
2+, Cd
2+, Co
2+, Cu
2+, Fe
2+, Fe
3+, K
+, Mg
2+, Mn
2+, Na
+, and Zn
2+ were added to solutions of
3a,b,
4a,b, and
5a,b in HEPES buffer (100 mM, 5% DMSO, pH = 7.4). As shown in
Figure 3, all compounds showed selectivity toward Zn
2+, and especially the pyrazine compound
5b exhibited a large chelation-enhanced fluorescence (CHEF) effect with Zn
2+ and exhibited an 8.1-fold enhancement over
5b without Zn
2+ addition. Fluorescence enhancement was also observed upon addition of Cd
2+. Zn
2+ and Cd
2+ belong to the same group of the periodic table, therefore it has been reported that Cd
2+ interfered with the detection of Zn
2+ in various types of Zn
2+ sensors [
14,
15,
16,
22,
23]. However, Cd
2+ is not naturally occurring in living systems, so it may have little influence on visualizing cellular Zn
2+. With addition of other metal ions (Al
3+, Ca
2+, Co
2+, Cu
2+, Fe
2+, Fe
3+, K
+, Mg
2+, Mn
2+, and Na
+), no large fluorescence changes, including both CHEF effects and chelation-enhanced fluorescence quenching (CHEQ) effects, were observed. We also evaluated the fluorescence change with Pb
2+ having a wide-spectrum toxic effect in living systems, however both CHEF and CHEQ effects were not observed (
Supplementary data).
Among the compounds 3a,b, 4a,b, and 5a,b, pyrazine compound 5b had the most useful properties, namely low background fluorescence, emitted fluorescence at 504 nm, a large Stokes shift (over 100 nm), and an 8.1-fold fluorescence enhancement with Zn2+. Next, we performed further experiments, including a competition experiment, a test of pH influence, and cellular fluorescence imaging, to demonstrate the sensing ability of 5b.
Figure 4 shows the results of the competition experiment of
5b between Zn
2+ and other metal ions. The CHEF effect with Zn
2+ was quenched by the addition of Co
2+ or Cu
2+, whereas it was not affected by addition of alkali-metal ions (Na
+ and K
+) or group 2 ions (Ca
2+ and Mg
2+), which exist abundantly in millimolar concentrations in the living body. The fluorescence intensity with Cd
2+ was slightly weakened by the addition of Zn
2+. Next, we evaluated the fluorescence changes of
5b from pH 4.0 to 10.0 in the absence and presence of Zn
2+ (
Figure 5). The fluorescence intensity of
5b with Zn
2+ decreased in acidic conditions (pH 4.0 to 6.0). Protons might reflect the complexation Zn
2+ with
5b. On the other hand, the fluorescence intensity of the emission maximum at 504 nm was stable within the pH range 7.0–8.0. These results indicated that compound
5b could be utilized for cellular experiments under physiological conditions.
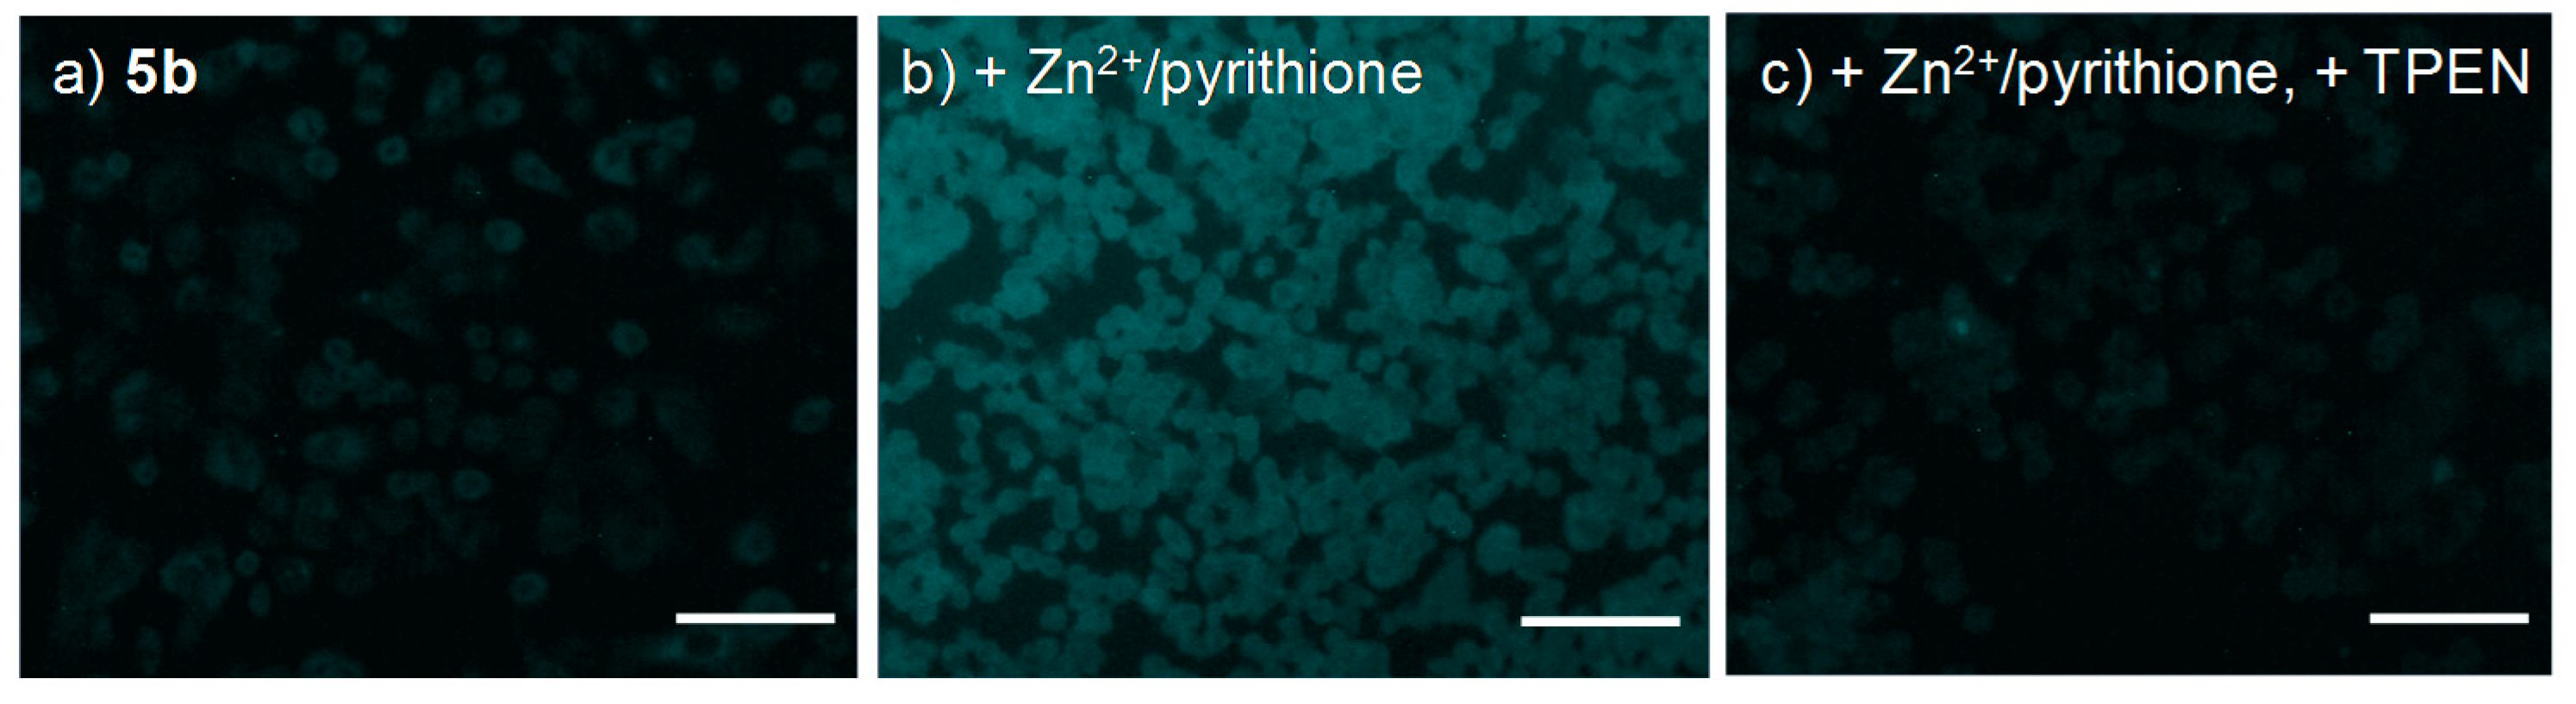
To evaluate the efficacy of
5b for living cell Zn
2+ imaging, we conducted fluorescence microscopy studies in human lung adenocarcinoma cells (A549). The cells incubated with
5b showed a negligible fluorescence due to its low background fluorescence (
Figure 6a). After addition of both
5b (100 μM) and Zn
2+/pyrithione (100 μM), bright intracellular fluorescence was observed (
Figure 6b). The addition of TPEN as a Zn
2+ high-affinity chelator decreased the cellular fluorescence of
5b (
Figure 6c) [
24]. These results indicated that compound
5b possessed good cell membrane permeability and that the intracellular fluorescence change was due to the selective interaction between compound
5b and Zn
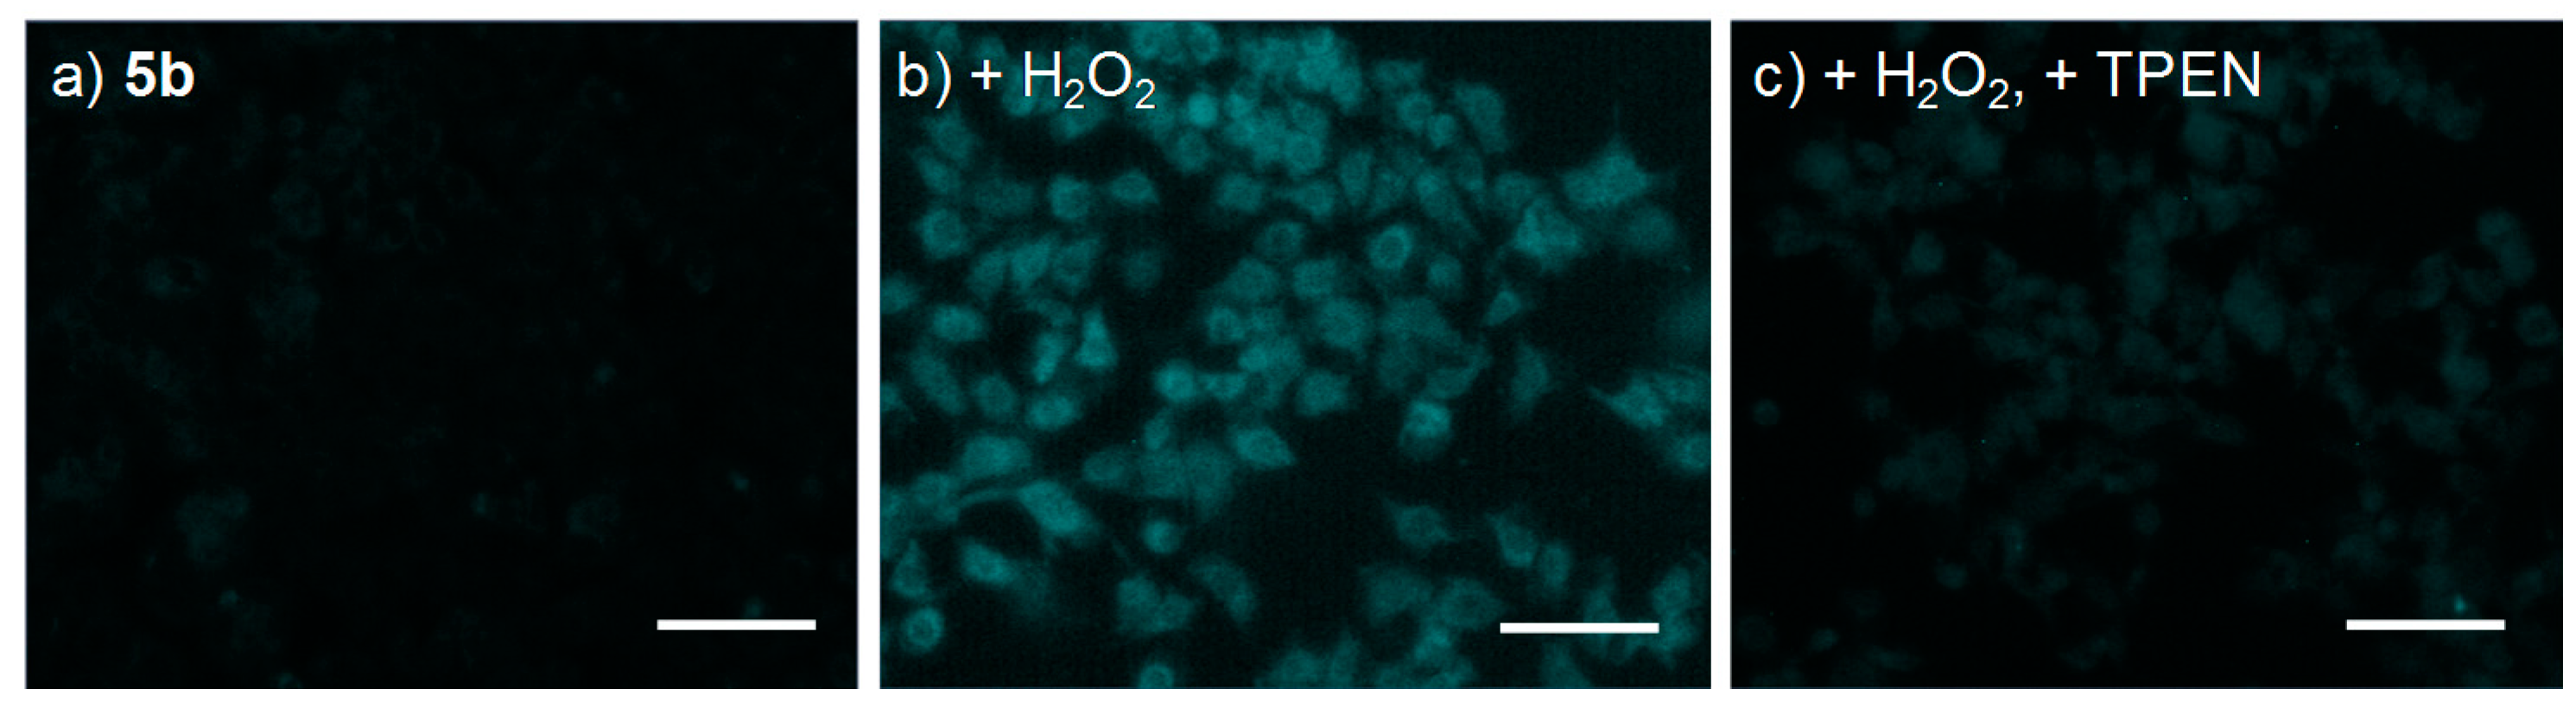
2+. In these experiments, zinc toxicity was not observed. We further evaluated the ability of
5b to detect endogenous Zn
2+ in apoptotic cells. It has been reported that Zn
2+ is released from intracellular zinc stores when the cells are in the apoptosis stage [
25]. Fluorescence enhancement was not observed in A549 cells after the induction of apoptosis by incubation with H
2O
2 (200 μM) for 24 h (
Figure 7a). On the other hand, bright fluorescence was observed when compound
5b was supplied to the cells and incubated for 30 min at 37 °C (
Figure 7b). To investigate fluorescence enhancement due to the interaction between compound
5b and endogenous Zn
2+, the cells treated with H
2O
2 for 24 h were additionally incubated with TPEN after treatment with
5b. As shown in
Figure 7c, the intracellular fluorescence decreased upon the addition of TPEN, suggesting that compound
5b could detect endogenous labile zinc ions.
4. Conclusions
To detect endogenous Zn2+, we designed and synthesized low-background-fluorescence sensors 3a,b,4a,b, and 5a,b from one-pot reactions of 2-acetylpyridines, 2-acetyl-4-methylpyridine, or 2-acetylpyrazine with sulfonyl ketene dithioacetals and investigated their fluorescence properties. The sulfonyl group between the phenyl ring and the three-position of the pyridone ring affected the ICT state, and the background fluorescence of 3a,b,4a,b, and 5a,b was considerably decreased. The CHEF effects of 3a,b,4a,b, and 5a,b were observed upon addition of Zn2+. Methyl substitution on the R positions of 3a, 4a, and 5a influenced the emission maximum wavelengths, and the replacement of pyridine with pyrazine induced large, approximately 60–70 nm bathochromic shifts. Upon addition of Zn2+, the pyrazine compound 5b exhibited favorable properties, including an emission wavelength at 504 nm, a large Stokes shift (over 100 nm), a large fluorescence enhancement, Zn2+ selectivity, and stability in physiological pH conditions. Furthermore, compound 5b exhibited favorable cell membrane permeability and selective detection of Zn2+ in living human lung adenocarcinoma A549 cells and visualized endogenous labile zinc ions from the cells during apoptosis. We expect that the pyrazine–pyridone biheteroaryl-based compound 5b will contribute toward a better understanding of Zn2+ biological functions.


