5.1. Theoretical Prediction of SNR
Table 2 and
Table 3 listed the parameters of the Luojia 1-01 satellite and image detector respectively.
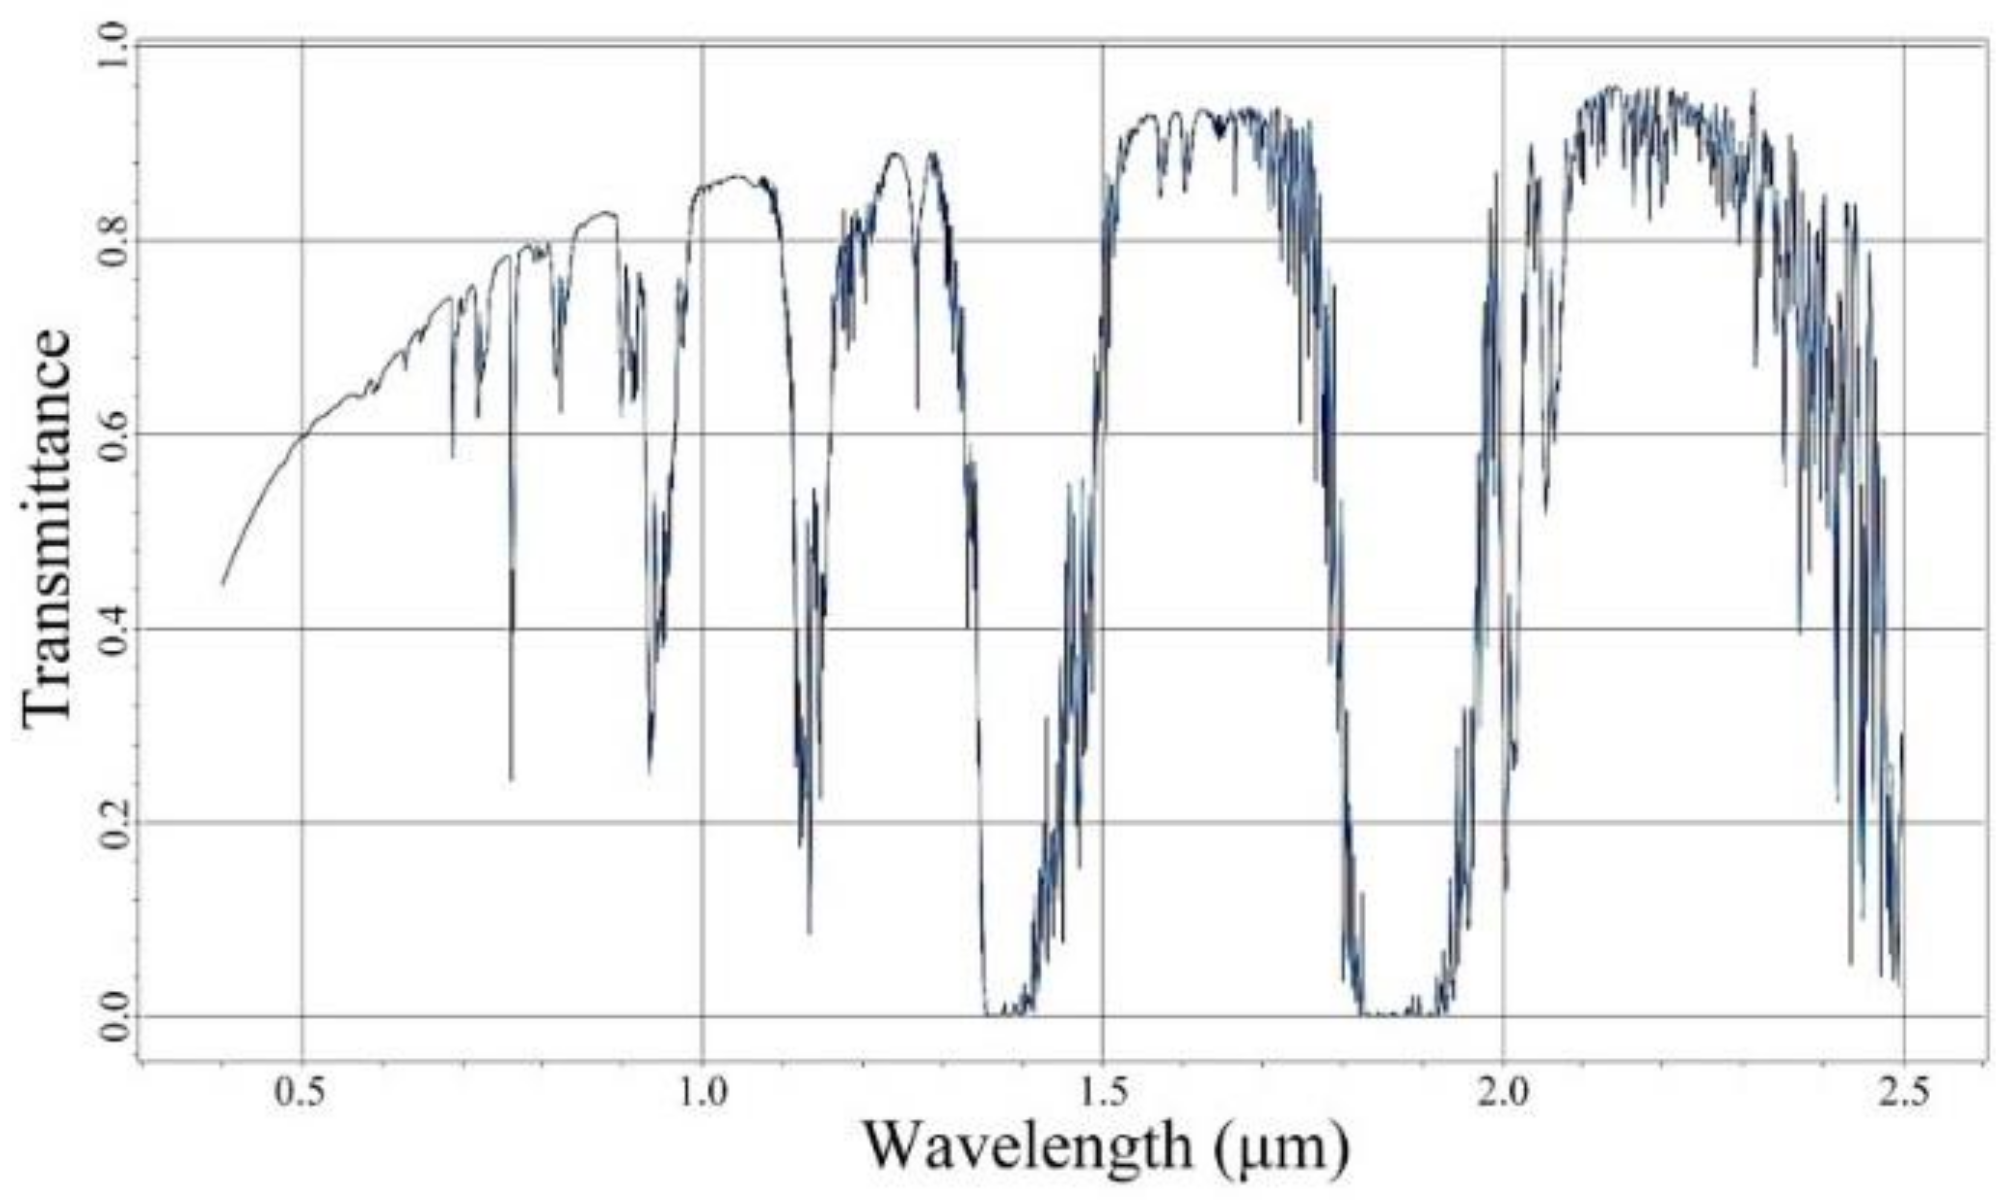
In the waveband of 0.5~0.9 μm, the average atmospheric transmittance
ta calculated from
Figure 4 is about 0.682. Under night-light illumination condition, the typical reflectance of ground objects is about 0.3. The quantum efficiency is the proportion of electrons number produced by detector to the photons number that incident to detector in exposure time. The quantum efficiency curve is shown in
Figure 7, and the average quantum efficiency
η in the spectrum of 0.5~0.9 μm is about 0.52.
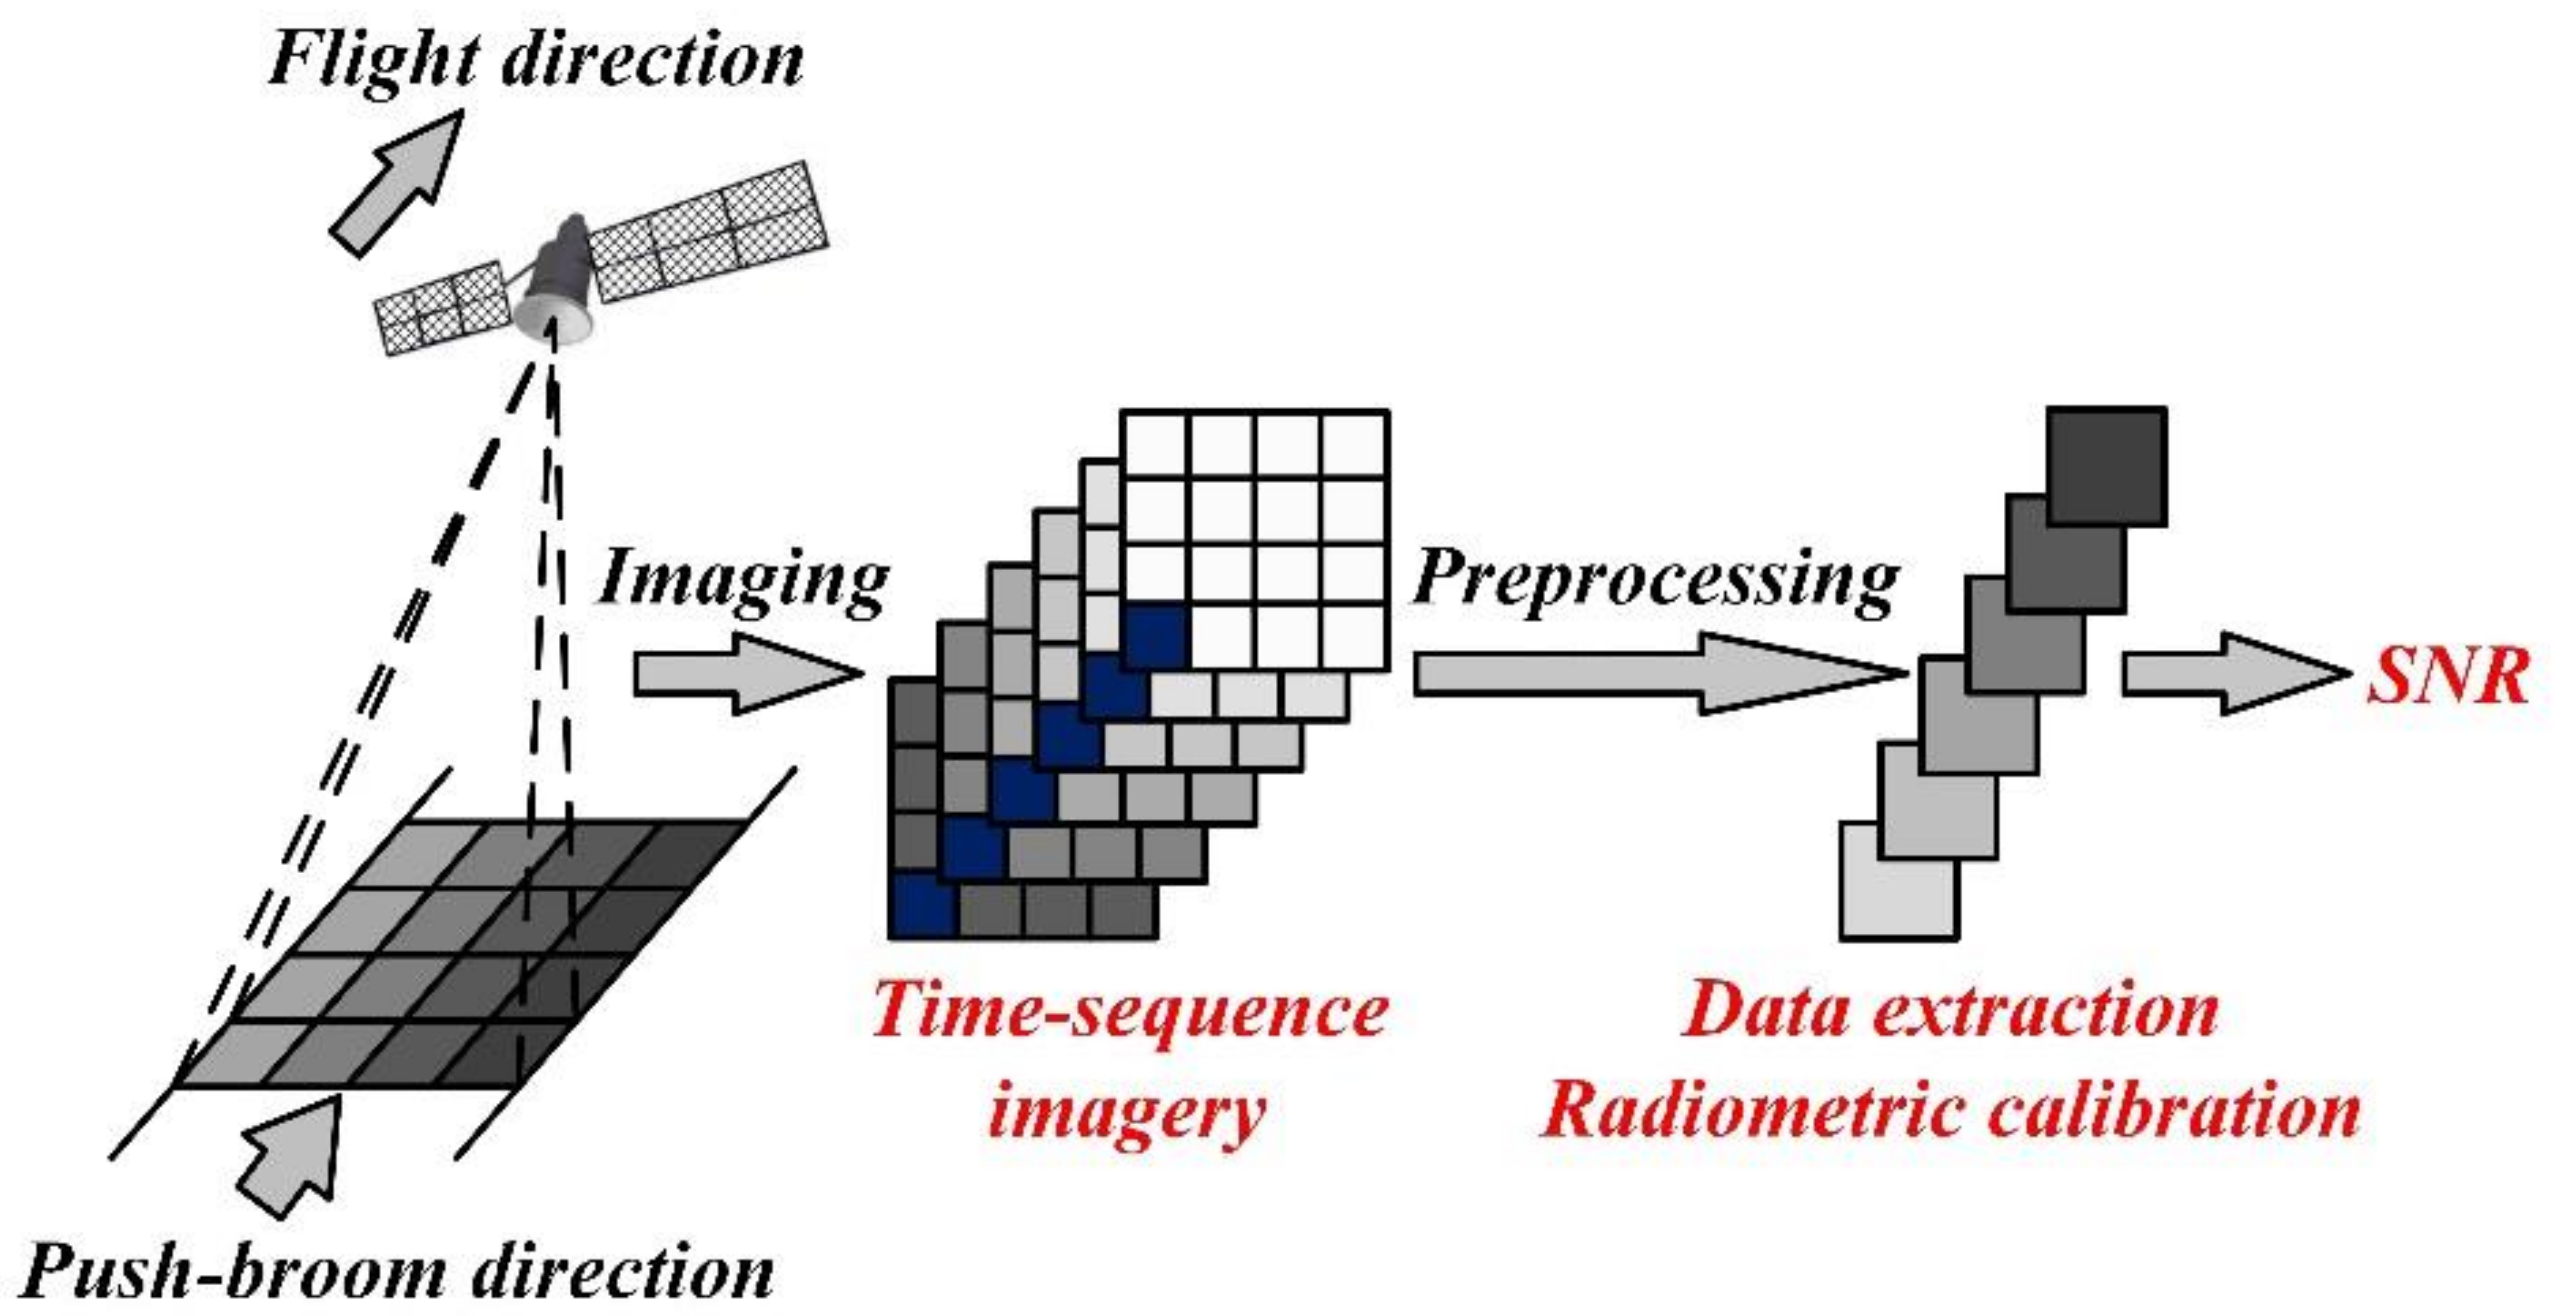
Under the push-broom mode, the image of object projected on detector varies with the motion of satellite. In order to guarantee the image quality, the exposure time is limited by velocity-to-height ratio, i.e., Tint ≤ GSD/VR, which means the motion of image on detector is less than one pixel, the ground velocity of satellite VR can be calculated according to Newton’s law of gravitation. On the orbit with altitude of 645 km, the exposure time satisfying Tint ≤ 18.86 ms.
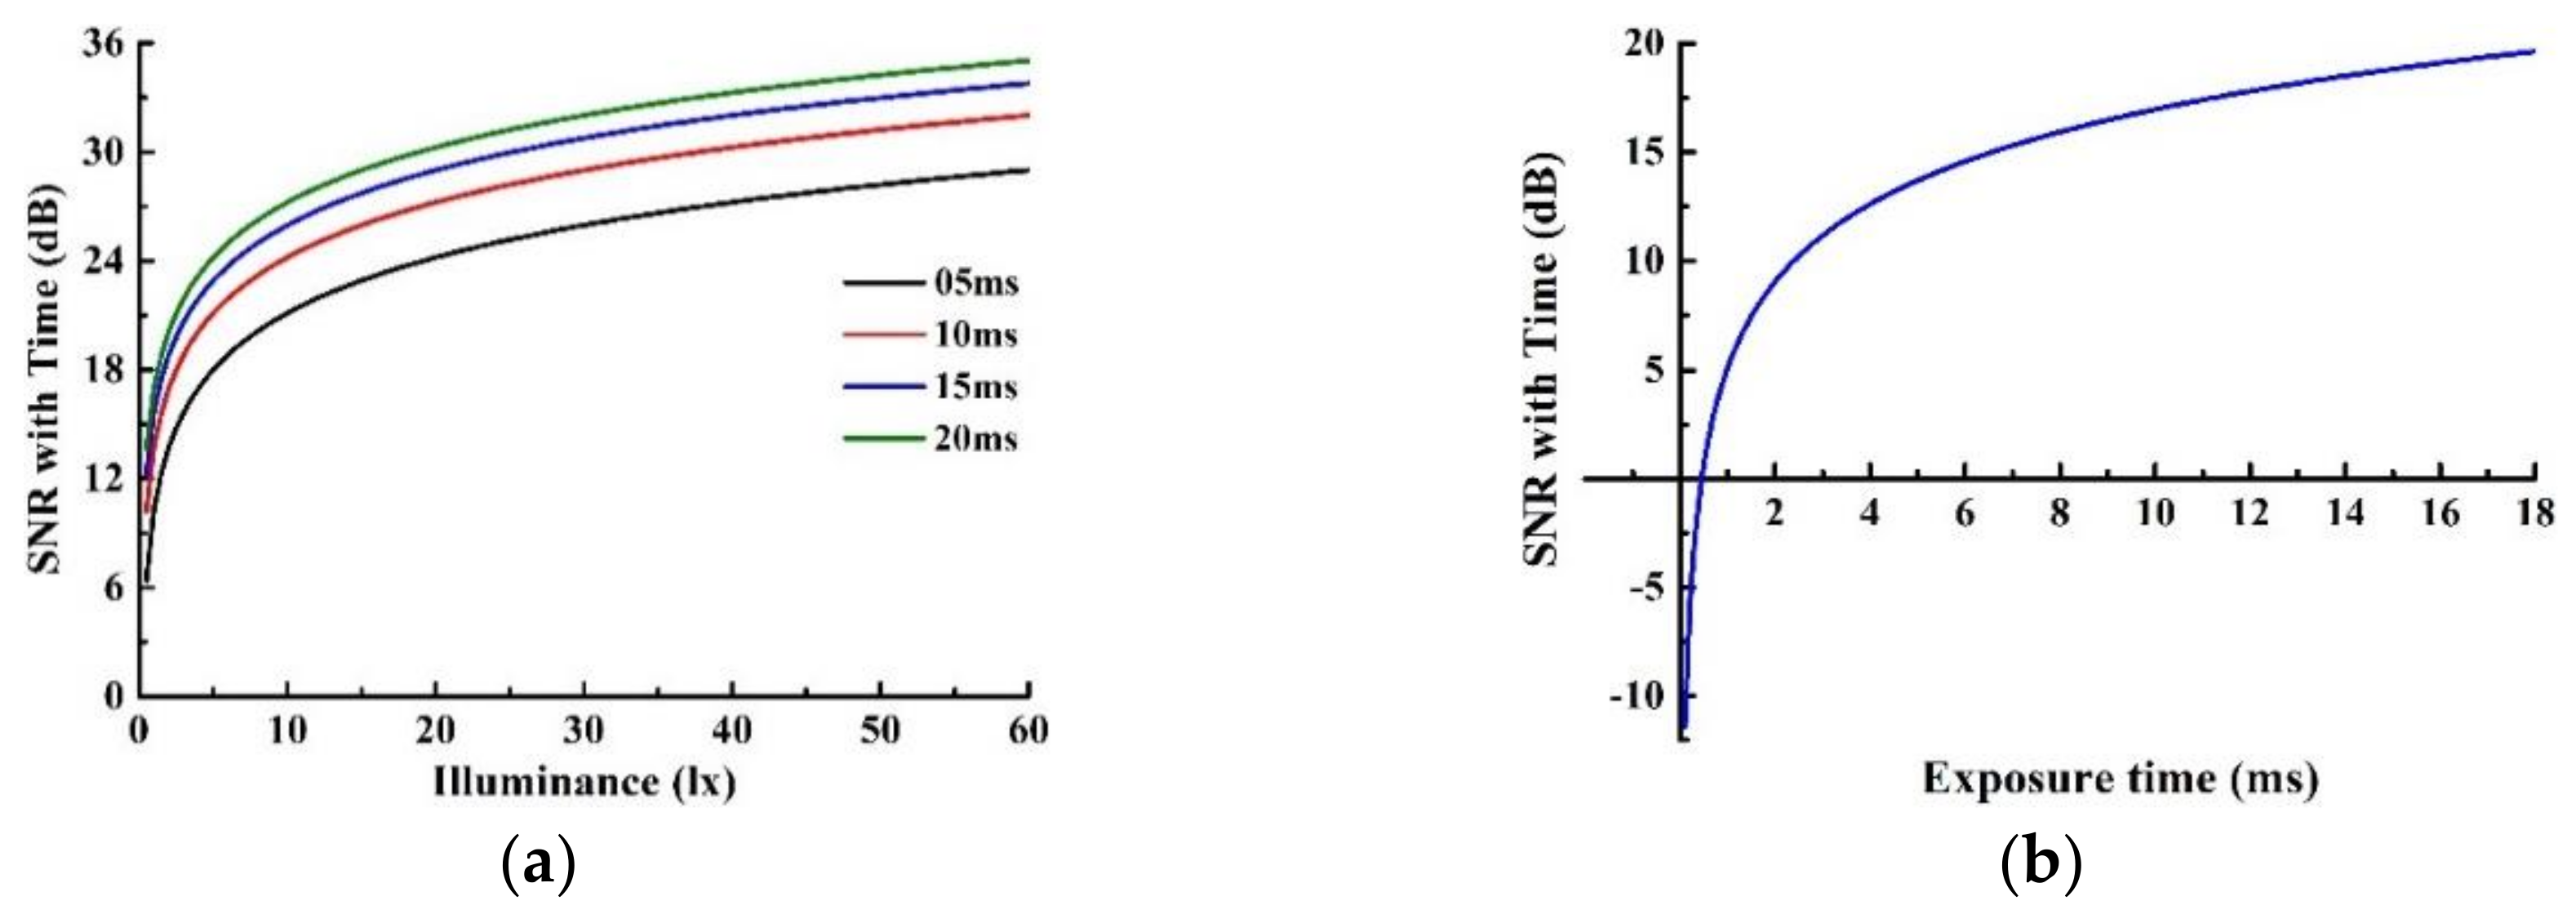
According to the above parameter settings, the theoretical SNR curve of the night-light camera is shown in
Figure 8.
Figure 8a shows the SNR curves that vary with illuminance under different exposure times. As the exposure time increase from 5 ms to 20 ms, the SNR improved as a whole, but the increase is getting slower.
Figure 8b shows the change of SNR curve with exposure time under certain illuminance, where the illuminance is fixed to be 2 lx. With the decrease of exposure time, the negative SNR appeared, i.e., the signal electrons number is less than noise electrons number, which means the image cannot be used.
5.2. On-Orbit Test of SNR
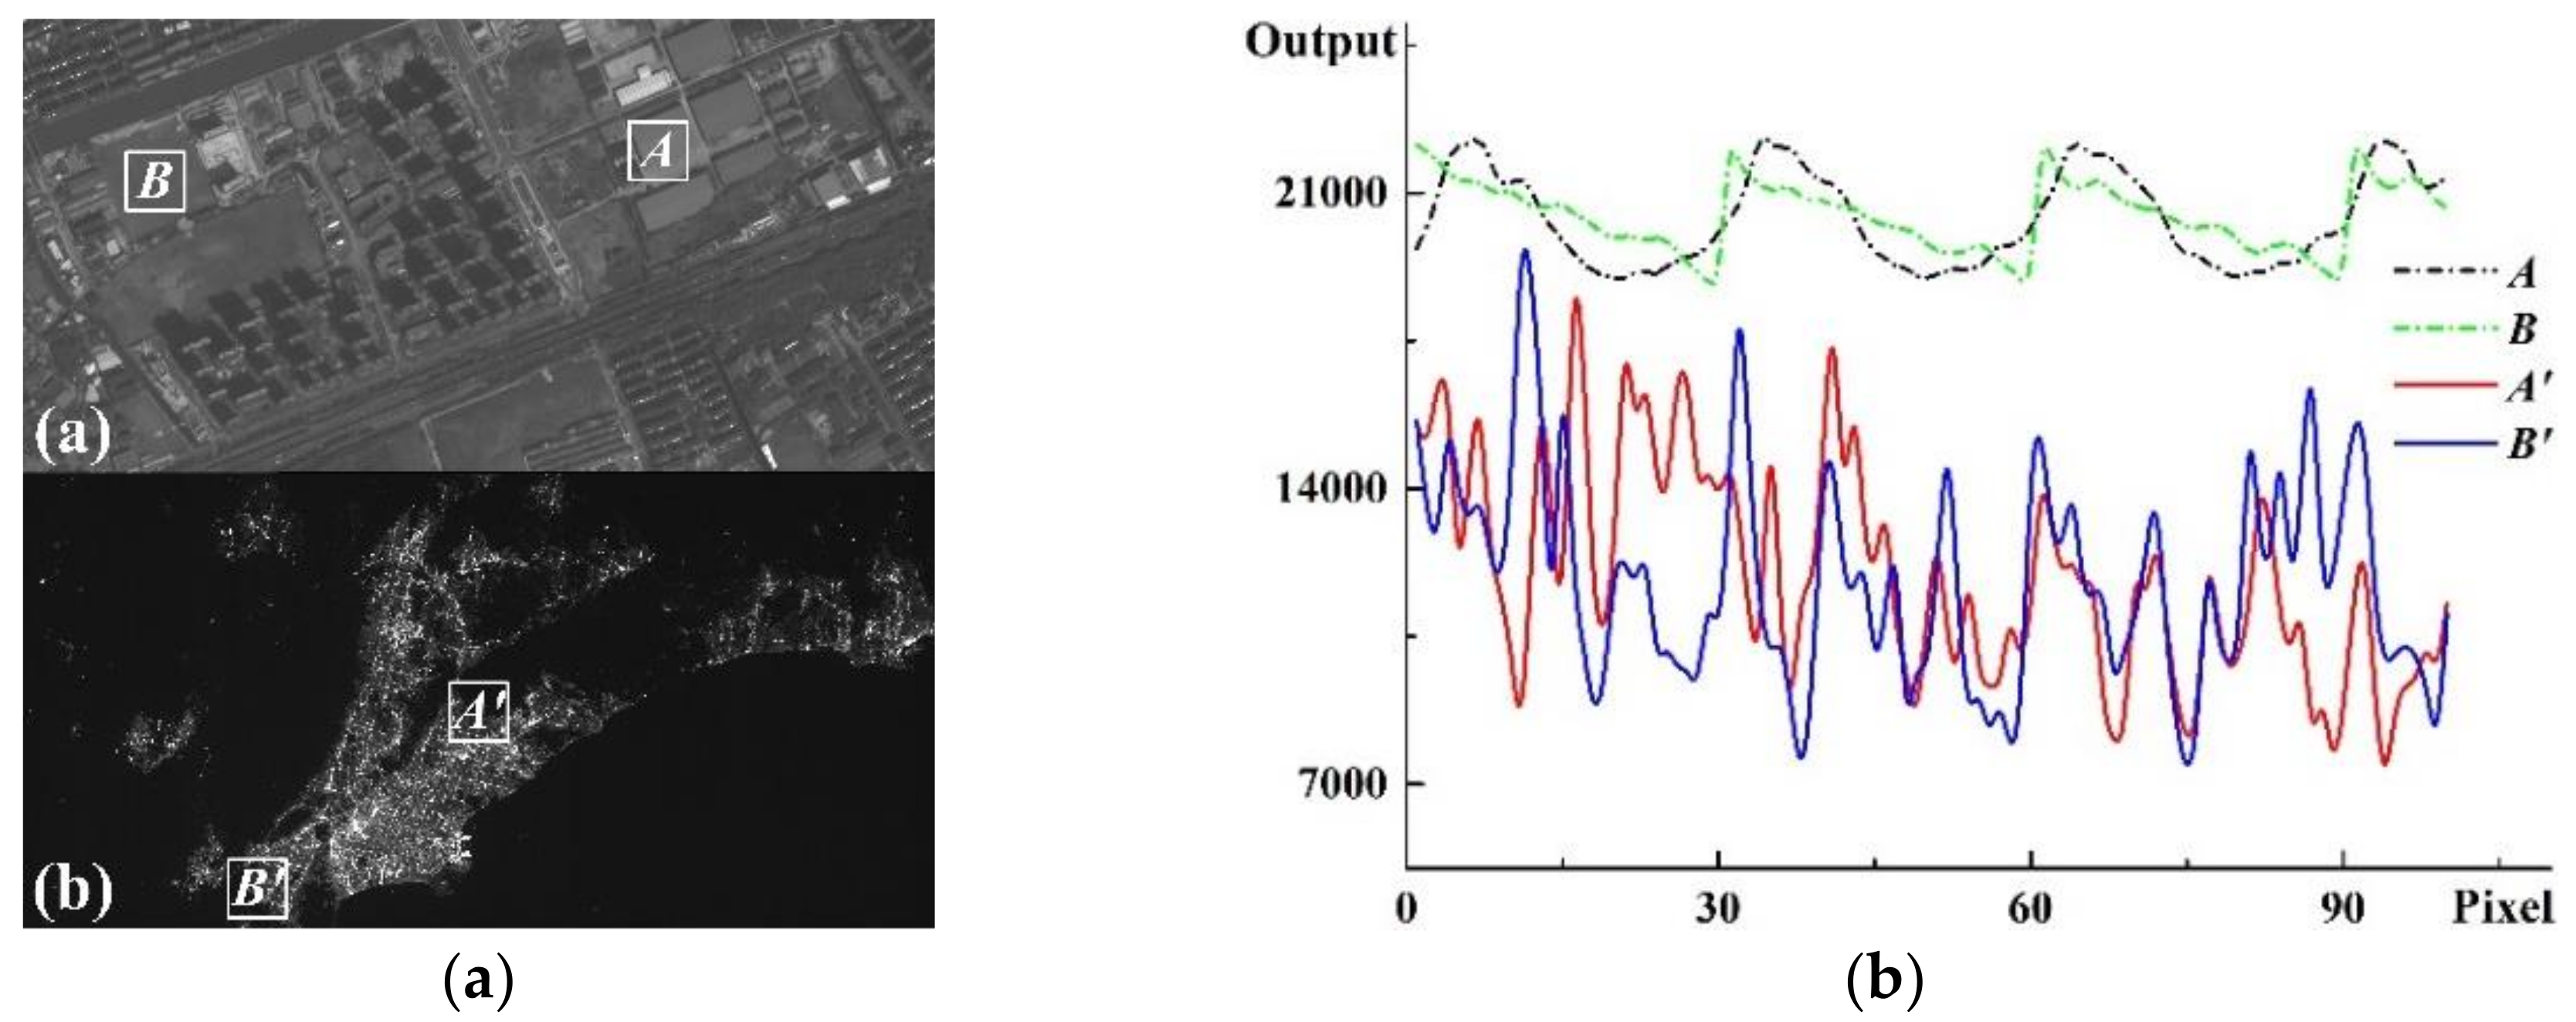
With the purpose of calculating the actual on-orbit SNR of night-light camera, we collected a series of consecutive time-sequence night-light images from Mexico City, New Delhi and Columbia captured by the Luojia 1-01 satellite during consecutive imaging time. After pre-processing such as image registration, we extracted multiple consecutive image points of different ground objects from these three time-sequence-image series, and then analyzed the data statistically according to the proposed method introduced in
Section 2.3.
Table 4 lists the working status and parameters setting of image detector when taking images for these three regions.
Radiometric calibration uses integrating sphere as lighting sources and the light outputted from integrating sphere is collected by camera. Changing the light intensity of integrating sphere and monitoring it with a spectral radiometer, we can obtain the radiometric calibration efficiency by statistical analysis of the images captured during calibration process. According to radiometric calibration results, taking the radiance and output of detector as
x-axis and
y-axis respectively, there is a linear relation between radiance entering camera’s entrance pupil and output of image detector. Under HDR recording mode, as the exposure time changes, the radiometric calibration coefficients under the gains of 1.85x and 3.68x are shown in
Table 5, the dimension of slope is (W/m
2/sr)
−1. Using the data in
Table 5, we can fit the radiometric calibration coefficients under exposure time of 13.7 ms. The linear responses of 1.85x in HDR low-gain mode and high-gain mode are
DN = 11974.35 ×
Le + 211.59 and
DN = 114697.89 ×
Le + 168.77 respectively, while those of 3.68x in HDR low-gain mode and high-gain mode are
DN = 23893.58 ×
Le + 208.14 and
DN = 243341.60 ×
Le + 143.07.
According to the radiometric calibration data, excluding the influence of saturated points and dark fields, we calculated the average value and standard deviation of sampling points extracted from time-sequence images of these three selected regions respectively. The statistical results are shown in
Table 6, which illustrates that within HDR high-gain mode, the output values and the distribution of actual on-orbit SNR of the sampling points have similar characteristics.
The night-light images and the specific on-orbit SNR test results of these three regions when the detector works on HDR high-gain mode are shown in
Figure 9. The left column shown these three regions, and the two-dimensional curves are SNR curves that vary with illuminance, in which the blue curves are actual on-orbit SNR test results obtained by the time-sequence-based method, the red curves are theoretical SNR prediction results. It can be seen from these figures that actual SNR results have the same variation tendency and data distribution characteristics as the theoretical SNR results. Typical, under the illuminance of 10 lx at night, only when the SNR of typical objects at least reaches 20 dB can it satisfy the requirement of engineering applications. The curves in indicate that the theoretical SNR is about 25.6 dB under 10 lx illuminance, while the on-orbit SNR are about respectively 36.1 dB, 34.4 dB, and 29.0 dB, higher than application requirement and theoretical value.
It is shown in
Figure 9 that when the illuminance is lower than a certain threshold (this threshold varies in different scenes, that is about 10 lx in Columbia and about 5 lx in Mexico City and New Delhi), SNR increases rapidly with the increase of illuminance. However, the theoretical prediction SNR are slightly higher than the actual measured SNR. One of the reasons for these differences is that although the Luojia 1-01 satellite has been equipped with the wide dynamic range and high sensitivity detector, the imaging capability is still limited by the performance of detector under ultra-low illuminance.
When the illuminance exceeds this threshold, the growth of SNR slows down and tends to converge gradually with the continuous increase of illuminance. Except the curves of Columbia, the curves of New Delhi and Mexico City shown that the actual on-orbit SNR are much higher than the theoretical SNR. To explain these differences, we analyzed the sensitivity of the SNR model from the aspects of ground objects characteristics, atmospheric characteristics, and detector parameters.
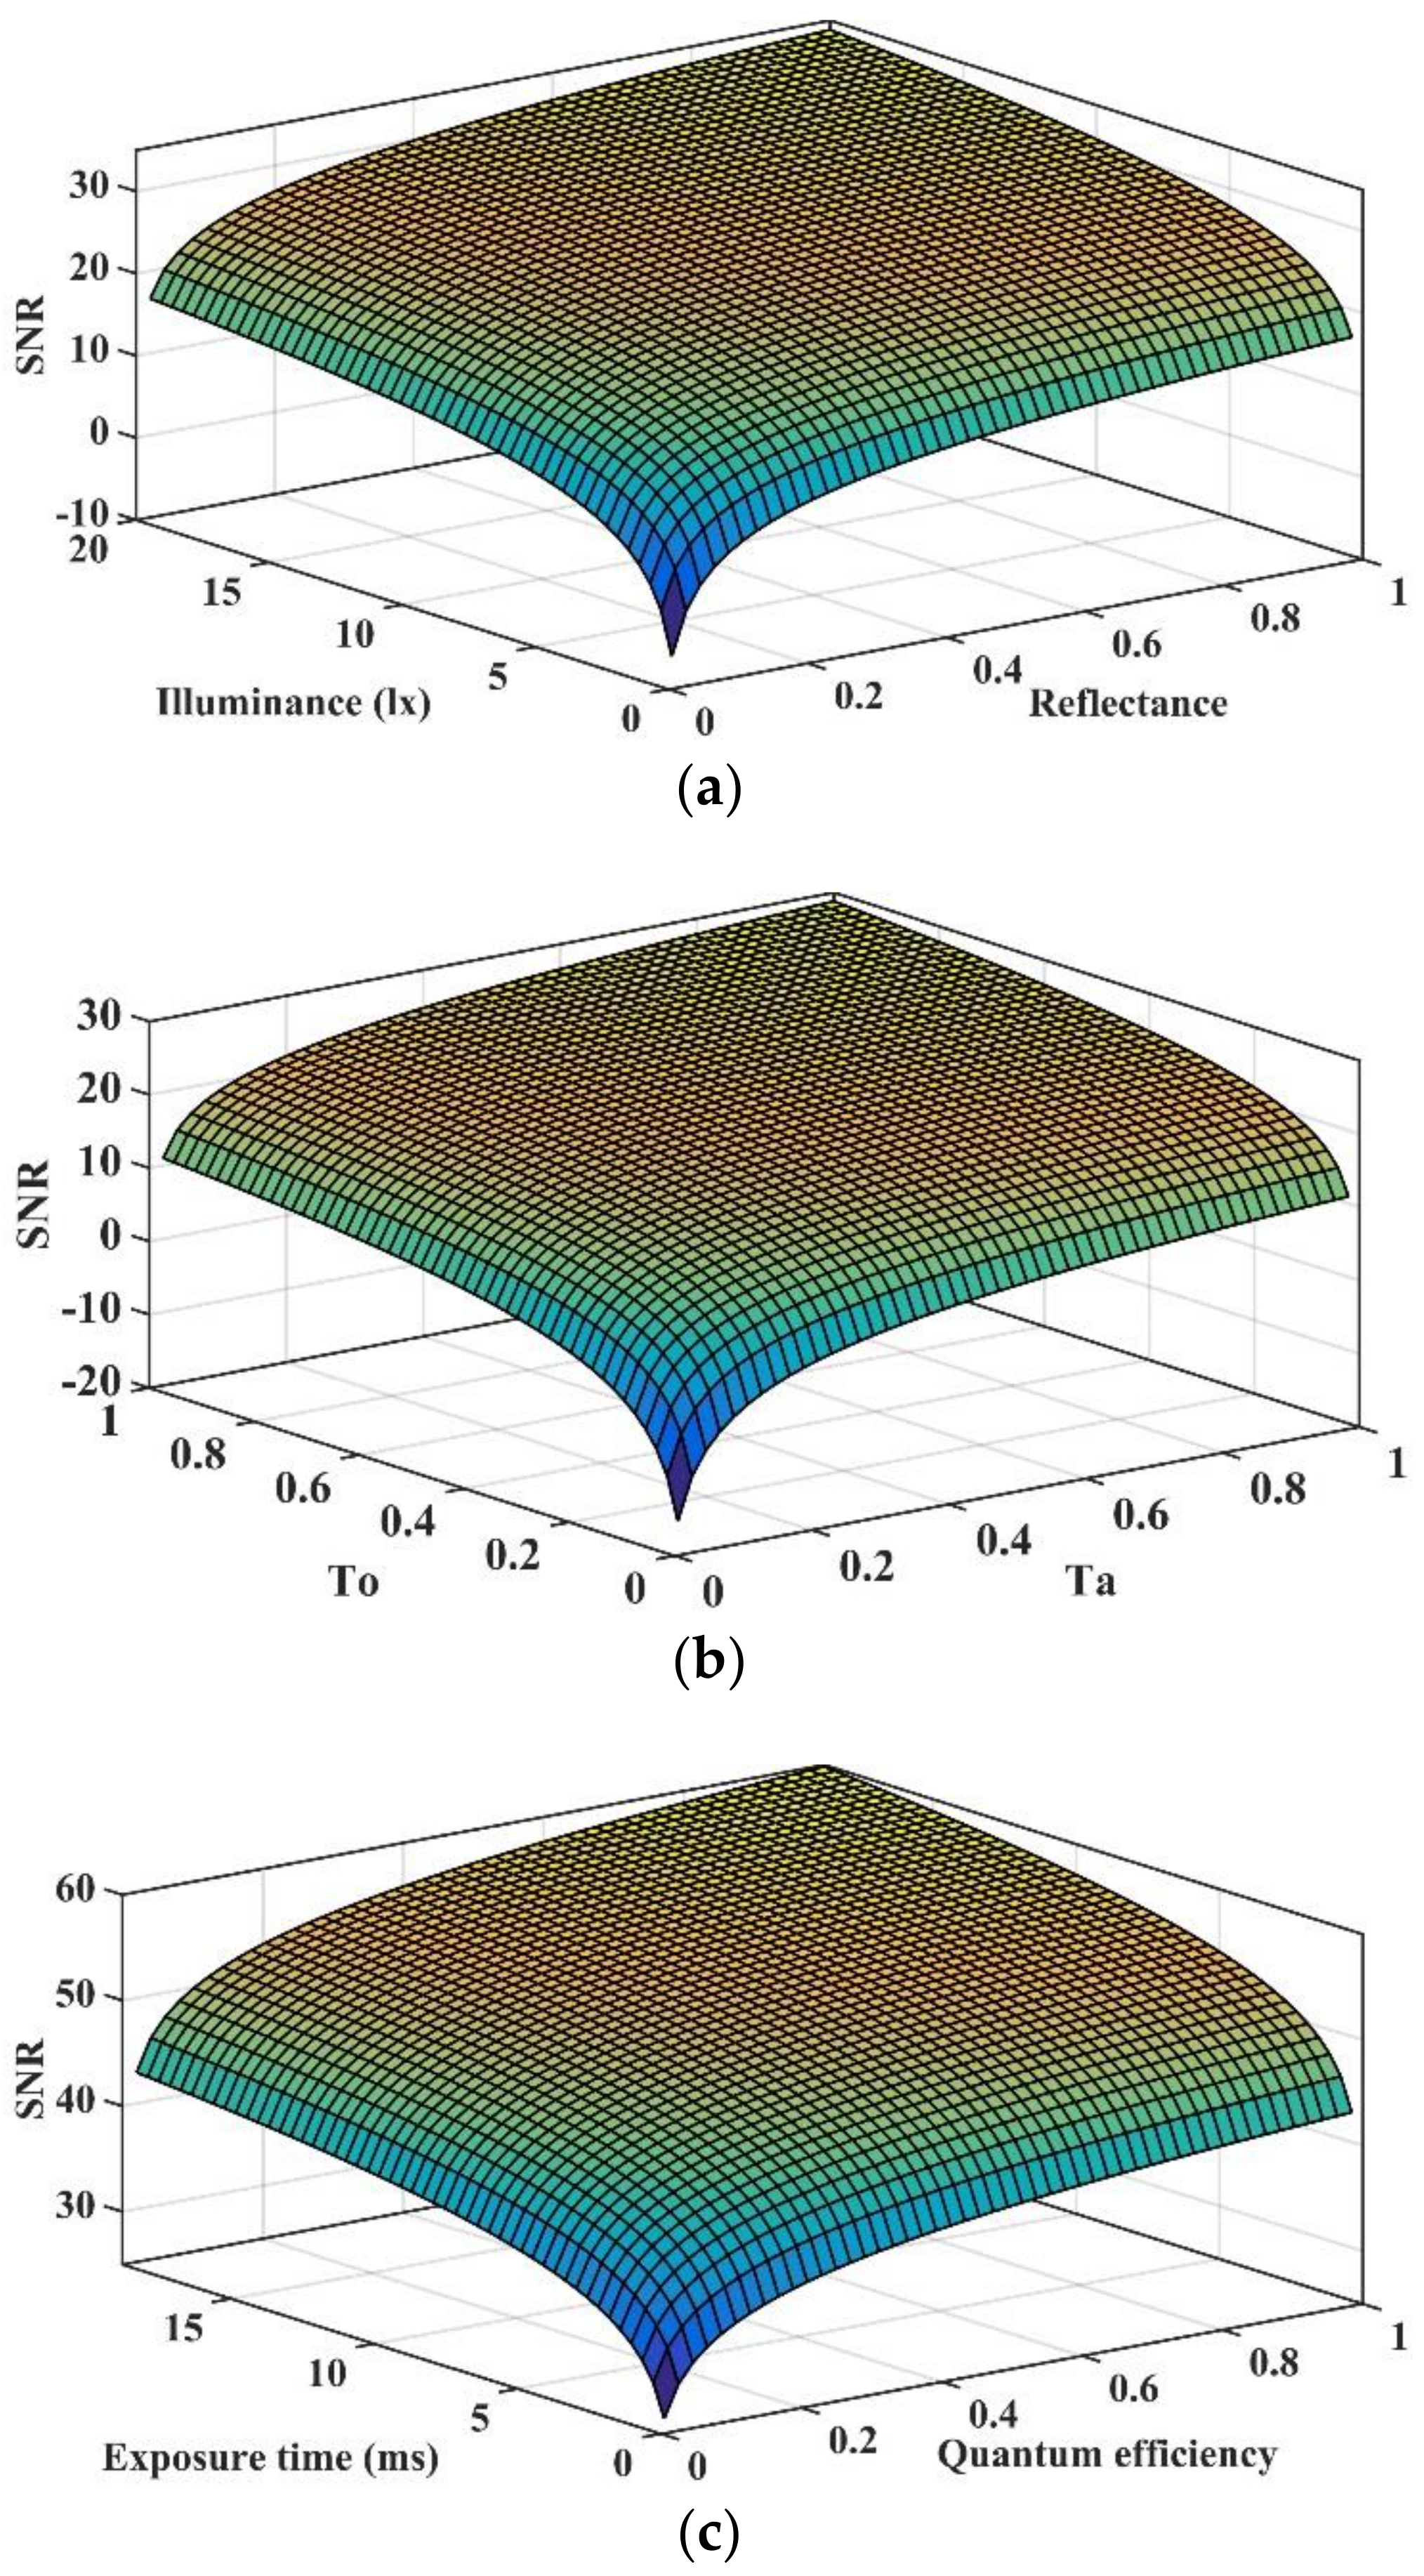
Figure 10 illustrates the influences of different factors on SNR.
We can see from
Figure 10 that the change of any parameter will greatly influence the values of SNR while the other parameters remain unchanged, however the SNR will converge eventually. The SNR is very sensitive to the atmospheric transmittance. Under bad weather conditions, the SNR will become negative as shown in
Figure 10b. In addition, almost all the factors that affect SNR are related to spectral characteristics. Appropriate extension of exposure time is almost the only way to improve on-orbit SNR after the satellite is launched. Now, we can explain the differences between on-orbit SNR and theoretical SNR in
Figure 9, which mainly focus on the following aspects:
• Atmospheric factors
In order to obtain clear images, the Luojia 1-01 satellite generally works in good weather, when the atmospheric transmittance is relatively high. The images of selected regions are captured in different time, and the atmospheric condition at that time are different. Thus, there will be difference between average atmospheric transmittance and actual atmospheric transmittance.
• Spectral factors
The atmospheric transmittance, optical transmittance, quantum efficiency, spectrum power function, and the energy of photons are functions of wavelength, related to the spectral characteristics of light sources, thus these corresponding parameters are also different. The theoretical SNR model in this paper considers the central wavelength only, which will lead to errors beyond doubt.
• Target factors
Due to the complex reflection characteristics of ground objects, it is difficult to study them in detail. The typical reflectance of ground objects under night-light is about 0.3. The theoretical SNR model takes this value as standard reflectance to reduce calculation difficulty, which will result in difference between measured data and theoretical data.
The time-sequence-based method makes up for the limitation that the spatial-sequence-based method cannot be utilized for low-resolution cameras, but they have the common calculation steps, thus the former can be regard as a supplement or extension of the latter to some extent. It should be pointed out that in these three cases, the selected regions are large cities, the scattering properties of ground objects are the same or similar in all directions. In other words, our method is limited by the bidirectional distribution characteristics and only suitable for isotropic objects. From the perspective of automation, these two kinds of methods require us to select sampling regions manually, meanwhile the accuracy will be affected by the error caused by human operation. Judging from the calculation speed, the new method is more time-consuming than variance method. However, due to the lack of radiometric calibration data and original images of other night-light remote sensing satellites, the study on the robustness of this proposed time-sequence-based method is insufficient, we would like to use more satellite data to test this method in the future if possible.


