Collaborative Resource Management for Negotiable Multi-Operator Small Cell Networks


1
School of Information, Computer, and Communication Technology, Sirindhorn International Institute of Technology (SIIT), Thammasat University (TU), Pathum Thani 12121, Thailand
2
School of Information Science, Japan Advanced Institute of Science and Technology (JAIST), Ishikawa 923-1292, Japan
*
Author to whom correspondence should be addressed.
Sensors 2019, 19(16), 3550; https://doi.org/10.3390/s19163550
Submission received: 10 June 2019
/
Revised: 9 August 2019
/
Accepted: 13 August 2019
/
Published: 14 August 2019
(This article belongs to the Section Sensor Networks)
Abstract
:The ubiquitous coverage/connectivity requirement of wireless cellular networks has shifted mobile network operators’ (MNOs) interest toward dense deployment of small cells with coverage areas that are much smaller as compared to macrocell base stations (MBSs). Multi-operator small cells could provide virtualization of network resources (infrastructure and spectrum) and enable its efficient utilization, i.e., uninterrupted coverage and connectivity to subscribers, and an opportunity to avoid under-utilization of the network resources. However, a MNO with exclusive ownership to network resources would have little incentive to utilize its precious resources to serve users of other MNOs, since MNOs differentiate among others based on their ownership of the licensed spectrum. Thus, considering network resources scarcity and under-utilization, this paper proposes a mechanism for multi-operator small cells collaboration through negotiation that establishes a mutual agreement acceptable to all involved parties, i.e., a win–win situation for the collaborating MNOs. It enables subscribers of a MNO to utilize other MNOs’ network resources, and allows MNOs to offer small cells “as a service” to users with ubiquitous access to wireless coverage/connectivity, maximize the use of an existing network resources by serving additional users from a market share, and enhance per-user data rate. We validated and evaluated the proposed mechanism through simulations considering various performance metrics.
1. Introduction
The evolution in wireless cellular networks is expected to provide ubiquitous network access to users anytime and anywhere [1,2]. With the exponential growth of mobile users, the demands to provide seamless connectivity with a desired level of services to subscribers become a critical challenge for MNOs. The current small cell networks (SCNs) deployment scenarios (for both indoor and outdoor locations) usually support users of only one MNO [3], which means that, with multiple MNOs in one location, users are isolated to the separate cells of their respective MNO. To consider provision of its network resources to competitors’ users, a MNO must also consider technical aspects as well as regulatory aspects. For instance, a MNO with exclusive rights to the spectrum would have little incentive to share their precious spectrum with other MNOs as, despite significant research and regulatory efforts [4,5,6], the mobile market is mainly characterized by high upfront cost of acquiring spectrum licenses [7].
Generally, subscribers have contracts with MNOs, where they often choose the services. Service level agreement is the contract that is agreed upon in written form that generally remains static during a certain period of time. However, a MNO might not always have enough resources and/or coverage (radio networks availability), while some other MNOs might undergo under-utilization of their network resources that would often result in decreased revenue. Small cells’ users with multi-operator support could access wireless connectivity anywhere, regardless of their MNO’s network, and this in turn would enable a bring-your-own-device (BYOD) environment with uninterrupted services [3,8]. Considering network resources scarcity and under-utilization, collaborative resource management could be beneficial for MNOs by providing network access to users regardless of their coverage through BYOD environment and generating revenue from an increased market share.
In this paper, we propose a mechanism for multi-operator small cells collaboration to sustain SCN access to users in a dynamic environment, considering active users’ density and network resources availability. This would maintain desired level of services to users and avoid under-utilization of network resources. However, mutual agreement needs to be reached before any form of collaboration between self-interested MNOs (competitors) could take place. For this purpose, we consider negotiation, among potential collaborating MNOs, in order to reach to an agreement that is acceptable by all involved parties. The paper is an extension of our work in [9] with detailed and extended analysis of the multi-operator small cells collaboration mechanism, and extensive performance evaluations. The main contributions of this paper are as follows:
- The proposed mechanism of multi-operator small cells collaboration can be applicable to SCNs as well as other radio network technologies, which could offer advantages to MNOs such as: maintaining services to users even in an overloaded environment, sustaining users’ loyalty, avoiding under-utilization of available network resources, improving revenues by serving extra users from a market share, and serving users at locations not under network coverage through BYOD environment.
- Multi-operator small cells collaboration allows MNOs to offer small cells “as a service” to users, with access to wireless coverage/connectivity anywhere regardless of their operator’s network. MNOs determine their policy profile as seekers or feeders depending on the network resources availability and their utilization. Once the policy profile of the MNO is determined, negotiation trades can be established among MNOs, a seeker and a feeder, such that both the collaborating MNOs benefit upon agreement of an offer, i.e., a win–win situation for both participants.
- The introduced mechanism of collaboration formation, by first determining policy profile and then involving in negotiation, could also be applicable to other general fields such that rational agents would be motivated to allocate their exclusively owned resources to others.
The rest of this paper is organized as follows. Some of the related works are briefly discussed in Section 2. The mechanism for collaboration formation among multiple MNOs is introduced and discussed in Section 3. Section 4 presents the simulation results for different scenarios to demonstrate the performance gains of collaborating MNOs. Finally, Section 5 summarizes this paper.
2. Related Works
In the near future, the number of wireless devices accessing wireless cellular networks is expected to outnumber the human population [10]. As such, management and proper utilization of the licensed spectrum by MNOs to provide desired level of services to their subscribers will be a crucial issue [11]. In [3,12], the studies suggest that network sharing should not be taken as a threat to hinder competition among MNOs, but rather as a key approach to enhance affordable advanced services with proper regulatory framework. Initially, network sharing was exclusively viewed as an alternative to capital expenditure reduction. However, it has many other potential strategic benefits by appropriately understanding and regulating various market players [6]. Network sharing could accelerate network roll-outs for MNOs and offer enhanced services to subscribers with reduced costs. For example, in urban areas, MNOs could avoid regulatory processes for site acquisition where dense deployment restricts available space, while in rural areas, MNOs could reduce the network investment payback period.
Two network sharing standards are identified by third generation partnership project (3GPP): multi-operator core network (MOCN) and gateway core network (GWCN). In MOCN, only the radio access network (RAN) is shared where the shared RAN is directly connected to each of the MNOs’ core networks, while, in GWCN, elements of the core network are shared as well to form a shared core network so that the interconnection of the MNOs’ core networks is done at the core network level [4,5,8]. Although there are several approaches to network sharing available for MNOs, they can be simplified to passive and active sharing [13]. Passive sharing involves MNOs sharing base station (BS) sites, building premises, and masts, whereas active sharing provides virtualization of the shared physical resources: infrastructure and spectrum.
Multi-operator infrastructure sharing [13,14,15,16,17] allows the subscribers of a MNO to utilize the BS infrastructure of other MNOs, and thus the MNO makes use of another network at a place where it has no coverage or infrastructure of its own. It assumes subscribers of a MNO to freely switch between the network of multiple MNOs, and the results are shown to significantly reduce the number of BSs required to provide mobile service, and improve aggregate data rate and coverage [13,14,15]. In addition, infrastructure sharing could provide MNOs with additional benefits, such as operational cost reduction and energy saving, by considering switching-off of multiple co-located BSs [16,17]. However, an efficient and feasible mechanism needs to be designed such that, in the presence of BS infrastructure from a MNO, an entrant MNO could request on-demand utilization of the network. This could facilitate MNOs to share their infrastructures in order to maximize the use of their existing network resources while simultaneously minimizing the cost and resources requirement.
Multi-operator spectrum sharing, which refers to MNOs’ ability to share and access exclusively owned licensed spectrums of other MNOs, has been gaining significant research interests [13,15,17,18,19,20]. It provides an opportunity to maximize utilization of licensed (dedicated) spectrum that could remain under-utilized at certain time intervals. The usage of the shared spectrum among MNOs can be divided into two categories [19]: orthogonal and non-orthogonal. In orthogonal spectrum sharing, MNOs utilize a dedicated portion of spectrum from the common spectrum pool, whereas, in non-orthogonal spectrum sharing, more than one MNO simultaneously and opportunistically utilize spectrum from the common spectrum pool at any particular time. However, these studies exclusively assume prior mutual agreement among MNOs for spectrum sharing and focus only on issues such as performance comparisons [13,15,19] and radio resource allocation strategies [17,18,20].
In recent years, the principles of network sharing have evolved to a more flexible on-demand multi-tenant network [12,21,22,23,24,25,26,27,28,29], which enables MNOs to request and lease network resources from other providers dynamically via signaling. The works in [12,21,22,23,24] provide conceptual approaches that focus on design and development of general architectures for 5G platform based on concept of small cells to enable multi-tenancy coupled with an edge-based virtualized execution environment. The 3GPP-based RAN sharing concept, MOCN [4,5], can be considered as an exclusive enabler for such multi-tenancy features. The work in [25] introduces conceptual analysis and design of a signaling-based, i.e., with no human intervention, on-demand multi-tenant network architecture building on the top of the 3GPP network sharing management architecture. In their multi-tenant network architecture, a logically centralized monitoring and control entity, termed as 5G network slice broker, provides admission control for incoming requests and resource assignment by means of an enhancement of the 3GPP network sharing management architecture interfaces and service capability exposure function [30]. Conceptual architecture for multi-tenant network resource sharing and ways to coordinate the usage of resources by several entities are further discussed in [26], whereas Gang and Friderikos [27] proposed interference-based resource allocation scheme to increase utilization of the network resources among tenants. The work in [28] presents big-data-based prediction strategies for admission policy to increase profit from the network resources utilization for MNOs in a multi-tenant networks. Sciancalepore et al. [29] applied concept of stochastic geometry theory to design admission policy, i.e., radio resource allocation strategy, to the users of the tenant MNOs such that an overall throughput of the multi-tenant networks is maximized. Although the research works on multi-tenant network introduces new business models in wireless cellular networks such as allowing MNOs, with an abundance of network resources, to lease their infrastructure and/or spectrum to tenant MNOs and generate revenues from the increased market share. It is crucial to study the feasibility of multi-tenant network to leverage new business opportunities, which depend on formulating prior mutual agreements among MNOs over the usage policy of the network resources.
In general, network sharing has evolved to mobile network multi-tenancy as a novel concept that concentrates on capacity enhancement, increasing return of investment, and coverage expansion. However, MNOs’ decision on whether to enable multi-operator support relies on whether it is beneficial for their business perspective and on the risk of reducing their competitive advantage. Coverage is considered as one of the significant service attributes to subscribers and an important dimension for a MNOs to compete. Other attributes such as brand name and service innovations become an irrelevant differentiator if the MNO cannot provide coverage in the areas of subscribers’ interest. Traditionally, with macrocell coverage, infrastructures were precious and sharing the physical location with competitors could result in losing differentiation for a MNO. However, for SCNs, differentiation on such basis is less important since the deployment costs of small cells are largely reduced [31]. However, a MNO can remain a major player based on its ownership of the licensed spectrum. Thus, it is essential to formulate a mechanism where MNOs could interact and establish service level agreement over network resources usage. This paper introduces a novel mechanism of multi-operator small cells collaboration to offer an on-demand multi-operator small cells support, where a MNO negotiates with other MNO(s) over the usage of network resources and formulates mutual agreement that would provide both involved parties with some collaborative gains.
3. Multi-Operator SCNs: Collaboration Management Module
We consider a general network architecture of multi-operator SCNs with radio and core network elements [21,22,23] to enable multi-tenancy. The core network of a MNO is interconnected with other MNOs at core network level while the radio elements of a MNO are interconnected at a centralized location via cloud-radio access network (C-RAN). Here, the C-RAN is a logically centralized monitoring and control entity that provides a centralized network view of the underlying radio networks of a MNO. The infrastructure deployed by a MNO consists of a number of mobile stations (MSs), small-cell base stations (SBSs), C-RANs, and corresponding core networks elements.
To develop network-wide coordination and extension of services to users of multiple MNOs, the multi-operator SCNs achieve interconnection among multiple MNOs’ networks and centralized control for network-wide resource coordination via C-RANs. In C-RAN, we introduce a logical module, termed as collaboration management module (CMM), responsible for evaluating network resources and executing negotiation for collaborative formation among MNOs over on-demand network resource requests. In reference to such architecture, the CMM acts as a mediator for collaboration formation among MNOs to facilitate on-demand network resource requests and resource assignments such that the SCNs evolve to be able to provide multi-operator support to small cells’ users.
The CMM located at C-RANs in the radio network of MNOs is responsible for addressing on-demand network resource requests and assignments by establishing collaboration among multiple MNOs. In general, CMM performs two main functionalities: (i) determine a policy profile of a MNO that depends on its network resources availability and utilization; and (ii) be involved in negotiation and establish mutual agreement with other MNO(s) to utilize/provide network resources from/to others.
The provision of collaboration would ensure a MNO maintains the desired level of service to their users during changes in network resource availability, e.g., in an overloaded environment when the user’s service level may not be met, or when the MNO’s services are not available at a particular location. The multi-operator collaboration is also envisioned to create a BYOD environment that can enable services to users regardless of their parent MNO’s service/coverage and maintain ubiquitous mobile service coverage.
Considering the network resources available and their utilization, a MNO is determined to be either a seeker (a recipient of service access for some of its users from network resources of other MNOs), to improve services to its users, or a feeder (a provider of service access to some users of the seeker MNO), to improve revenue by avoiding under-utilization of its network resources. Here, we assume that revenue incurred by a small cell is calculated according to a fixed data service pricing model [32] defined in terms of average data rate perceived by each user. Specifically, the total revenue, , of MNO i is given by,
where
- is the number of users getting served by MNO i;
- is the price per-user per-unit (bps) of data rate service; and
- is the average per-user data rate offered by MNO i for serving users.
3.1. MNO’s Policy Profile
We assume that the quality of service that each MNO must strictly provide is the minimum average per-user data rate. To meet this minimum data rate, a MNO may need to use the bandwidth of other MNOs to increase the average per-user data rate above this threshold. The MNO who seeks more bandwidth is called a seeker, while those providing additional bandwidth to the seeker are called feeders.
Specifically, suppose MNO S serves users but the current average per-user data rate, , is less than the required minimum rate, . Hence, MNO S is a seeker since , “condition to be a seeker”. It will need to find MNOs that can be feeders to serve some number of its current users and improve its average per-user data rate, such that it can now meet the minimum rate, i.e., .
Suppose for simplicity only one MNO F is a feeder. Let be the maximum price per-user per-bps that S is willing to pay to the feeder. This price is called the seeker’s reservation price. The average per-user data rate that the feeder F can serve with additional users from S is denoted as . Hence, S is willing to pay F at most for the service to users.
Note that after transferring users to be served by the feeder, the seeker can now serve the remaining users comfortably. That is, must be such that
Here, by having the feeder serve users of the seeker, the seeker tries to meet its minimum rate requirement as well as improve (or not decrease) its revenue. That is, the new revenue to the seeker, with F serving its additional users, must not be less than the current revenue. Thus,
where the left-hand side is the new revenue of the seeker with F serving its users and the right-hand side is the current revenue where the seeker serves all users. On the left-hand side, the first term is the revenue from serving users by the seeker itself (at rate bps per-user), the second term is the revenue from serving users by the feeder, and the third term is the maximum payment the seeker pays to the feeder calculated with the seeker’s reservation price.
From Equation (3), the upper-bound of the seeker’s reservation price is given as
We take the seeker’s reservation price, , to be the price where it is not improving its revenue, but only meeting the minimum rate requirement. Hence, is equal to the upper-bound given above.
The feeder F currently serves users at price . It can serve all its users at the average per-user data rate higher than the minimum rate requirement, . It can support additional users of S if , “condition to be a feeder”. Hence, if , then it can support an additional users, otherwise at most users.
In the best case, by serving additional users of S, F has lower average per-user data rate at . Hence, it must be compensated by the seeker. The feeder also has its own reservation price, , which is the minimum price that the feeder will accept from the seeker. The feeder has no need to improve its average per-user data rate since it already meets the minimum rate, i.e.,
Its only motivation to collaborate with the seeker is in improving the revenue from utilizing available spectrum. That is, the feeder will agree to serve users of the seeker as long as its new revenue is better than the current revenue, i.e.,
where the right-hand side is the current revenue of the feeder F while serving users at rate . For the new revenue of the feeder F on the left-hand side, the first term is the revenue generated from serving users at the new lower rate and the second term is the minimum acceptable payment from the seeker at the feeder’s reservation price.
From Equation (6), the lower-bound of the feeder’s reservation price is given as
Note that the feeder’s reservation price, , in Equation (7) is always greater than zero, since . Similar to the seeker’s case, we take the feeder’s reservation price to be its lower-bound which is the price where the feeder is indifferent between serving the seeker’s users or not.
The agreement price, , at which both the seeker and the feeder accept payment to have additional users of the seeker to be served by the feeder must be negotiated between them. However, for the negotiation to be successful, the necessary condition is that the seeker’s reservation price must be greater than the feeder’s reservation price and the agreement price is in between. That is,
Here, the price range in Equation (8) signifies the zone where an agreement payment can be met which both negotiators, the seeker and the feeder, can agree to.
3.2. Negotiation for Collaboration
Since for simplicity we are considering only two MNOs, where one is a seeker and the other a feeder, we consider one-to-one negotiation, often termed as bilateral negotiation [33], which involves two participants (a seeker and a feeder) during a negotiation process (negotiation trade). In such negotiation, which is assumed to follow an alternating-offers protocol, the participating MNOs would exchange proposal offers that represents some acceptable payments until either an agreement is reached or the negotiation terminates with a failure.
Now, we develop a model in which the negotiators, a seeker and a feeder, can mutually influence each other in a negotiation trade. Let a negotiation trade round be denoted by , where C is the maximum number of rounds. At round c, negotiators, the seeker and the feeder, in the negotiation trade, alternatively propose and respond to an offer, or , respectively. Following the negotiation strategy in [33,34], the offers at round c from the seeker and the feeder are assumed to follow:
where and are initial offers of the seeker and the feeder, respectively, and the pace of the negotiation trade is specified by the function . Since we are only interested in showing that the resource sharing is useful for both MNOs, we use a simple polynomial pacing function , where determines the negotiation trade pace along time. With , a negotiator takes a Boulware strategy [35], i.e., tends to maintain an offered price until the time is almost exhausted, and then concedes to the reservation price quickly. With , a negotiator takes a Conceder strategy [36], i.e., goes to the reservation price rapidly and early. Despite the value of , with a constant reservation price, the offer from seeker (feeder) monotonically increases (decreases) as the negotiation rounds progresses.
Now, we model the response of the seeker and the feeder to an offer in a negotiation trade such that at round c,
- Response to an offer by the seeker MNO, :
- Response to an offer by the feeder MNO, :
Here, the negotiator’s response to an offer at each round follows an alternating-offers protocol that includes: accept and reject and counter-offer. From Equations (11) and (12), the negotiators propose and respond alternatively, until one accepts an offer or the negotiation trade reaches the maximum limit of C rounds.
4. Simulation Results
We evaluated the performance of collaboration among two MNOs, a seeker and a feeder. The simulations were performed in MATLAB version R2017b (9.3.0.713579). We considered deployment of small cells that belong to two MNOs in a cluster [37]. The small-cell cluster consists of small cells randomly deployed in a circular area of radius m. MSs were randomly distributed within circular coverage of radius m of small cells, i.e., within the coverage range of SBSs. The propagation model considered is 3GPP Model 1 (Table A.2.1.1.2-3) in [38], where the channel gains include path-loss, lognormal shadowing, and multipath Rayleigh fading. For simplicity, in our simulation, we considered channel bandwidth of MHz with corresponding number of subchannels and maximum transmit power of SBSs set to 20 dBm [39]. The numbers of deployed SBSs by seeker and feeder were set to 10 each. To evaluate the performance of the proposed mechanism, we considered the radio resources of the seeker and the feeder to be densely and sparsely populated, respectively. The numbers of MSs belonging to seeker and feeder, , were set to . The average per-user data rate threshold was set to Mbps per-user. Assuming rational behavior of the participants in a negotiation trade, we considered the initial offers from seeker and feeder to be and , respectively. As the negotiation trade between a seeker and a feeder is a time-constrained domain, we limited the maximum number of rounds to with the seeker initiating a proposal offer.
4.1. Effects of Strategy in Proposal Offers
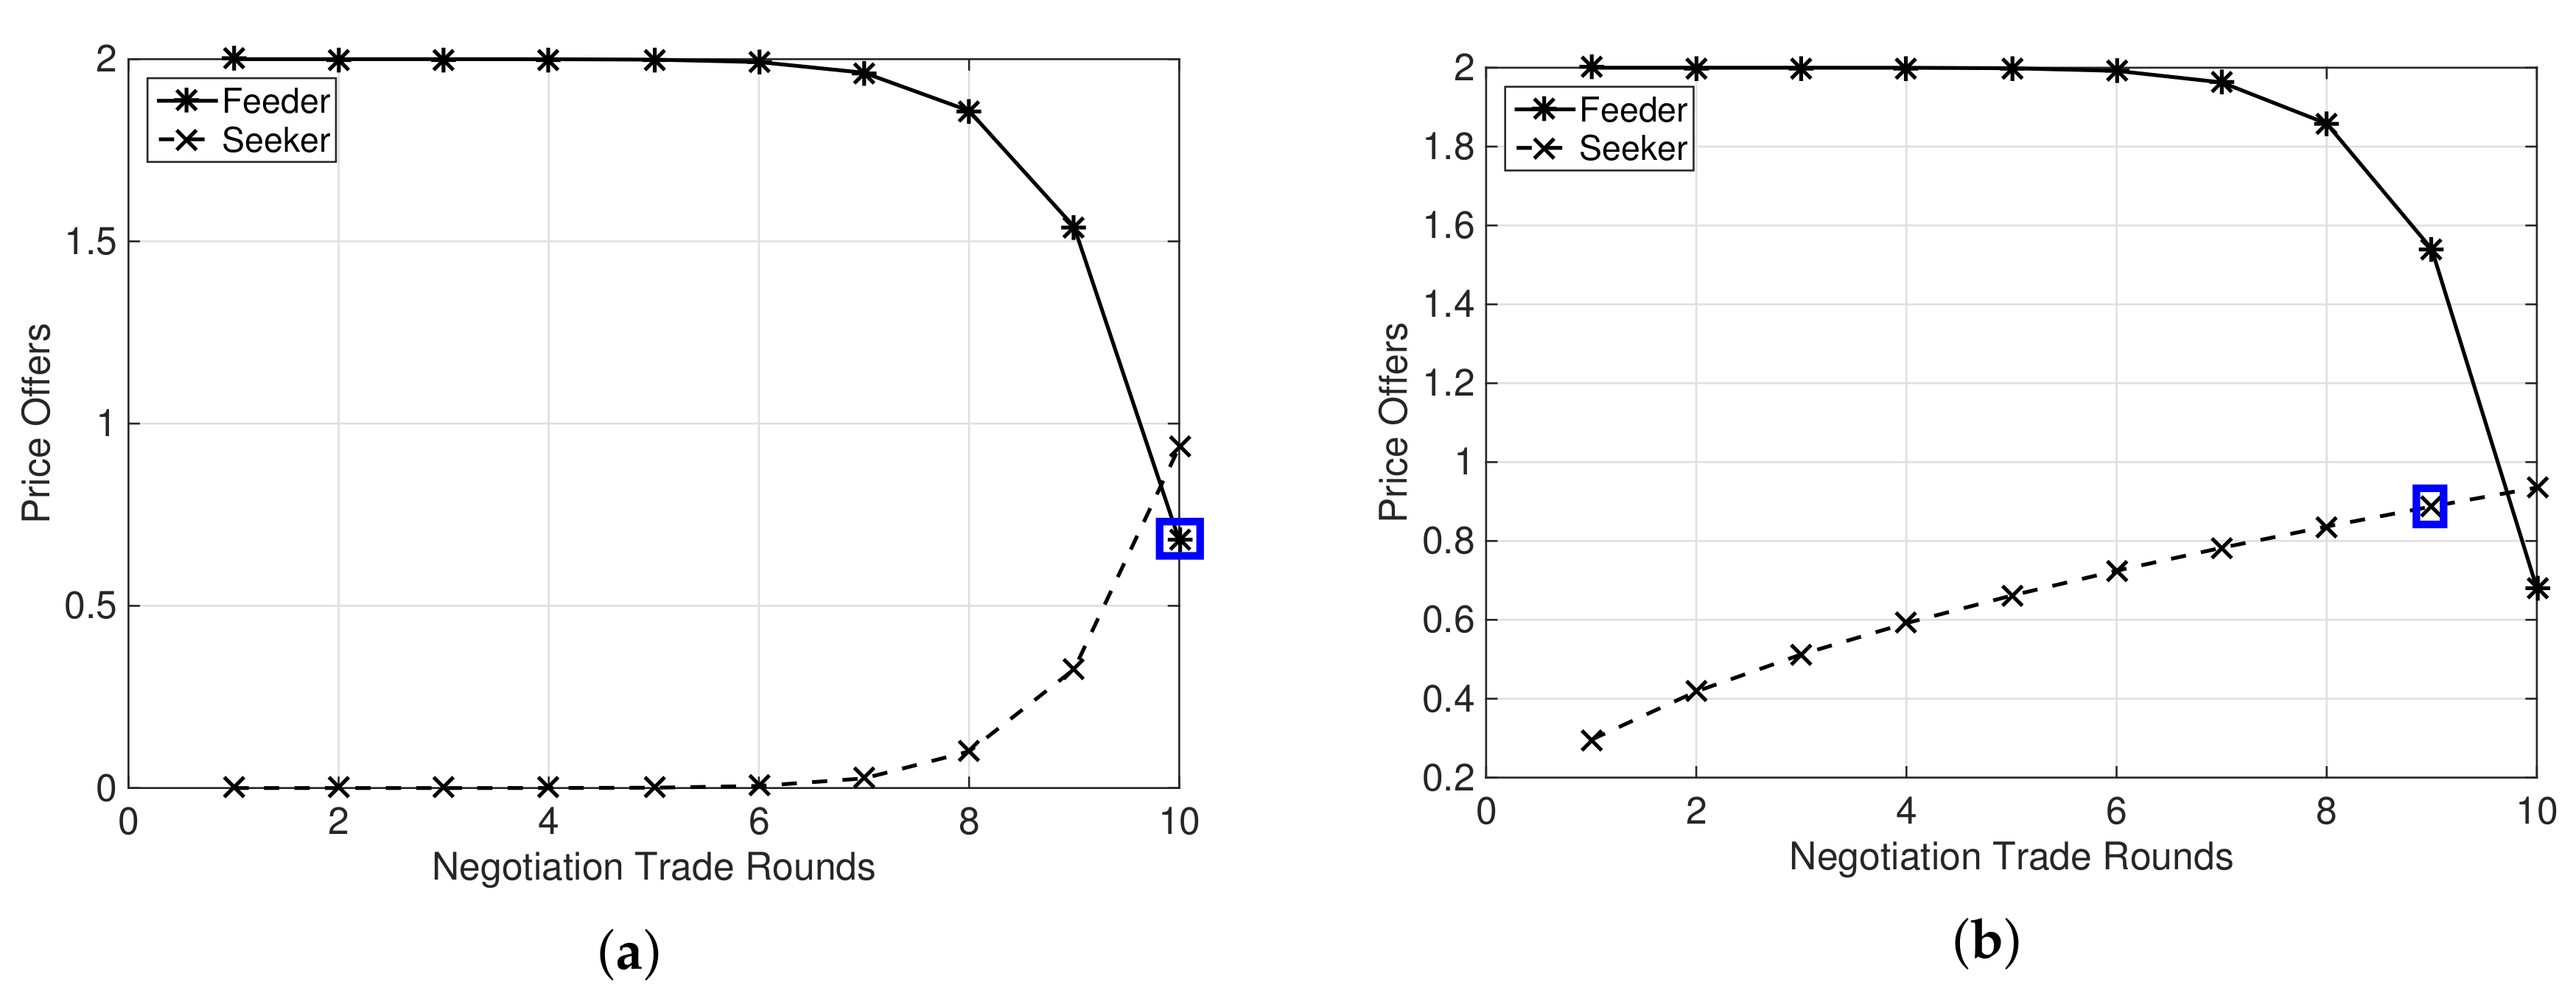
Figure 1a–d shows proposal offers made by feeder and seeker MNOs in the negotiation trade by following either Boulware strategy or Conceder strategy. The numbers of MSs belonging to the feeder and the seeker MNOs were fixed to 10 and 100 respectively. When both participants follow Boulware strategy, and , we can notice that they maintain their offers until the negotiation trade round almost reaches the maximum limit C and then concede to their respective reservation prices when the negotiation trade reaches the limit. If any either of the participants follows a Conceder strategy, as shown in Figure 1b–d, the participant’s offer goes to their respective reservation prices quickly and much earlier in the negotiation trade of C rounds. In addition, the intersection point of the proposal offers happens as the number of feeder MSs, , is comparatively less than the number of MSs that would provide them with improvement in revenue from their available network resources. Figure 1a–d signifies that an agreement payment is achievable in this negotiation trade of C rounds because a proposal offer of either feeder or seeker is favorable to the others following response strategy in Equations (11) and (12), and also noting the fact that the agreement price satisfies the necessary condition in Equation (8), i.e., , for the negotiation to be successful.
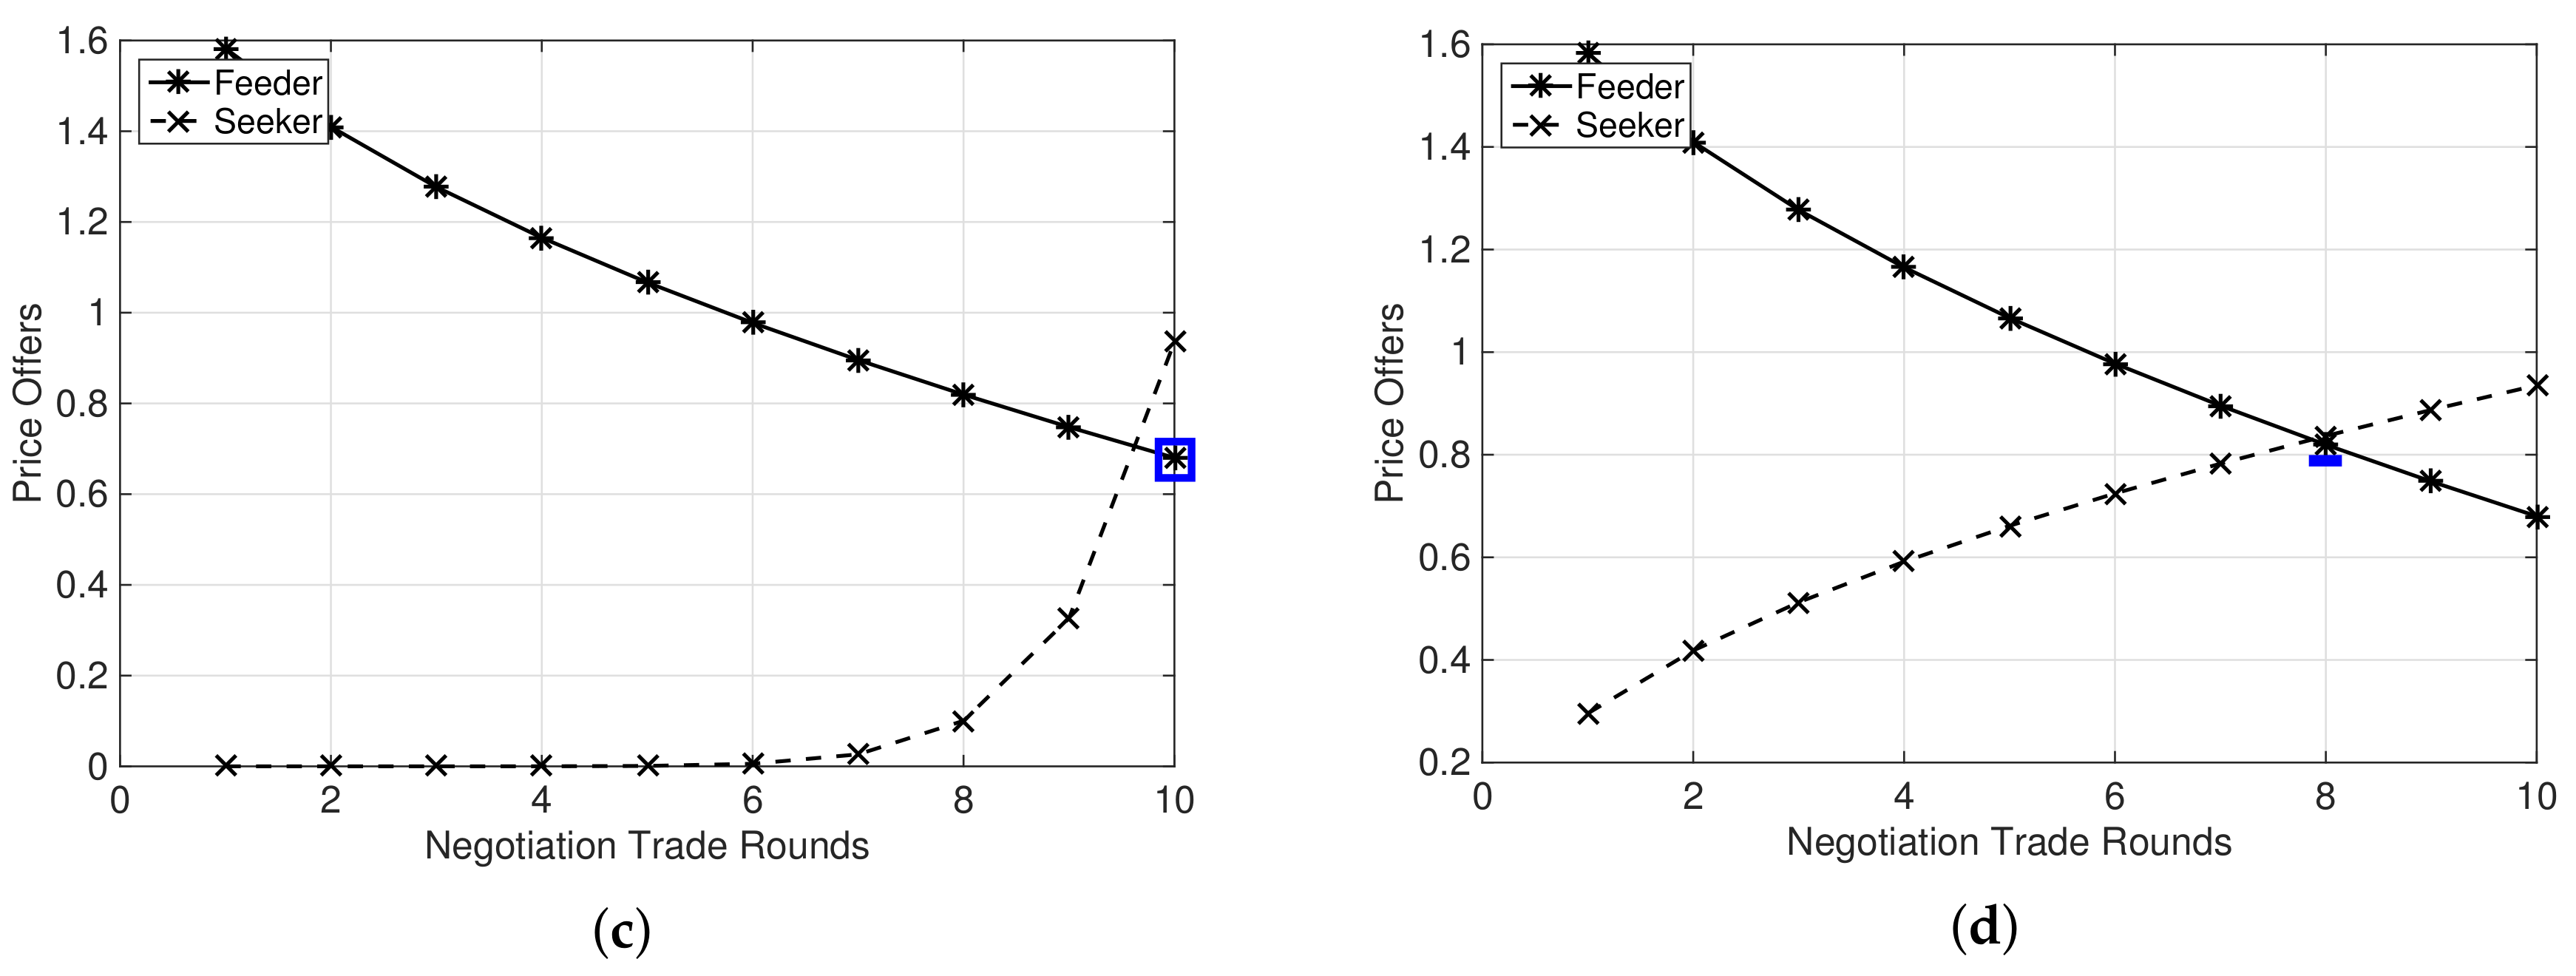
Figure 2a–d shows a case of no agreement in a negotiation trade. Here, we considered that the number of feeder MSs, , is comparatively higher than the previous plots in Figure 1, i.e., . In this case, although the feeder and the seeker MNOs enter a negotiation trade, no agreement can be reached upon any of the proposal offers. Notably, it does not satisfies the necessary condition for the negotiation to be successful in Equation (8), i.e., for the negotiation to be successful, the seeker’s reservation price needs to be higher than the feeder’s reservation price and the agreement price is in between, .
4.2. Effects in Revenues
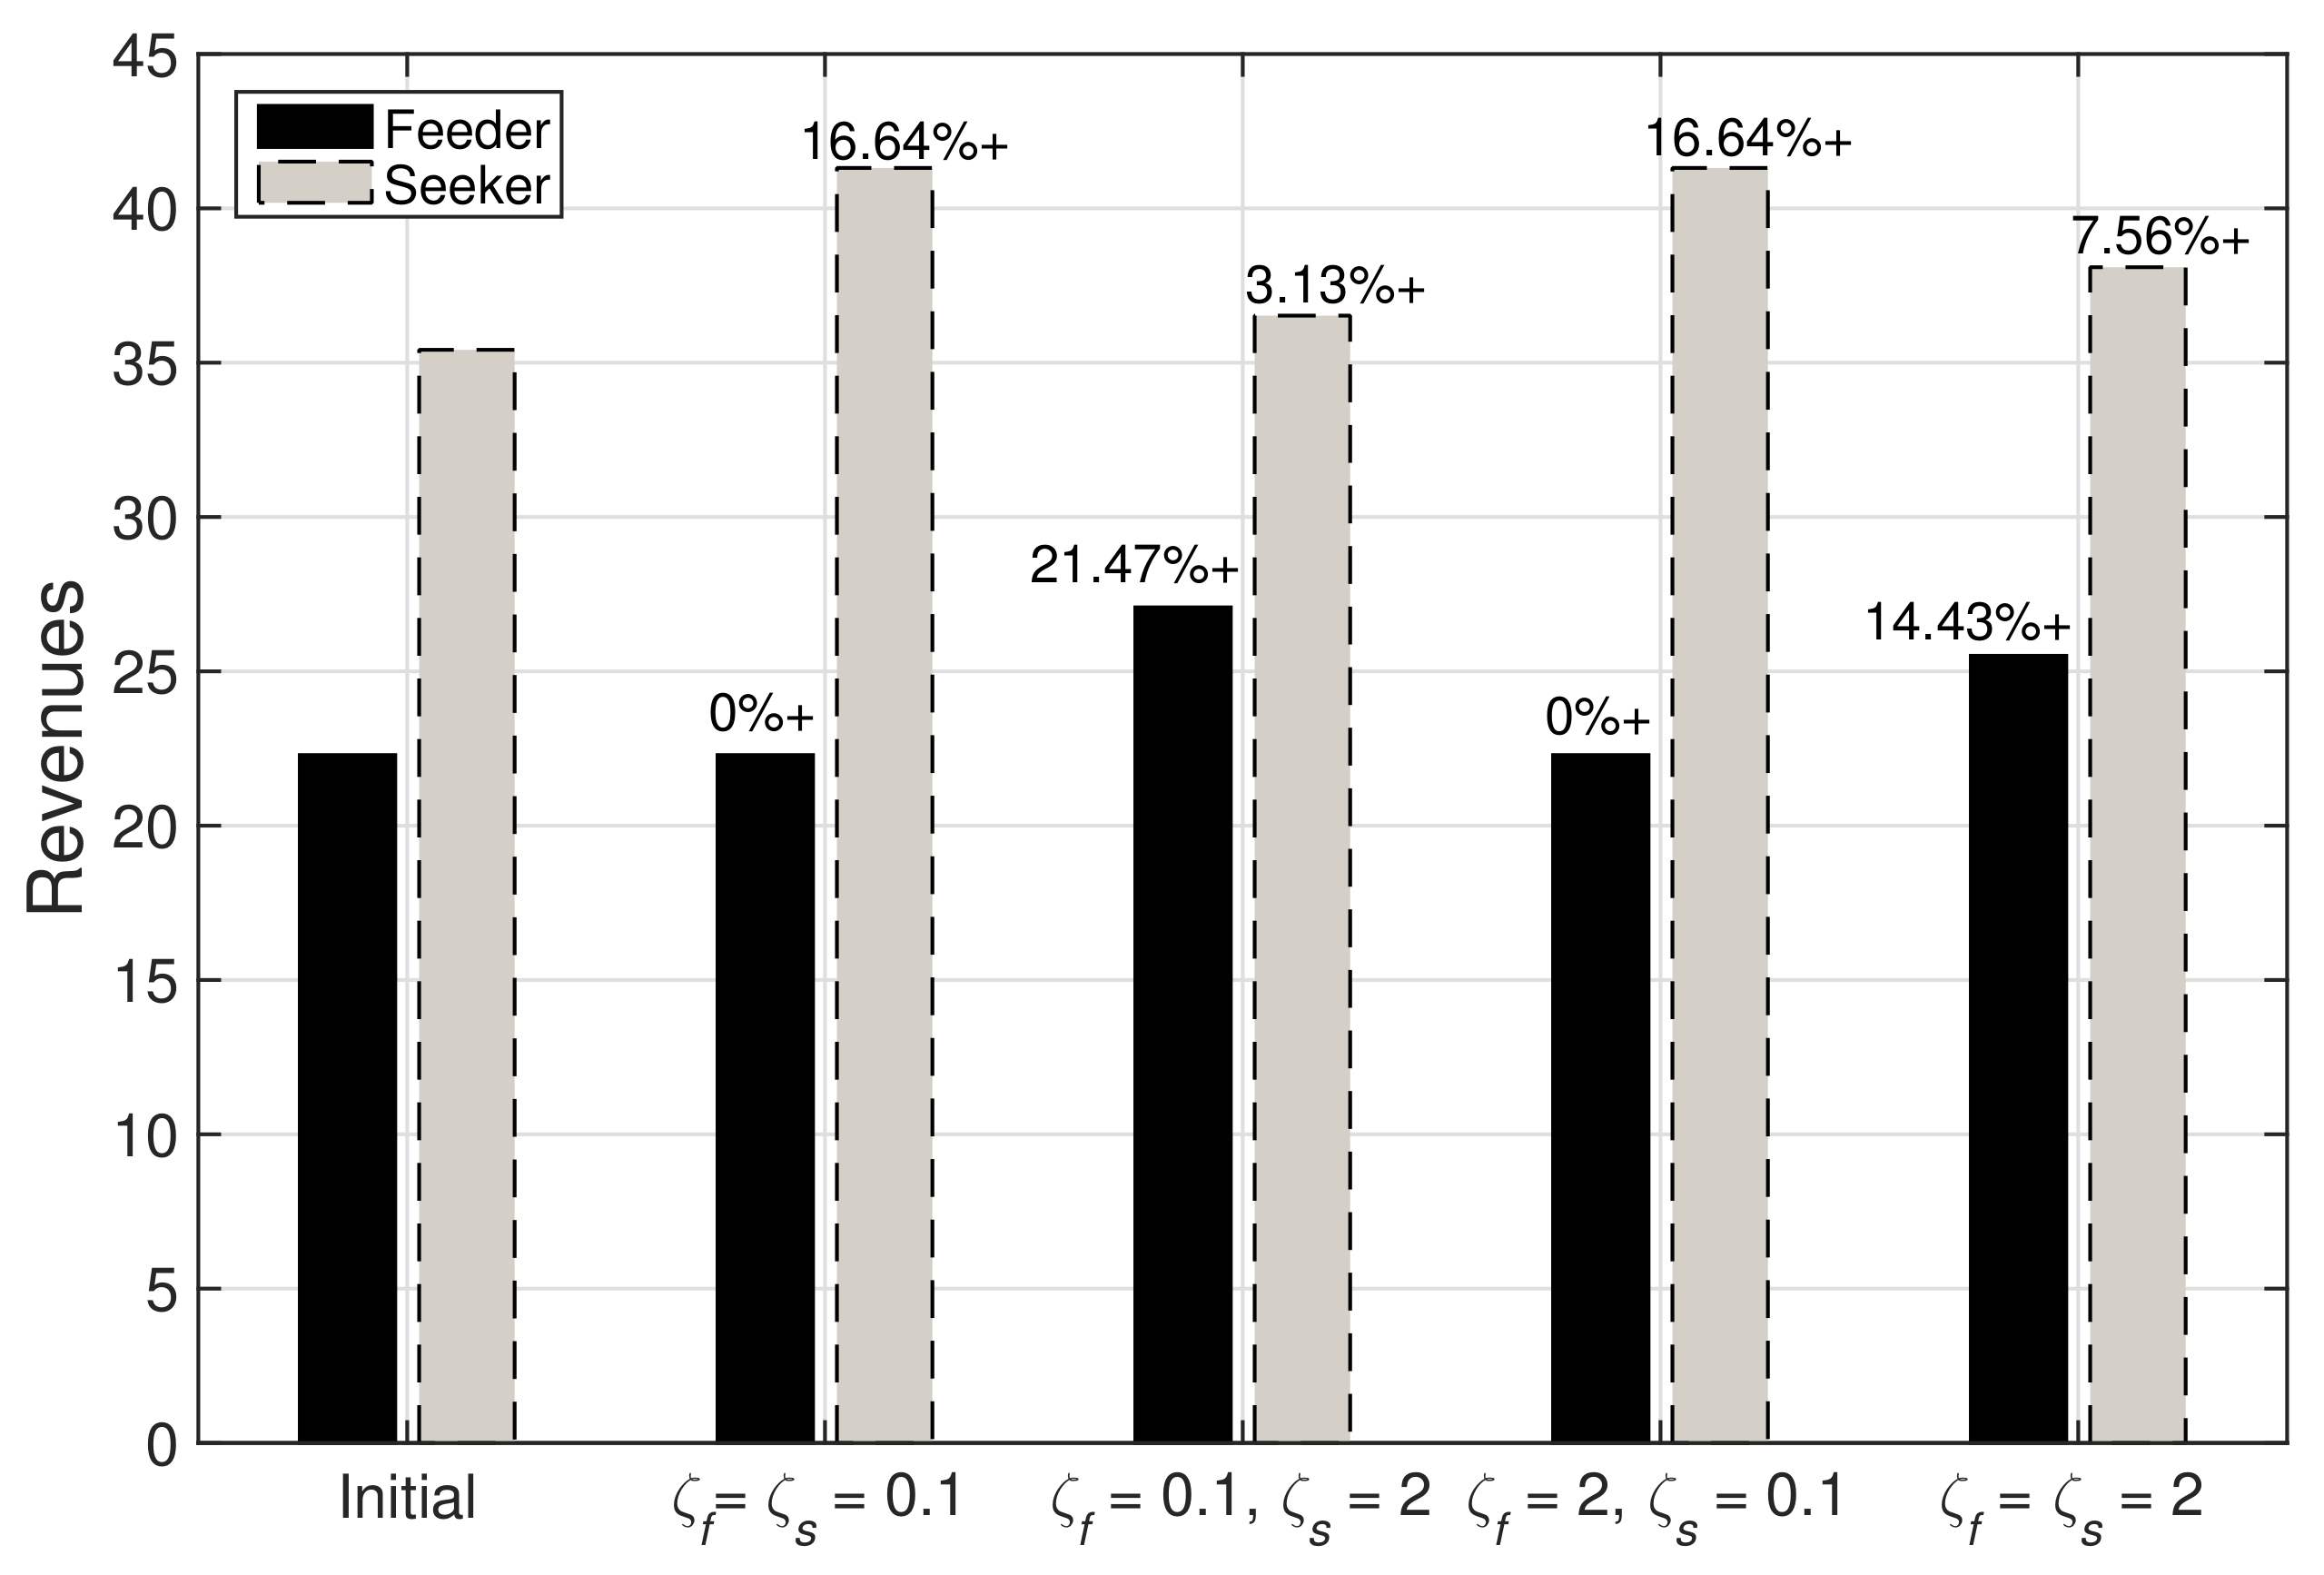
Figure 3 plots the revenues obtained by the feeder and the seeker MNOs after successful agreement on a proposal offer in a negotiation trade. Once a proposal offer from either a feeder or a seeker is accepted in the negotiation trade, as shown in Figure 1, and a collaboration is formed, the plots show that both participants would at least benefit with an increment in revenues from their initial revenues. However, the rates of increment from the initial revenues are dependent on strategies: and values. Notice that, if either of the participant is taking Boulware strategy, then negotiation agreement could be met at much better offers as compared to its reservation price, and this participant could generate a much better revenue. However, it also depends on the strategy taken by the other participant. In addition, the revenues in Figure 1 for and are similar. This is because the agreement price for both cases are the same, i.e., the reservation price of the feeder, as seen in Figure 1a,c. A more general scenario would be that the seeker chooses Conceder strategy, goes to the reservation price rapidly and early, and the feeder chooses Boulware strategy, maintains an offered price until the end of the negotiation round, as shown in Figure 1b. In such scenario, we can notice from the plot in Figure 3 that the feeder has the most increment in their revenue while the seeker also obtains some increment. Hence, both the MNOs will have a win–win policy for collaboration formation at the agreement price.
4.3. Effects in Average Per-User Data Rate
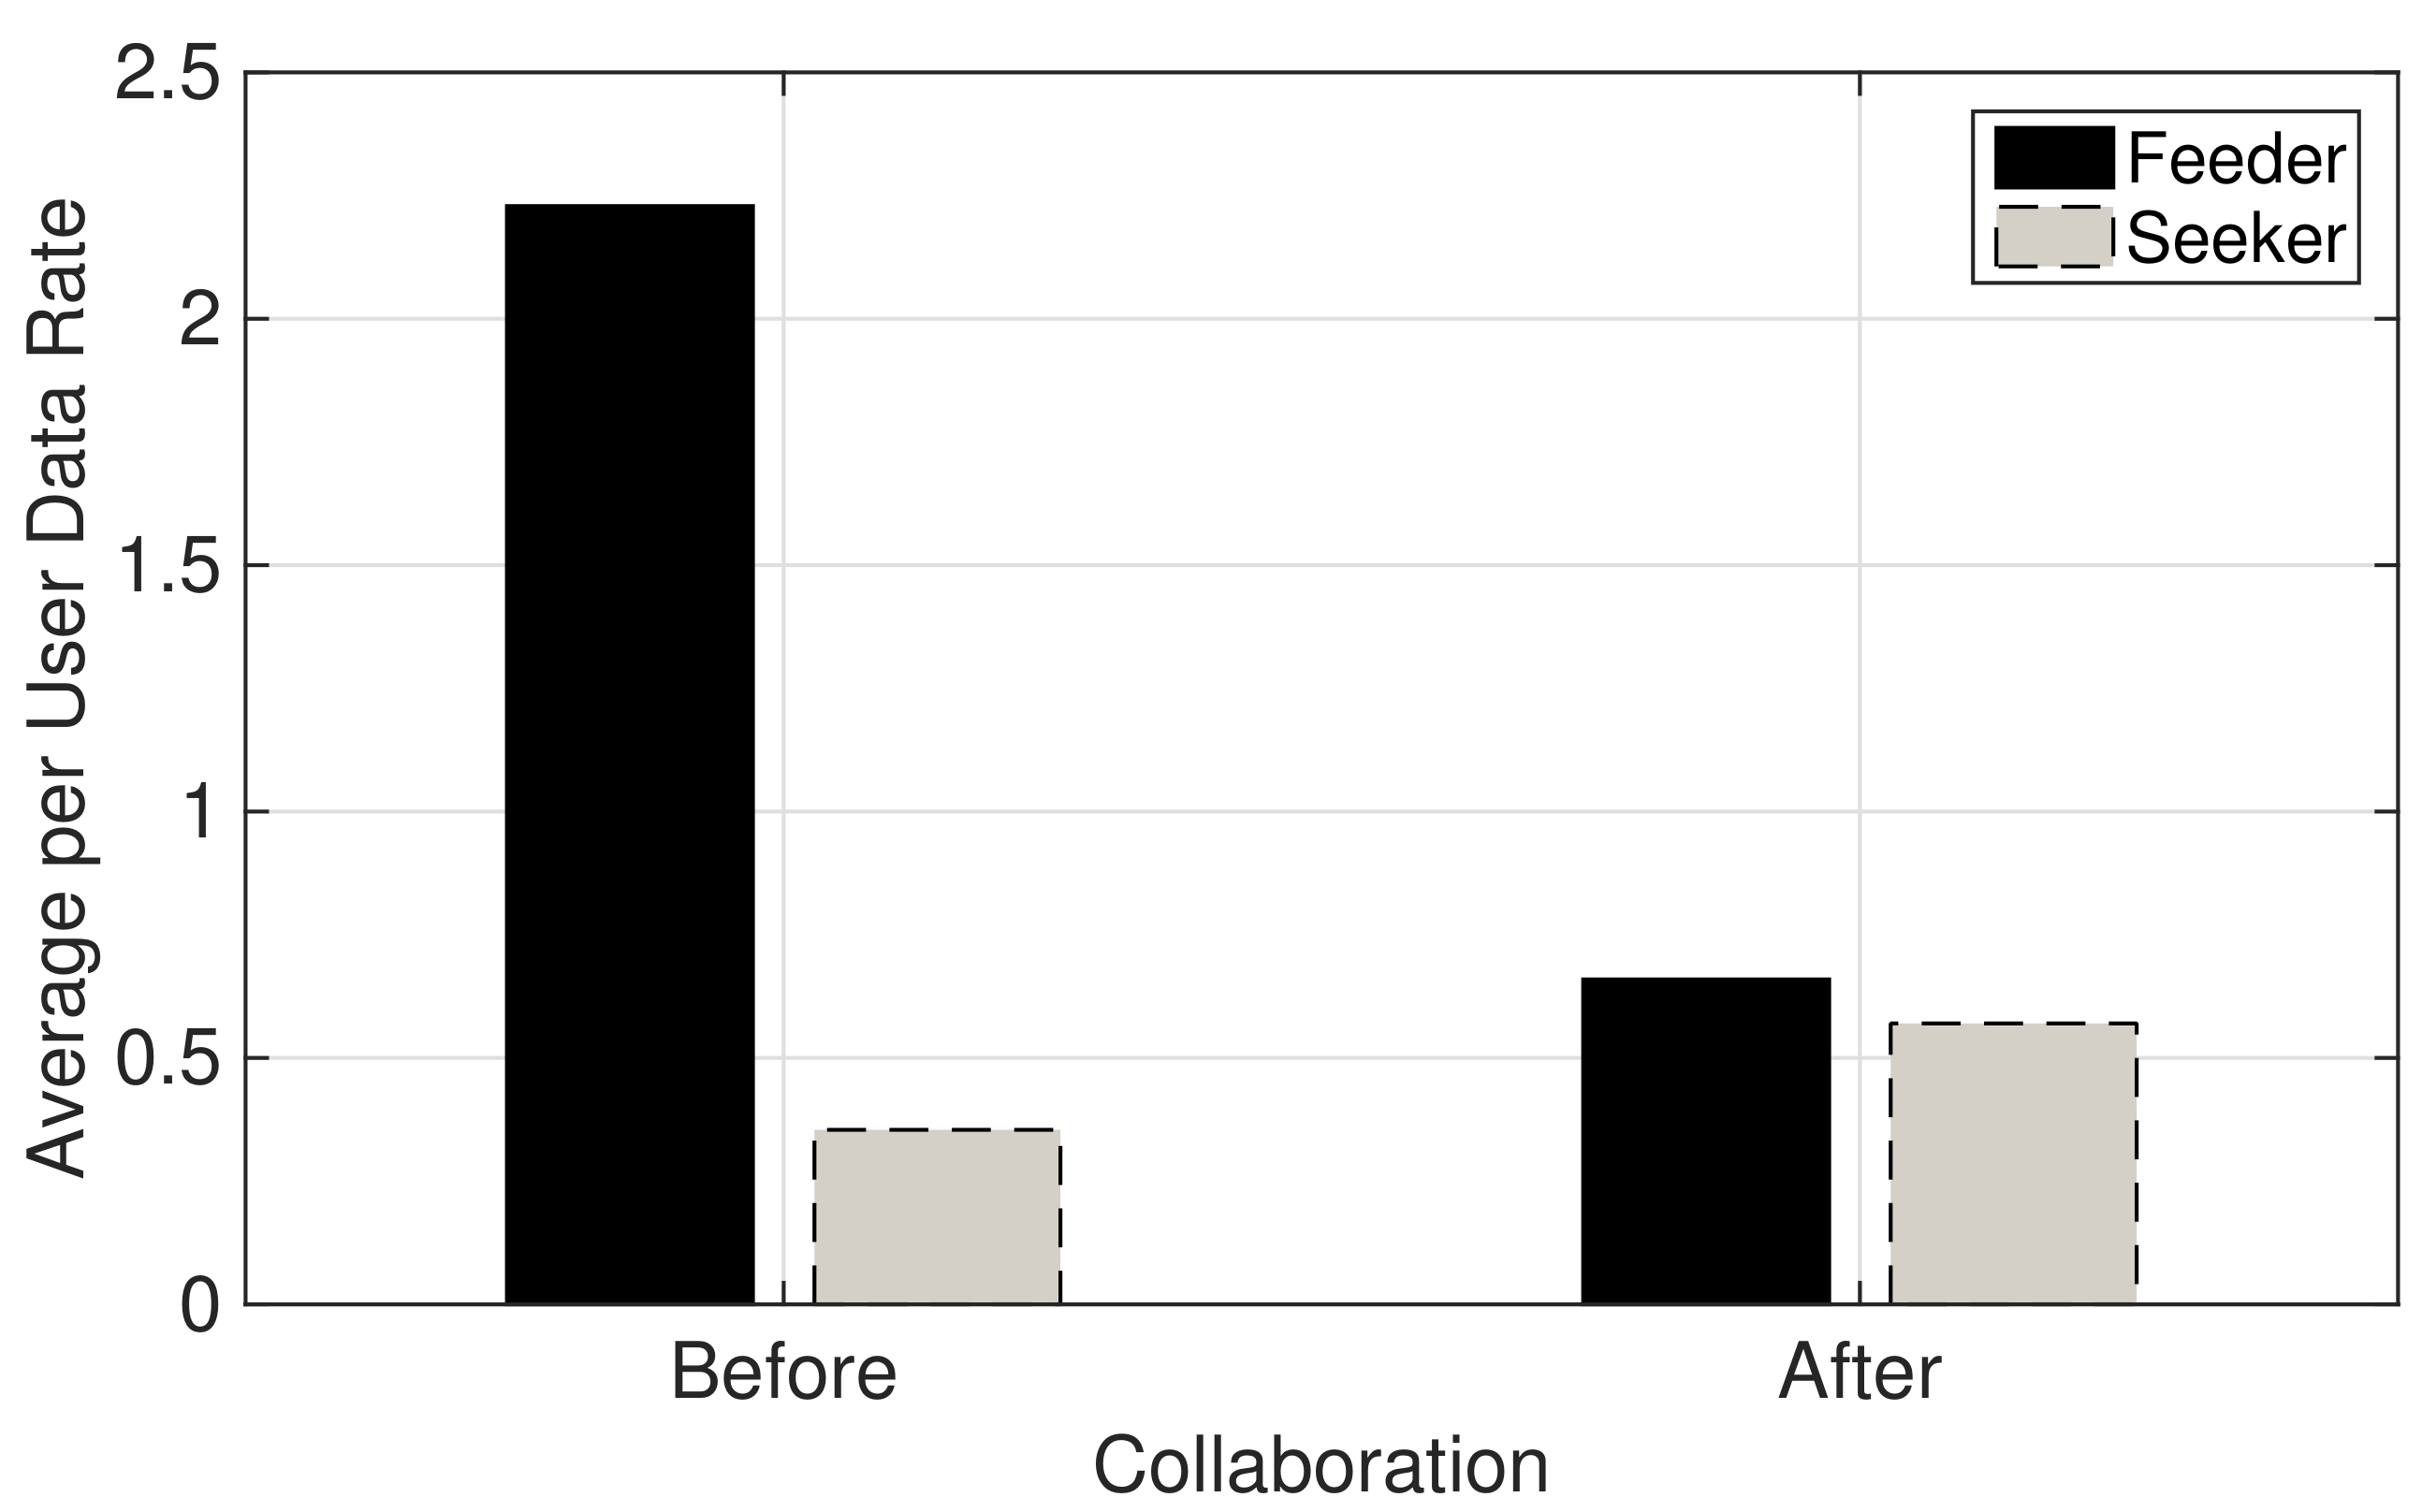
Figure 4 plots before and after collaboration average per-user data rate obtained by the users of the feeder and the seeker MNOs. As shown in the figure, the average per-user data rate of the feeder MNO after collaboration is decreased while the seeker MNO’s average per-user data rate is increased above the threshold value of Mbps per-user. This is because both MNOs try to serve possible maximum number of users to increase their revenues while maintaining the average per-user data rate threshold. Following this, the feeder MNO serves additional MSs of the seeker MNO using its own network resources. The seeker MNO improves the average per-user data rate by reducing its number of MSs to serve by transferring some of its MSs to get service by utilizing the network resources of the feeder MNO.
4.4. Effects in System Capacity
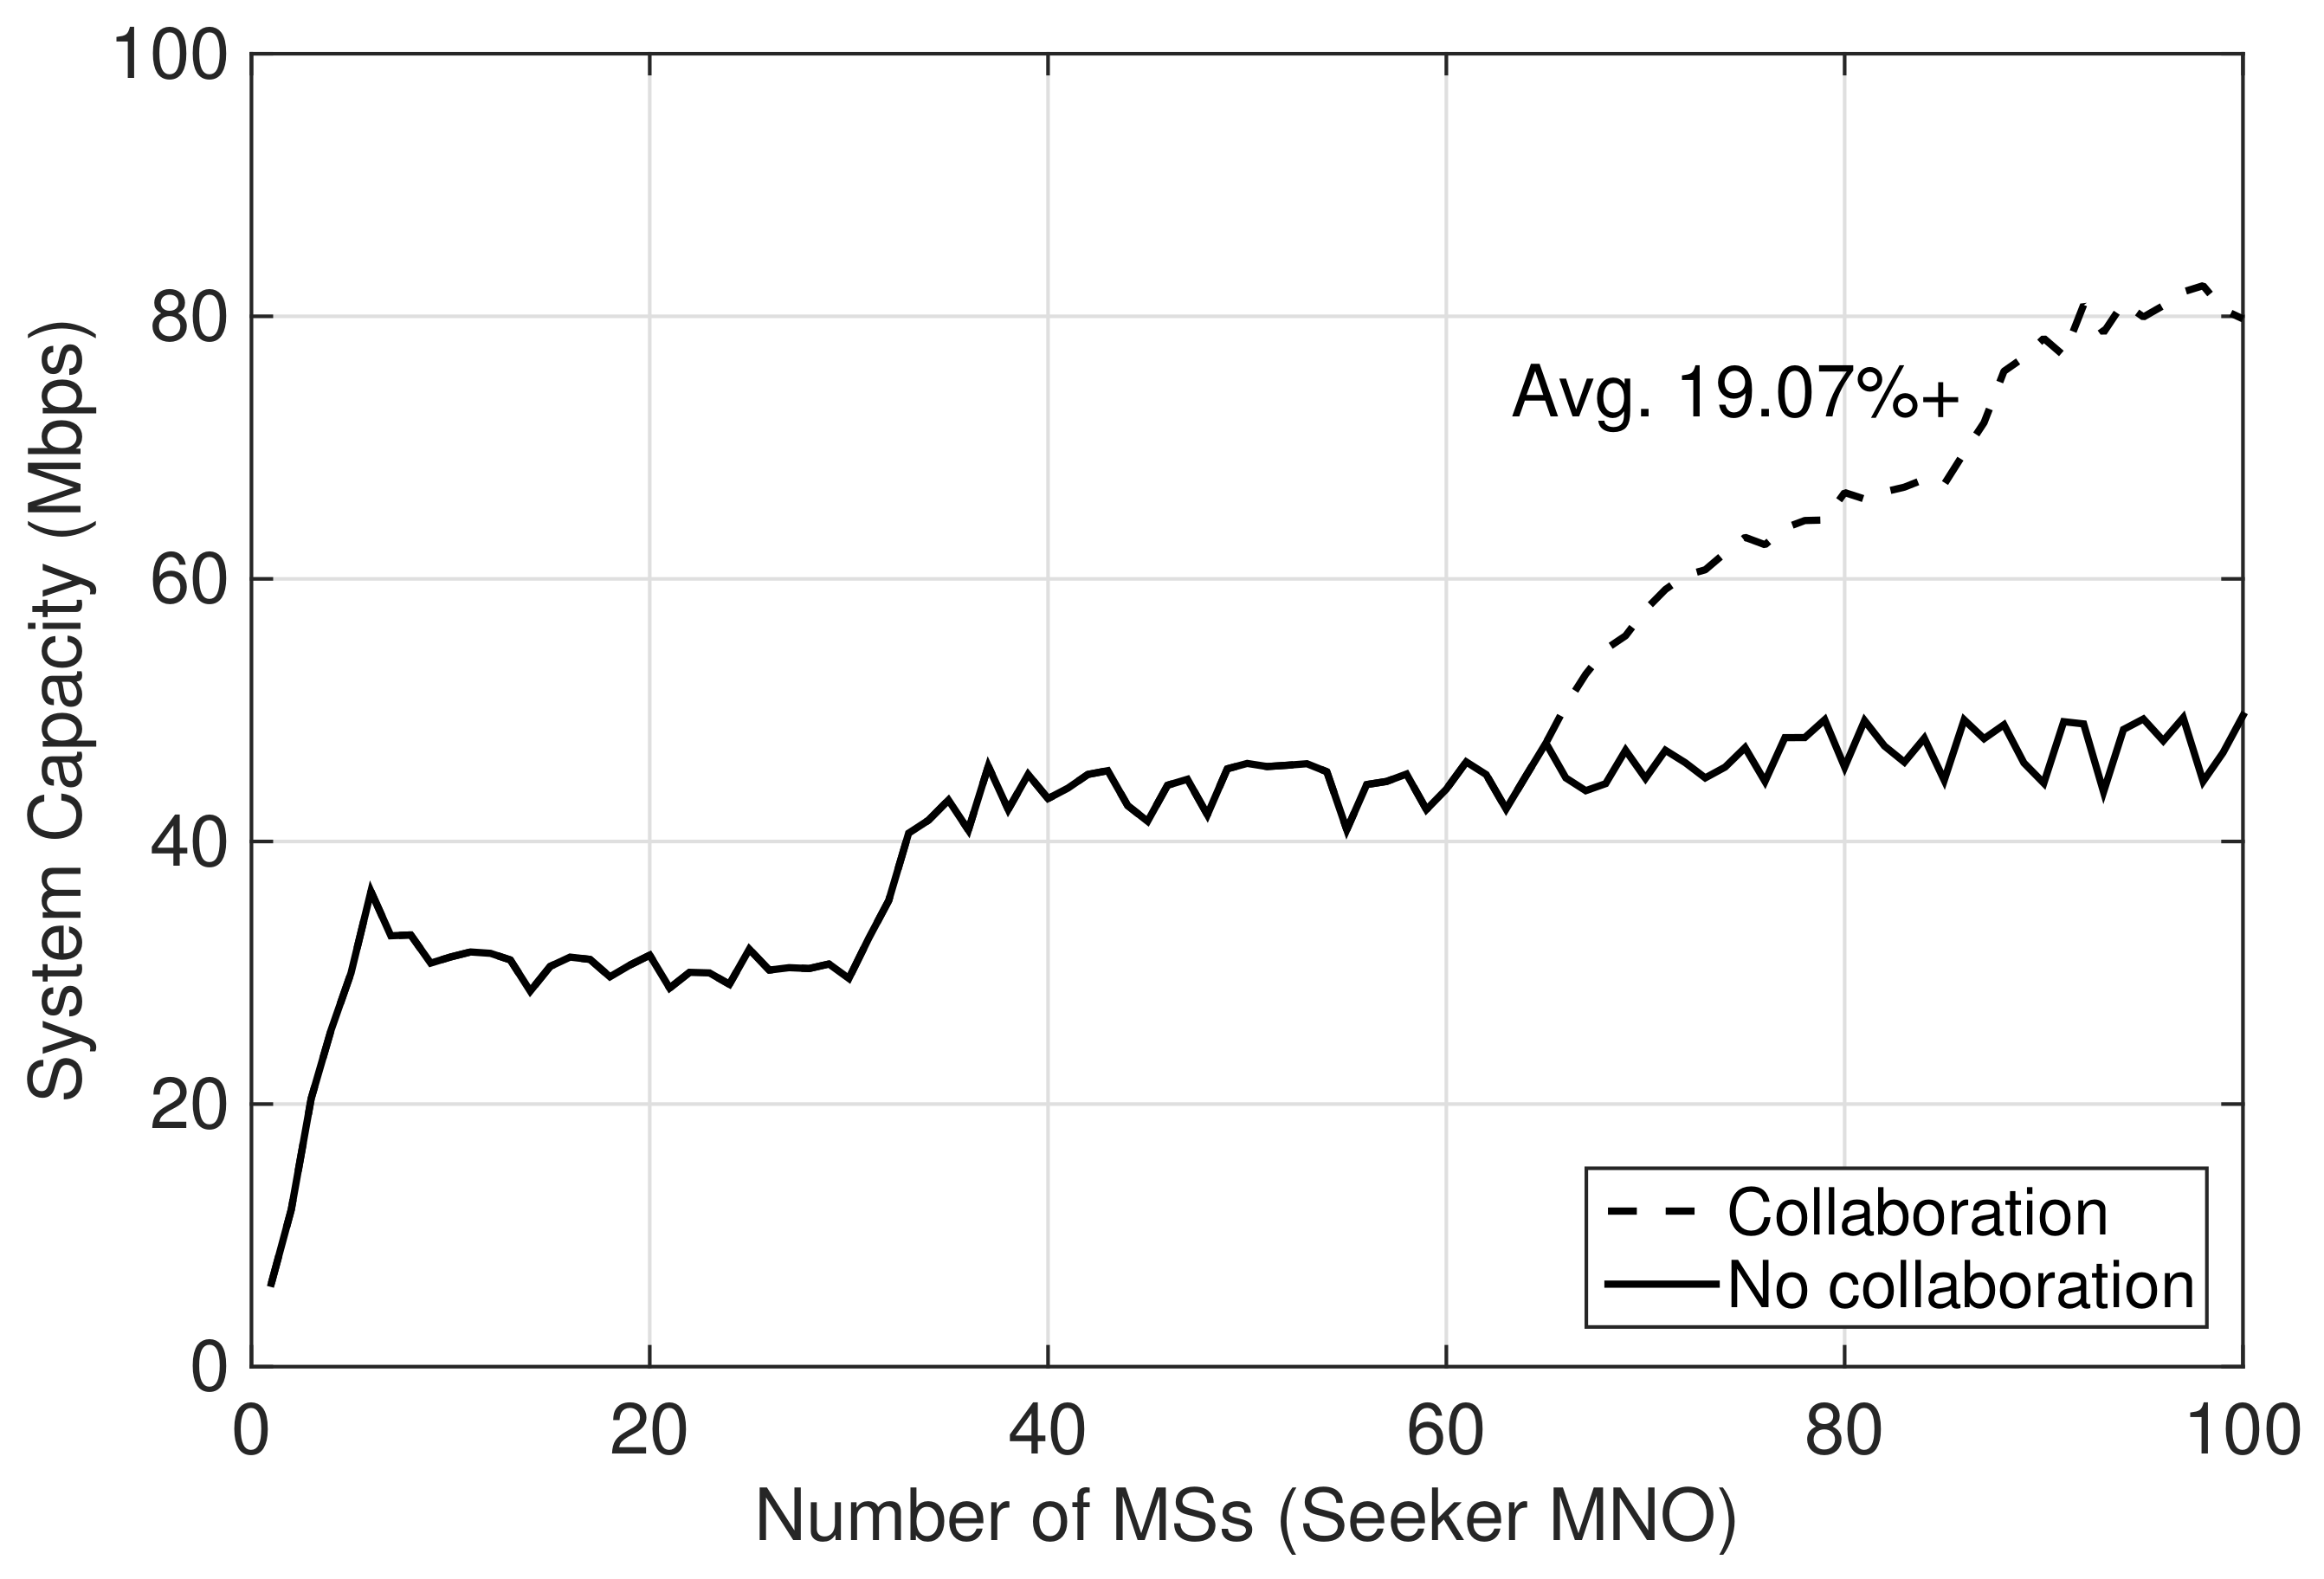
Figure 5 shows the system capacity of the seeker MNO that is obtained after collaboration and compared with the case of no collaboration. In the figure, the collaboration improves the system capacity of the seeker MNO by enabling some of its MSs to be served by utilizing the feeder MNO’s network resources. However, the number of MSs being served by the feeder could be limited depending on the number of MSs belonging to the feeder MNO, . In this regard, the system capacity of the seeker MNO would be dependent on since it dictates how many extra MSs the feeder would be able to serve using its network resources while maintaining the average data rate per-user. From simulation, the average number of MSs that the feeder could serve while maintaining the average data rate per-user is 56. Hence, for given , the feeder could collaborate to serve extra MSs belonging to the seeker MNO, i.e., at most . The seeker MNO requires at most of its users to be served by the feeder MNO to maintain its average data rate per-user. Since , the feeder MNO can serve all additional 35 MSs belonging to the seeker MNO. In Figure 5, the system capacity of seeker MNO after collaboration is improved as compared to no collaboration on average by .
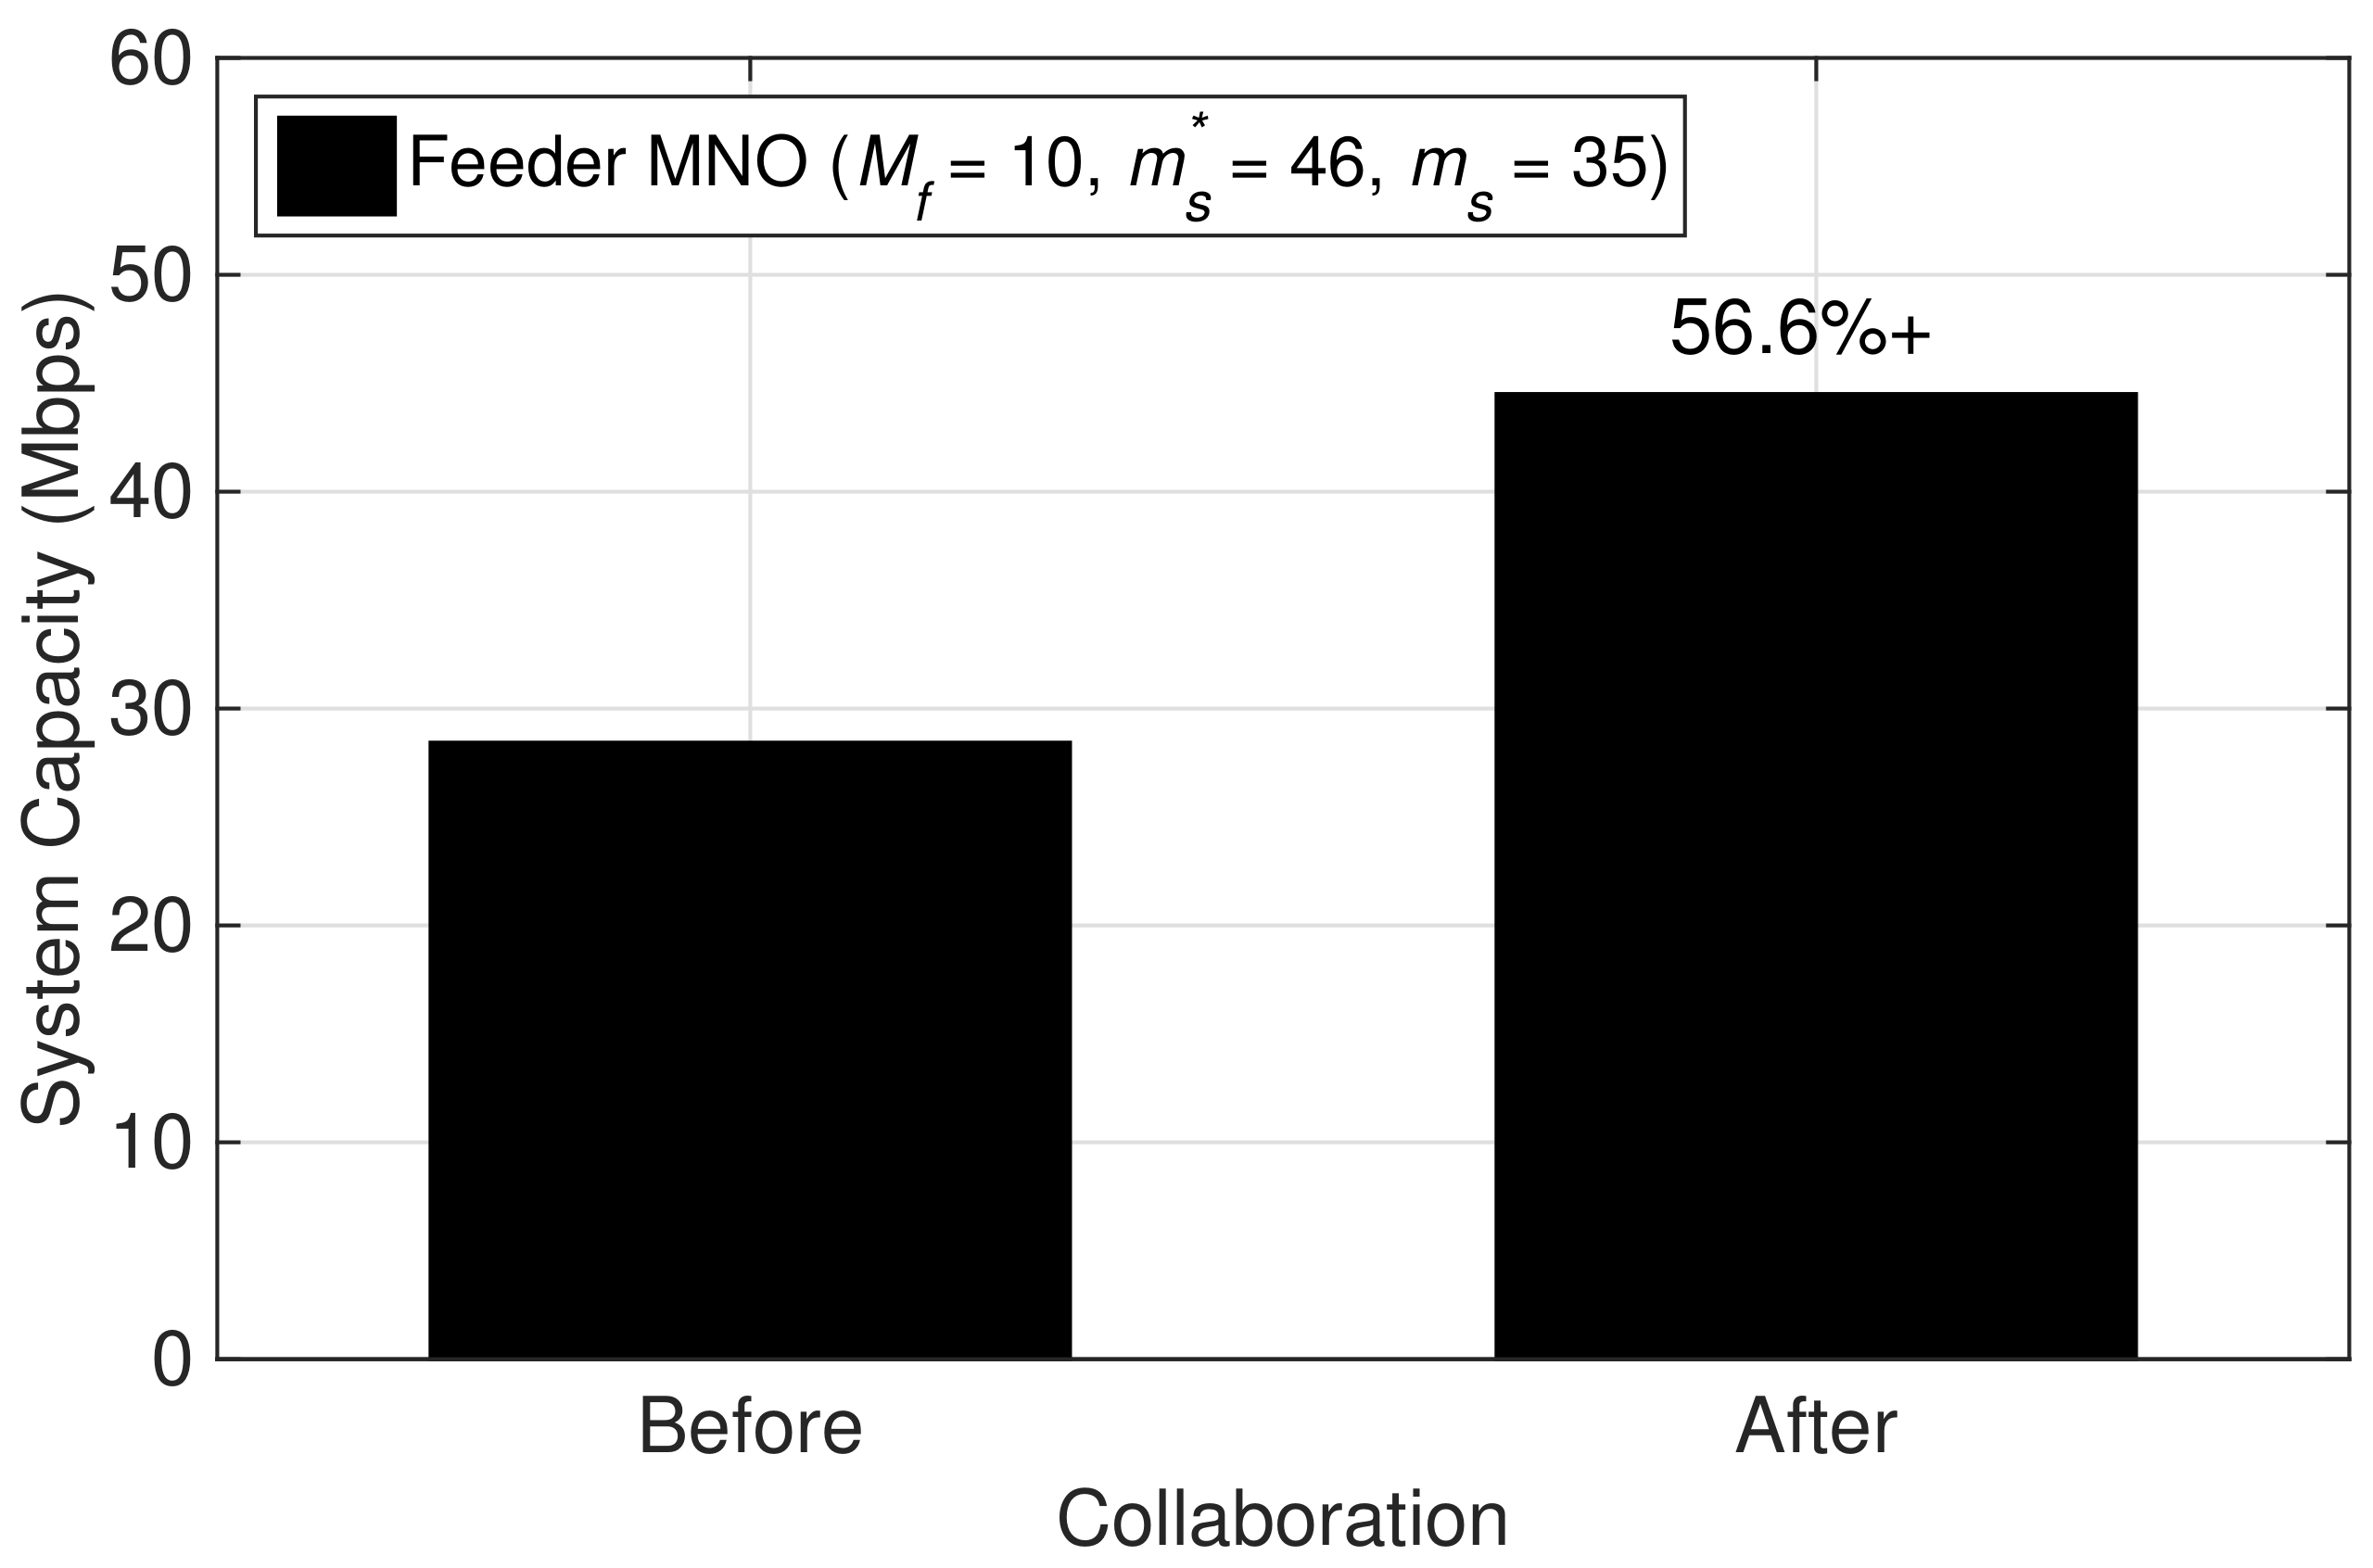
Similarly, for the feeder MNO, the network resources are well utilized after serving additional MSs belonging to the seeker MNO, i.e., . Comparing the results in Figure 6, the system capacity of the feeder MNO after collaboration is improved as compared to before collaboration by , and hence avoids under-utilization of network resources. Here, the total number of users being served from the feeder MNO’s network resources is increased from to . Moreover, the feeder MNO experience lower average per-user data rate at while maintaining the average per-user data rate than the minimum rate requirement, Mbps, as shown in Figure 4. In addition, the revenues obtained by the feeder MNO after collaboration is not less than the initial revenues, as shown in Figure 3.
4.5. Comparison with Shared Networks
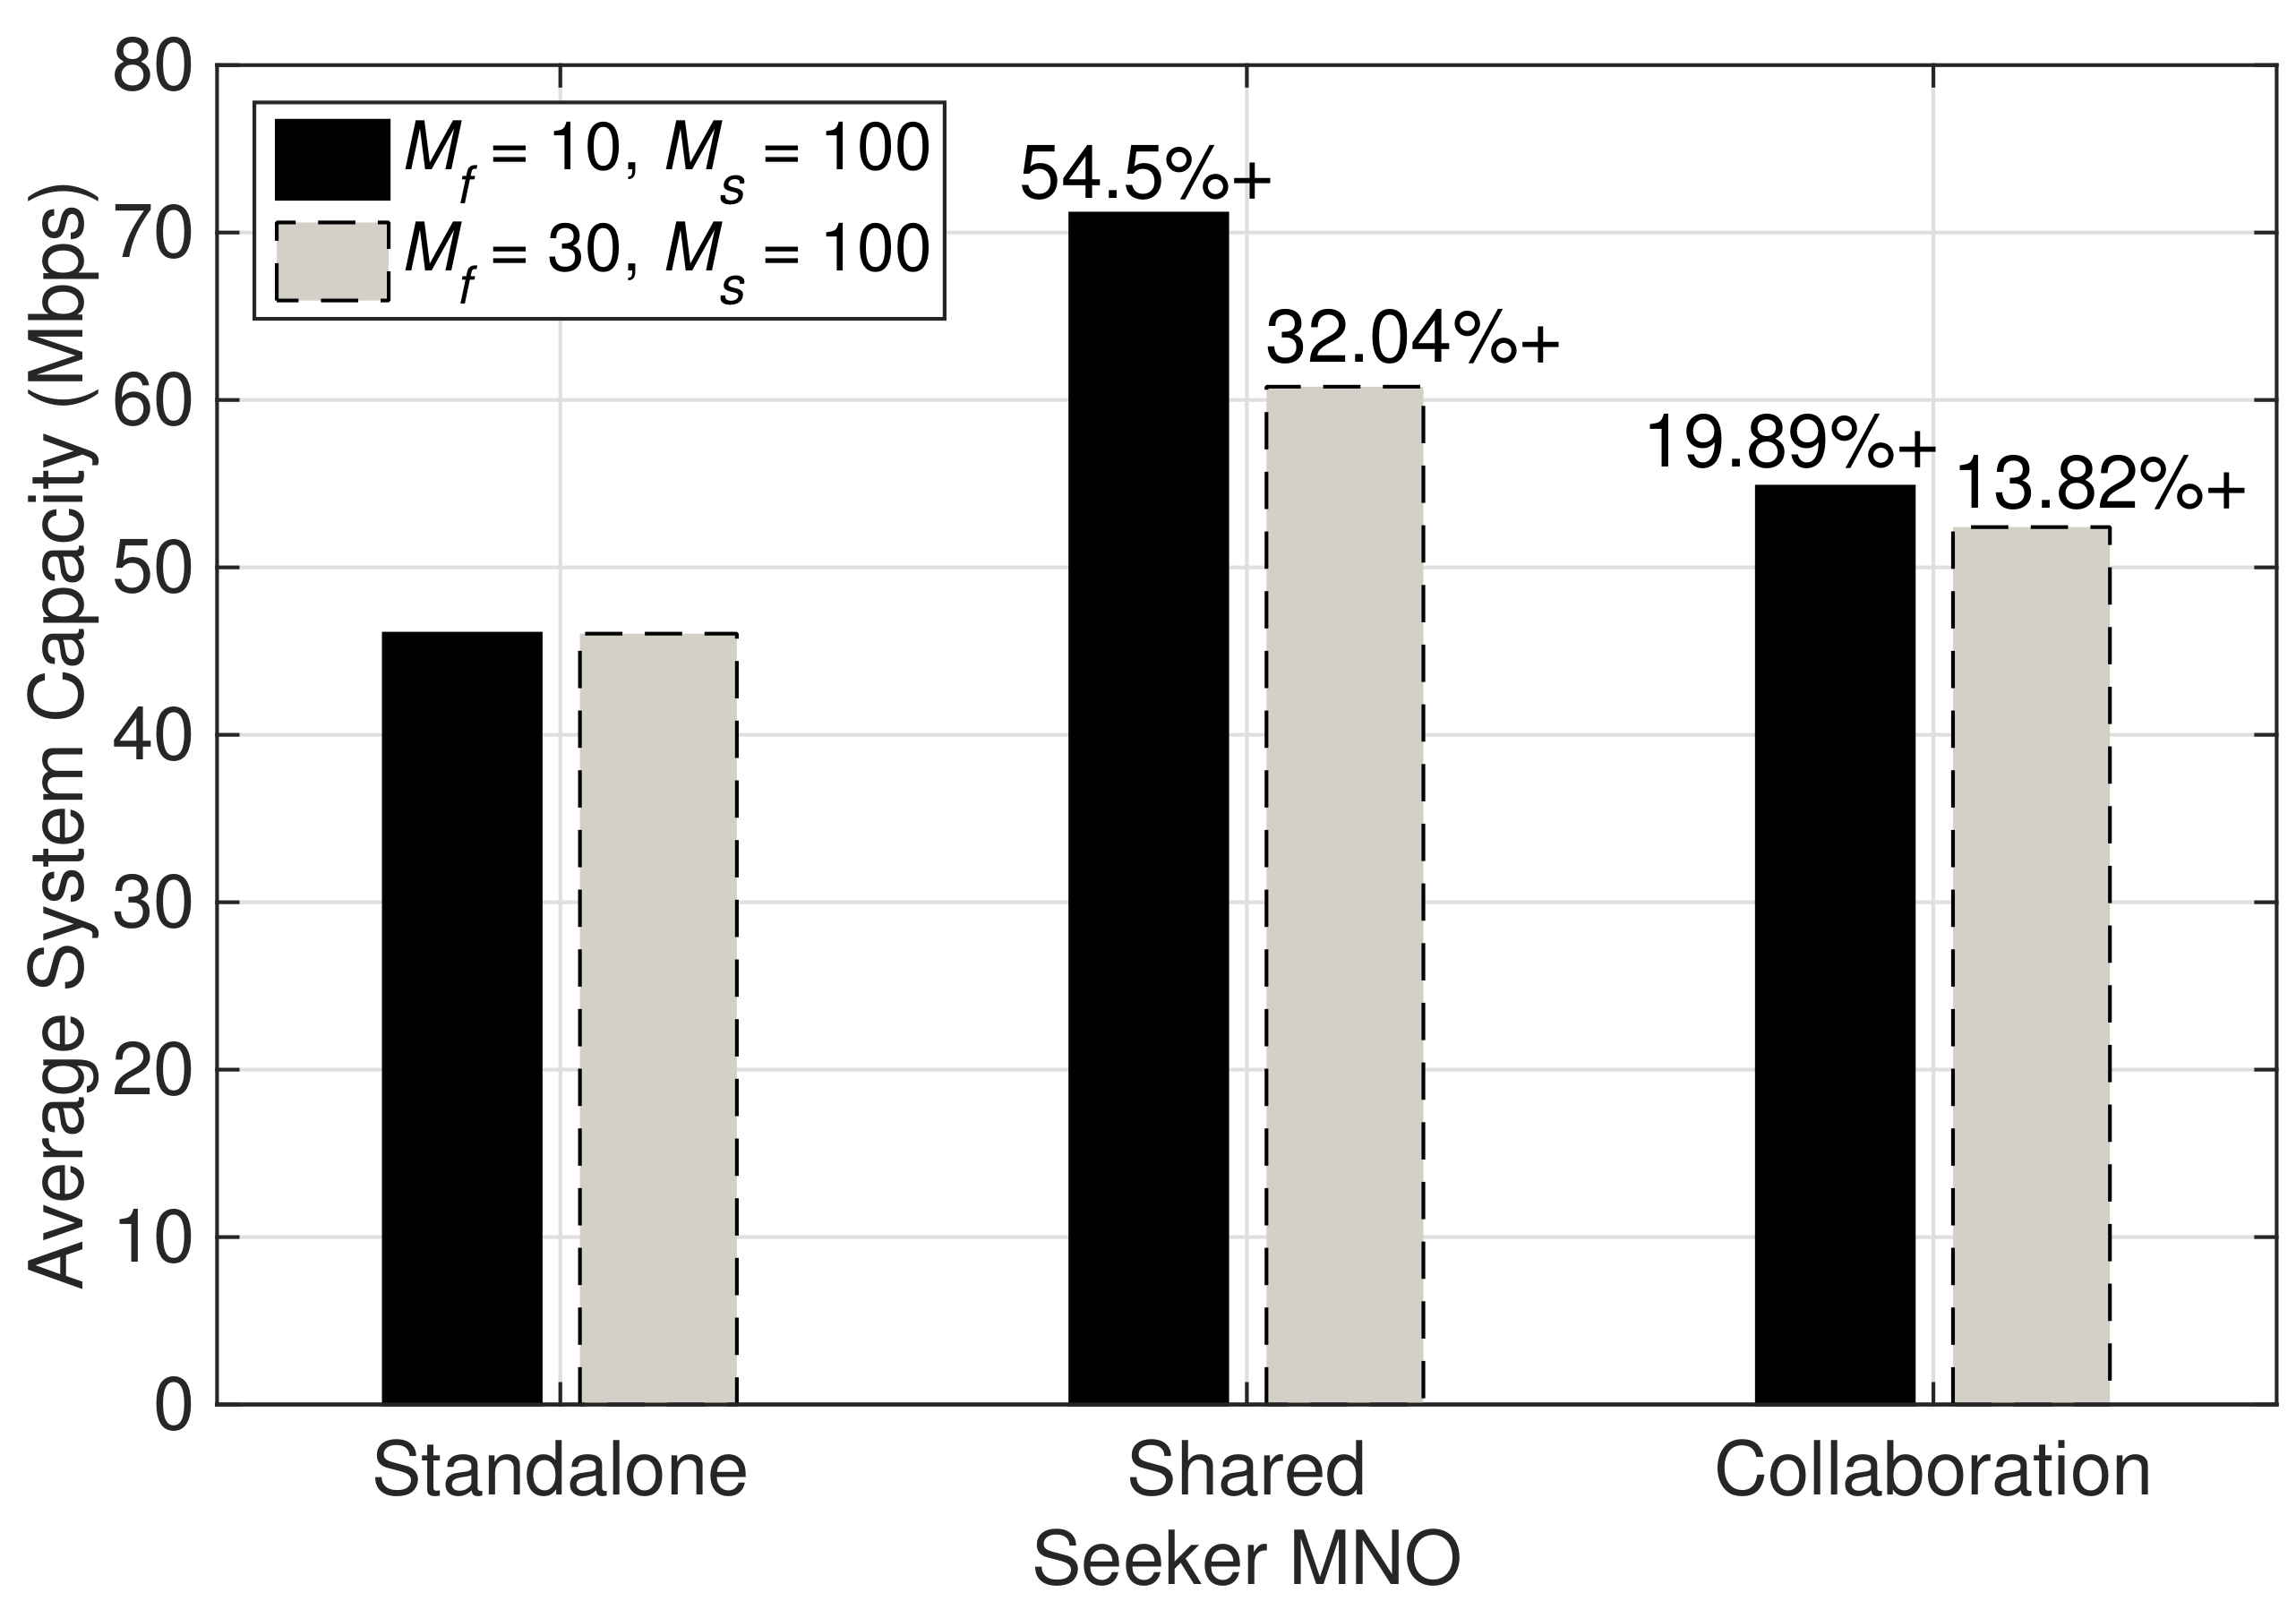
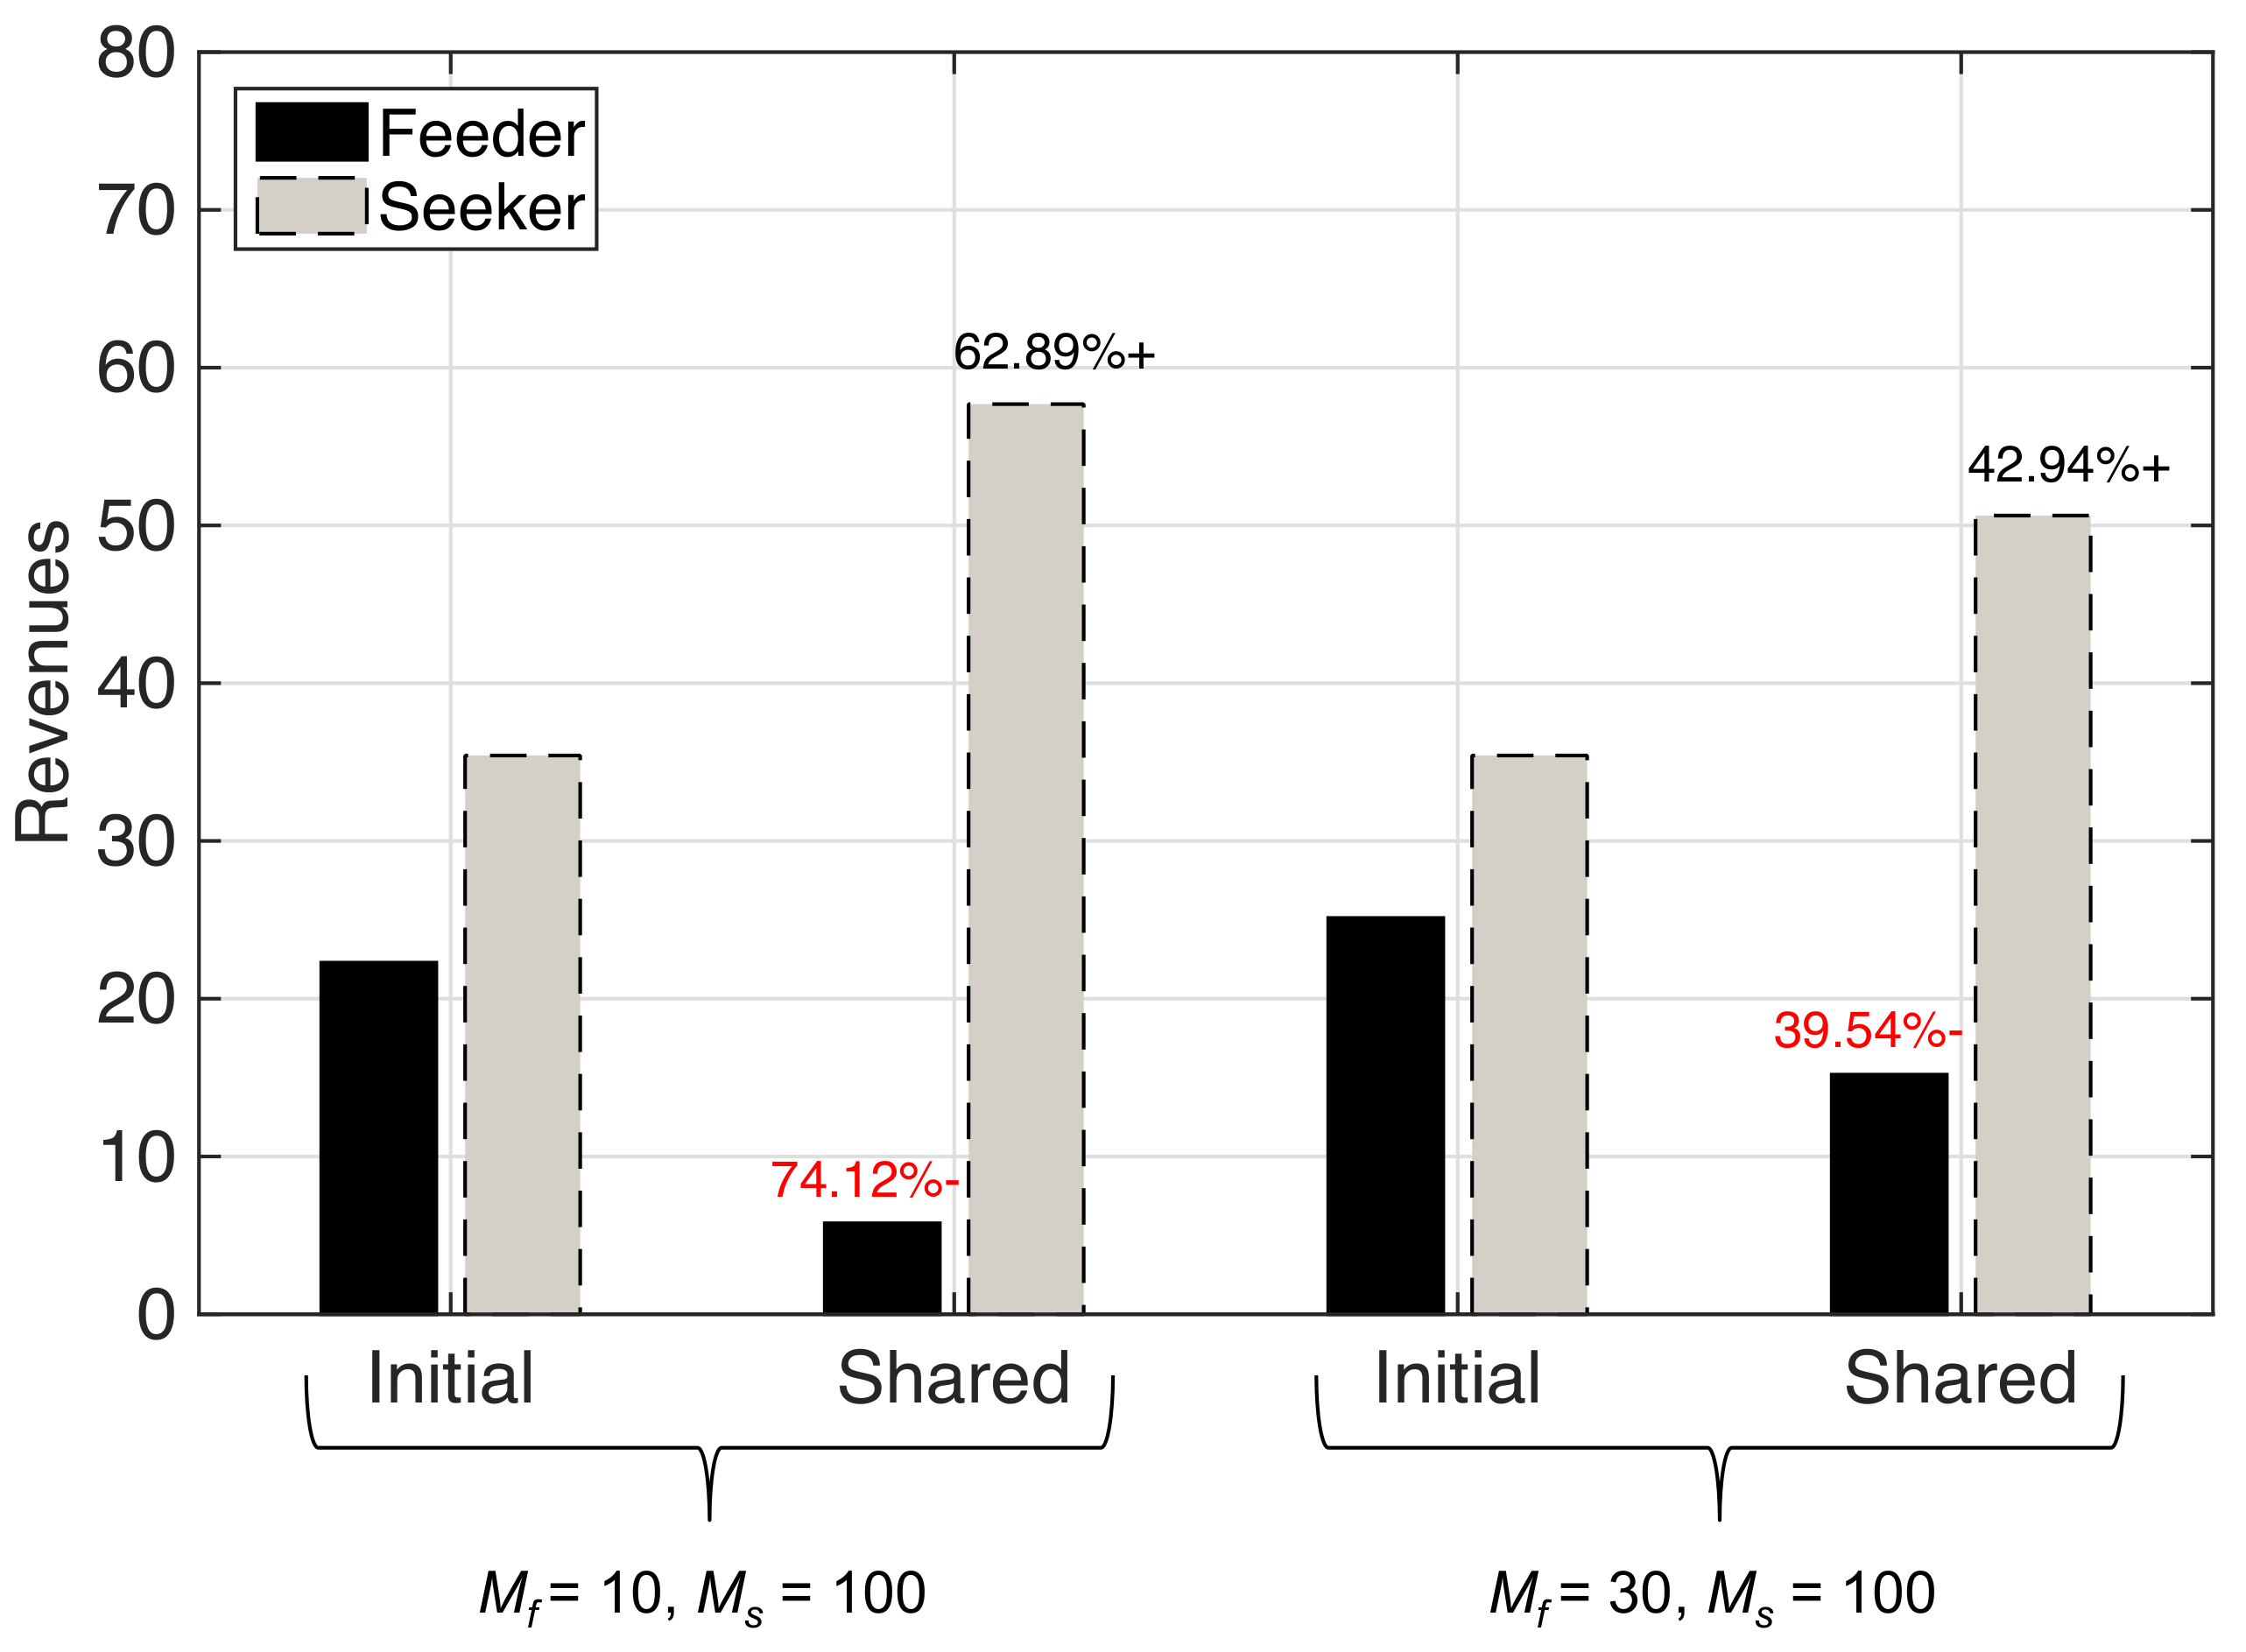
Figure 7 compares the average system capacity of the seeker MNO that is obtained while in standalone mode, sharing the network resources with the feeder MNO, and in collaboration with the feeder MNO, for the two cases: (i) ; and (ii) , given remains fixed. Significant improvement in average system capacity can be observed for both cases while sharing the network resources. However, note that there is a significant drop in the average system capacity by when is increased from 10 to 30. Sharing the network resources provide with improved average system capacity for both cases as compared to collaboration. However, this improvement comes from the fact that the whole network resources of the feeder MNO is utilized by the seeker MNO. Since the number of MSs belonging to the seeker MNO is comparatively large compared to that of the feeder MNO, the revenues obtained by them following Equation (1) would not be favorable to either of them. The indifference in the revenues obtained by the feeder and seeker MNO for the two cases can be observed in Figure 8. Unsurprisingly, there is a large decline in revenues of the feeder MNO while sharing the network resources with the seeker MNO in both cases. Obviously, such a result would not motivate the feeder MNO to share its network resources with the seeker MNO, and hence signifies the importance of considering negotiation to reach an agreement with suitable MNO that could offer each party collaboration gains as a motivation behind sharing network resources. In addition, recall from Figure 3 that the revenues obtained by the feeder and the seeker MNO after collaboration for the case of and are not less than their initial revenues.
4.6. Comparison with Different Resource Allocation Schemes
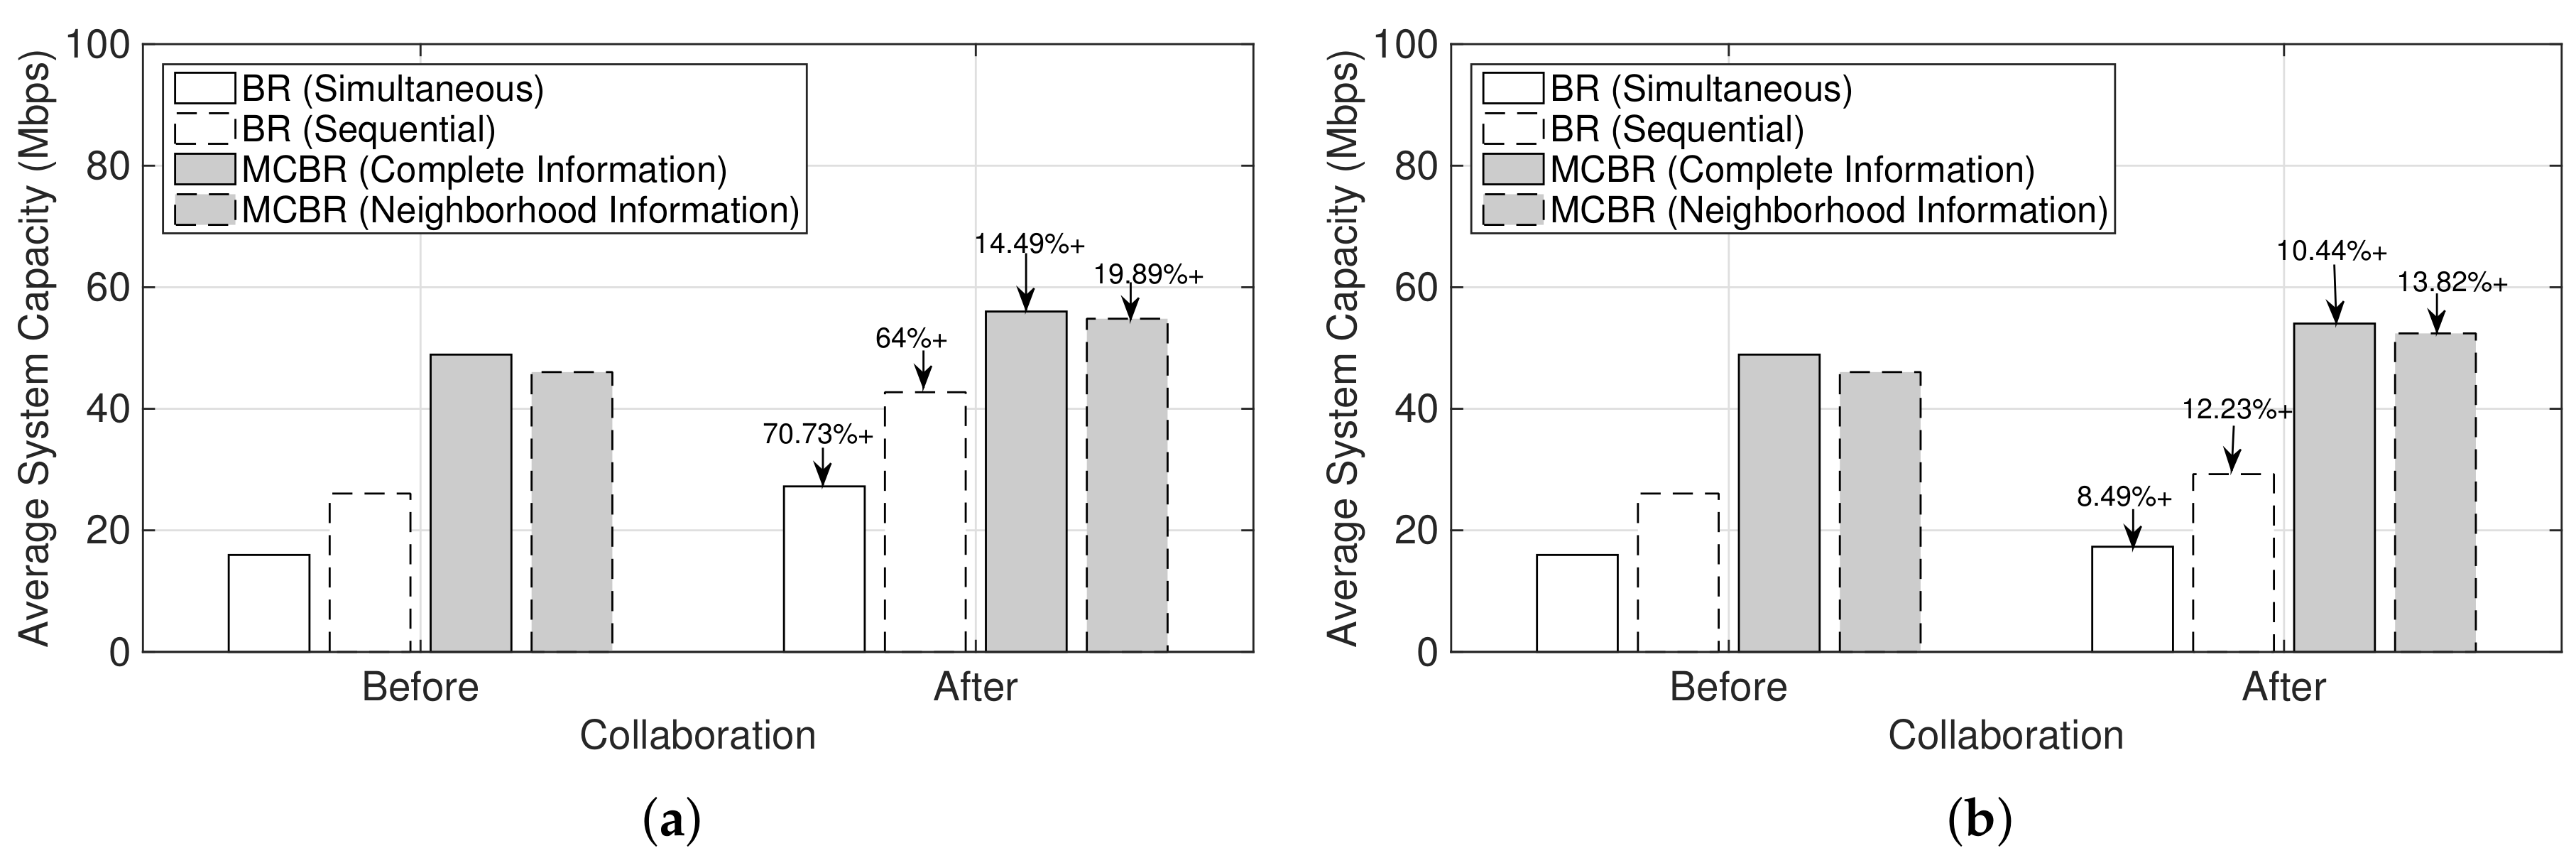
As shown in Figure 7, we observed that the small number of would result in significant improvement in the system capacity for the seeker MNO while collaborating as compared to no collaboration, since more MSs belonging to the seeker could be served by the feeder’s network resources. However, an increment in average system capacity would also depend upon the schemes used for resource allocations. To compare and evaluate the performance of multi-operator small cells collaboration with different resource allocation schemes, we considered the best-response (BR) strategy based different schemes, namely BR (Simultaneous), BR (Sequential), and marginal contribution-based best-response (MCBR) with neighborhood and complete information [40,41]. We averaged the performance for 200 randomly generated deployments of small cells that belong to the two MNOs in a cluster and its associated MSs.
In Figure 9a,b, all the schemes improve average system capacity of the seeker MNO with collaboration as compared to no collaboration. Moreover, as the number of increases (compare Figure 9a,b), the corresponding average system capacity improvement after collaboration is decreased for all schemes. This result is consistent with the observation in Figure 7 and due to the fact that the feeder MNO could serve fewer MSs belonging to the seeker. Figure 9a,b also signifies the importance of resource allocation schemes. As compared to the BR strategy schemes, both MCBR schemes provide significant improvement in average system capacity for both before and after collaboration. Thus, the increment of from 10 to 30 does not have significant effect on the average system capacity of a seeker MNO while using MCBR schemes.
5. Conclusions
In this paper, a mechanism for multi-operator small cells collaboration for network resource management among multiple MNOs is presented. Depending upon policy profile of MNOs, a negotiation trade can be initiated between a seeker and a feeder MNO. An agreement upon a proposal offer indicates that both participants in the negotiation trade could benefit while collaborating: the seeker would benefit by enabling some of their subscribers to get served by network resources of the feeder MNO, thus, improving average per-user data rate of their users, while the feeder MNO generates more revenues from proper utilization of their network resources by serving additional users. Simulation results show that collaborative resource management is able to achieve significant performance gain as compared to sharing the network resources for several performance metrics. Multi-operator small cells collaboration formulates mutual agreement among MNOs prior to the usage of network resources, and is able to enhance services to users with an improved network resources availability, improve MNOs’ revenue generated from an increased market share, avoid under-utilization of network resources, and create an opportunity for ubiquitous access to wireless coverage and connectivity by maintaining SCNs service to subscribers.
Author Contributions
S.S. proposed and worked on the research theme, and wrote the paper; and S.K., Y.L. and Y.T. provided insightful guidance and made critical revision of the article.
Funding
This research was supported by Sirindhorn International Institute of Technology (SIIT), Thammasat University (TU), and Japan Advanced Institute of Science and Technology (JAIST). This research was also partially supported by Thailand National Research Universities (NRU).
Conflicts of Interest
The authors declare no conflict of interest.
Abbreviations
The following abbreviations are used in this paper:
| 3GPP | 3rd Generation Partnership Project |
| BPS | Bits per Second |
| BR | Best Response |
| BS | Base Station |
| BYOD | Bring-Your-Own-Device |
| CMM | Collaboration Management Module |
| C-RAN | Cloud-Radio Access Network |
| GWCN | Gateway Core Network |
| MBS | Macrocell Base Station |
| MCBR | Marginal Contribution-Based Best Response |
| MNO | Mobile Network Operator |
| MOCN | Multi-Operator Core Network |
| MS | Mobile Station |
| RAN | Radio Access Network |
| SBS | Small-cell Base Station |
| SCN | Small Cell Network |
References
- Hossain, E.; Hasan, M. 5G Cellular: Key Enabling Technologies and Research Challenges. arXiv 2015, arXiv:1503.00674. [Google Scholar] [CrossRef]
- Li, Y.; Zhou, G.; Leong, D. An energy-efficient framework for ubiquitous phone access. Int. J. Commun. Syst. 2016, 29, 1896–1906. [Google Scholar] [CrossRef]
- Small Cell Forum. Release 7.0. Market Drivers for Multi-Operator Small Cells. 2016. Available online: http://scf.io/en/documents/017_-_R6_-_Multi-Operator_Market_Drivers.php (accessed on 13 August 2019).
- 3GPP TS 23.251. Universal Mobile Telecommunications Systems (UMTS); LTE; Network Sharing; Architecture and Functional Description (Release 13). 2016. Available online: https://www.arib.or.jp/english/html/overview/doc/STD-T63v9_60/5_Appendix/Rel6/23/23251-660.pdf (accessed on 13 August 2019).
- 3GPP TS 32.130. Telecommunication Management; Network Sharing; Concepts and Requirements (Release 13). 2016. Available online: https://www.etsi.org/deliver/etsi_ts/132100_132199/132130/13.00.00_60/ts_132130v130000p.pdf (accessed on 13 August 2019).
- Small Cell Forum. Release 7.0. Regulatory Issues for Multi-Operator Small Cells. 2016. Available online: https://scf.io/en/documents/019_-_Regulatory_issues_for_multi-operator_small_cells.php (accessed on 13 August 2019).
- GSMA Intelligence. Spectrum for New Entrants, Lessons Learned. 2015. Available online: https://www.gsmaintelligence.com/research/?file=3f4ec58d593cdd88d2a7e71995e82733&download (accessed on 13 August 2019).
- Small Cell Forum. Release 8.0. Multi-Operator Small Cells. 2016. Available online: https://scf.io/en/documents/069_Enterprises_and_multi-operator_small_cells.php (accessed on 13 August 2019).
- Shah, S.; Kittipiyakul, S.; Lim, Y.; Tan, Y. Multi-Operator Small Cells Collaboration Using Simultaneous Bilateral Negotiation. In Proceedings of the 2018 15th International Conference on Electrical Engineering/Electronics, Computer, Telecommunications and Information Technology (ECTI-CON), Chiang Rai, Thailand, 18–21 July 2018; pp. 1–4. [Google Scholar] [CrossRef]
- Cisco. Cisco Visual Networking Index: Global Mobile Data Traffic Forecast Update, 2015–2020 White Paper; Cisco Systems Inc.: San Jose, CA, USA, 2016. [Google Scholar]
- Ericsson. 5G Radio Access. The Commun. Technology Journal since 1924. 2014. Available online: https://pdfs.semanticscholar.org/9a06/bcadf0f4e3770260e0193746d5365b6c9114.pdf (accessed on 13 August 2019).
- Small Cell Forum. Version 191.08.02. Multi-Operator and Neutral Host Small Cells: Drivers, Architectures, Planning and Regulation. 2016. Available online: https://scf.io/en/documents/191_-_Multi-operator_and_neutral_host_small_cells.php (accessed on 13 August 2019).
- Kibilda, J.; Francesco, P.D.; Malandrino, F.; DaSilva, L.A. Infrastructure and spectrum sharing trade-offs in mobile networks. In Proceedings of the 2015 IEEE International Symposium on Dynamic Spectrum Access Networks (DySPAN), Stockholm, Sweden, 29 September–2 October 2015; pp. 348–357. [Google Scholar] [CrossRef]
- Sanguanpuak, T.; Guruacharya, S.; Hossain, E.; Rajatheva, N.; Latva-aho, M. Infrastructure Sharing for Mobile Network Operators: Analysis of Trade-offs and Market. IEEE Trans. Mob. Comput. 2017, 17, 2804–2817. [Google Scholar] [CrossRef]
- Wang, S.; Samdanis, K.; Costa, X.P.; Renzo, M.D. On Spectrum and Infrastructure Sharing in Multi-Operator Cellular Networks. In Proceedings of the 2016 23rd International Conference on Telecommunications (ICT), Thessaloniki, Greece, 16–18 May 2016. [Google Scholar]
- Antonopoulos, A.; Kartsakli, E.; Bousia, A.; Alonso, L.; Verikoukis, C. Energy-efficient infrastructure sharing in multi-operator mobile networks. IEEE Commun. Mag. 2015, 53, 242–249. [Google Scholar] [CrossRef] [Green Version]
- Marzouk, F.; Alheiro, R.; Rodriguez, J.; Radwan, A. Perspectives for 5G Network Sharing for Mobile Small Cells. In International Conference on Broadband Communications, Networks and Systems; Springer International Publishing: Cham, Switzerland, 2019; pp. 377–386. [Google Scholar]
- Luoto, P.; Pirinen, P.; Bennis, M.; Samarakoon, S.; Scott, S.; Latva-aho, M. Co-Primary Multi-Operator Resource Sharing for Small Cell Networks. IEEE Trans. Wirel. Commun. 2015, 14, 3120–3130. [Google Scholar] [CrossRef]
- Jorswieck, E.A.; Badia, L.; Fahldieck, T.; Karipidis, E.; Luo, J. Spectrum sharing improves the network efficiency for cellular operators. IEEE Commun. Mag. 2014, 52, 129–136. [Google Scholar] [CrossRef]
- Sanguanpuak, T.; Guruacharya, S.; Rajatheva, N.; Bennis, M.; Latva-Aho, M. Multi-Operator Spectrum Sharing for Small Cell Networks: A Matching Game Perspective. IEEE Trans. Wirel. Commun. 2017, 16, 3761–3774. [Google Scholar] [CrossRef]
- ETSI GR NFV-EVE 012 V3.1.1. Network Functions Virtualisation (NFV) Release 3; Evolution and Ecosystem; Report on Network Slicing Support with ETSI NFV Architecture Framework. 2017. Available online: https://www.etsi.org/deliver/etsi_gr/NFV-EVE/001_099/012/03.01.01_60/gr_NFV-EVE012v030101p.pdf (accessed on 13 August 2019).
- 3GPP TS 23.501 V15.2.0. 5G; System Architecture for the 5G System (Release 15). 2018. Available online: https://www.etsi.org/deliver/etsi_ts/123500_123599/123501/15.02.00_60/ts_123501v150200p.pdf (accessed on 13 August 2019).
- 3GPP TR 28.801 V15.1.0. 3rd Generation Partnership Project; Technical Specification Group Services and System Aspects; Telecommunication Management; Study on Management and Orchestration of Network Slicing for Next Generation Network (Release 15). 2018. Available online: https://portal.3gpp.org/desktopmodules/Specifications/SpecificationDetails.aspx?specificationId=3091 (accessed on 13 August 2019).
- Chochliouros, I.P.; Giannoulakis, I.; Kourtis, T.; Belesioti, M.; Sfakianakis, E.; Spiliopoulou, A.S.; Bompetsis, N.; Kafetzakis, E.; Goratti, L.; Dardamanis, A. A Model for an Innovative 5G-Oriented Architecture, Based on Small Cells Coordination for Multi-tenancy and Edge Services. In Artificial Intelligence Applications and Innovations; Springer International Publishing: Cham, Switzerland, 2016; pp. 666–675. [Google Scholar]
- Samdanis, K.; Costa-Perez, X.; Sciancalepore, V. From network sharing to multi-tenancy: The 5G network slice broker. IEEE Commun. Mag. 2016, 54, 32–39. [Google Scholar] [CrossRef]
- Rates Crippa, M.; Arnold, P.; Friderikos, V.; Gajic, B.; Guerrero, C.; Holland, O.; Labrador Pavon, I.; Sciancalepore, V.; von Hugo, D.; Wong, S.; et al. Resource Sharing for a 5G Multi-tenant and Multi-service Architecture. In Proceedings of the European Wireless 2017 23th European Wireless Conference, Dresden, Germany, 17–19 May 2017; pp. 1–6. [Google Scholar]
- Gang, J.; Friderikos, V. Optimal resource sharing in multi-tenant 5G networks. In Proceedings of the 2018 IEEE Wireless Communications and Networking Conference (WCNC), Barcelona, Spain, 15–18 April 2018; pp. 1–6. [Google Scholar] [CrossRef]
- Raza, M.R.; Rostami, A.; Wosinska, L.; Monti, P. A Slice Admission Policy Based on Big Data Analytics for Multi-Tenant 5G Networks. J. Light. Technol. 2019, 37, 1690–1697. [Google Scholar] [CrossRef]
- Sciancalepore, V.; Renzo, M.D.; Costa-Pérez, X. STORNS: Stochastic Radio Access Network Slicing. arXiv 2019, arXiv:1901.05336. [Google Scholar]
- 3GPP TR 23.708. Architecture Enhancement for Service Capability Exposure (Release 13). 2015. Available online: https://portal.3gpp.org/desktopmodules/Specifications/SpecificationDetails.aspx?specificationId=869 (accessed on 13 August 2019).
- Chandrasekhar, V.; Andrews, J.; Gatherer, A. Femtocell networks: A survey. Commun. Mag. IEEE 2008, 46, 59–67. [Google Scholar] [CrossRef]
- Bouras, C.; Kokkinos, V.; Papazois, A. Financing and Pricing Small Cells in Next-Generation Mobile Networks. In Proceedings of the Wired/Wireless Internet Communications: 12th International Conference, WWIC 2014, Paris, France, 26–28 May 2014. [Google Scholar] [CrossRef]
- Li, C.; Giampapa, J.; Sycara, K. Bilateral negotiation decisions with uncertain dynamic outside options. IEEE Trans. Syst. Man Cybern. Part C (Appl. Rev.) 2006, 36, 31–44. [Google Scholar] [CrossRef] [Green Version]
- Faratin, P.; Sierra, C.; Jennings, N.R. Negotiation decision functions for autonomous agents. Robot. Auton. Syst. 1998, 24, 159–182. [Google Scholar] [CrossRef] [Green Version]
- Raiffa, H. The Art and Science of Negotiation; Harvard University Press: Cambridge, MA, USA, 1982. [Google Scholar]
- Pruitt, D.G. Negotiation Behavior; Academic Press: Cambridge, MA, USA, 1981. [Google Scholar]
- 3GPP TR 36.932. Scenarios and Requirements for Small Cell Enhancements for E-UTRA and E-UTRAN (Release 12). 2013. Available online: https://portal.3gpp.org/desktopmodules/Specifications/SpecificationDetails.aspx?specificationId=2590 (accessed on 13 August 2019).
- 3GPP TR 36.814. Further Advancements for E-UTRA Physical Layer Aspects (Release 9). 2010. Available online: https://portal.3gpp.org/desktopmodules/Specifications/SpecificationDetails.aspx?specificationId=2493 (accessed on 13 August 2019).
- Hossain, E.; Le, L.B.; Niyato, D. Radio Resource Management in Multi-Tier Cellular Wireless Networks: Chapter 1 Overview of Multi-Tier Cellular Wireless Networks; John Wiley & Sons: Hoboken, NJ, USA, 2013. [Google Scholar] [CrossRef]
- Nisan, N.; Schapira, M.; Valiant, G.; Zohar, A. Best-Response Mechanisms. In Proceedings of the Innovations in Computer Science (ICS), Beijing, China, 7–9 January 2011. [Google Scholar]
- Shah, S.; Kittipiyakul, S.; Lim, Y.; Tan, Y. Marginal Contribution-Based Distributed Subchannel Allocation in Small Cell Networks. Sensors 2018, 18, 1500. [Google Scholar] [CrossRef] [PubMed]
Figure 1.
Proposal offers of a feeder and a seeker MNO depending upon values of and , i.e., and , and and . A case of agreement in a negotiation trade, where agreement price follows . (a) and ; (b) and ; (c) and ; (d) and .
Figure 1.
Proposal offers of a feeder and a seeker MNO depending upon values of and , i.e., and , and and . A case of agreement in a negotiation trade, where agreement price follows . (a) and ; (b) and ; (c) and ; (d) and .


Figure 2.
Proposal offers of a feeder and a seeker MNO depending upon values of and , i.e., and , and and . A case of no agreement in a negotiation trade. (a) and ; (b) and ; (c) and ; (d) and .
Figure 2.
Proposal offers of a feeder and a seeker MNO depending upon values of and , i.e., and , and and . A case of no agreement in a negotiation trade. (a) and ; (b) and ; (c) and ; (d) and .

Figure 3.
Revenues of the feeder and the seeker MNOs depending upon values of and , i.e., and , and and .
Figure 3.
Revenues of the feeder and the seeker MNOs depending upon values of and , i.e., and , and and .

Figure 4.
Before and after collaboration average per-user data rate of the feeder and the seeker MNOs.
Figure 4.
Before and after collaboration average per-user data rate of the feeder and the seeker MNOs.

Figure 5.
Before and after collaboration comparison of system capacity of the seeker MNO.

Figure 6.
Before and after collaboration comparison of system capacity of the feeder MNO.

Figure 7.
Comparison of average system capacities of the seeker MNO while standalone, shared, and in collaboration with the feeder MNO.
Figure 7.
Comparison of average system capacities of the seeker MNO while standalone, shared, and in collaboration with the feeder MNO.

Figure 8.
Comparison of initial revenues with revenues obtained from sharing network resources of the feeder and the seeker MNOs.
Figure 8.
Comparison of initial revenues with revenues obtained from sharing network resources of the feeder and the seeker MNOs.

Figure 9.
Average system capacities comparison of the seeker MNO before and after collaboration. (a) and ; (b) and .
Figure 9.
Average system capacities comparison of the seeker MNO before and after collaboration. (a) and ; (b) and .

© 2019 by the authors. Licensee MDPI, Basel, Switzerland. This article is an open access article distributed under the terms and conditions of the Creative Commons Attribution (CC BY) license (http://creativecommons.org/licenses/by/4.0/).
Share and Cite
MDPI and ACS Style
Shah, S.; Kittipiyakul, S.; Lim, Y.; Tan, Y. Collaborative Resource Management for Negotiable Multi-Operator Small Cell Networks. Sensors 2019, 19, 3550. https://doi.org/10.3390/s19163550
AMA Style
Shah S, Kittipiyakul S, Lim Y, Tan Y. Collaborative Resource Management for Negotiable Multi-Operator Small Cell Networks. Sensors. 2019; 19(16):3550. https://doi.org/10.3390/s19163550
Chicago/Turabian StyleShah, Shashi, Somsak Kittipiyakul, Yuto Lim, and Yasuo Tan. 2019. "Collaborative Resource Management for Negotiable Multi-Operator Small Cell Networks" Sensors 19, no. 16: 3550. https://doi.org/10.3390/s19163550
Note that from the first issue of 2016, this journal uses article numbers instead of page numbers. See further details here.