Short-Term Energy Demand Forecast in Hotels Using Hybrid Intelligent Modeling †

 ,
,  , ,
, ,  , ,
, ,  and
and
Abstract
:1. Introduction
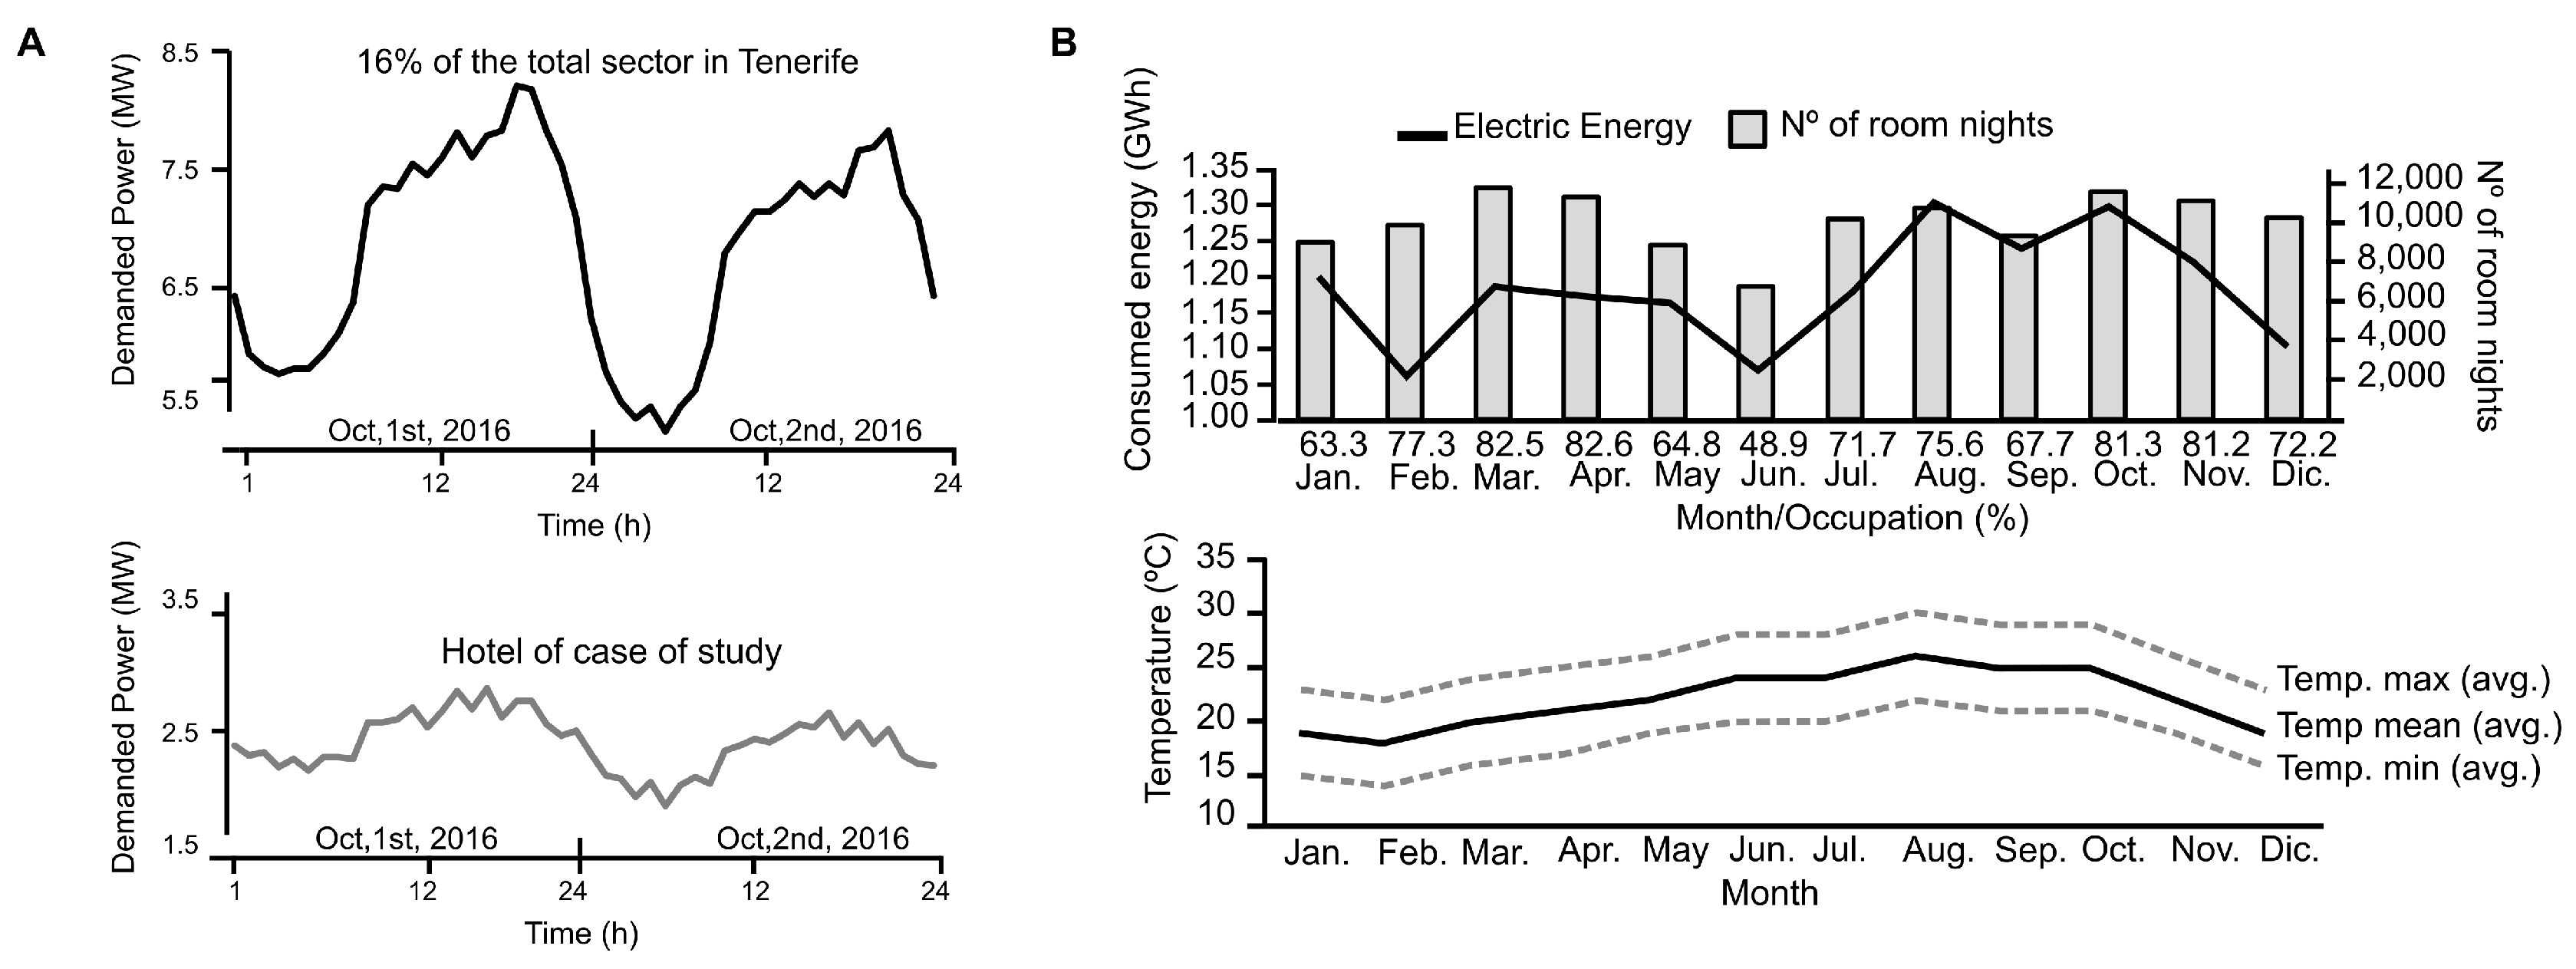
2. Energy Management in the Hotel Industry
3. Methods
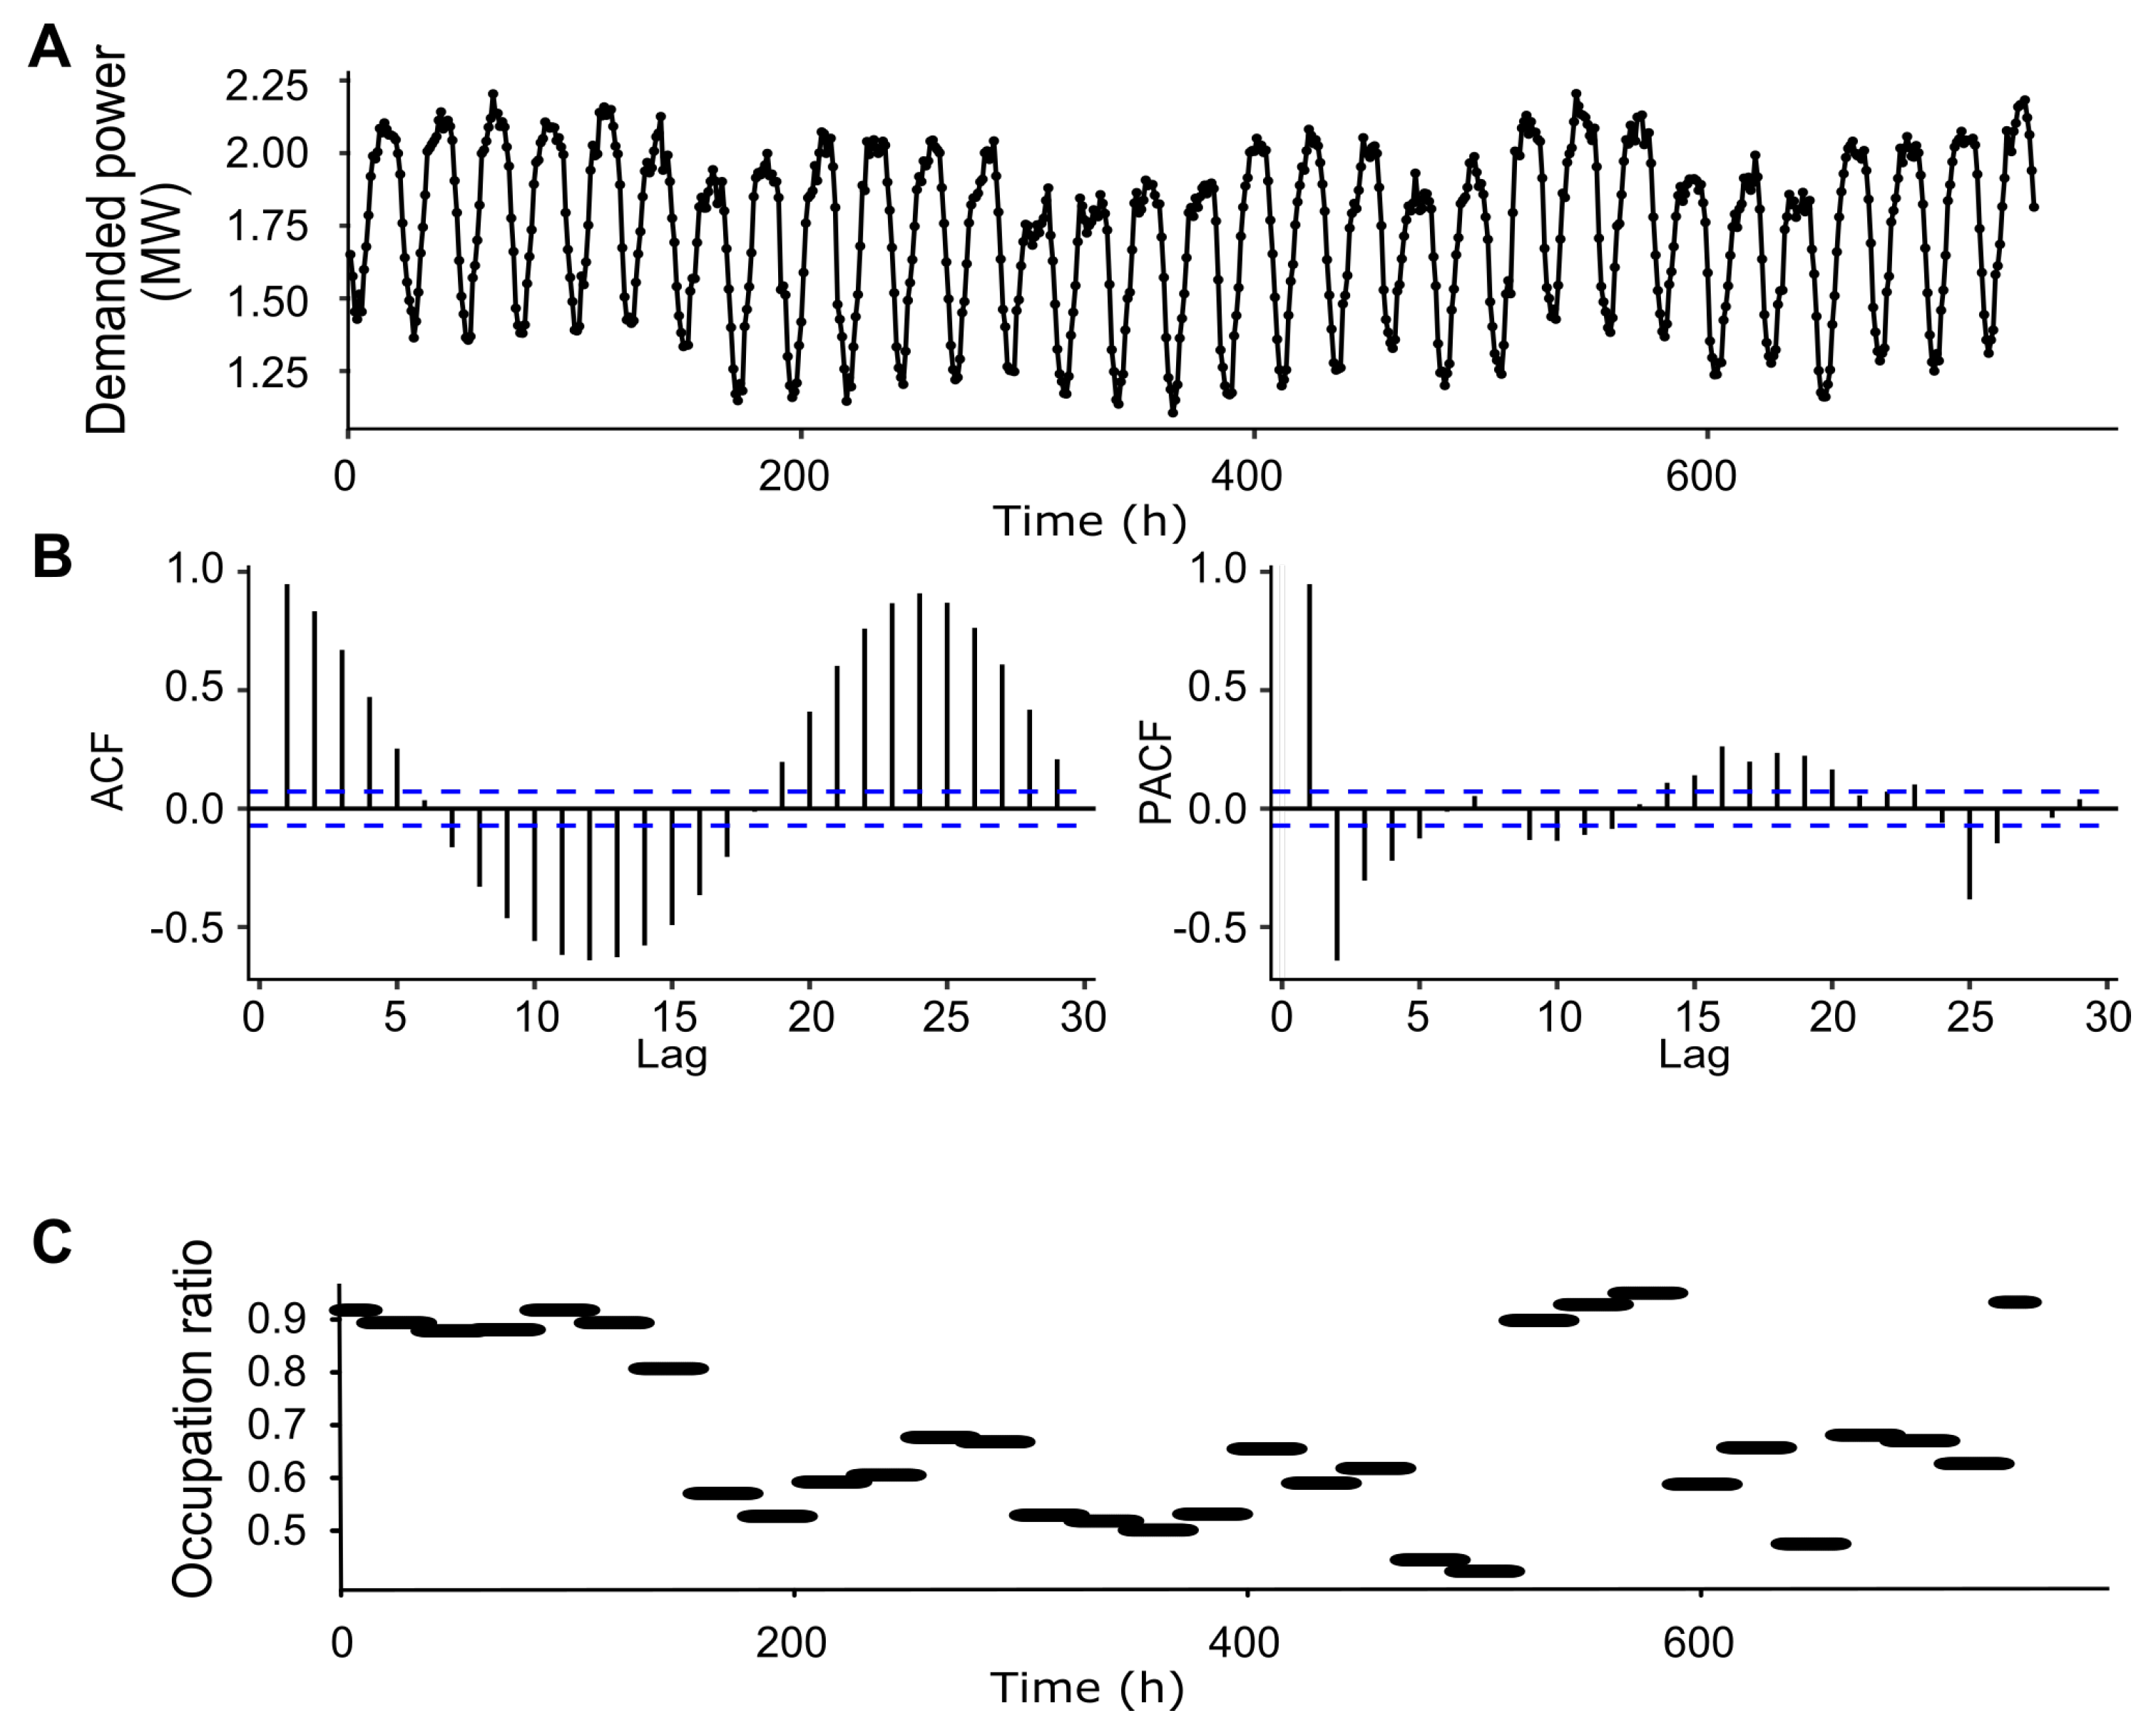
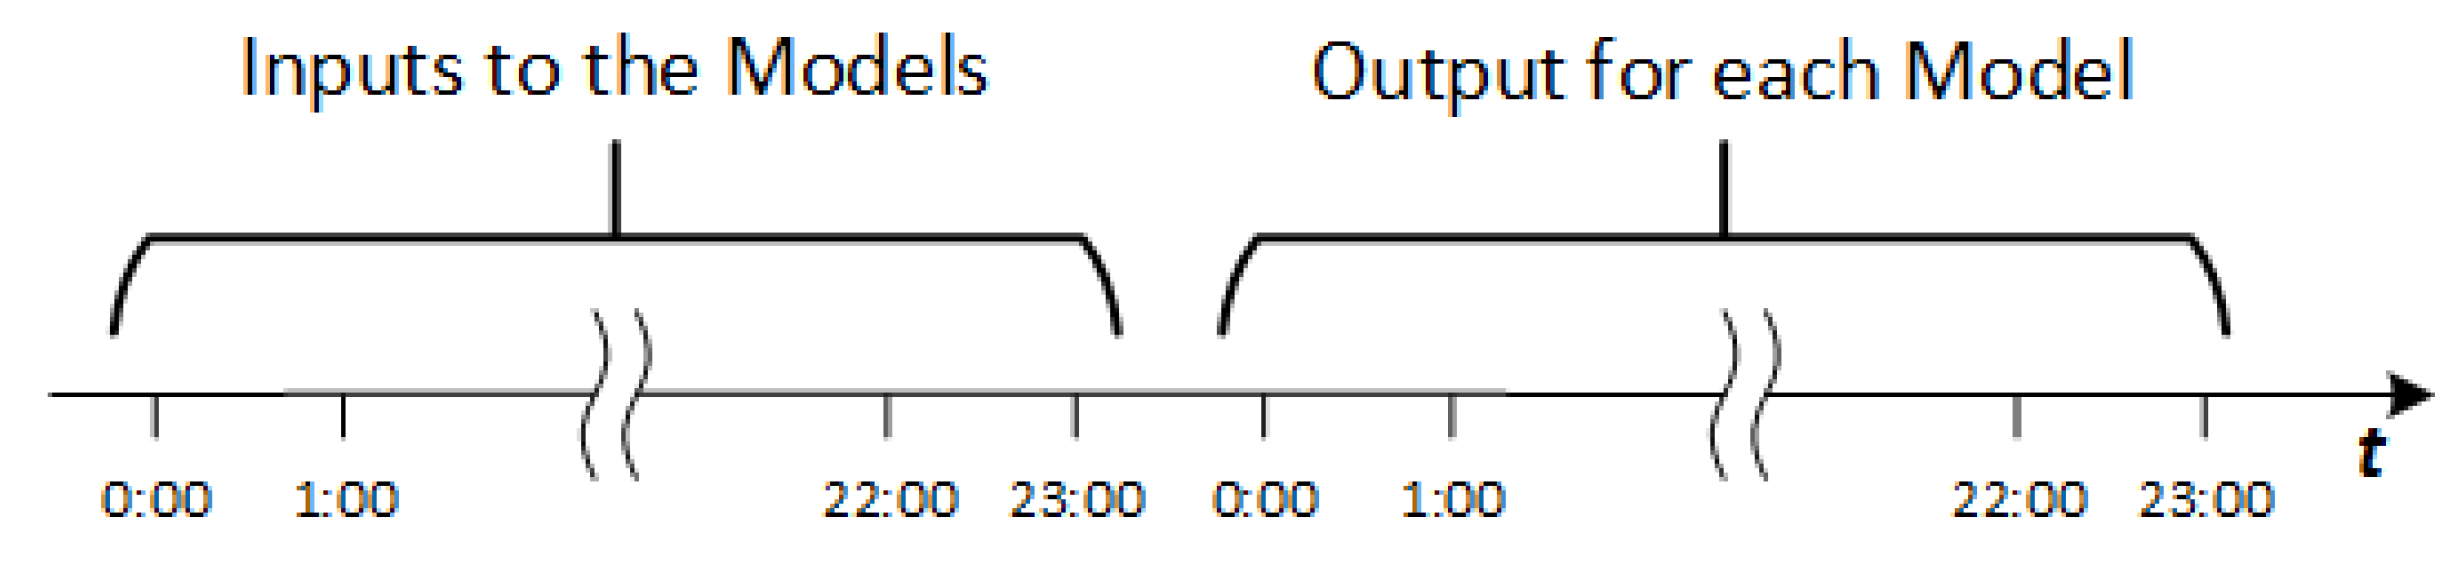
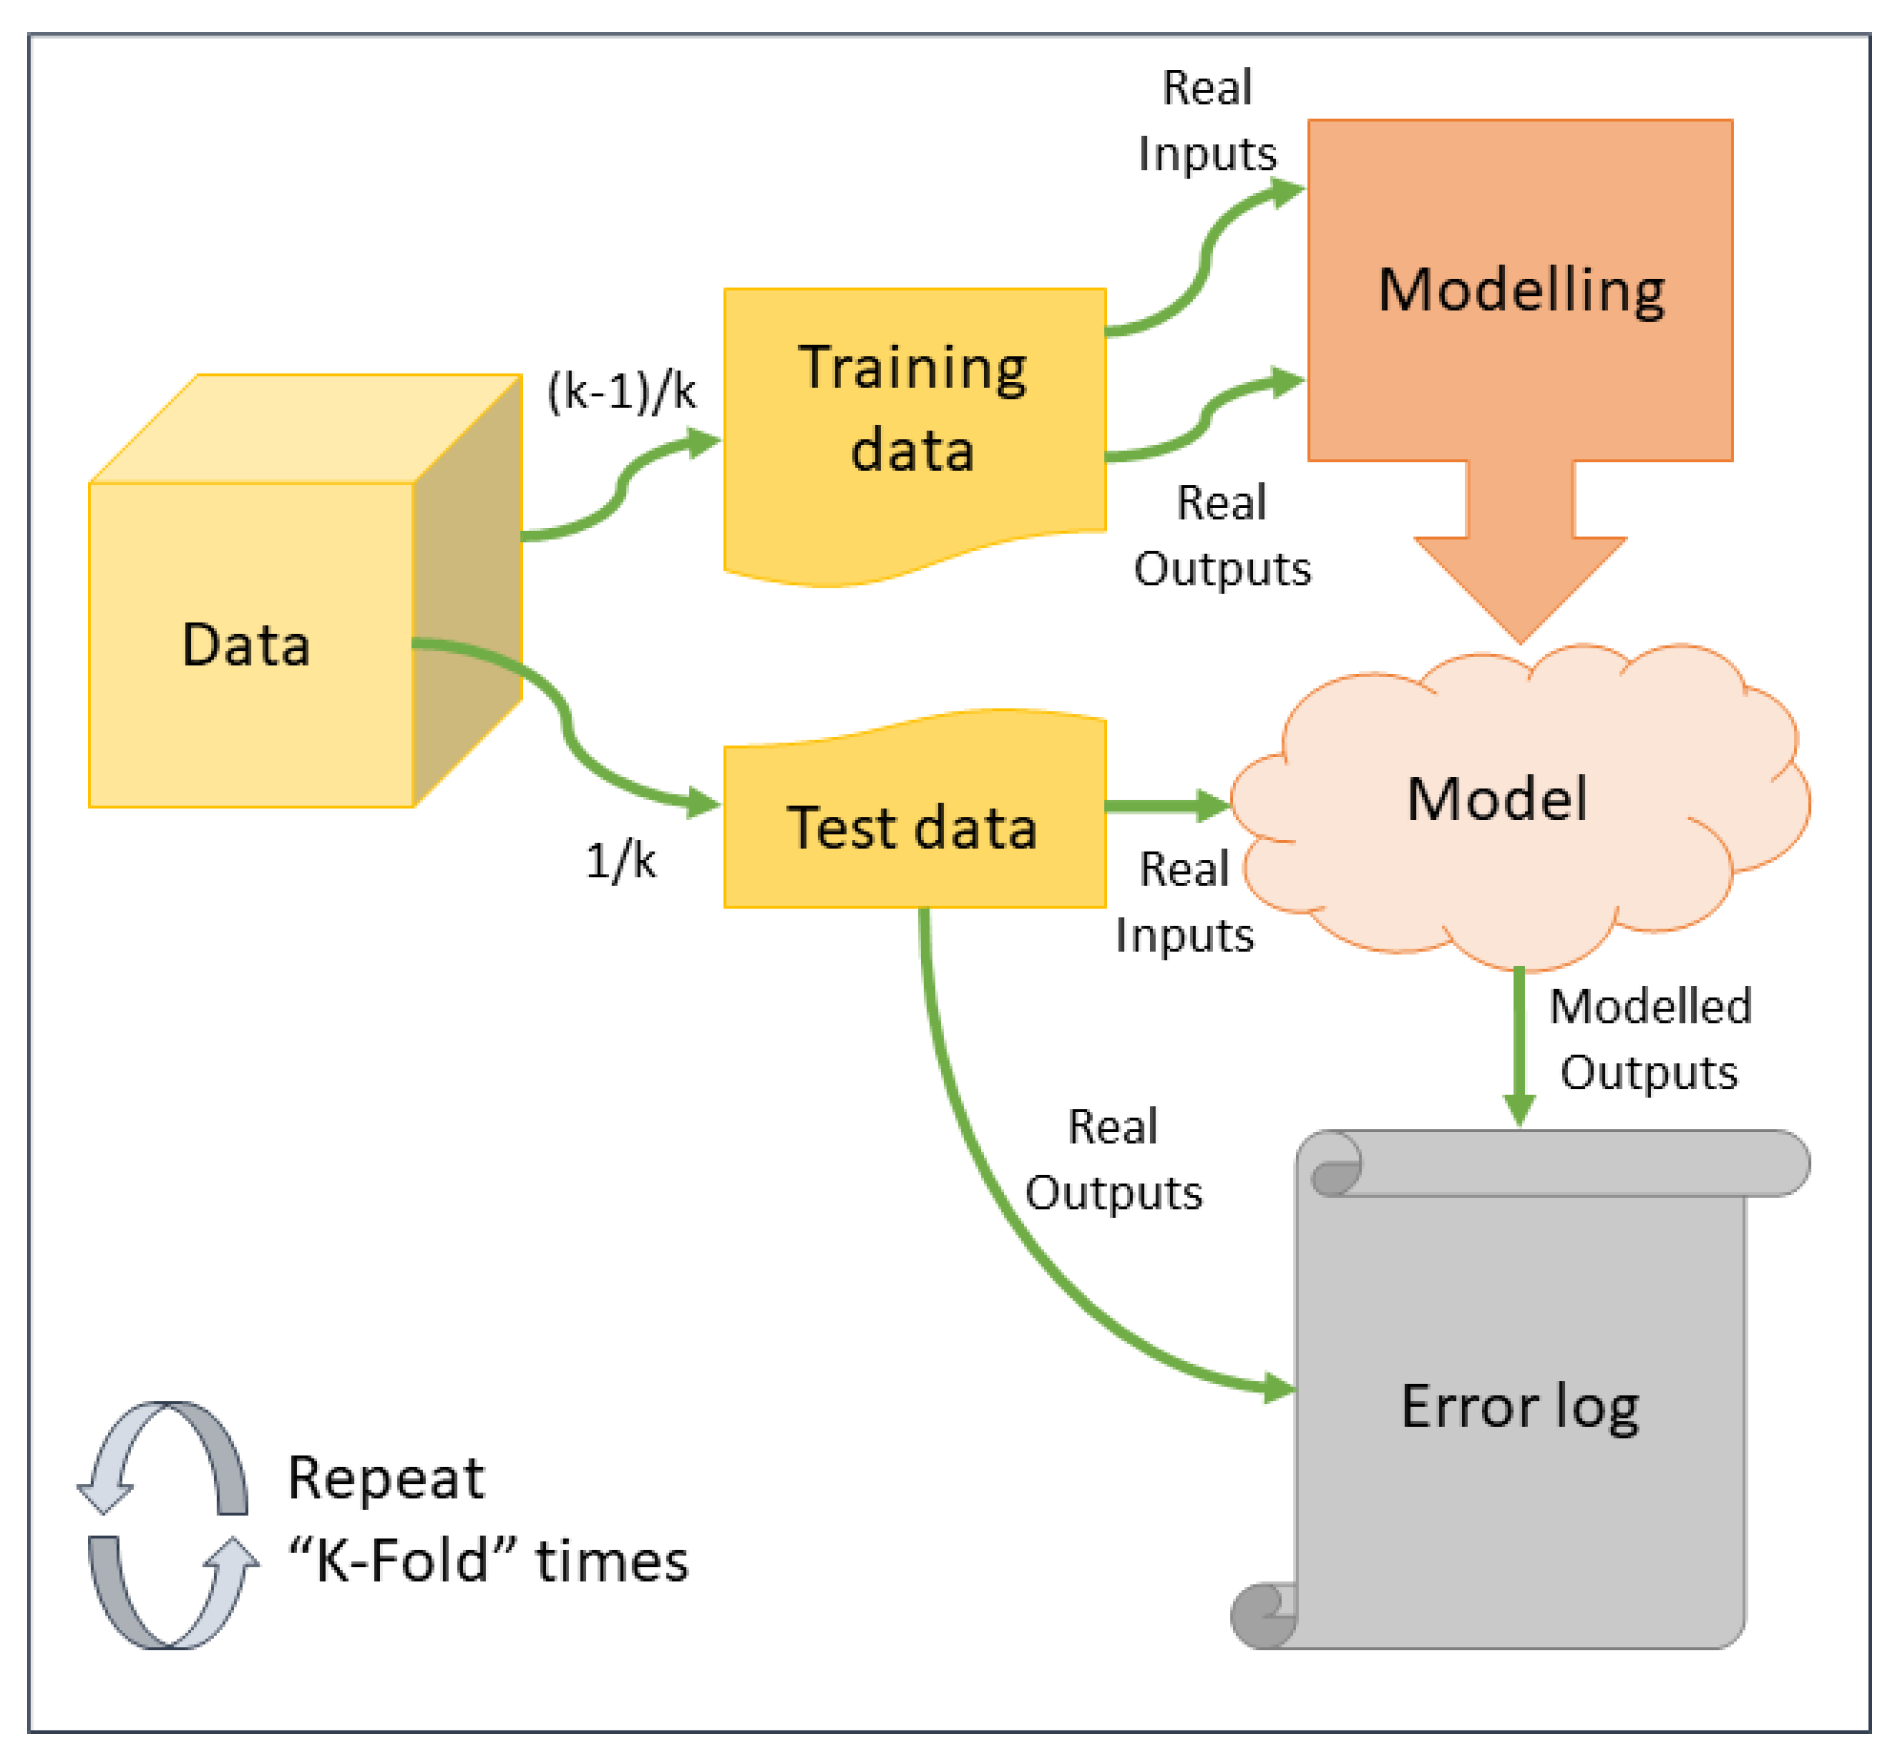
3.1. Data
3.2. ARIMAX Modeling
3.3. Bagged Decision Trees Modeling
- Root node: this node has no incoming edges and several (or zero) outgoing edges.
- Internal node: characterized by one incoming edge and two or more outgoing edges.
- Leaf: it has one incoming edge and no outgoing edges.
3.4. Hybrid Intelligent Modeling
3.4.1. K-Means Clustering Algorithm
- Determine the cluster for each sample data based on the distance to the centroids. The cluster assigned should be the closest one to the sample.
- Calculate new centroids as the center of the clusters, taking into account all the samples per cluster.
3.4.2. Multi-Layer Perceptron
- is the inputs vector
- k is the hidden layers number
- is a bounded transfer function
- is the model parameter vector
- is the parameter vector for the hidden unit i
3.4.3. Support Vector Machines for Regression
- is a vector of n ones
- T means transpose of a matrix or vector
- a weight vector
- b regression vector
- is the model offset
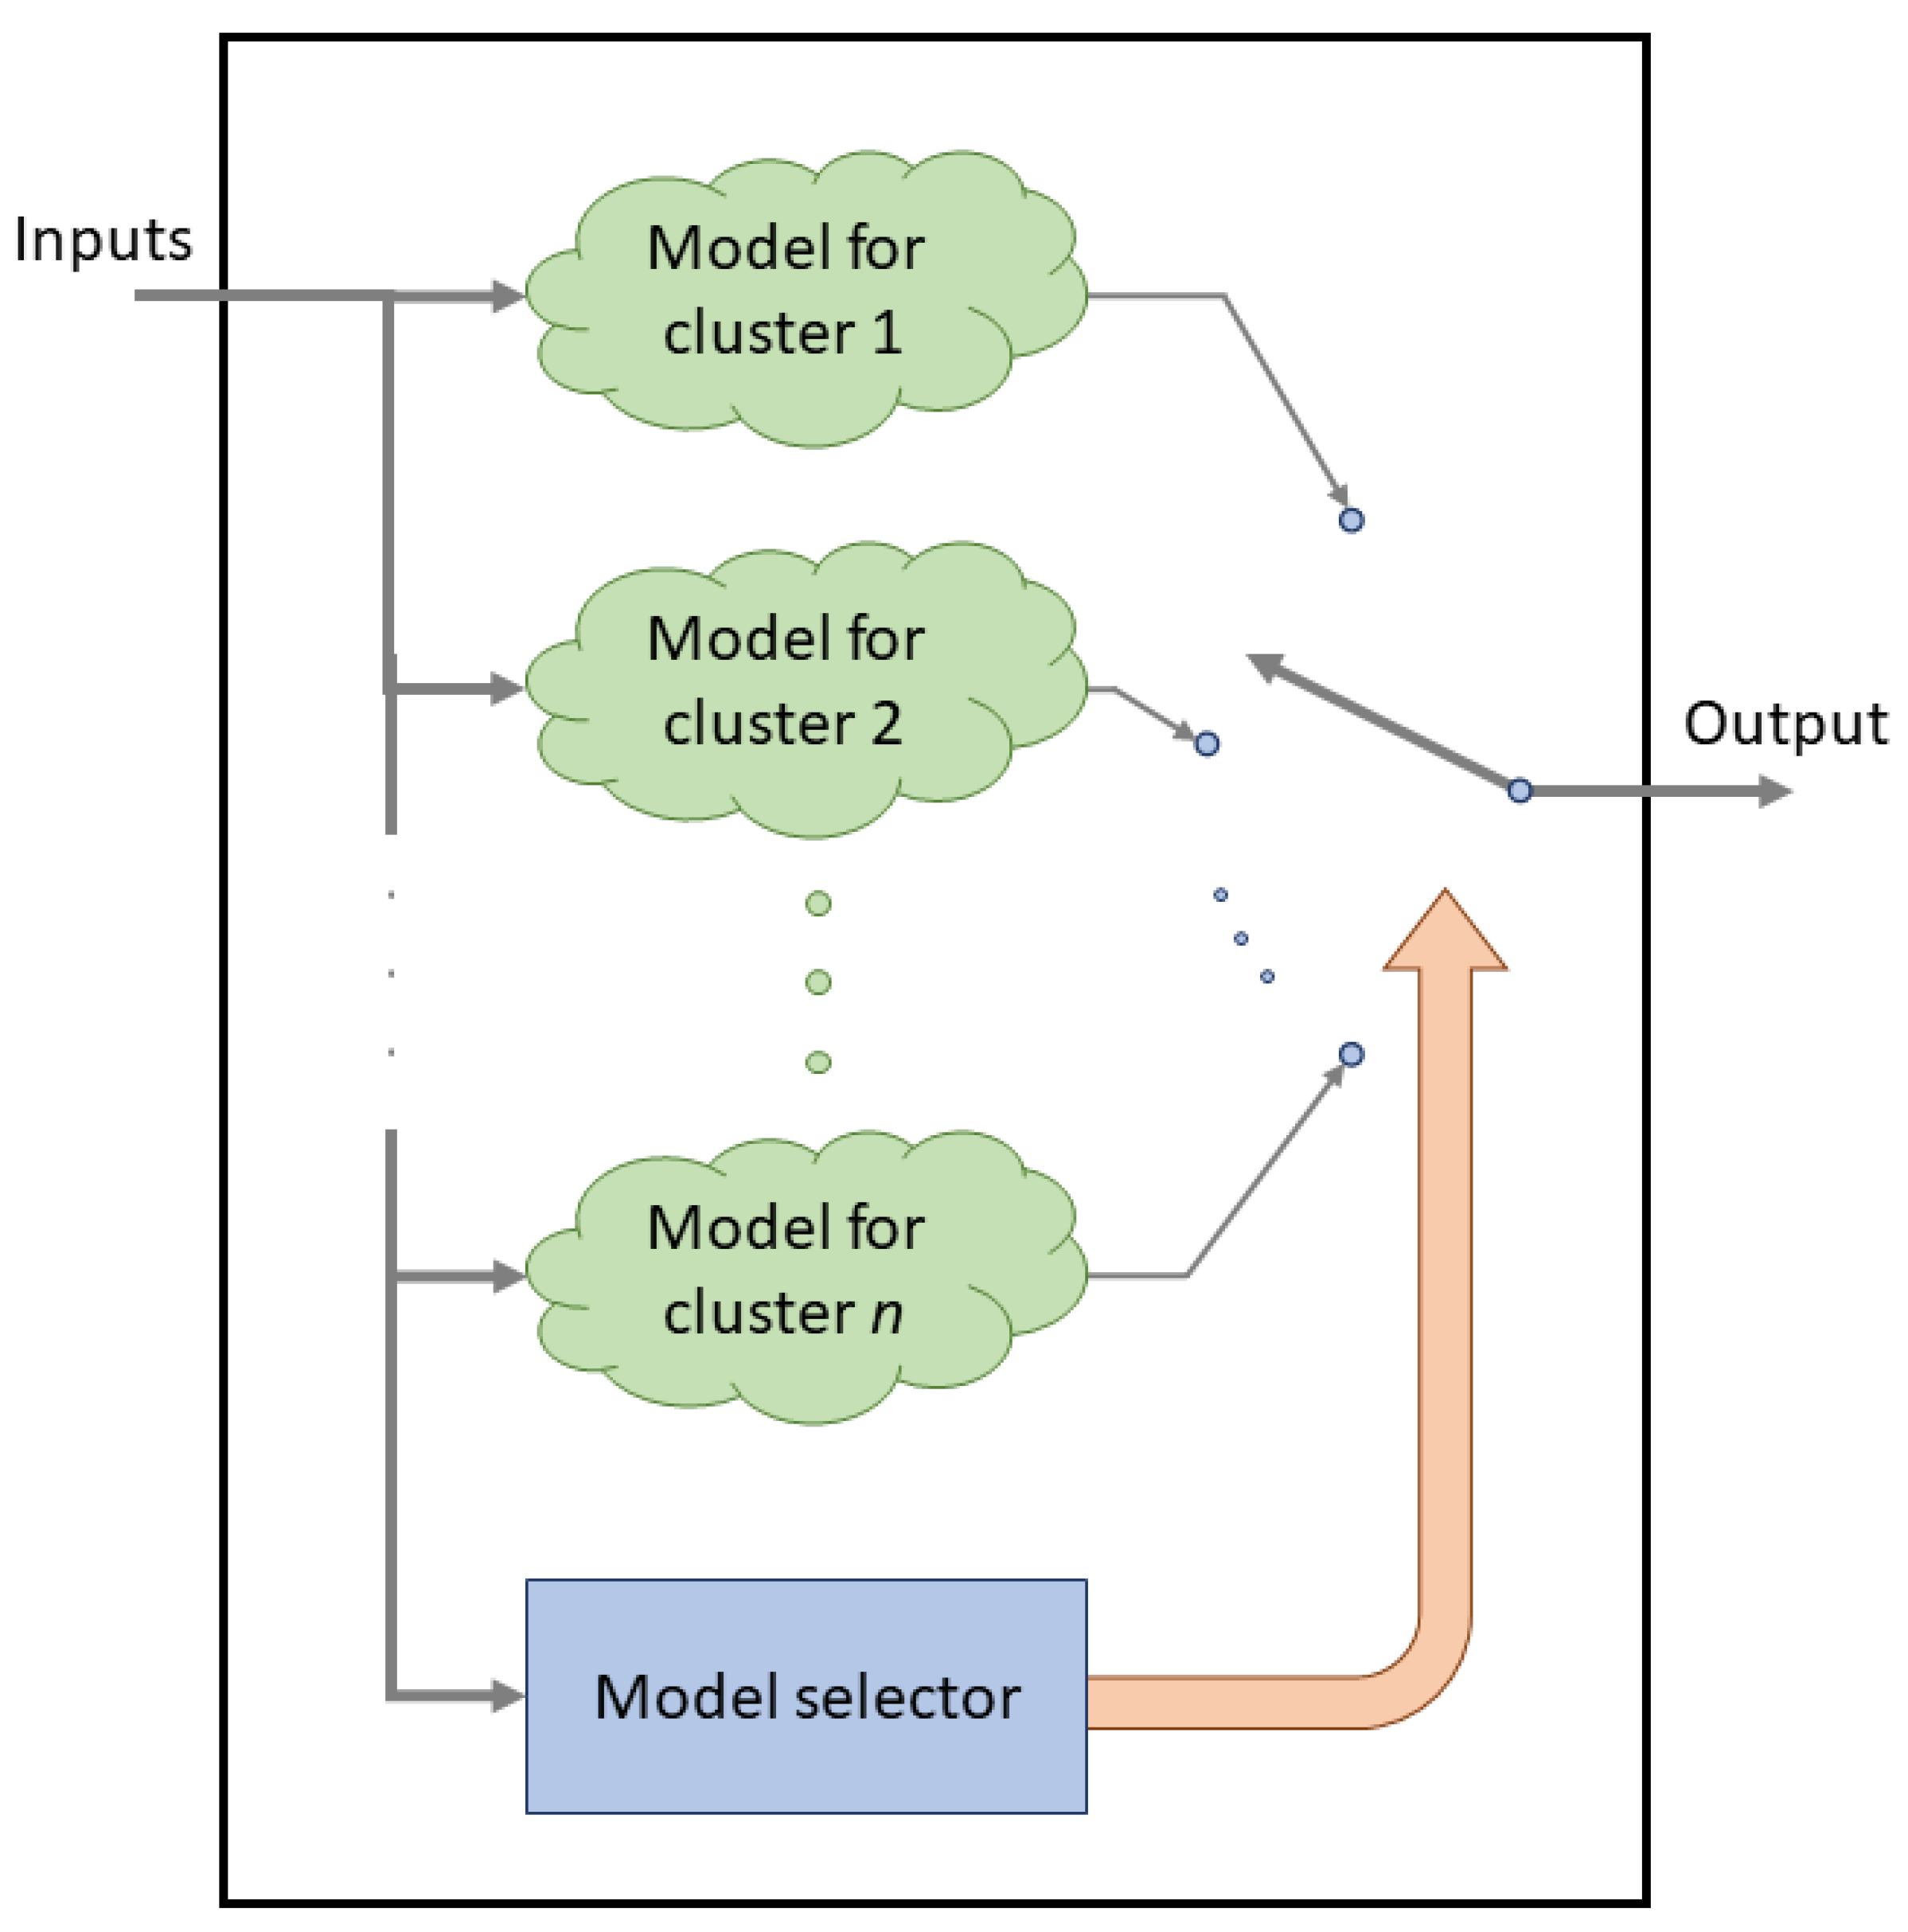
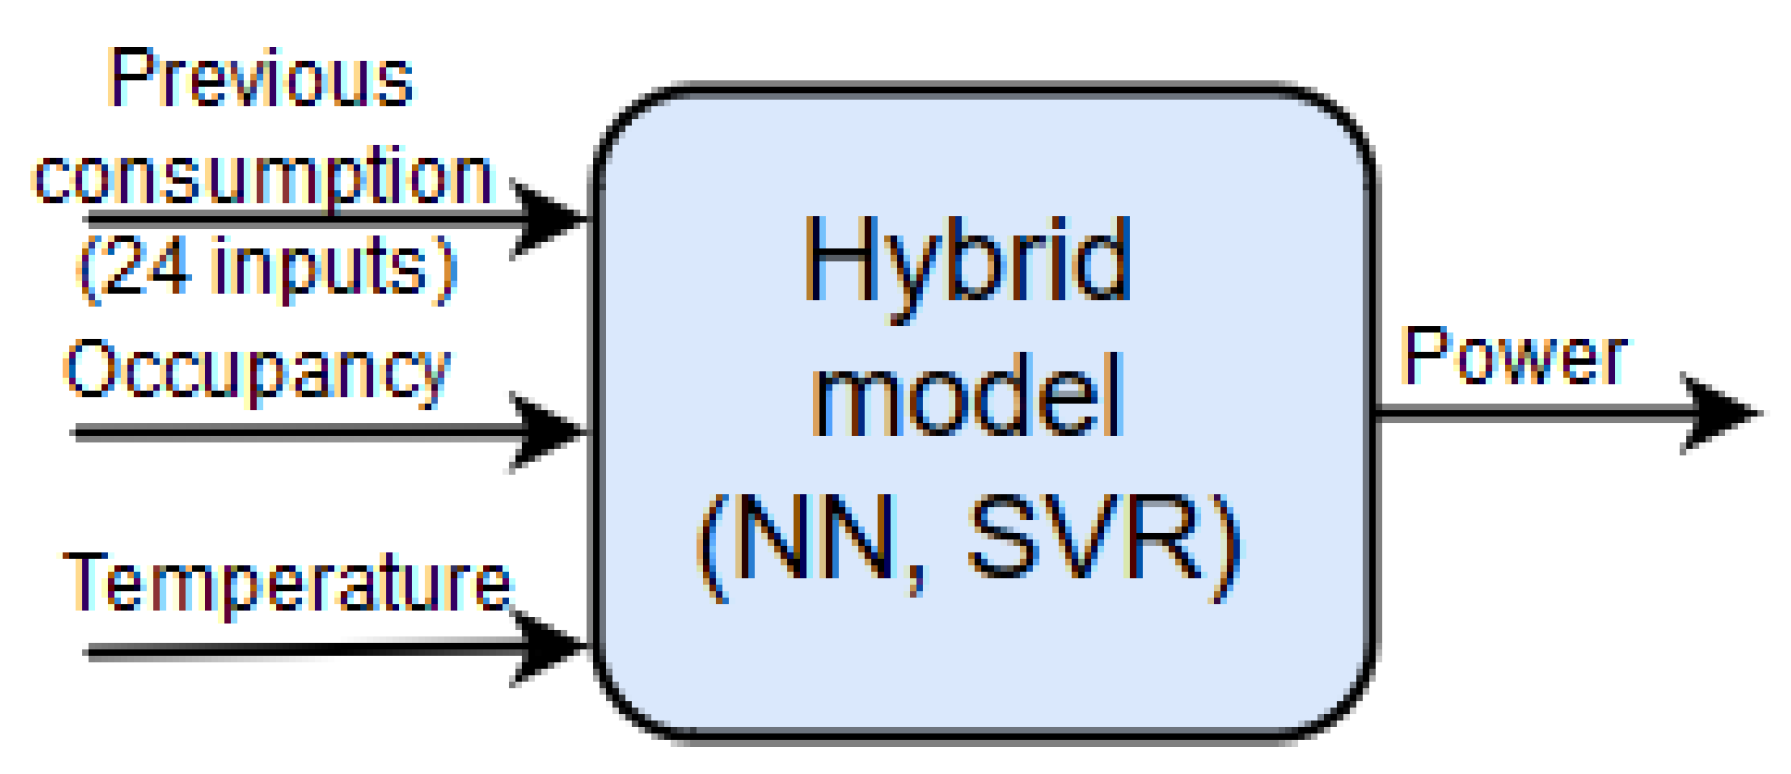
4. An Intelligent Model for Power Demand
- Clustering training. This phase is the same for all the hybrid models, as they share the same inputs.
- Regression training. For each cluster, two different regression algorithms (MLP and SVR) were evaluated. In the case of ANN, different internal configurations were considered.
- Performance calculation. As the number of clusters for each model is not a predefined, it is necessary to calculate the best cluster assignment based on the achieved error.
4.1. Clustering Training
4.2. Regression Training
4.3. Hybrid Model Performance Calculation
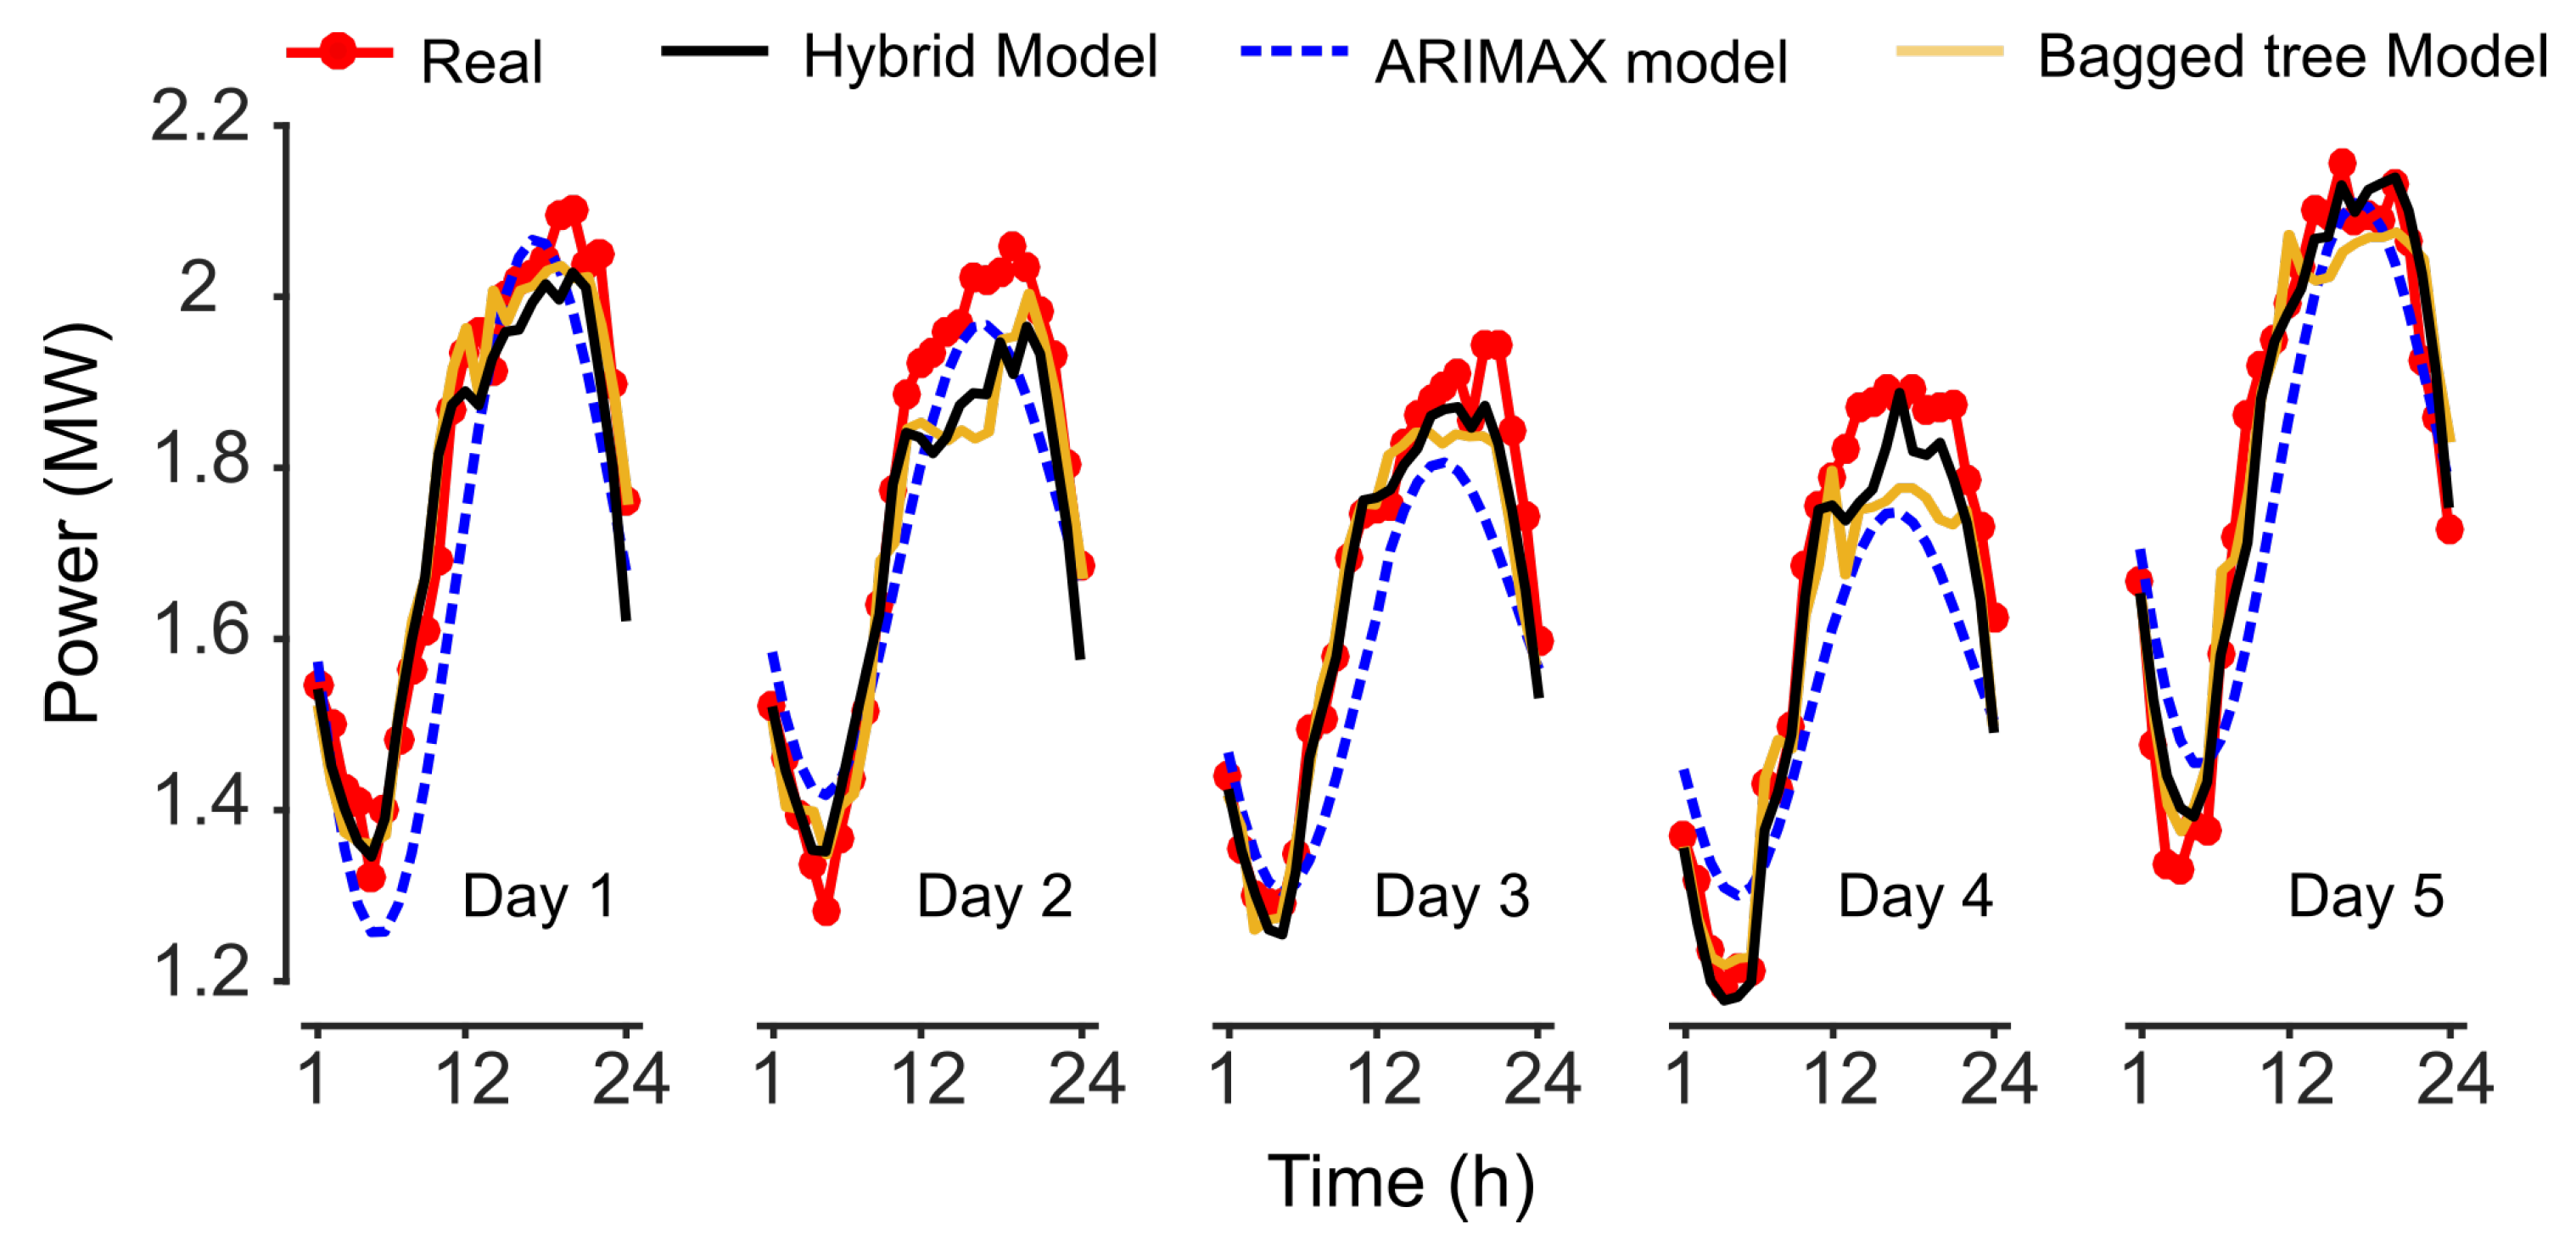
5. Results and Discussion
6. Conclusions
Author Contributions
Funding
Conflicts of Interest
References
- Pieri, S.P.; Tzouvadakis, I.; Santamouris, M. Identifying energy consumption patterns in the Attica hotel sector using cluster analysis techniques with the aim of reducing hotels’ CO2 footprint. Energy Build. 2015, 94, 252–262. [Google Scholar] [CrossRef]
- Dalton, G.J.; Lockington, D.A.; Baldock, T.E. Feasibility analysis of renewable energy supply options for a grid-connected large hotel. Renew. Energy 2009, 34, 955–964. [Google Scholar] [CrossRef]
- Deng, S.M.; Burnett, J. Study of energy performance of hotel buildings in Hong Kong. Energy Build. 2000, 31, 7–12. [Google Scholar] [CrossRef]
- Papamarcou, M.; Kalogirou, S. Financial appraisal of a combined heat and power system for a hotel in Cyprus. Energy Convers. Manag. 2001, 42, 689–708. [Google Scholar] [CrossRef]
- Priyadarsini, R.; Xuchao, W.; Eang, L.S. A study on energy performance of hotel buildings in Singapore. Energy Build. 2009, 41, 1319–1324. [Google Scholar] [CrossRef]
- Cabello Eras, J.; Sousa Santos, V.; Sagastume Gutiérrez, A.; Guerra Plasencia, M.; Haeseldonckx, D.; Vandecasteele, C. Tools to improve forecasting and control of the electricity consumption in hotels. J. Clean. Prod. 2016, 137, 803–812. [Google Scholar] [CrossRef]
- Hilton Worldwide. Energy. 2018. Available online: http://cr.hiltonworldwide.com/download/Hilton{_}CRReport{_}Energy.pdf (accessed on 1 September 2018).
- Atique, S.; Noureen, S.; Roy, V.; Subburaj, V.; Bayne, S.; Macfie, J. Forecasting of total daily solar energy generation using ARIMA: A case study. In Proceedings of the 2019 IEEE 9th Annual Computing and Communication Workshop and Conference (CCWC), Las Vegas, NV, USA, 7–9 January 2019; pp. 114–119. [Google Scholar] [CrossRef]
- Mat Daut, M.A.; Hassan, M.Y.; Abdullah, H.; Rahman, H.A.; Abdullah, M.P.; Hussin, F. Building electrical energy consumption forecasting analysis using conventional and artificial intelligence methods: A review. Renew. Sustain. Energy Rev. 2017, 70, 1108–1118. [Google Scholar] [CrossRef]
- Nguyen, H.; Hansen, C.K. Short-term electricity load forecasting with Time Series Analysis. In Proceedings of the 2017 IEEE International Conference on Prognostics and Health Management (ICPHM), Dallas, TX, USA, 19–21 June 2017; pp. 214–221. [Google Scholar] [CrossRef]
- Suganthi, L.; Samuel, A.A. Energy models for demand forecasting: A review. Renew. Sustain. Energy Rev. 2012, 16, 1223–1240. [Google Scholar] [CrossRef]
- Singh, A.K.; Khatoon, S. An Overview of Electricity Demand Forecasting Techniques. Netw. Complex Syst. 2013, 3, 38–48. [Google Scholar]
- Shao, Z.; Chao, F.; Yang, S.L.; Zhou, K.L. A review of the decomposition methodology for extracting and identifying the fluctuation characteristics in electricity demand forecasting. Renew. Sustain. Energy Rev. 2017, 75, 123–136. [Google Scholar] [CrossRef]
- Khosravani, H.; Castilla, M.; Berenguel, M.; Ruano, A.; Ferreira, P. A Comparison of Energy Consumption Prediction Models Based on Neural Networks of a Bioclimatic Building. Energies 2016, 9, 57. [Google Scholar] [CrossRef]
- Torres, J.M.; Aguilar, R.; Aguilar, R.M.; Zúñiga, K.V. Deep Learning to Predict the Generation of a Wind Farm. J. Renew. Sustain. Energy 2018, 10, 013305. [Google Scholar] [CrossRef]
- Jove, E.; Gonzalez-Cava, J.M.; Casteleiro-Roca, J.L.; Pérez, J.A.M.; Calvo-Rolle, J.L.; de Cos Juez, F.J. An intelligent model to predict ANI in patients undergoing general anesthesia. In Proceedings of the International Joint Conference SOCO’17-CISIS’17-ICEUTE’17, León, Spain, 6–8 September 2017; pp. 492–501. [Google Scholar]
- Jove, E.; Gonzalez-Cava, J.M.; Casteleiro-Roca, J.L.; Méndez-Pérez, J.A.; Antonio Reboso-Morales, J.; Javier Pérez-Castelo, F.; Javier de Cos Juez, F.; Luis Calvo-Rolle, J. Modelling the hypnotic patient response in general anaesthesia using intelligent models. Log. J. IGPL 2018, 27, 189–201. [Google Scholar] [CrossRef]
- Casteleiro-Roca, J.L.; Jove, E.; Gonzalez-Cava, J.M.; Pérez, J.A.M.; Calvo-Rolle, J.L.; Alvarez, F.B. Hybrid model for the ANI index prediction using Remifentanil drug and EMG signal. In Neural Computing and Applications; Springer: Berlin/Heidelberg, Germany, 2018; pp. 1–10. [Google Scholar]
- Jove, E.; Casteleiro-Roca, J.L.; Quintián, H.; Méndez-Pérez, J.A.; Calvo-Rolle, J.L. A fault detection system based on unsupervised techniques for industrial control loops. In Expert Systems; John Wiley & Sons, Ltd.: Hoboken, NJ, USA, 2019; p. e12395. [Google Scholar]
- Neto, A.H.; Fiorelli, F.A.S. Comparison between detailed model simulation and artificial neural network for forecasting building energy consumption. Energy Build. 2008, 40, 2169–2176. [Google Scholar] [CrossRef]
- Muralitharan, K.; Sakthivel, R.; Vishnuvarthan, R. Neural network based optimization approach for energy demand prediction in smart grid. Neurocomputing 2018, 273, 199–208. [Google Scholar] [CrossRef]
- Zúñiga, K.V.; Castilla, I.; Aguilar, R.M. Using fuzzy logic to model the behavior of residential electrical utility customers. Appl. Energy 2014, 115, 384–393. [Google Scholar] [CrossRef]
- Abreu, T.; Alves, U.N.; Minussi, C.R.; Lotufo, A.D.P.; Lopes, M.L.M. Residential electric load curve profile based on fuzzy systems. In Proceedings of the 2015 IEEE PES Innovative Smart Grid Technologies Latin America (ISGT LATAM), Montevideo, Uruguay, 5–7 October 2015; pp. 591–596. [Google Scholar] [CrossRef]
- Bedi, J.; Toshniwal, D. Deep learning framework to forecast electricity demand. Appl. Energy 2019, 238, 1312–1326. [Google Scholar] [CrossRef]
- Wasseem Ahmad, M.; Mourad, A.; Rezgui, Y.; Mourshed, M. Deep Highway Networks and Tree-Based Building Energy Consumption. Energies 2019, 11, 3408. [Google Scholar] [CrossRef]
- Chen, Y.; Tan, H. Short-term prediction of electric demand in building sector via hybrid support vector regression. Appl. Energy 2017, 204, 1363–1374. [Google Scholar] [CrossRef]
- Seyedzadeh, S.; Rahimian, F.P.; Glesk, I.; Roper, M. Machine learning for estimation of building energy consumption and performance: A review. Vis. Eng. 2018, 6, 5. [Google Scholar] [CrossRef]
- Jove, E.; Blanco-Rodríguez, P.; Casteleiro-Roca, J.L.; Moreno-Arboleda, J.; López-Vázquez, J.A.; de Cos Juez, F.J.; Calvo-Rolle, J.L. Attempts prediction by missing data imputation in engineering degree. In Proceedings of the International Joint Conference SOCO’17-CISIS’17-ICEUTE’17, León, Spain, 6–8 September 2017; Springer: Cham, Switerland, 2017; pp. 167–176. [Google Scholar]
- Gonzalez-Cava, J.M.; Reboso, J.A.; Casteleiro-Roca, J.L.; Calvo-Rolle, J.L.; Méndez Pérez, J.A. A novel fuzzy algorithm to introduce new variables in the drug supply decision-making process in medicine. Complexity 2018, 2018, 9012720. [Google Scholar] [CrossRef]
- Casteleiro-Roca, J.L.; Barragán, A.J.; Segura, F.; Calvo-Rolle, J.L.; Andújar, J.M. Fuel Cell Output Current Prediction with a Hybrid Intelligent System. Complexity 2019, 2019, 6317270. [Google Scholar] [CrossRef]
- Casteleiro-Roca, J.L.; Perez, J.A.M.; Piñón-Pazos, A.J.; Calvo-Rolle, J.L.; Corchado, E. Intelligent Model for Electromyogram (EMG) Signal Prediction During Anesthesia. J. Mult. Valued Log. Soft Comput. 2019, 32, 205–220. [Google Scholar]
- Olatomiwa, L.; Mekhilef, S.; Ismail, M.; Moghavvemi, M. Energy management strategies in hybrid renewable energy systems: A review. Renew. Sustain. Energy Rev. 2016, 62, 821–835. [Google Scholar] [CrossRef]
- Comodi, G.; Renzi, M.; Cioccolanti, L.; Caresana, F.; Pelagalli, L. Hybrid system with micro gas turbine and PV (photovoltaic) plant: Guidelines for sizing and management strategies. Energy 2015, 89, 226–235. [Google Scholar] [CrossRef]
- Serale, G.; Fiorentini, M.; Capozzoli, A.; Bernardini, D.; Bemporad, A. Model Predictive Control (MPC) for Enhancing Building and HVAC System Energy Efficiency: Problem Formulation, Applications and Opportunities. Energies 2018, 11, 631. [Google Scholar] [CrossRef]
- Jo, H.; Yoon, Y. Intelligent smart home energy efficiency model using artificial TensorFlow engine. Hum.-Centric Comput. Inf. Sci. 2018, 8, 9. [Google Scholar] [CrossRef]
- Ruban, A.A.M.; Rajasekaran, G.M.; Pasupathi, T.; Rajeswari, N. A fuzzy-logic based management system in smart-microgrid for residential applications. In Proceedings of the 2016 International Conference on Emerging Trends in Engineering, Technology and Science (ICETETS), Pudukkottai, India, 24–26 February 2016; pp. 1–7. [Google Scholar] [CrossRef]
- Mardani, A.; Zavadskas, E.; Streimikiene, D.; Jusoh, A.; Nor, K.; Khoshnoudi, M. Using fuzzy multiple criteria decision making approaches for evaluating energy saving technologies and solutions in five star hotels: A new hierarchical framework. Energy 2016, 117, 131–148. [Google Scholar] [CrossRef]
- Acosta, A.; González, A.; Zamarreño, J.; Álvarez, V. Energy savings and guaranteed thermal comfort in hotel rooms through nonlinear model predictive controllers. Energy Build. 2016, 129, 59–68. [Google Scholar] [CrossRef]
- Vega Lara, B.; Castellanos Molina, L.; Monteagudo Yanes, J.; Rodríguez Borroto, M. Offset-free model predictive control for an energy efficient tropical island hotel. Energy Build. 2016, 119, 283–292. [Google Scholar] [CrossRef]
- Riverón, I.; Gómez, J.F.; González, B.; Méndez, J.A. An intelligent strategy for hybrid energy system management. Renew. Energy Power Qual. J. 2019, 17, 5. [Google Scholar]
- EXCELTUR. EXCELTUR, Alliance for Excellency in Tourism. 2017. Available online: http://www.exceltur.org/exceltur-in-english/ (accessed on 1 September 2018).
- Fuller, W.A. Introduction to Statistical Time Series; Wiley: Hoboken, NJ, USA, 1996; p. 698. [Google Scholar]
- Hyndman, R. Auto.Arima Function from Forescast v8.6 | R Documentation. Available online: https://otexts.com/fpp2/arima-r.html (accessed on 5 May 2019).
- Hyndman, R.J.; Khandakar, Y. Automatic Time Series Forecasting: The forecast Package for R. J. Stat. Softw. 2008, 27, 1–22. [Google Scholar] [CrossRef]
- Wang, X.; Smith, K.; Hyndman, R. Characteristic-Based Clustering for Time Series Data. Data Min. Knowl. Discov. 2006, 13, 335–364. [Google Scholar] [CrossRef]
- Wei-Yin, L. Classification and regression trees. Wiley Interdiscip. Rev. Data Min. Knowl. Discov. 2011, 1, 1–17. [Google Scholar] [CrossRef]
- Breiman, L. Bagging Predictors: Technical Report No. 421; Department of Statistics University of California: Berkeley, CA, USA, 1994; p. 19. [Google Scholar]
- Qin, A.; Suganthan, P. Enhanced neural gas network for prototype-based clustering. Pattern Recogn. 2005, 38, 1275–1288. [Google Scholar] [CrossRef]
- Kaski, S.; Sinkkonen, J.; Klami, A. Discriminative clustering. Neurocomputing 2005, 69, 18–41. [Google Scholar] [CrossRef] [Green Version]
- Wasserman, P. Advanced Methods in Neural Computing; John Wiley & Sons, Inc.: New York, NY, USA, 1993. [Google Scholar]
- Zeng, Z.; Wang, J. Advances in Neural Network Research and Applications; Springer: Berlin/Heidelberg, Germany, 2010. [Google Scholar]
- Osborn, J.; Guzman, D.; de Cos Juez, F.J.; Basden, A.G.; Morris, T.J.; Gendron, E.; Butterley, T.; Myers, R.M.; Guesalaga, A.; Sanchez Lasheras, F.; et al. Open-loop tomography with artificial neural networks on CANARY: on-sky results. Mon. Not. R. Astron. Soc. 2014, 441, 2508–2514. [Google Scholar] [CrossRef] [Green Version]
- Rynkiewicz, J. General bound of overfitting for MLP regression models. Neurocomputing 2012, 90, 106–110. [Google Scholar] [CrossRef] [Green Version]
- Cristianini, N.; Shawe-Taylor, J. An Introduction to Support Vector Machines and Other kernel-Based Learning Methods; Cambridge University Press: New York, NY, USA, 2000. [Google Scholar]
- Vilán Vilán, J.A.; Alonso Fernández, J.R.; García Nieto, P.J.; Sánchez Lasheras, F.; de Cos Juez, F.J.; Díaz Muñiz, C. Support Vector Machines and Multilayer Perceptron Networks Used to Evaluate the Cyanotoxins Presence from Experimental Cyanobacteria Concentrations in the Trasona Reservoir (Northern Spain). Water Resour. Manag. 2013, 27, 3457–3476. [Google Scholar] [CrossRef]
- Wang, R.; Wang, A.; Song, Q. Research on the alkalinity of sintering process based on LS-SVM Algorithms. In Advances in Computer Science and Information Engineering; Springer: Berlin/Heidelberg, Germany, 2012; pp. 449–454. [Google Scholar] [CrossRef]
- Guo, Y.; Li, X.; Bai, G.; Ma, J. Time Series Prediction Method Based on LS-SVR with Modified Gaussian RBF. In Proceedings of the International Conference on Neural Information Processing, Lake Tahoe, NV, USA, 3–6 December 2012; pp. 9–17. [Google Scholar] [CrossRef]
- Wang, L.; Wu, J. Neural network ensemble model using PPR and LS-SVR for stock et eorecasting. In International Conference on Intelligent Computing; Springer: Berlin/Heidelberg, Germany, 2012; pp. 1–8. [Google Scholar]
- Steinwart, I.; Christmann, A. Support Vector Machines; Springer: Berlin/Heidelberg, Germany, 2008. [Google Scholar]
- Vapnik, V. The Nature of Statistical Learning Theory; Springer: Berlin/Heidelberg, Germany, 1995. [Google Scholar]


| ARIMAX | MAPE (%) | Box-Ljung Test, p-Value | |
|---|---|---|---|
| Day 1 (31 December) | ARIMAX(4,0,1) | 2.55 | 2.7 |
| Day 2 (3 January) | ARIMAX(4,0,1) | 2.51 | 1.2 |
| Day 3 (11 February) | ARIMAX(4,0,1) | 2.43 | 1.1 |
| Day 4 (1 August) | ARIMAX(4,0,1) | 3.22 | 9.5 |
| Day 5 (29 September) | ARIMAX(3,0,1) | 2.88 | 5.4 |
| Cl-1 | Cl-2 | Cl-3 | Cl-4 | Cl-5 | Cl-6 | Cl-7 | |
|---|---|---|---|---|---|---|---|
| Global | 354 | ||||||
| Hybrid 2 | 147 | 207 | |||||
| Hybrid 3 | 91 | 91 | 172 | ||||
| Hybrid 4 | 52 | 65 | 97 | 140 | |||
| Hybrid 5 | 40 | 43 | 65 | 87 | 119 | ||
| Hybrid 6 | 36 | 43 | 59 | 60 | 76 | 80 | |
| Hybrid 7 | 21 | 39 | 47 | 57 | 60 | 61 | 69 |
| Cl-1 | Cl-2 | Cl-3 | Cl-4 | Cl-5 | Cl-6 | Cl-7 | |
|---|---|---|---|---|---|---|---|
| Global | LS-SVR | ||||||
| Hybrid 2 | LS-SVR | LS-SVR | |||||
| Hybrid 3 | MLP-11 | LS-SVR | LS-SVR | ||||
| Hybrid 4 | MLP-15 | LS-SVR | LS-SVR | LS-SVR | |||
| Hybrid 5 | LS-SVR | LS-SVR | LS-SVR | LS-SVR | LS-SVR | ||
| Hybrid 6 | MLP-15 | MLP-14 | MLP-12 | MLP-11 | MLP-12 | LS-SVR | |
| Hybrid 7 | LS-SVR | MLP-14 | LS-SVR | MLP-13 | MLP-13 | MLP-11 | LS-SVR |
| Cl-1 | Cl-2 | Cl-3 | Cl-4 | Cl-5 | Cl-6 | Cl-7 | Hybrid MSE | |
|---|---|---|---|---|---|---|---|---|
| Global | 0.9454 | 0.9454 | ||||||
| Hybrid 2 | 0.8620 | 0.7596 | 0.8021 | |||||
| Hybrid 3 | 1.0792 | 1.3943 | 0.8693 | 1.0582 | ||||
| Hybrid 4 | 2.5665 | 0.8984 | 0.9411 | 0.7035 | 1.0780 | |||
| Hybrid 5 | 1.2082 | 2.1560 | 1.0623 | 0.9041 | 0.8080 | 1.0873 | ||
| Hybrid 6 | 1.0036 | 2.3759 | 1.1940 | 0.5146 | 1.3799 | 0.9011 | 1.1768 | |
| Hybrid 7 | 0.8151 | 2.2792 | 1.4413 | 0.5952 | 1.6359 | 1.6617 | 1.6345 | 1.4689 |
| ARIMAX Model | Bagged Tree Model | Hybrid Model | |||||||
|---|---|---|---|---|---|---|---|---|---|
| MAPE (%) | MAE ( MW) | MSE ( MW) | MAPE (%) | MAE ( MW) | MSE ( MW) | MAPE (%) | MAE ( MW) | MSE ( MW) | |
| Day 1 | 6.27 | 107.73 | 16,402 | 2.70 | 46.73 | 3167 | 2.98 | 53.94 | 4515 |
| Day 2 | 4.73 | 82.80 | 9027 | 3.53 | 64.05 | 6473 | 3.74 | 68.36 | 6661 |
| Day 3 | 6.01 | 103.46 | 14,832 | 2.43 | 41.88 | 2944 | 1.97 | 33.75 | 2052 |
| Day 4 | 8.36 | 138.87 | 21,808 | 4.02 | 70.24 | 7388 | 2.96 | 49.76 | 3773 |
| Day 5 | 5.73 | 98.93 | 15,173 | 2.98 | 52.99 | 4015 | 2.43 | 41.76 | 3035 |
| Mean | 6.22 | 106.36 | 15,449 | 3.13 | 55.18 | 4797 | 2.81 | 49.51 | 4007 |
© 2019 by the authors. Licensee MDPI, Basel, Switzerland. This article is an open access article distributed under the terms and conditions of the Creative Commons Attribution (CC BY) license (http://creativecommons.org/licenses/by/4.0/).
Share and Cite
Casteleiro-Roca, J.-L.; Gómez-González, J.F.; Calvo-Rolle, J.L.; Jove, E.; Quintián, H.; Gonzalez Diaz, B.; Mendez Perez, J.A. Short-Term Energy Demand Forecast in Hotels Using Hybrid Intelligent Modeling. Sensors 2019, 19, 2485. https://doi.org/10.3390/s19112485
Casteleiro-Roca J-L, Gómez-González JF, Calvo-Rolle JL, Jove E, Quintián H, Gonzalez Diaz B, Mendez Perez JA. Short-Term Energy Demand Forecast in Hotels Using Hybrid Intelligent Modeling. Sensors. 2019; 19(11):2485. https://doi.org/10.3390/s19112485
Chicago/Turabian StyleCasteleiro-Roca, José-Luis, José Francisco Gómez-González, José Luis Calvo-Rolle, Esteban Jove, Héctor Quintián, Benjamin Gonzalez Diaz, and Juan Albino Mendez Perez. 2019. "Short-Term Energy Demand Forecast in Hotels Using Hybrid Intelligent Modeling" Sensors 19, no. 11: 2485. https://doi.org/10.3390/s19112485