3D Analysis of Upper Limbs Motion during Rehabilitation Exercises Using the KinectTM Sensor: Development, Laboratory Validation and Clinical Application

 ,
, 
Abstract
1. Introduction
2. Methods
3. Laboratory Setting Validation
3.1. Participants
3.2. Material
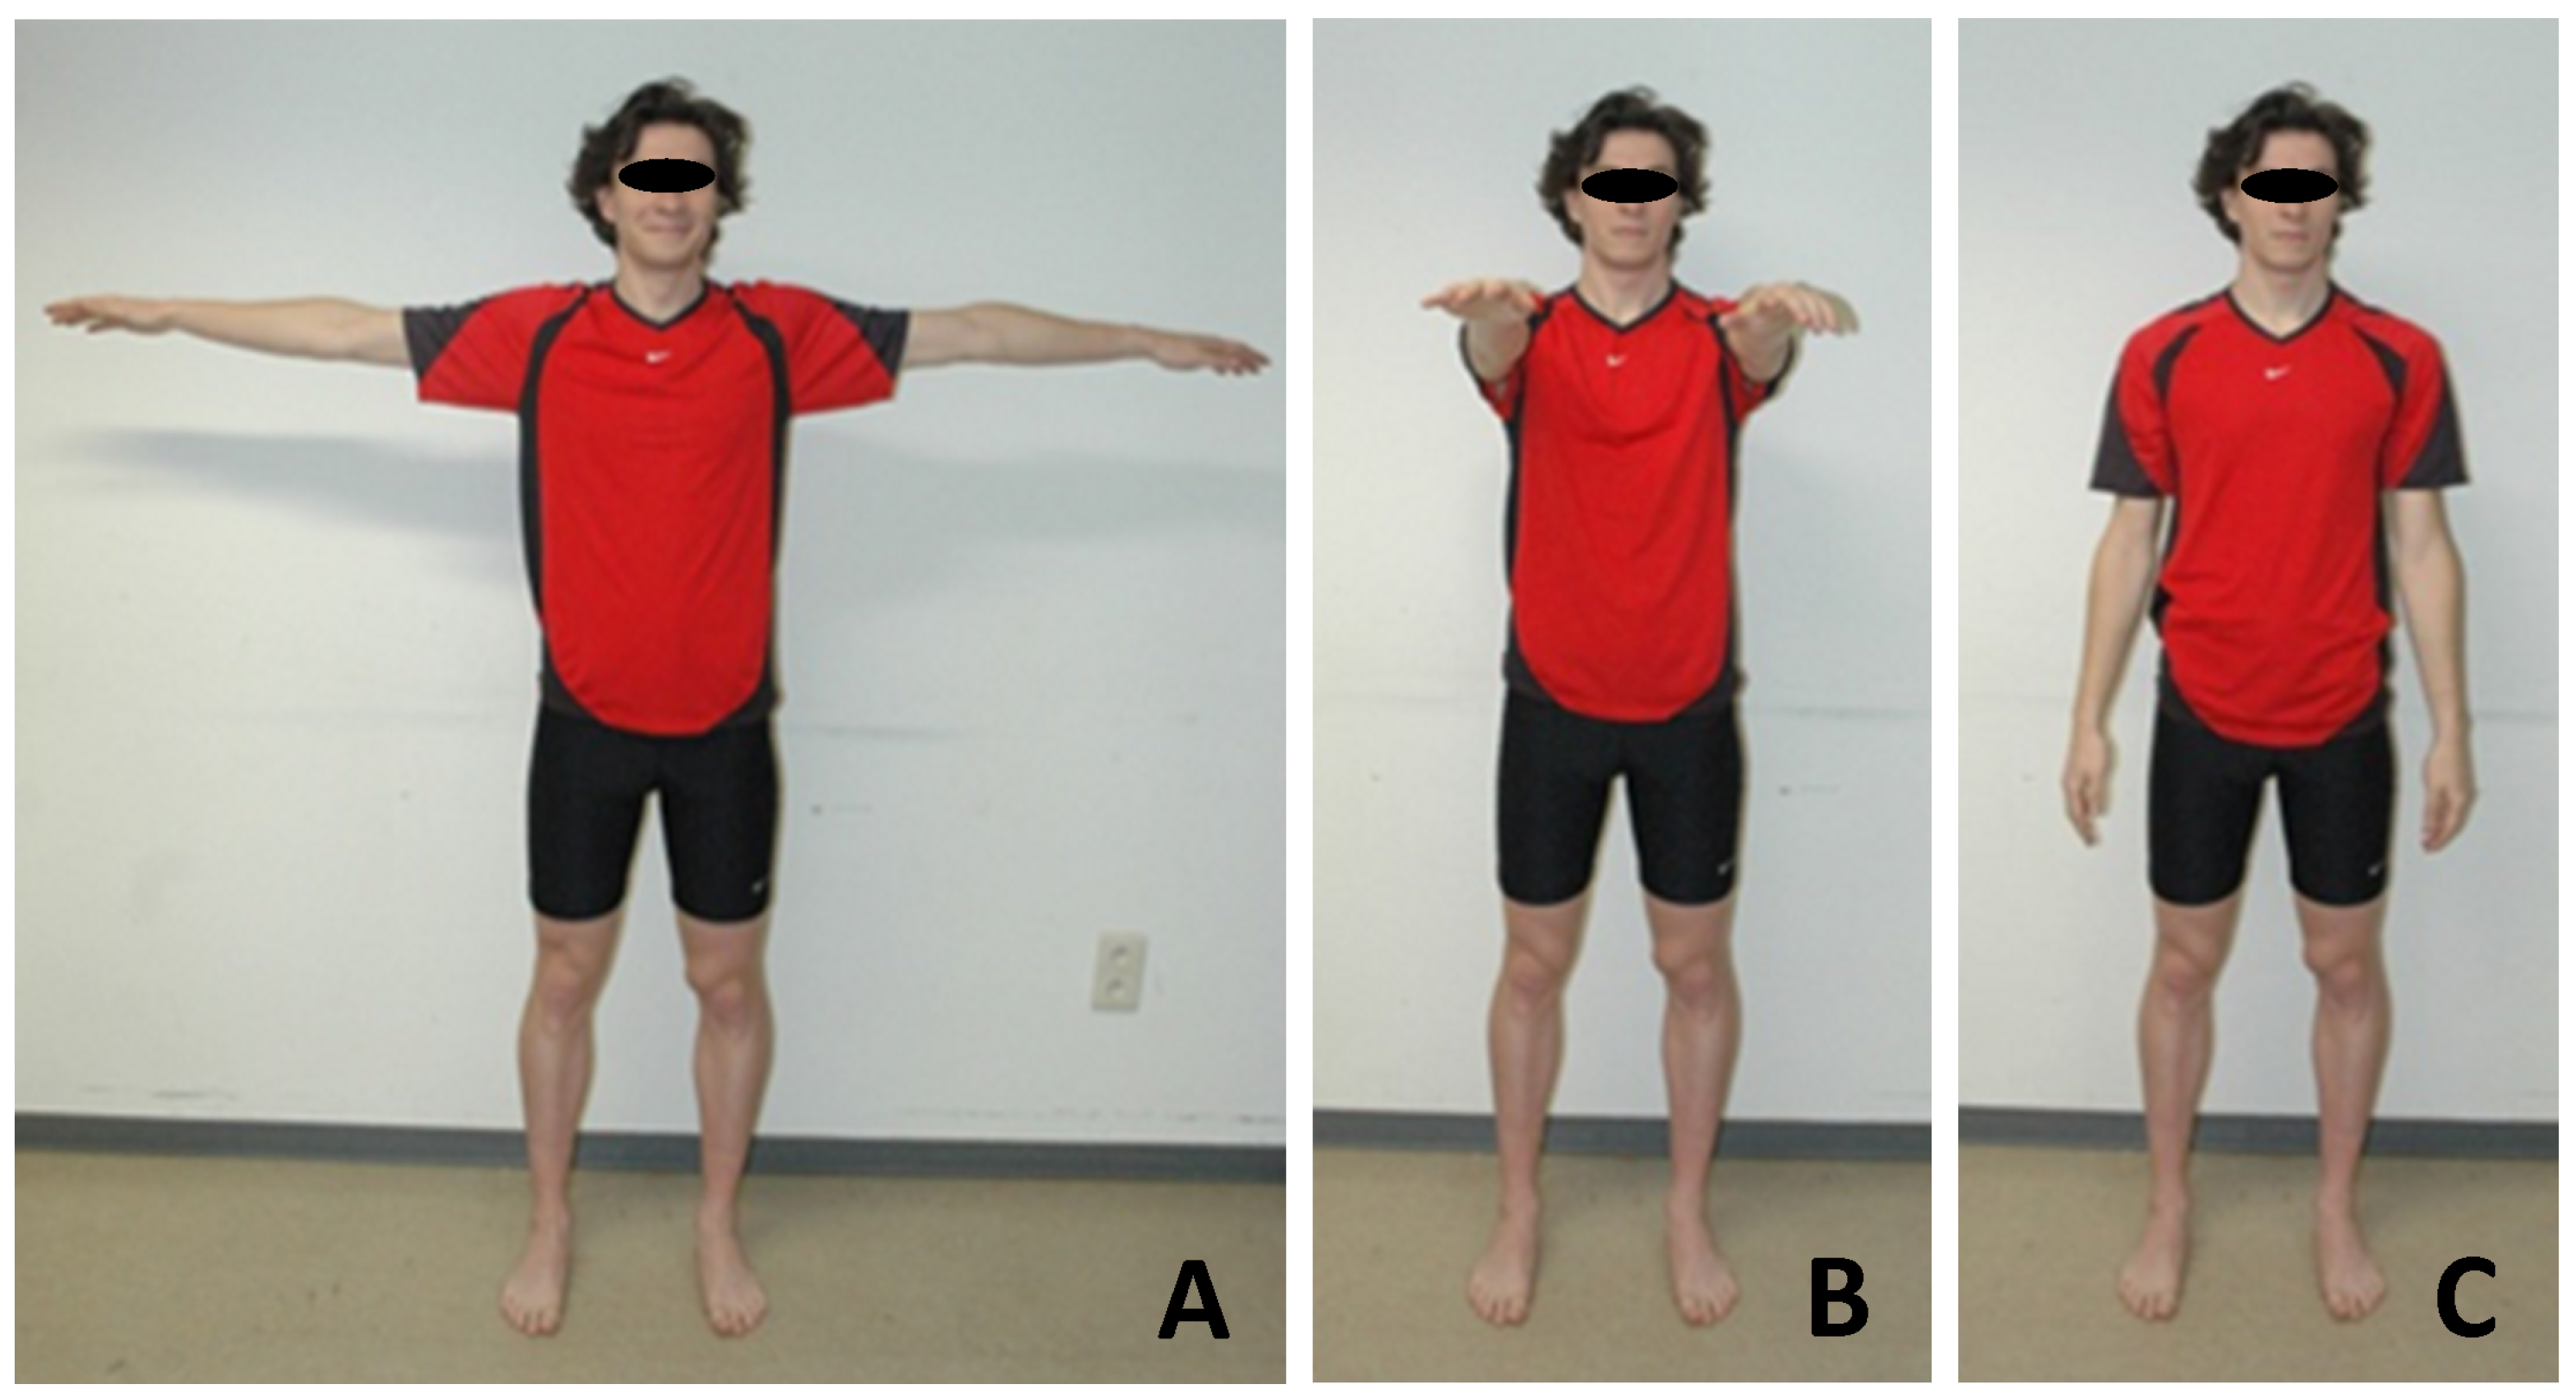
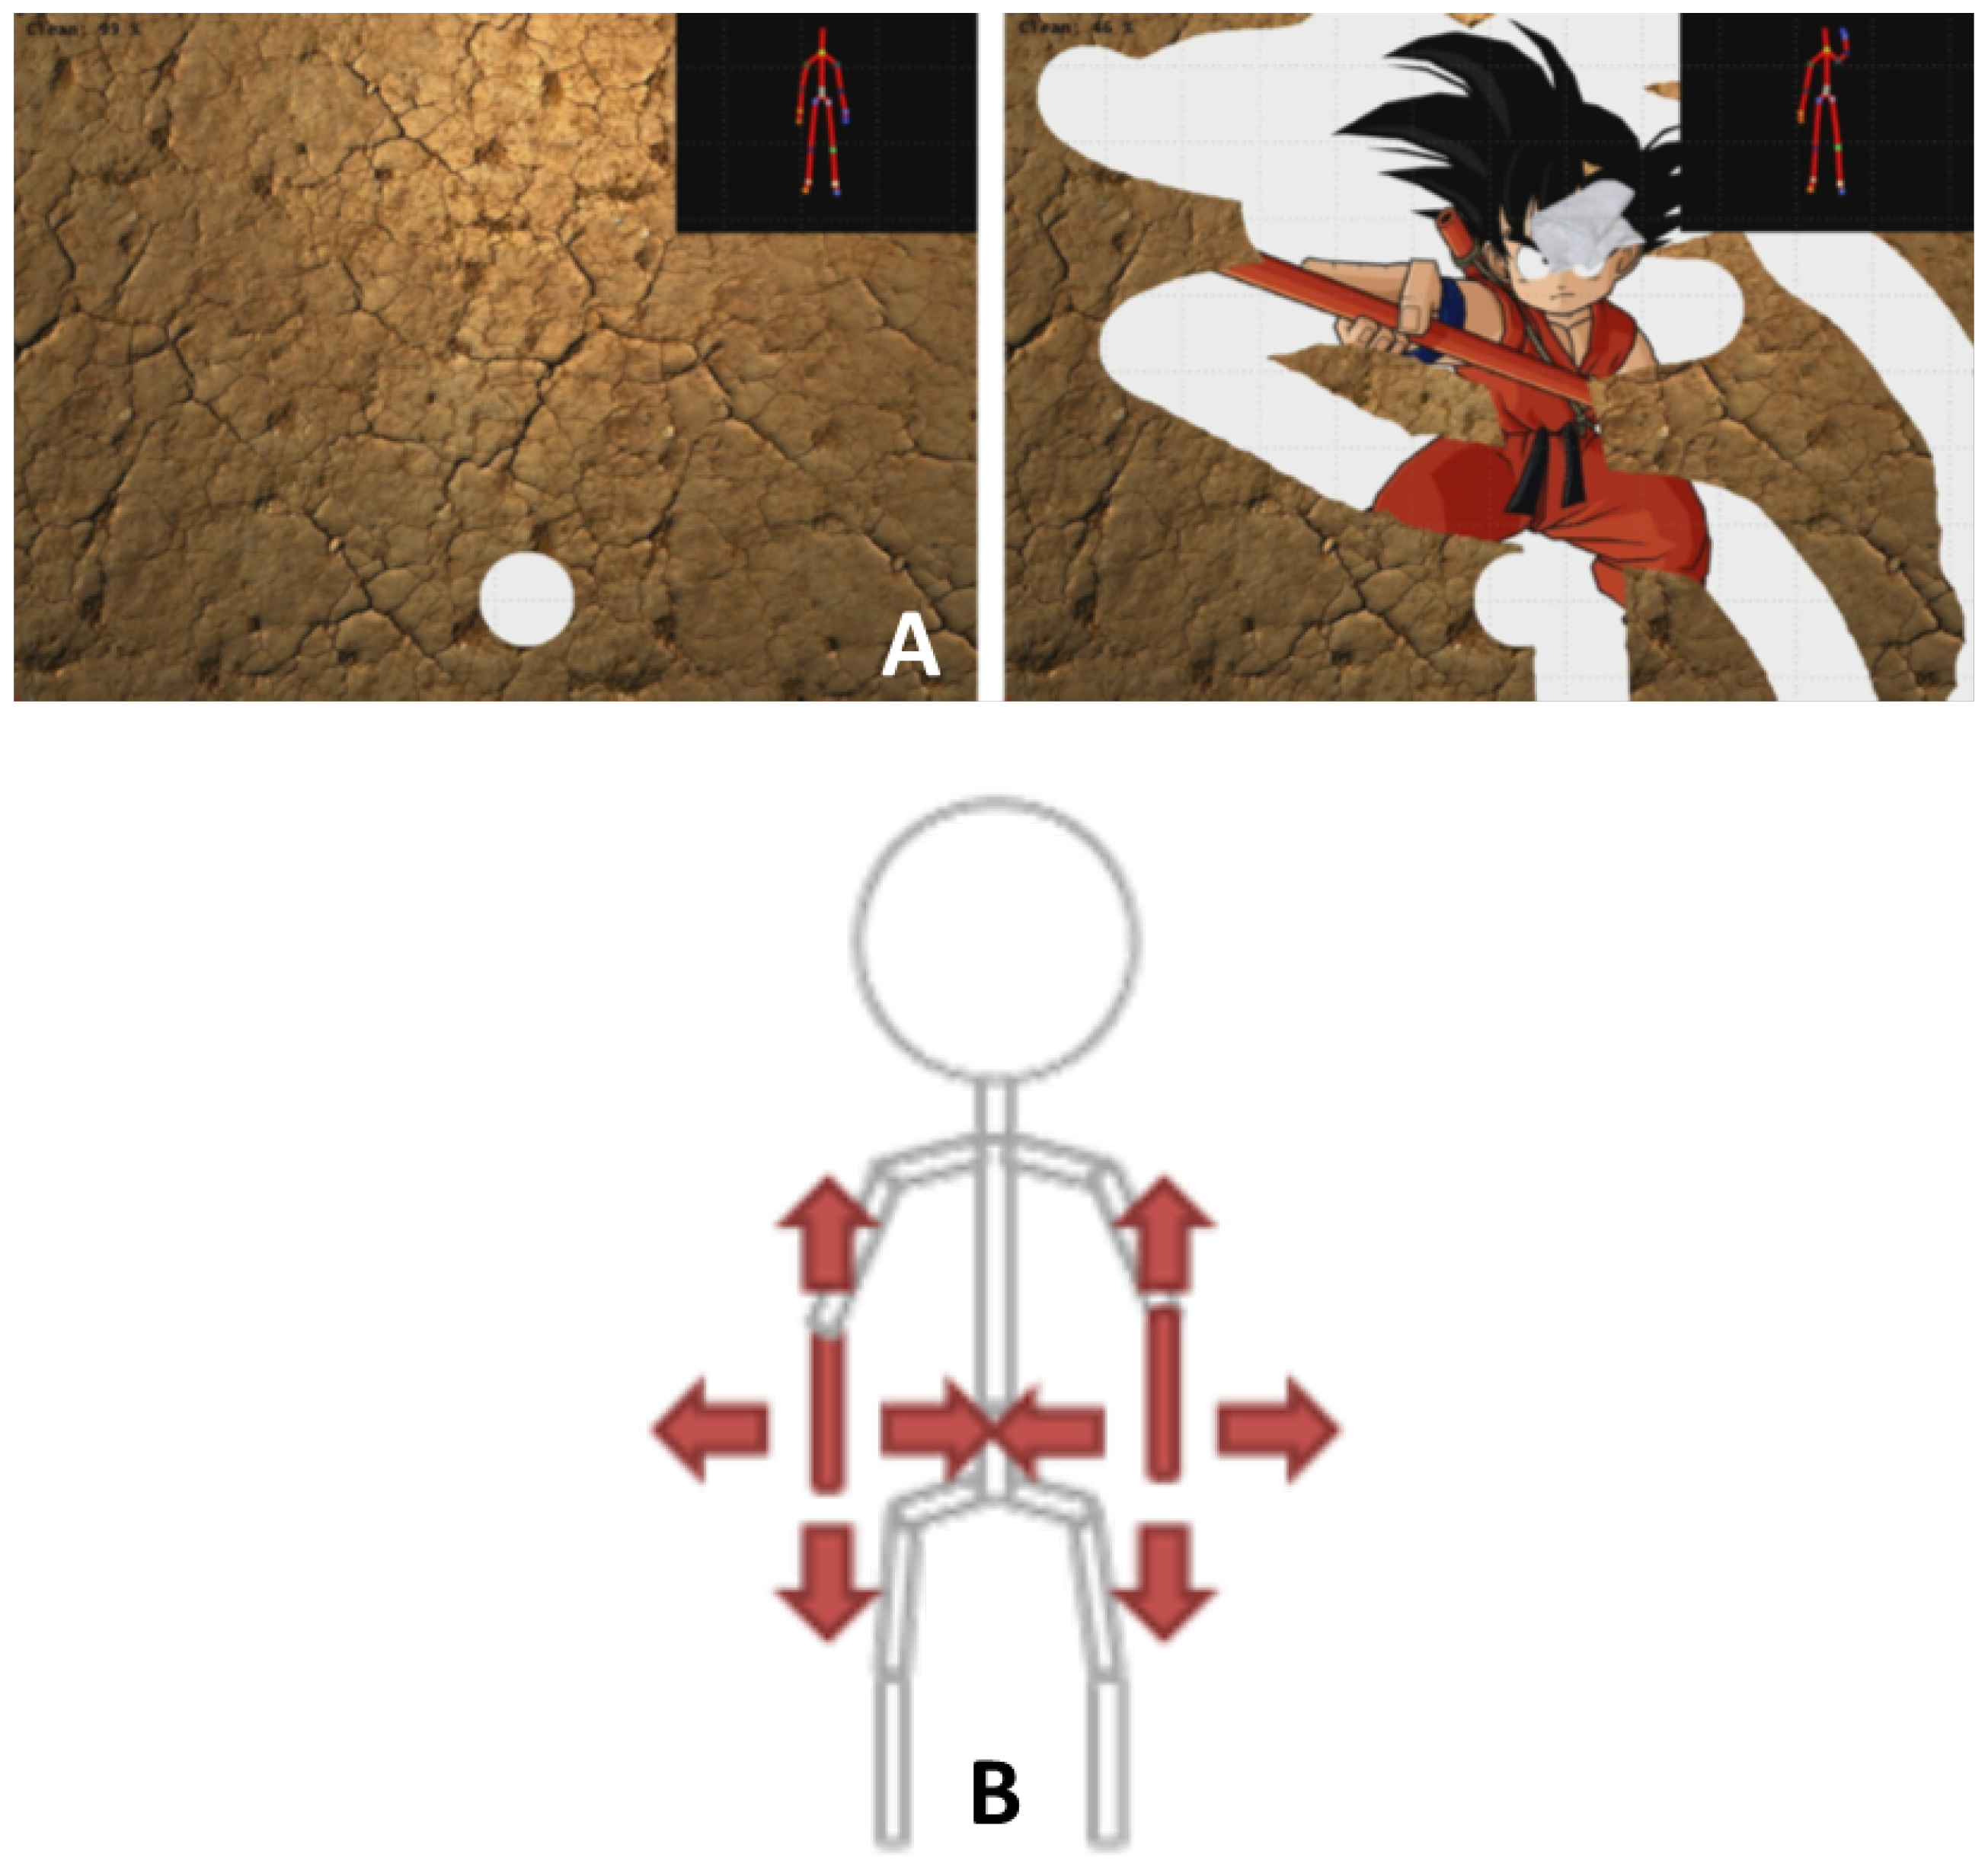
3.3. The Serious Games
3.4. Data Processing and Statistics
3.5. Results of the Laboratory Validation
4. Validation in Clinical Environment
4.1. Participants
- Adults: Sixteen healthy young adults (results of the laboratory validation were used)
- Elderly: Seventeen patients ( years old) hospitalized in a geriatric department were included in the study. This study was approved by the local ethical committee of Erasme Hospital (Eudract: B406201628246), and informed consent was obtained from the patients prior to their participation.
- Stroke: 10 patients with chronic stroke ( years old) participated in this study. This study was approved by the ethical committee of Erasme Hospital (EudraCT: B406201526116), and informed consent was obtained from the patients prior to their participation.
4.2. Material
4.3. Data Processing and Statistics
4.4. Results of the Validation in the Clinical Environment
5. Discussion
6. Conclusions
Author Contributions
Funding
Conflicts of Interest
Abbreviations
| MLS: | Markerless system |
| MBS: | Marker-based system |
| LCS: | Local coordinate system |
| RCP: | Reproducibility coefficient |
| CV: | Coefficient of variation |
References
- Clark, R.; Pua, Y.; Fortin, K.; Ritchie, C.; Webster, K.; Denehy, L.; Bryant, A. Validity of the Microsoft Kinect for assessment of postural control. Gait Posture 2012, 36, 372–377. [Google Scholar] [CrossRef] [PubMed]
- Clark, R.; Pua, Y.; Bryant, A.; Hunt, M. Validity of the Microsoft Kinect for providing lateral trunk lean feedback during gait retraining. Gait Posture 2013, 38, 1064–1066. [Google Scholar] [CrossRef] [PubMed]
- Bonnechère, B.; Jansen, B.; Salvia, P.; Bouzahouene, H.; Omelina, L.; Sholukha, V.; Cornelis, J.; Rooze, M.; Van Sint Jan, S. Determination of the precision and accuracy of morphological measurements using the Kinect™ sensor: Comparison with standard stereophotogrammetry. Ergonomics 2014, 57, 622–631. [Google Scholar] [CrossRef] [PubMed]
- Bonnechère, B.; Jansen, B.; Salvia, P.; Bouzahouene, H.; Omelina, L.; Moiseev, F.; Sholukha, V.; Cornelis, J.; Rooze, M.; Van Sint Jan, S. Validity and reliability of the Kinect within functional assessment activities: Comparison with standard stereophotogrammetry. Gait Posture 2014, 39, 593–598. [Google Scholar] [CrossRef] [PubMed]
- Pfister, A.; West, A.; Bronner, S.; Noah, J. Comparative abilities of Microsoft Kinect and Vicon 3D motion capture for gait analysis. J. Med. Eng. Technol. 2014, 38, 274–280. [Google Scholar] [CrossRef] [PubMed]
- Gray, A.; Willis, B.; Skubic, M.; Huo, Z.; Razu, S.; Sherman, S.; TM, G.; Jahandar, A.; Gulbrandsen, T.; Miller, S.; Siesener, N. Development and Validation of a Portable and Inexpensive Tool to Measure the Drop Vertical Jump Using the Microsoft Kinect V2. Sport Health 2017, 9, 537–544. [Google Scholar] [CrossRef] [PubMed]
- Kim, D.; Kim, D.; Kwak, K. Classification of K-Pop Dance Movements Based on Skeleton Information Obtained by a Kinect Sensor. Sensors 2017, 17, 1261. [Google Scholar] [CrossRef] [PubMed]
- Della Croce, U.; Leardini, A.; Chiari, L.; Cappozzo, A. Human movement analysis using stereophotogrammetry. Part 4: Assessment of anatomical landmark misplacement and its effects on joint kinematics. Gait Posture 2005, 21, 226–237. [Google Scholar] [CrossRef] [PubMed]
- Leardini, A.; Chiari, L.; Della Croce, U.; Cappozzo, A. Human movement analysis using stereophotogrammetry. Part 3. Soft tissue artifact assessment and compensation. Gait Posture 2005, 21, 212–225. [Google Scholar] [CrossRef] [PubMed]
- Kurillo, G.; Chen, A.; Bajcsy, R.; Han, J. Evaluation of upper extremity reachable workspace using Kinect camera. Technol. Health Care 2013, 21, 641–656. [Google Scholar] [PubMed]
- Han, J.; Kurillo, G.; Abreash, R.; de Bie, E.; Nicorici, A.; Bajcsy, R. Reachable Workspace in Facioscapulohumeral muscular dystrophy (FSHD) by Kinect. Technol. Health Care 2015, 51, 168–175. [Google Scholar] [CrossRef] [PubMed]
- Han, J.; de Bie, E.; Nicorici, A.; Abreash, R.; Anthonisen, C.; Bajcsy, R.; Kurillo, G.; Mcdonald, C. Reachable workspace and performance of upper limb (PUL) in duchenne muscular dystrophy. Muscle Nerve 2016, 53, 545–554. [Google Scholar] [CrossRef] [PubMed]
- Elgendi, M.; Picon, F.; Magnenat-Thalmann, N.; Abbott, D. Arm movement speed assessment via a Kinect camera: A preliminary study in healthy subjects. Biomed. Eng. Online 2014, 13, 88. [Google Scholar] [CrossRef] [PubMed]
- Pagliari, D.; Pinto, L. Calibration of Kinect for Xbox One and Comparison between the Two Generations of Microsoft Sensors. Sensors 2015, 15, 27569–27589. [Google Scholar] [CrossRef] [PubMed]
- Wilson, J.; Khan-Perez, J.; Marley, D.; Buttress, S.; Walton, M.; Li, B.; Roy, B. Can shoulder range of movement be measured accurately using the Micorsoft Kinect sensor plus Medical Interactive Recovery Assistant (MIRA) software? J. Shoulder Elb. Surg. 2017, 26, e382–e389. [Google Scholar] [CrossRef] [PubMed]
- Zulkarnain, R.; Kim, G.; Adikrishna, A.; Hong, H.; Kim, Y.; Jean, I. Digital data acquisition of shoulder range of motion and arm motion smoothness using Kinect v2. J. Shoulder Elb. Surg. 2017, 26, 895–901. [Google Scholar] [CrossRef] [PubMed]
- Otte, K.; Kayser, B.; Mansow-Model, S.; Verrel, J.; Paul, F.; Brandt, A.; Schmitz-Hübsch, T. Accuracy and Reliability of the Kinect Version 2 for Clinical Measurement of Motor Function. PLoS ONE 2016, 11, e0166532. [Google Scholar] [CrossRef] [PubMed]
- Müller, B.; Ilg, W.; Giese, M.; Ludolph, N. Validation of enhanced kinect sensor based motion capturing for gait assessment. PLoS ONE 2017, 12, e0175813. [Google Scholar] [CrossRef] [PubMed]
- MacWilliams, B.; Davis, R. Addressing some misperceptions of the joint coordinate system. J. Biomech. Eng. 2013, 135, 54506. [Google Scholar] [CrossRef] [PubMed]
- Atrsaei, A.; Salarieh, H.; Alasty, A. Human Arm Motion Tracking by Orientation-Based Fusion of Inertial Sensors and Kinect Using Unscented Kalman Filter. J. Biomech. Eng. 2016, 138, 091005. [Google Scholar] [CrossRef] [PubMed]
- Seo, N.; Fathi, M.; Hur, P.; Crocher, V. Modifying Kinect placement to improve upper limb joint angle measurement accuracy. J. Hand Ther. 2016, 29, 465–473. [Google Scholar] [CrossRef] [PubMed]
- Xu, X.; Robertson, M.; Cehn, K.; Lin, J.; McGorry, R. Using the Microsoft Kinect™ to assess 3-D shoulder kinematics during computer use. Appl. Ergon. 2017, 65, 418–423. [Google Scholar] [CrossRef] [PubMed]
- Liao, Y.; Sun, Y.; Li, G.; Kong, J.; Jiang, G.; Cai, H.; Ju, Z.; Yu, H.; Liu, H. Simultaneous Calibration: A Joint Optimization Approach for Multiple Kinect and External Cameras. Sensors 2017, 17, 1491. [Google Scholar] [CrossRef] [PubMed]
- Shen, W.; Deng, K.; Bai, X.; Leyvand, T.; Guo, B.; Tu, Z. Exemplar-based human action pose correction. IEEE Trans. Cybern. 2014, 44, 1053–1066. [Google Scholar] [CrossRef] [PubMed]
- Sholukha, V.; Bonnechère, B.; Salvia, P.; Moiseev, F.; Rooze, M.; Van Sint Jan, S. Model-based approach for human kinematics reconstruction from markerless and marker-based motion analysis systems. J. Biomech. 2013, 46, 2363–2371. [Google Scholar] [CrossRef] [PubMed]
- Brandao, A.; Dias, D.; Castellano, G.; Parizotto, N.; Trevelin, L. RehabGesture: An Alternative Tool for Measuring Human Movement. Telemed. J. E Health 2016, 22, 584–589. [Google Scholar] [CrossRef] [PubMed]
- Ding, W.; Zheng, Y.; Su, Y.; Li, X. Kinect-based virtual rehabilitation and evaluation system for upper limb disorders: A case study. J. Back Musculoskelet. Rehabil. 2018, 1–11. [Google Scholar] [CrossRef] [PubMed]
- Bonnechère, B.; Jansen, B.; Omelina, L.; Sholukha, V.; Van Sint Jan, S. Patients’ follow-up using biomechanical analysis of rehabilitation exercises. Int. J. Serious Games 2017, 4, 3–13. [Google Scholar] [CrossRef]
- Wu, G.; van der Helm, F.; Veeger, H.; Makhsous, M.; Roy, P.V.; Anglin, C.; Nagels, J.; Karduna, A.; McQuade, K.; Wang, X.; et al.; International Society of Biomechanics ISB recommendation on definitions of joint coordinate systems of various joints for the reporting of human joint motion—Part II: Shoulder, elbow, wrist and hand. J. Biomech. 2005, 38, 981–992. [Google Scholar] [CrossRef] [PubMed]
- Duarte, M.; Freitas, S. Revision of posturography based on force plate for balance evaluation. Rev. Bras. Fisioter. 2010, 14, 183–192. [Google Scholar] [CrossRef] [PubMed]
- Bonnechère, B.; Jansen, B.; Omelina, L.; Sholukha, V.; Van Sint Jan, S. Validation of the Balance Board for Clinical Evaluation of Balance During Serious Gaming Rehabilitation Exercises. Int. J. Rehabil. Res. 2016, 22, 709–717. [Google Scholar] [CrossRef] [PubMed]
- Omelina, L.; Jansen, B.; Bonnechère, B.; Van Sint Jan, S.; Cornelis, J. Serious games for physical rehabilitation: Designing highly configurable and adaptable games. In Proceedings of the 9th International Conference on Disability, Virtual Reality & Associated Technologies (ICDVRAT), Laval, France, 10–12 September 2012. [Google Scholar]
- Bonnechère, B.; Jansen, B.; Omelina, L.; Van Sint Jan, S. The use of commercial video games in rehabilitation: A systematic review. Int. J. Rehabil. Res. 2016, 39, 277–290. [Google Scholar] [CrossRef] [PubMed]
- Liu, Z.; Huang, J.; Han, J.; Bu, S.; LV, J. Human Motion Tracking by Multiple RGBD Cameras. IEEE Trans. Circuits Syst. Video Technol. 2017, 27, 2014–2027. [Google Scholar] [CrossRef]
- Van Diest, M.; Stegenga, J.; Wörtche, H.; Postema, K.; Verkerke, G.; Lamoth, C. Suitability of Kinect for measuring whole body movement patterns during exergaming. J. Biomech. 2014, 47, 2925–2932. [Google Scholar] [CrossRef] [PubMed]
- Bonnechère, B.; Sholukha, V.; Omelina, L.; Vooren, M.V.; Jansen, B.; Van Sint Jan, S. Suitability of functional evaluation embedded in serious game rehabilitation exercises to assess motor development across lifespan. Gait Posture 2017, 57, 35–39. [Google Scholar] [CrossRef] [PubMed]
- Rosenbaum, D. Human Motor Control; Elsevier: New York, NY, USA, 2009. [Google Scholar]
- Teulier, C.; Lee, D.; Ulrich, B. Early gait development in human infants: Plasticity and clinical applications. Dev. Psychobiol. 2015, 57, 447–458. [Google Scholar] [CrossRef] [PubMed]
- Trewartha, K.M.; Garcia, A.; Wolpert, D.; Flanagan, J. Fast but fleeting: Adaptive motor learning processes associated with aging and cognitive decline. J. Neurosci. 2014, 34, 13411–13421. [Google Scholar] [CrossRef] [PubMed]
- Bherer, L.; Kramer, A.; Peterson, M.; Colcombe, S.; Erickson, K.; Becic, E. Transfer effects in task-set cost and dual-task cost after dual-task training in older and younger adults: Further evidence for cognitive plasticity in attentional control in late adulthood. Exp. Aging Res. 2008, 34, 188–219. [Google Scholar] [CrossRef] [PubMed]
- Morone, G.; Paolucci, S.; Iosa, M. In What Daily Activities Do Patients Achieve Independence after Stroke? J. Stroke Cerebrovasc. Dis. 2015, 24, 1931–1937. [Google Scholar] [CrossRef] [PubMed]
- Michel, E.; Molitor, S.; Schneider, W. Differential changes in the development of motor coordination and executive functions in children with motor coordination impairments. Child Neuropsychol. 2018, 24, 20–45. [Google Scholar] [CrossRef] [PubMed]
- Lipskaya-Velikovsky, L.; Zeilig, G.; Weingarden, H.; Rozental-Iluz, C.; Rand, D. Executive functioning and daily living of individuals with chronic stroke: Measurement and implications. Int. J. Rehabil. Res. 2018, 41, 122–127. [Google Scholar] [CrossRef] [PubMed]
- Maitra, K.; Philips, K.; Rice, M. Grasping naturally versus grasping with a reacher in people without disability: Motor control and muscle activation differences. Am. J. Occup. Ther. 2010, 64, 95–104. [Google Scholar] [CrossRef] [PubMed]
- Warren, J.; Mwanza, J.; Tanna, A.; Budenz, D. A Statistical Model to Analyze Clinician Expert Consensus on Glaucoma Progression using Spatially Correlated Visual Field Data. Transl. Vis. Sci. Technol. 2016, 5, 14. [Google Scholar] [CrossRef] [PubMed]
- Yates, E.; Harvey, L.Y.H. Machine learning “red dot”: Open-source, cloud, deep convolutional neural networks in chest radiograph binary normality classification. Clin. Radiol. 2018. [Google Scholar] [CrossRef] [PubMed]
- Goldman, M. Education in Medicine: Moving the Boundaries to Foster Interdisciplinarity. Front. Med. 2016, 3, 15–16. [Google Scholar] [CrossRef] [PubMed]
- Lemon, T.; Smith, R. Consultation content not consultation lenght improves patient satisfaction. J. Fam. Med. Prim. Care 2014, 3, 333–339. [Google Scholar]
- Schlenstedt, C.; Arnold, M.; Mancini, M.; Deuschl, G.; Weisser, B. The effect of unilateral balance training on postural control of the contralateral limb. J. Sports Sci. 2017, 35, 2265–2271. [Google Scholar] [CrossRef] [PubMed]
- Buma, F.; van Kordelaar, J.; Raemaekers, M.; van Wegen, E.; Ramsey, N.; Kwakkel, G. Brain activation is related to smoothness of upper limb movements after stroke. Exp. Brain Res. 2016, 234, 2077–2089. [Google Scholar] [CrossRef] [PubMed]
- Cappozzo, A.; Della Croce, U.; Leardini, A.; Chiari, L. Human movement analysis using stereophotogrammetry. Part 1: theoretical background. Gait Posture 2005, 21, 186–196. [Google Scholar] [PubMed]


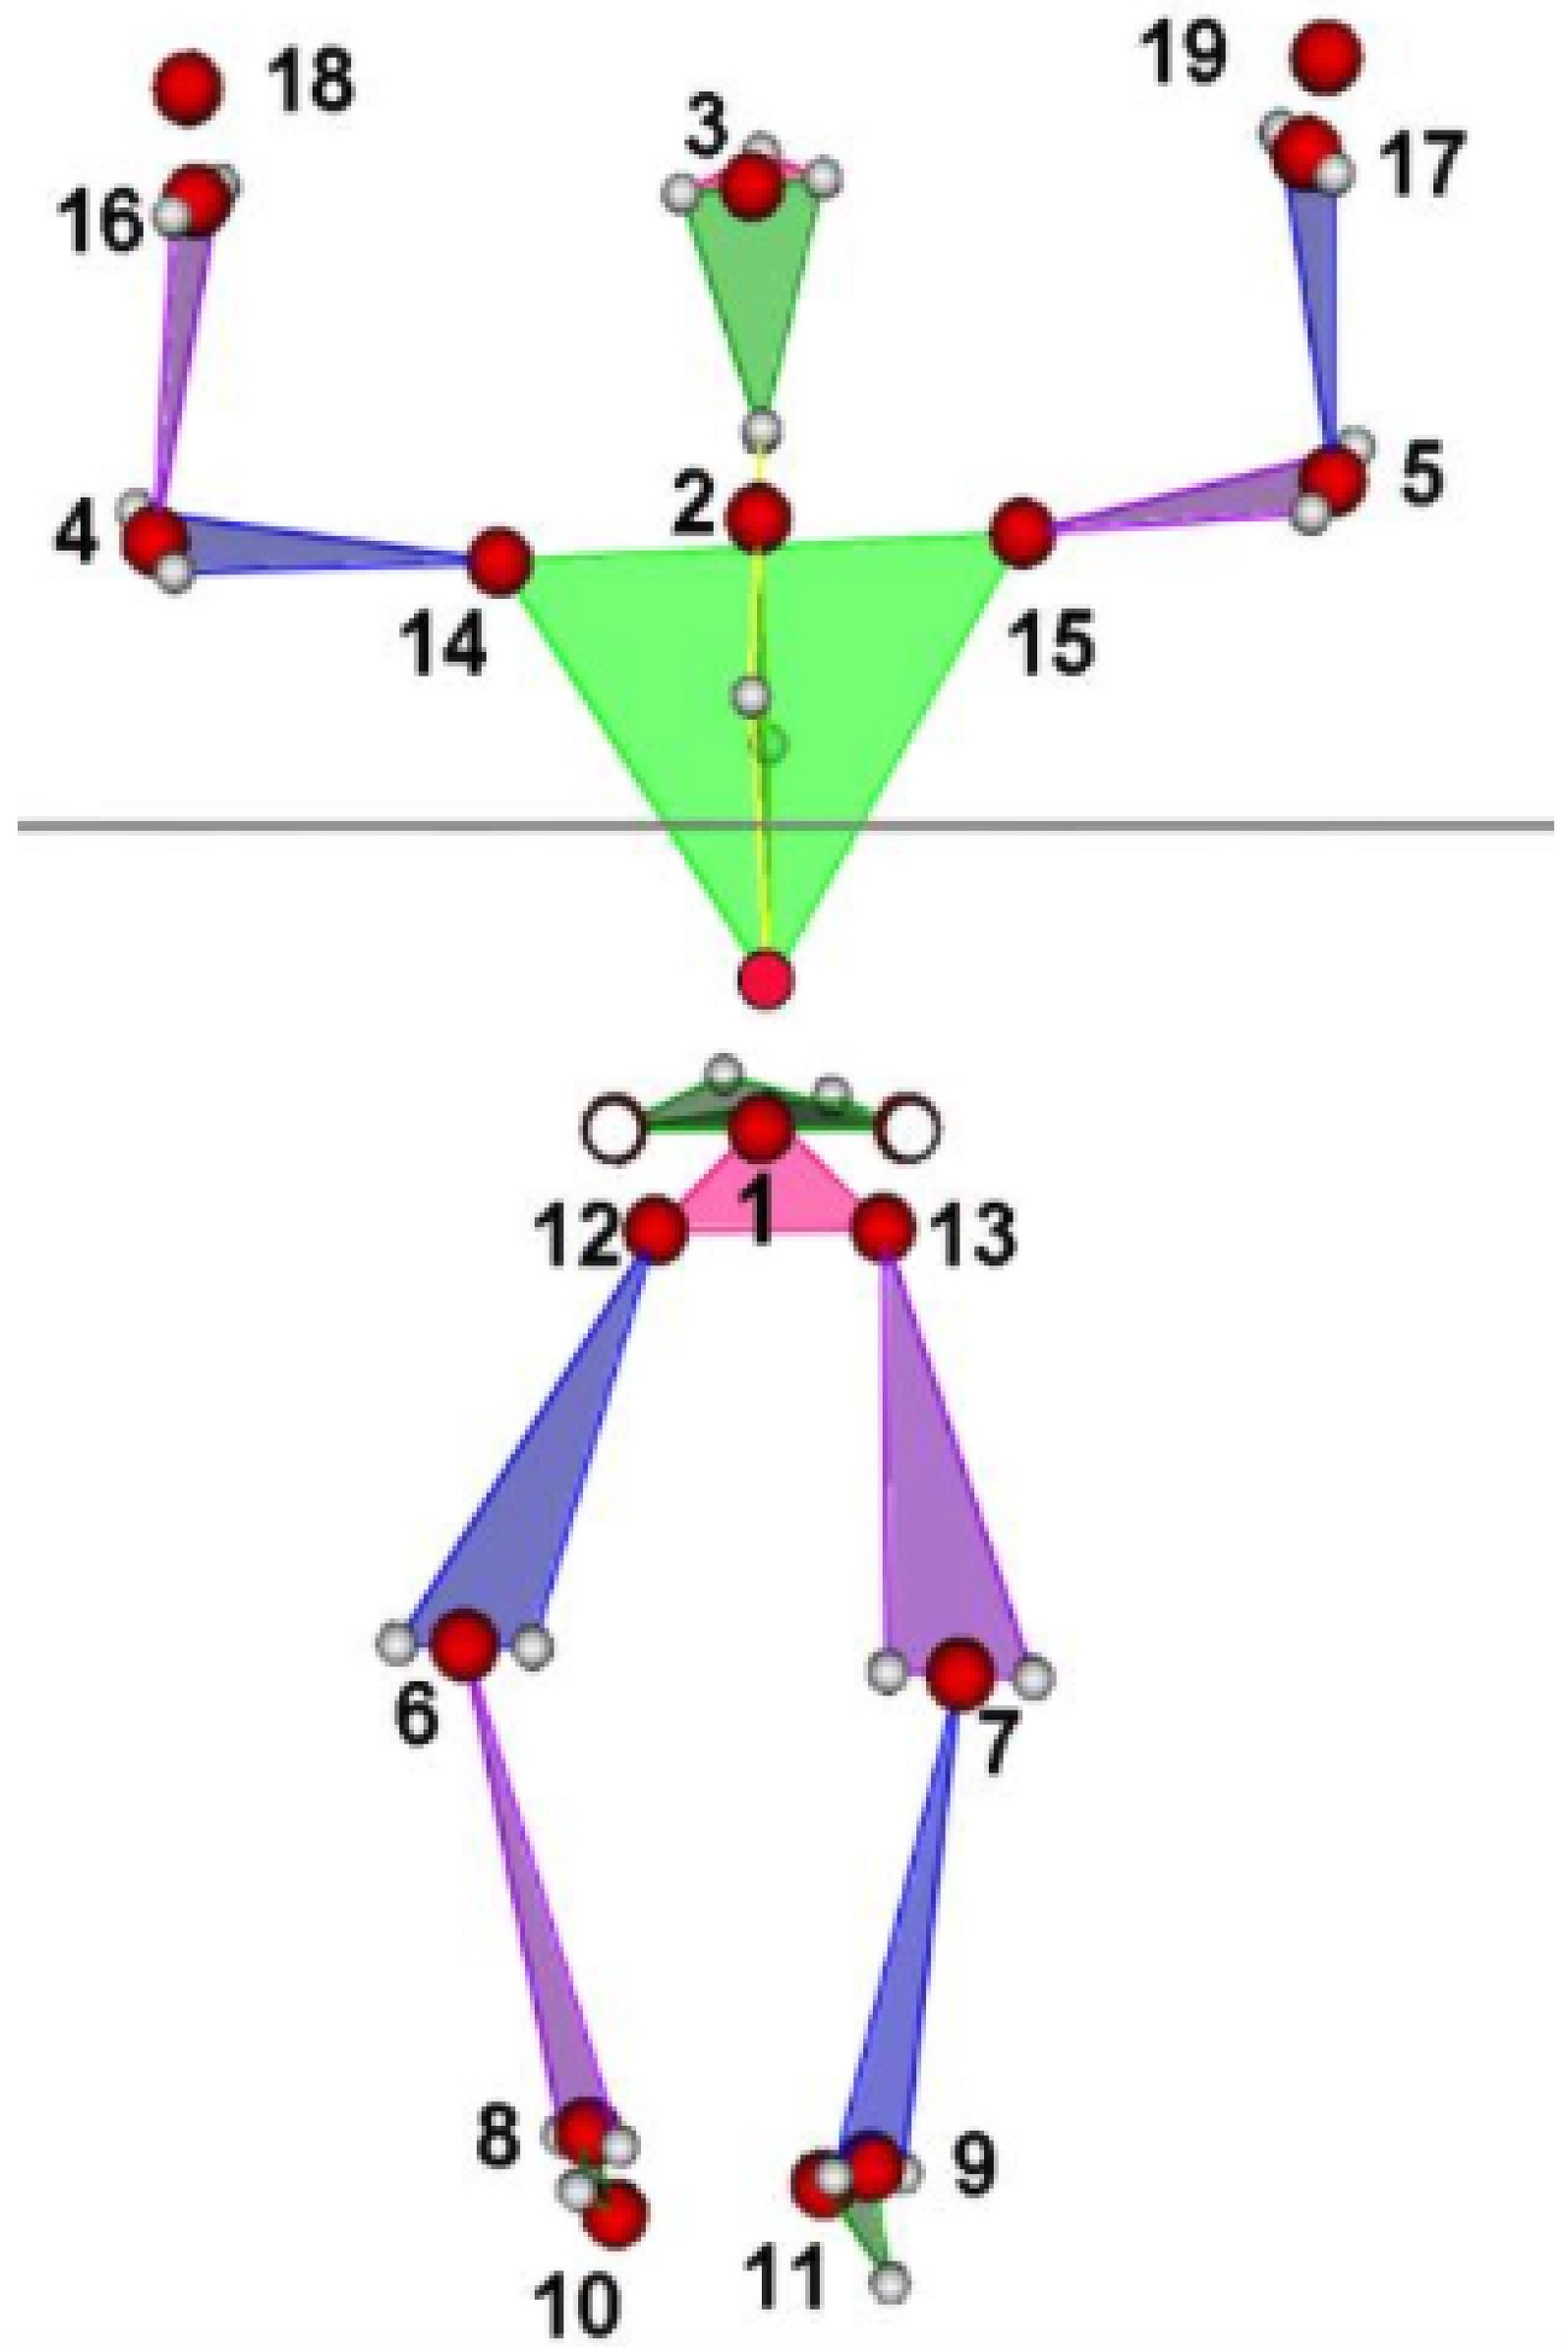
| Motion | 1 | 4 | 5 | 14 | 15 | 16 | 17 | 18 | 19 | 20 | 21 | 22 | 23 | 24 | 25 | 26 | 27 |
|---|---|---|---|---|---|---|---|---|---|---|---|---|---|---|---|---|---|
| Child | 1 | 4 | 5 | 14 | 15 | 4 | 5 | 16 | 17 | 18 | 19 | 16 | 17 | 18 | 19 | 18 | 19 |
| Parent | 0 | 2 | 2 | 2 | 2 | 14 | 15 | 14 | 15 | 14 | 15 | 4 | 5 | 4 | 5 | 16 | 17 |
| Parameter | Unit | Value | Equation |
|---|---|---|---|
| 1 | m | Total length of the trajectory | 4 |
| 2 | deg | Total angle of the trajectory (hodograph) | 10 |
| 3–5 | m/s | Mean, std, and max of the hodograph velocity | 5–7 |
| 6–8 | deg/s | Mean, std, and max of hodograph angular velocity | 12 |
| 9 | deg/s | Mean hodograph angular velocity from parameter 3 and mean radius | From 5 |
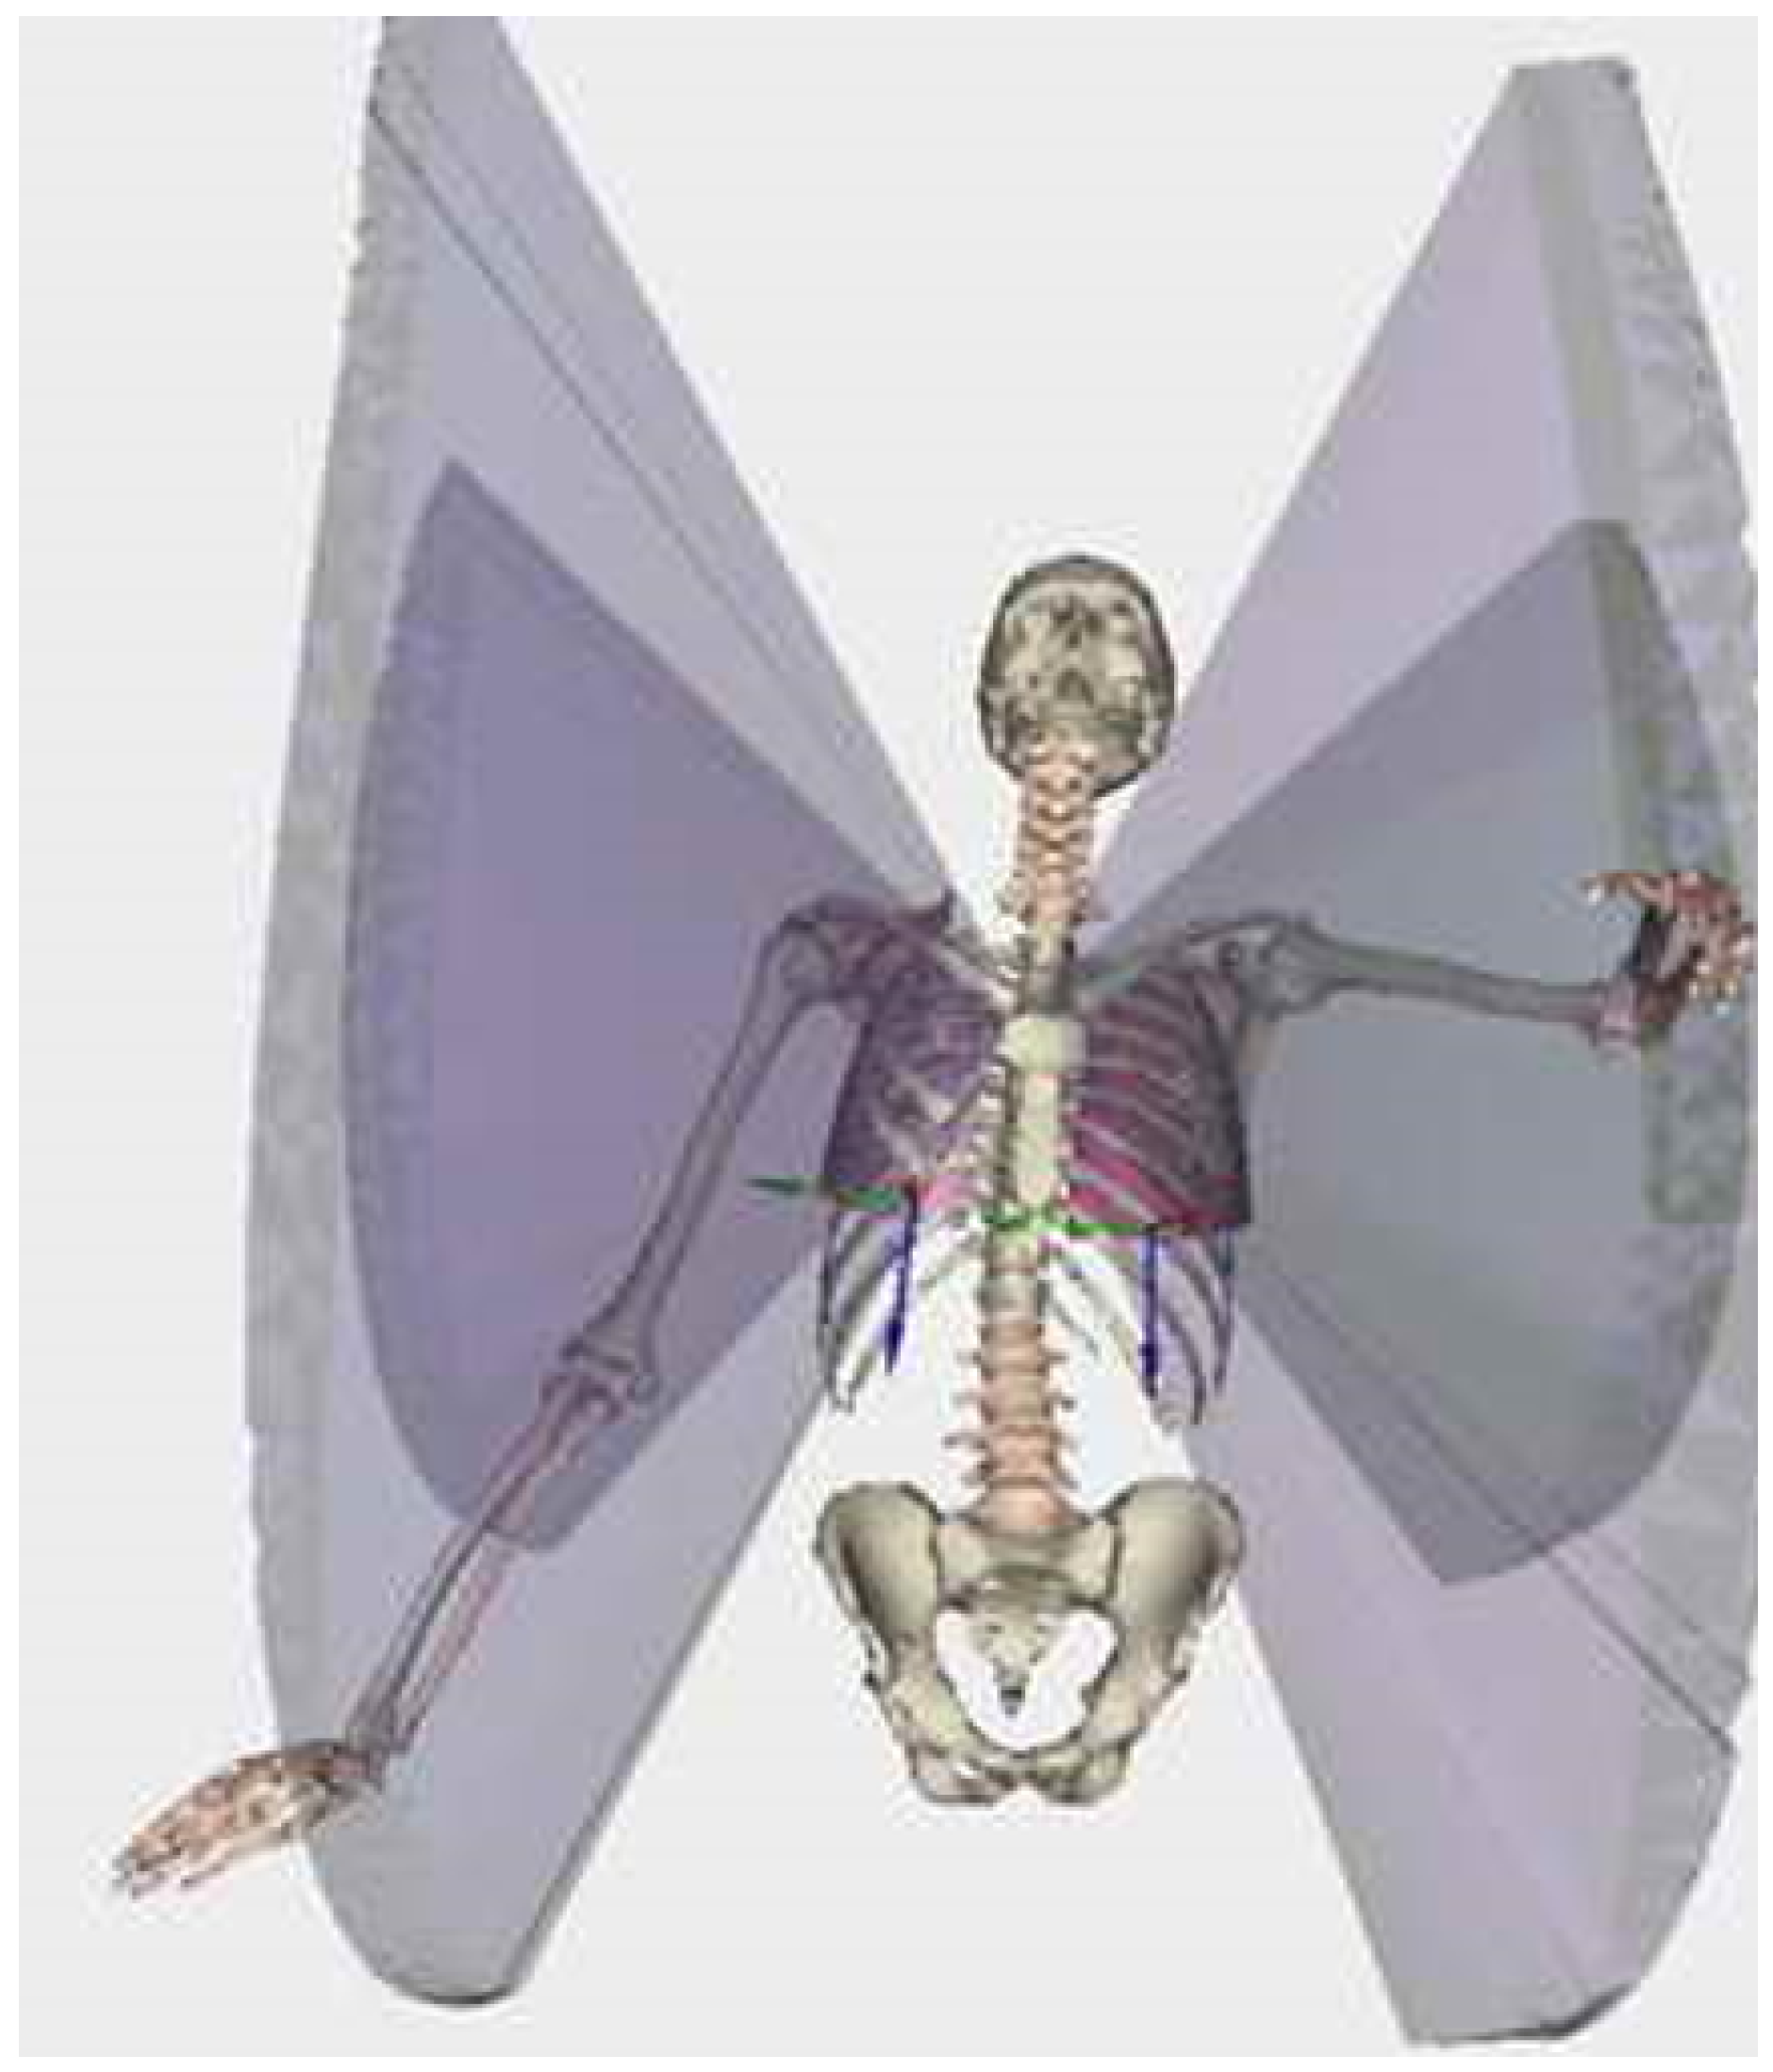
| 10 | cm | Square of cross-sectional rhomboid, defined by first and second axes | 29 |
| 11 | cm | Volume of two pyramids (diamond) constructed from three axes end points | 30 |
| 12, 13 | deg | Angles of view of two main axes from parent local coordinate system (LCS) origin | 27 |
| 14, 15 | mm | Size of the two main axes | 28 |
| 16–18 | mm | Position of principal axes origin in the parent LCS | |
| 19–30 | mm | Position of the end points of the first two axes in parent LCS | 25, 26 |
| 31 | deg | Radius of the cloud fitting by sphere | Point fitting by sphere |
| 32 | mm | Distance between LCS origin and sphere centre | Point fitting by sphere |
| 33 | mm | Mean residual of sphere fitting | Point fitting by sphere |
| 34 | mm | std residual of sphere fitting | Point fitting by sphere |
| 35–37 | Position in LCS of the fitted sphere centre | Point fitting by sphere | |
| 38, 39 | mm, mm | Triangulated surface area and conic volume (with vertex in the LCS origin) | Delaunay triangulation and convex hull functions |
| 40, 41 | sr | Solid angle (steradians (sr)) of the sphere and triangulated surface | Delaunay triangulation and convex hull functions |
| Joint | Variables | R | RCP (%) | CV |
|---|---|---|---|---|
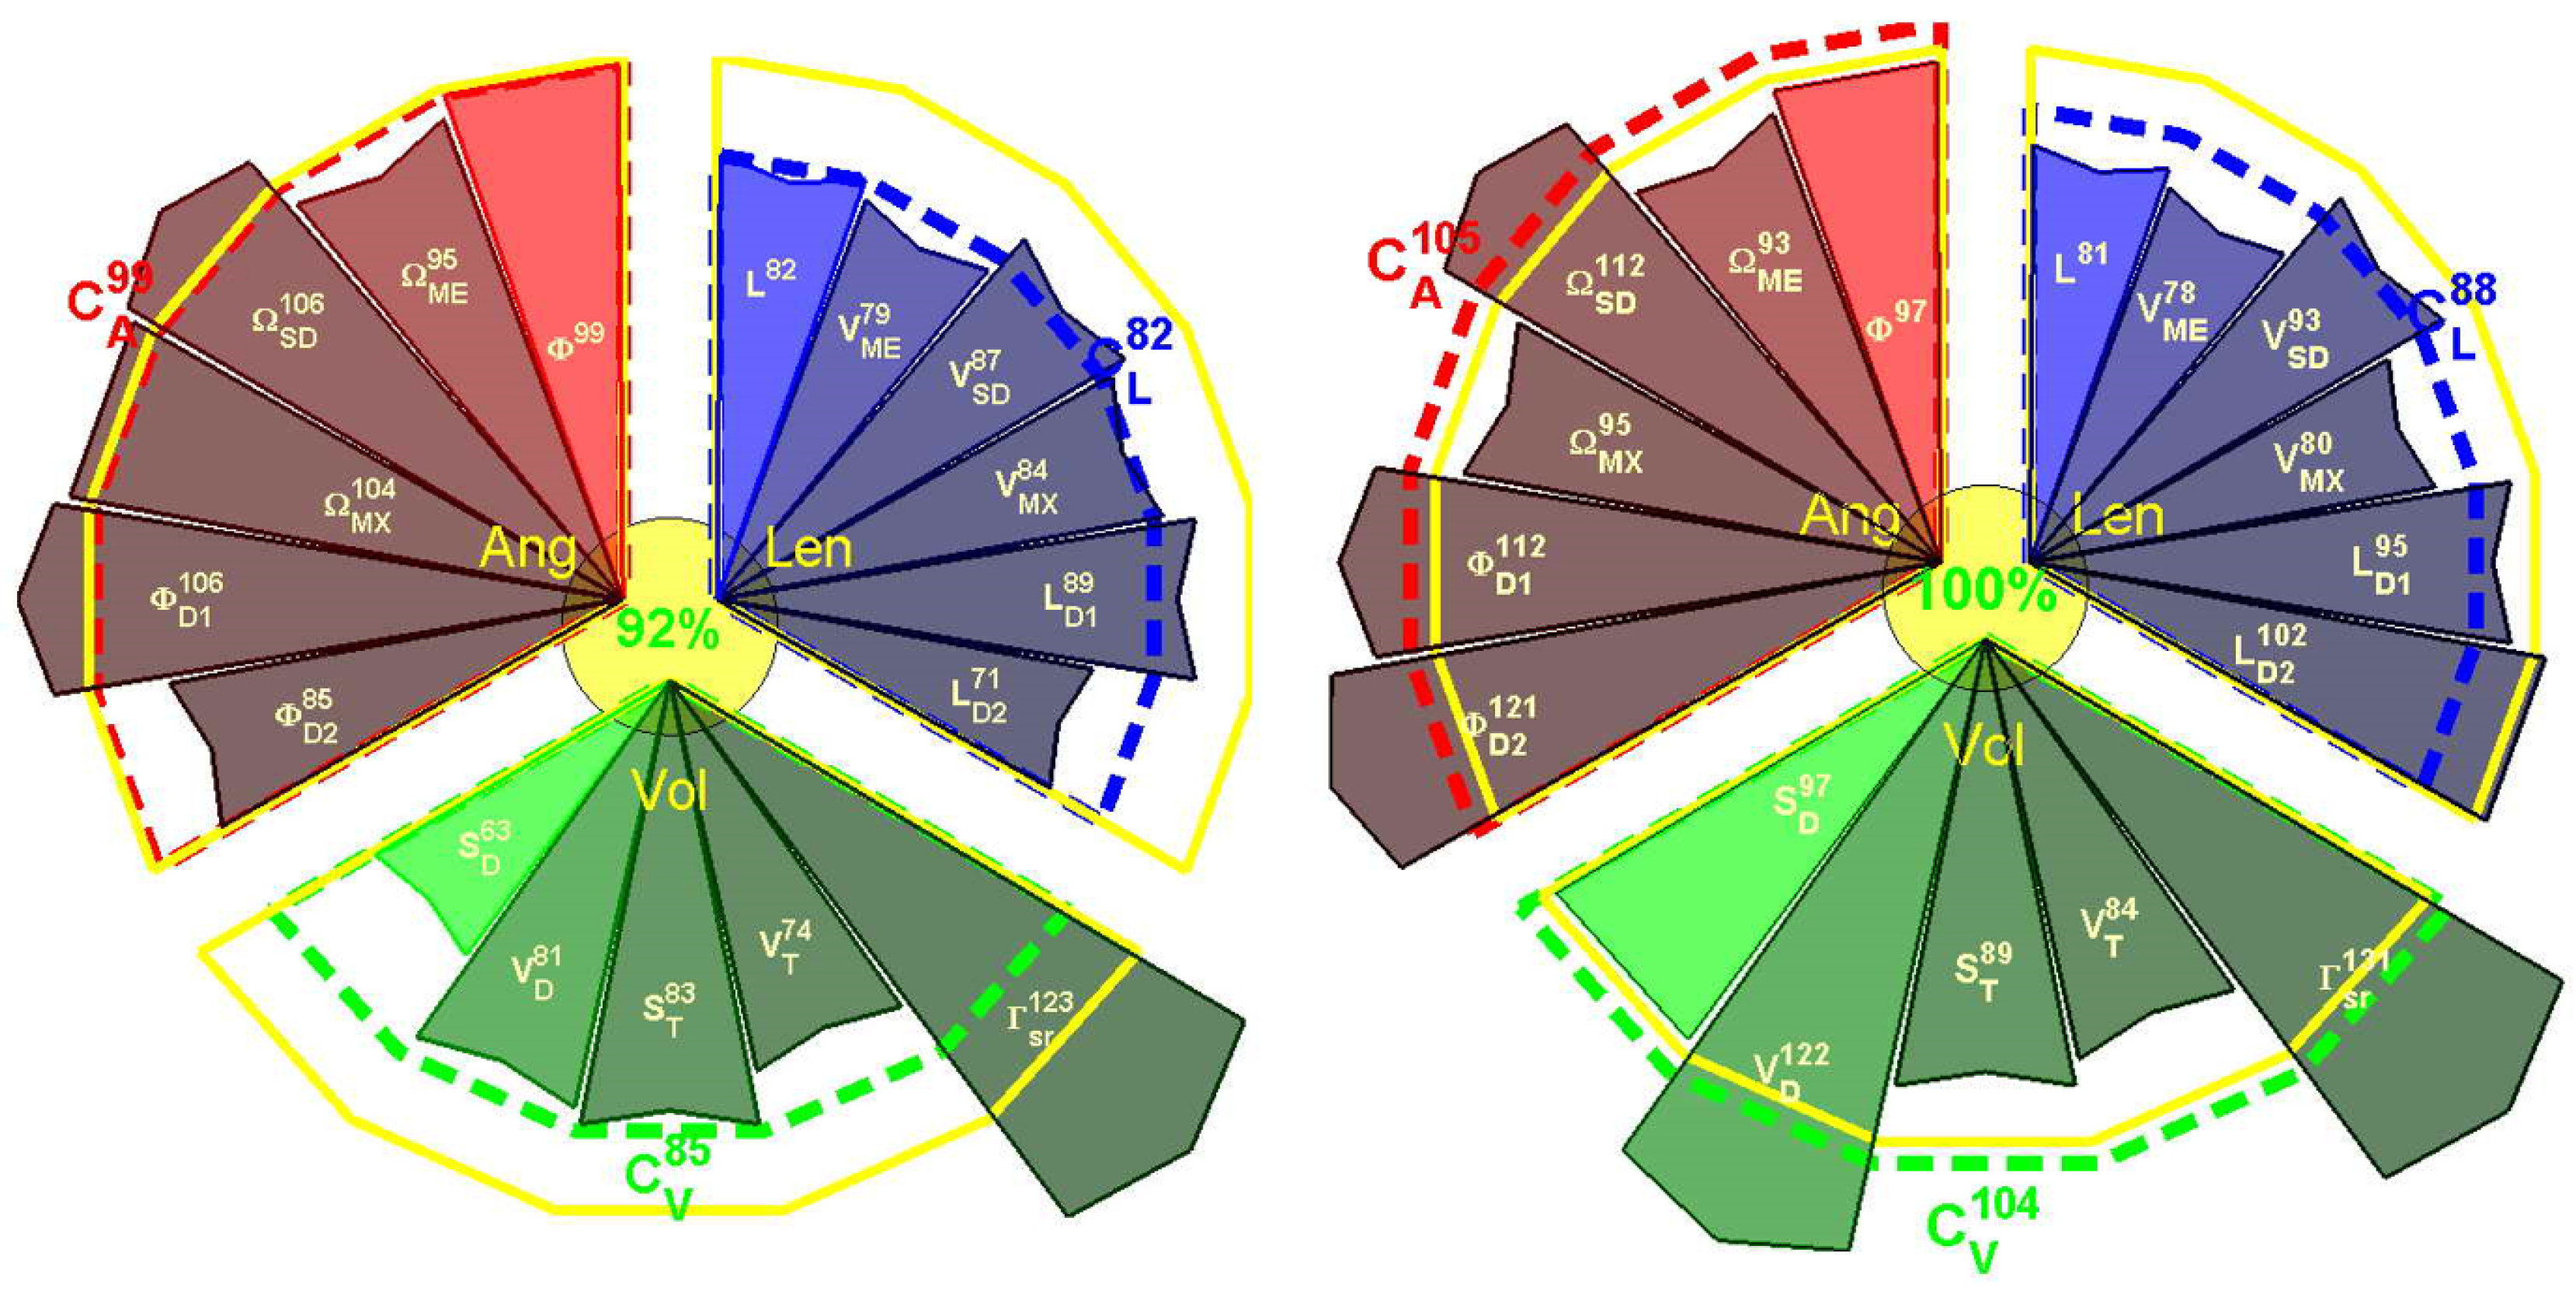
| Right Shoulder | Length (mm) | 0.71 * | 45 | 32 |
| Angle (deg) | 0.56 * | 32 | 41 | |
| Velocity (m/s) | 0.96 * | 31 | 18 | |
| Angular velocity (deg/s) | 0.50 | 71 | 47 | |
| Volume (mm) | 0.73 * | 65 | 45 | |
| Sphere (cm) | 0.98 * | 63 | 40 | |
| Surface (mm) | 0.83 * | 52 | 53 | |
| Left Shoulder | Length (mm) | 0.72 * | 35 | 38 |
| Angle (deg) | 0.58 * | 46 | 41 | |
| Velocity (m/s) | 0.94 * | 31 | 19 | |
| Angular velocity (deg/s) | 0.56 | 67 | 44 | |
| Volume (mm) | 0.64 * | 54 | 55 | |
| Sphere (cm) | 0.96 * | 55 | 38 | |
| Surface (mm) | 0.98 * | 60 | 51 | |
| Right Wrist | Length (mm) | 0.71 * | 35 | 38 |
| Angle (deg) | 0.88 * | 21 | 26 | |
| Velocity (m/s) | 0.95 * | 33 | 16 | |
| Angular velocity (deg/s) | 0.51 | 58 | 75 | |
| Volume (mm) | 0.79 * | 57 | 40 | |
| Sphere (cm) | 0.97 * | 66 | 56 | |
| Surface (mm) | 0.98 * | 53 | 48 | |
| Left Wrist | Length (mm) | 0.68 * | 39 | 34 |
| Angle (deg) | 0.92 * | 16 | 24 | |
| Velocity (m/s) | 0.89 * | 28 | 15 | |
| Angular velocity (deg/s) | 0.47 | 57 | 46 | |
| Volume (mm) | 0.72 * | 41 | 49 | |
| Sphere (cm) | 0.88 * | 55 | 45 | |
| Surface (mm) | 0.95 * | 47 | 43 |
| Joint | Variables | Adults | Elderly | Stroke | p-Value |
|---|---|---|---|---|---|
| Right shoulder | Length (mm) | 3.81 × 10 (3.7 × 10) | 3.64 × 10 (9.1 × 10) | 5.71 × 10 (1.89 × 10) | 0.21 |
| Angle (deg) | 2.95 × 10 (1.3 × 10) | 1.12 × 10 (7.2 × 10) | 1.11 (5.2 × 10) | <0.001 | |
| Velocity (m/s) | 0.21 (0.09) | 0.12 (0.06) | 0.10 (0.4) | <0.001 | |
| Angular velocity (deg/s) | 315 (283) | 403 (775) | 329 (221) | 0.71 | |
| Volume (mm) | 6.21 × 10 (2.1 × 10) | 8.12 × 10(1.6 × 10) | 6.94 × 10 (1.53 × 10) | 0.12 | |
| Sphere (cm) | 3.52 × 10 (2.1 × 10) | 7.68 × 10 (2.4 × 10) | 4.85 × 10 (1.4 × 10) | 0.04 | |
| Surface (mm) | 6.25 × 10 (2.5 × 10) | 2.31 × 10 (8.9 × 10) | 3.62 × 10 (3.1 × 10) | 0.07 | |
| Left Shoulder | Length (mm) | 3.88 × 10 (1.6 × 10) | 2.96 × 10 (3.4 × 10) | 4.38 × 10 (1.0 × 10) | 0.64 |
| Angle (deg) | 2.72 × 10 (1.2 × 10) | 1.23 × 10 (7.2 × 10) | 1.2 × 10 (5.1 × 10) | <0.001 | |
| Velocity (m/s) | 0.19 (0.06) | 0.13 (0.06) | 0.10 (0.04) | <0.001 | |
| Angular velocity (deg/s) | 271 (251) | 344 (230) | 345 (317) | 0.61 | |
| Volume (mm) | 6.13 × 10 (4.6 × 10) | 1.17 × 10 (1.1 × 10) | 7.71 × 10 (1.3 × 10) | 0.13 | |
| Sphere (cm) | 3.81 × 10 (8.4 × 10) | 1.18 × 10 (2.3 × 10) | 4.18 × 10 (1.30 × 10) | 0.03 | |
| Surface (mm) | 6.27 × 10 (1.4 × 10) | 9.8 × 10 (1.9 × 10) | 3.36 × 10 (5.8 × 10) | 0.06 | |
| Right Wrist | Length (mm) | 3.77 × 10 (3.1 × 10) | 5.58 × 10 (5.2 × 10) | 5.9 × 10 (7.5 × 10) | 0.04 |
| Angle (deg) | 3.13 × 10 (3.2 × 10) | 3.89 × 10 (8.43 × 10) | 7.91 × 10 (1.2 × 10) | 0.03 | |
| Velocity (m/s) | 0.23 (0.09) | 0.13 (0.07) | 0.10 (0.04) | <0.001 | |
| Angular velocity (deg/s) | 280 (226) | 351 (242) | 323 (311) | 0.58 | |
| Volume (mm) | 7.01 × 10 (1.2 × 10) | 1.12 × 10 (1.5 × 10) | 5.67 × 10 (8.44 × 10) | 0.04 | |
| Sphere (cm) | 5.81 × 10 (7.1 × 10) | 8.41 × 10 (9.0 × 10) | 6.11 × 10 (5.5 × 10) | 0.21 | |
| Surface (mm) | 5.92 × 10 (1.2 × 10) | 1.33 × 10 (2.8 × 10) | 2.71 × 10 (6.4 × 10) | 0.03 | |
| Left Wrist | Length (mm) | 3.69 × 10 (3 × 10) | 5.57 × 10 (4.2 × 10) | 5.29 × 10 (4.3 × 10) | 0.04 |
| Angle (deg) | 3.11 × 10 (3.3 × 10) | 3.64 × 10 (6.1 × 10) | 6.33 × 10 (7.6 × 10) | 0.03 | |
| Velocity (m/s) | 0.31 (0.14) | 0.12 (0.07) | 0.11 (0.05) | <0.001 | |
| Angular velocity (deg/s) | 281 (246) | 384 (314) | 294 (245) | 0.22 | |
| Volume (mm) | 6.84 × 10 (1.1 × 10) | 1.52 × 10 (2.65 × 10) | 5.91 × 10 (9.1 × 10) | 0.03 | |
| Sphere (cm) | 5.89 × 10 (6.4 × 10) | 5.44 × 10 (6.1 × 10) | 4.12 × 10 (5.4 × 10) | 0.42 | |
| Surface (mm) | 4.61 × 10 (9.8 × 10) | 1.41 × 10 (2.6 × 10) | 3.42 × 10 (2.6 × 10) | 0.02 |
© 2018 by the authors. Licensee MDPI, Basel, Switzerland. This article is an open access article distributed under the terms and conditions of the Creative Commons Attribution (CC BY) license (http://creativecommons.org/licenses/by/4.0/).
Share and Cite
Bonnechère, B.; Sholukha, V.; Omelina, L.; Van Sint Jan, S.; Jansen, B. 3D Analysis of Upper Limbs Motion during Rehabilitation Exercises Using the KinectTM Sensor: Development, Laboratory Validation and Clinical Application. Sensors 2018, 18, 2216. https://doi.org/10.3390/s18072216
Bonnechère B, Sholukha V, Omelina L, Van Sint Jan S, Jansen B. 3D Analysis of Upper Limbs Motion during Rehabilitation Exercises Using the KinectTM Sensor: Development, Laboratory Validation and Clinical Application. Sensors. 2018; 18(7):2216. https://doi.org/10.3390/s18072216
Chicago/Turabian StyleBonnechère, Bruno, Victor Sholukha, Lubos Omelina, Serge Van Sint Jan, and Bart Jansen. 2018. "3D Analysis of Upper Limbs Motion during Rehabilitation Exercises Using the KinectTM Sensor: Development, Laboratory Validation and Clinical Application" Sensors 18, no. 7: 2216. https://doi.org/10.3390/s18072216
APA StyleBonnechère, B., Sholukha, V., Omelina, L., Van Sint Jan, S., & Jansen, B. (2018). 3D Analysis of Upper Limbs Motion during Rehabilitation Exercises Using the KinectTM Sensor: Development, Laboratory Validation and Clinical Application. Sensors, 18(7), 2216. https://doi.org/10.3390/s18072216