UV Light Illumination Can Improve the Sensing Properties of LaFeO3 to Acetone Vapor

State Key Laboratory for Crystal Materials, School of Physics, Shandong University, Jinan 250100, China
*
Authors to whom correspondence should be addressed.
Sensors 2018, 18(7), 1990; https://doi.org/10.3390/s18071990
Submission received: 3 June 2018
/
Revised: 16 June 2018
/
Accepted: 19 June 2018
/
Published: 21 June 2018
(This article belongs to the Section Chemical Sensors)
Abstract
:The synthesized LaFeO3 nanocrystalline sensor powders show positive response to sensing acetone vapor at 200 °C. The responses to acetone vapor (at 0.5, 1, 2, 5, 10 ppm) are 1.18, 1.22, 1.89, 3.2 and 7.83. To make the sensor operate at a lower optimum temperature, UV light illumination 365 nm is performed. Response of the sensor has a larger improvement under 365 nm UV light illumination than without it. The responses to acetone vapor (at 0.5, 1, 2, 5, 10 ppm) are 1.37, 1.85, 3.16, 8.32 and 14.1. Furthermore, the optimum operating temperature is reduced to 170 °C. As the relative humidity increases, the resistance and sensitivity of sensor are reduced. The sensor shows good selectivity toward acetone when compared with other gases. Since the detection of ultralow concentrations of acetone vapor is possible, the sensor can be used to preliminarily judge diabetes in the general public, as a high concentration of acetone is exhaled in breath of diabetic patients. The sensor shows a good stability, which is further enhanced under UV light illumination. The sensor shows better stability when under 365 nm UV light illumination. Whether under light illumination or not. The LaFeO3 material shows good performance as a sensor when exposed to acetone vapor.
1. Introduction
Acetone is a widely used material in several industrial applications [1]. It is a colorless and transparent liquid with a mild fruity odor. Because of its low cost and versatility, acetone has a great application value in chemical industry. However, acetone is volatile and flammable, and can explode when exposed to fire. Acetone is also physiologically hazardous to humans and animals. For example, it can cause headache and nausea, and can damage the central nervous system upon long-term exposure [2]. Furthermore, acetone at ultralow concentration levels exist in exhaled breath. The concentration of acetone in exhaled breath from healthy and diabetic people are different [3], which, therefore, can be used as a marker to judge if a person is diabetic or not. Therefore, development of a sensor that can detect low or ultralow concentration of acetone is necessary. There are some detectors such as quartz crystal microbalances and fiber-optic sensors already existing in hospitals or special and health inspection agencies. However, the above-mentioned analytical tools are either inconvenient or expensive. There is a need for an acetone sensor with high sensitivity and stability that is also economical, such that detection of the concentration of acetone in exhaled breath or in air is possible.
In the past decades, metal semiconductor oxides have attracted much attention for their high sensitivity and stability towards detecting acetone. The list includes TiO2 [4,5,6], NiO [7,8], ZnO [9,10,11,12,13], Co3O4 [14], Fe2O3 [15,16], WO3 [17,18], and SnO2 [19,20,21,22,23], which have been reported as acetone sensors with good performance. In recent years, perovskite structures (ABO3) such as NdFeO3 [24], SmFe1−xMgxO3 [25], Yb1−xCaxFeO3 [26], LaNi1−xTixO3 [27], SmFeO3 [28], LaFeO3 [29,30] and La0.75Ba0.25FeO3 [31] have also shown good sensitivity, stability and selectivity toward acetone. The sensors above are list in Table 1.
Although there have been some reports on the use of the acetone sensing property of LaFeO3, no studies exist on the influence of ultraviolet light on the sensor. In this work, acetone vapor sensing performance of LaFeO3 is researched. The LaFeO3 displays maximum sensitivity at acetone concentrations of 1.18, 1.22, 1.89, 3.2 and 7.83 to 0.5, 1, 2, 5 and 10 ppm at 200 °C of optimum temperature, which is decreased by the use of 365 nm UV light illumination as sensor irradiation during the testing process. Our results show that UV irradiation not only decreases the optimum operating temperature, but also improves the sensitivity to acetone vapor. The responses are 1.37, 1.85, 3.16, 8.32 and 14.1 to the same concentration of acetone vapor at 170 °C when the sensor is irradiated by UV light. The dynamic resistance curve of the sensor material was studied and the mechanism of sensitivity improvement upon UV light illumination explained. Since good selectivity and extremely low detection limit are obtained, this sensor can be used to preliminarily judge if a person is diabetic or not by detecting the concentration of acetone in the exhaled breath. The stability of the sensor was also measured every 3 days for one month. The LaFeO3 still showed good response and stability among all the materials that were investigated under light illumination.
2. Materials and Methods
2.1. Preparation
The nanocrystalline LaFeO3 powders are synthesized by a sol-gel method. At the beginning, according to a certain chemical proportion of lanthanum nitrate, ferric nitrate, PEG (molecular weight 20,000) and nitric acid (all of analytical grade purity) are weighed and mixed in deionized water. An appropriate amount of nitric acid is necessary. Then the raw materials are mixed together in deionized water with the PH regulated at about 1.5–2. The mixture is heated in a water bath at 80 °C for two days with continuous stirring to get a highly viscous sol which becomes a gel in the next few hours. The gel is dried in an oven at 100 °C for 24 h to produce dried powder which is then grinded to form a fine powder. The powder is preheated at 400 °C for 2 h, following which it was annealed in at 800 °C for 4 h in a furnace. The LaFeO3 product is obtained by grinding.
2.2. Vapor Sensing Measurements
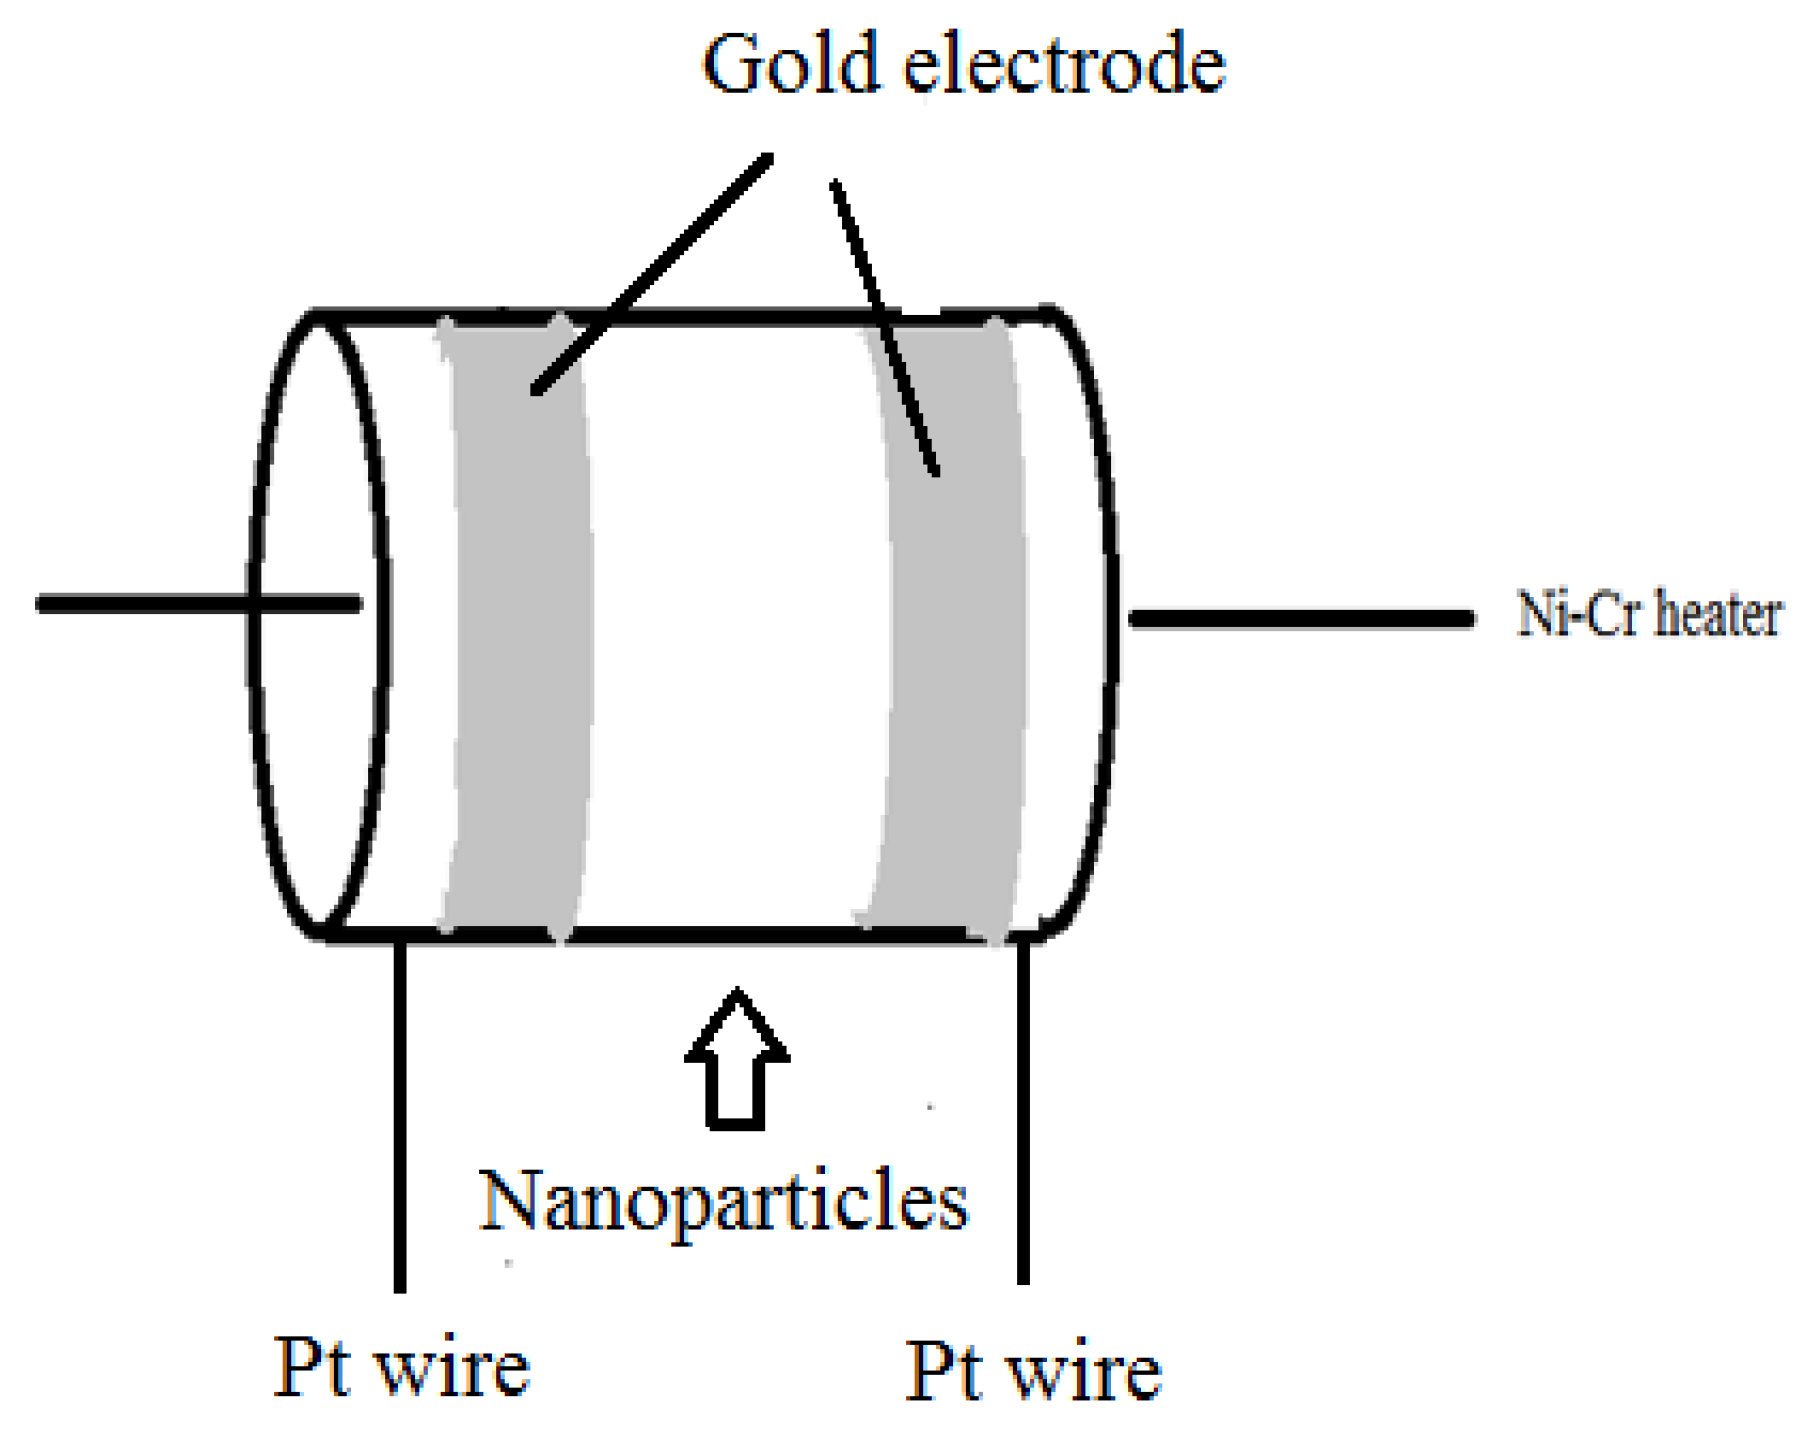
LaFeO3 is blended with an appropriate amount of deionized water to shape a slurry. The sensor shown in Figure 1 is fabricated by coating the pastes onto a ceramic tube. The ready-made sensors are heated at 240 °C for 24 h on the aging equipment. The micro-injector is used to regulate the acetone vapor concentrations by injecting an appropriate amount of liquid acetone at first. The measuring instrument (WS-30A, Wei Sheng Electronic Technology Co., Ltd., Zhengzhou, China) is used to detect sensitivity of sensors. The complete preparation process is maintained at room temperature, and the room humidity is 20% RH. The vapor sensitivity performance S is defined as Rg/Ra. Ra is the resistance when the sensor is in air and the Rg is the resistance in the tested vapor. The response and recovery time are defined as the time taken to get 90% of the varied response after introducing and removing the tested vapor.
2.3. Characterization
X-ray diffractometer (XRD) using CuKα radiation is employed as a characterization technology to help us analyze the structure of the power. The element distribution is analyzed by energy-dispersive X-ray spectroscopy (EDAX). The nanostructure of LaFeO3 is analyzed by field emission scanning electron microscopy (FE-SEM).
3. Result and Discussion
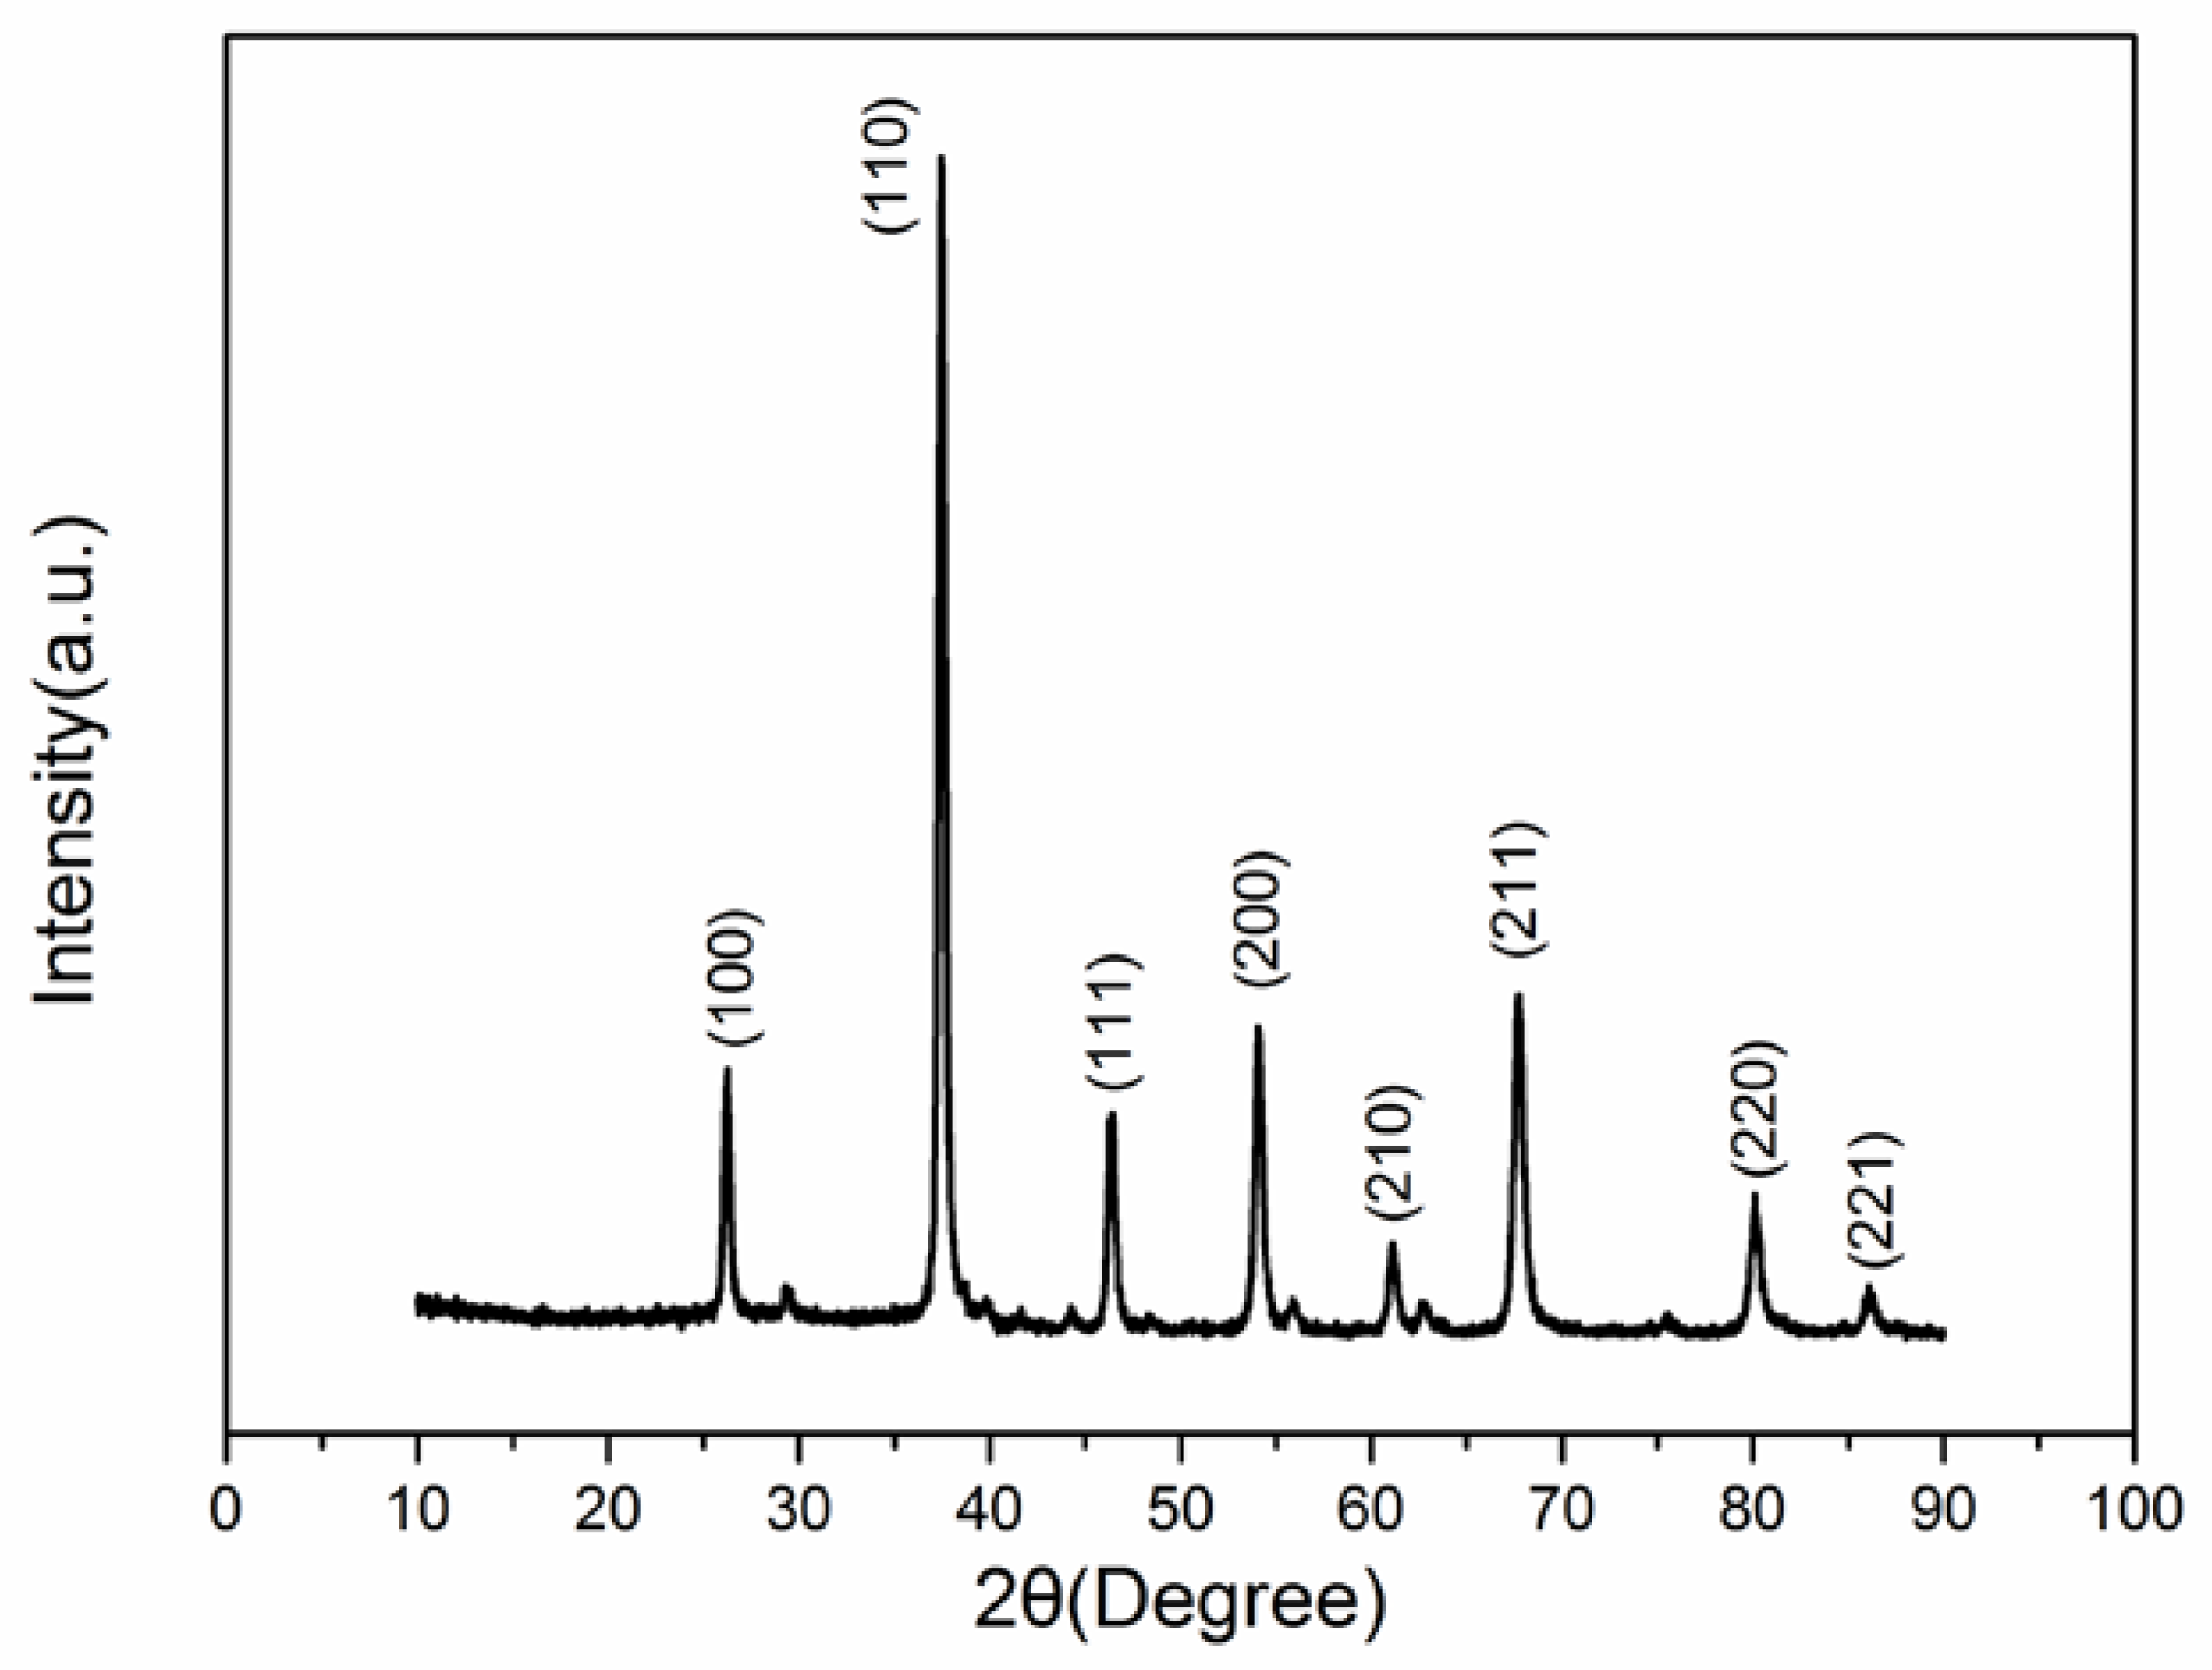
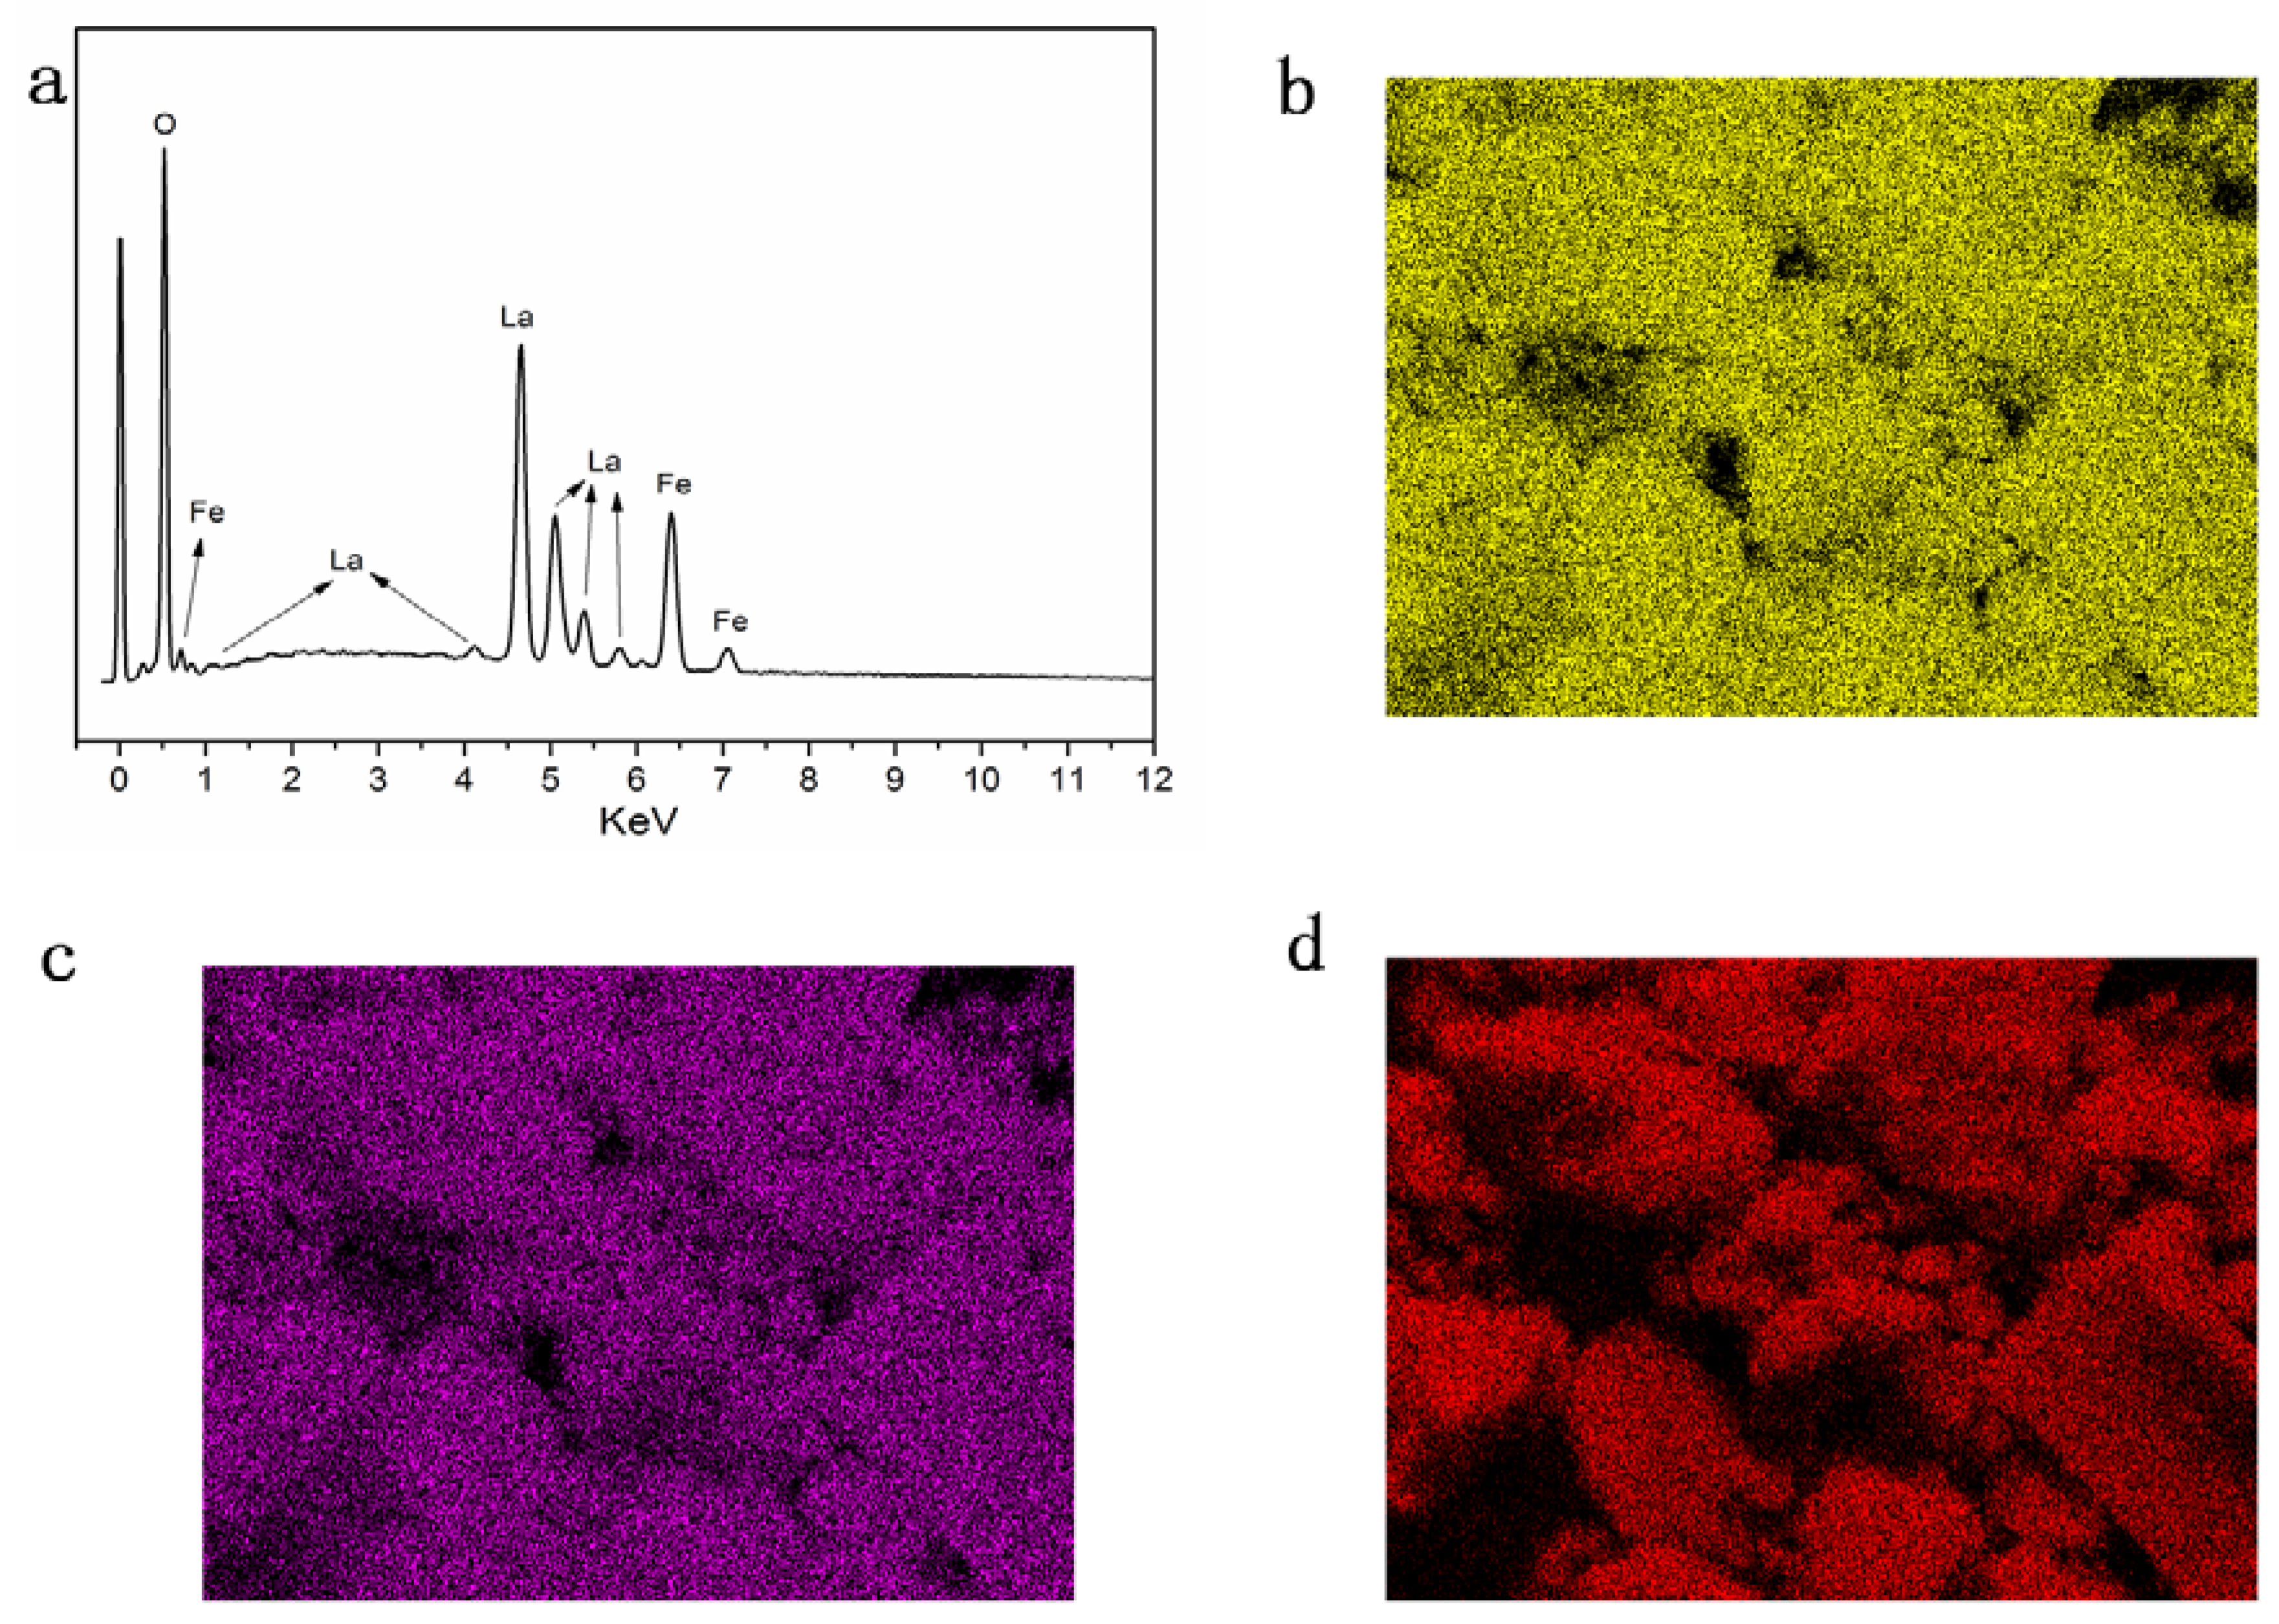
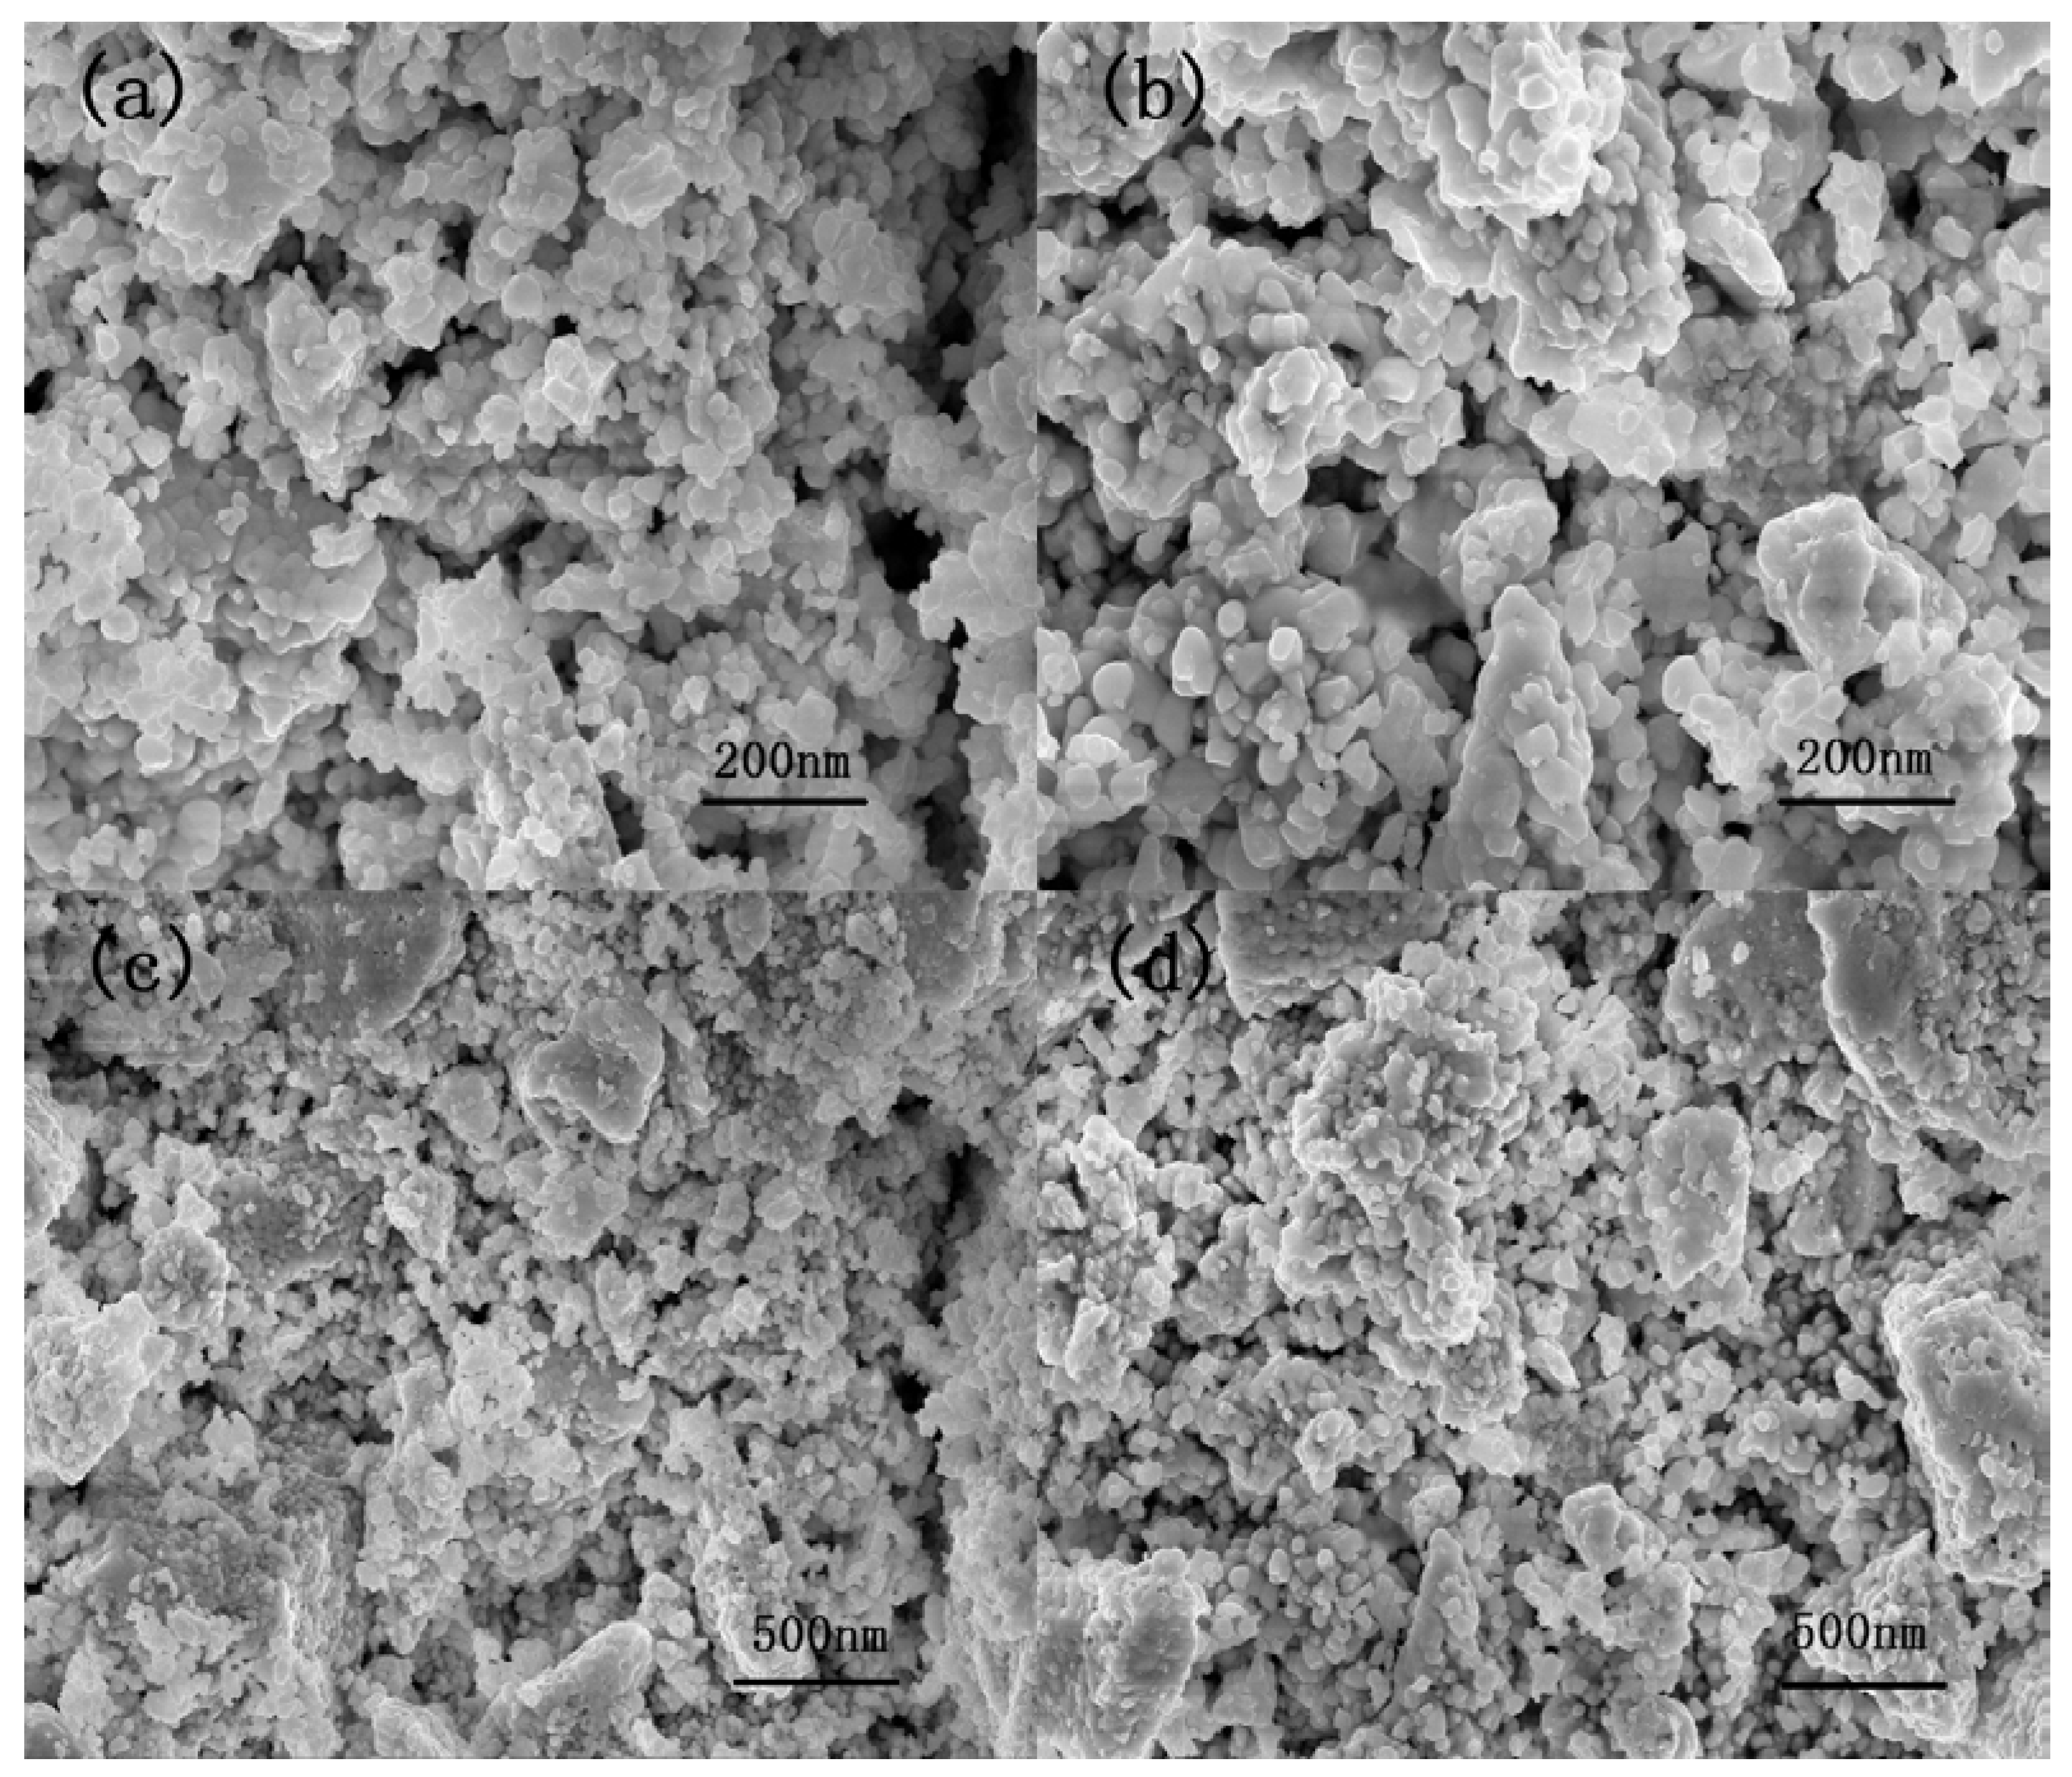
Figure 2 shows the XRD of LaFeO3 material annealed at 800 °C. It is clear that the material shows a single perovskite structure in agreement with the standard PDF card: 75-0541. To make sure that there are no other elements in the semiconductor, EDS and EDAX mapping are performed, and the results are shown in Figure 3. It can be seen that the three elements above are contained in the material, and there are no other elements except O, Fe and La elements. Figure 4 shows the microstructure observed under different magnifications for LaFeO3 material annealed at 800 °C. The average particle size of the LaFeO3 material was estimated to be less than 80 nm.
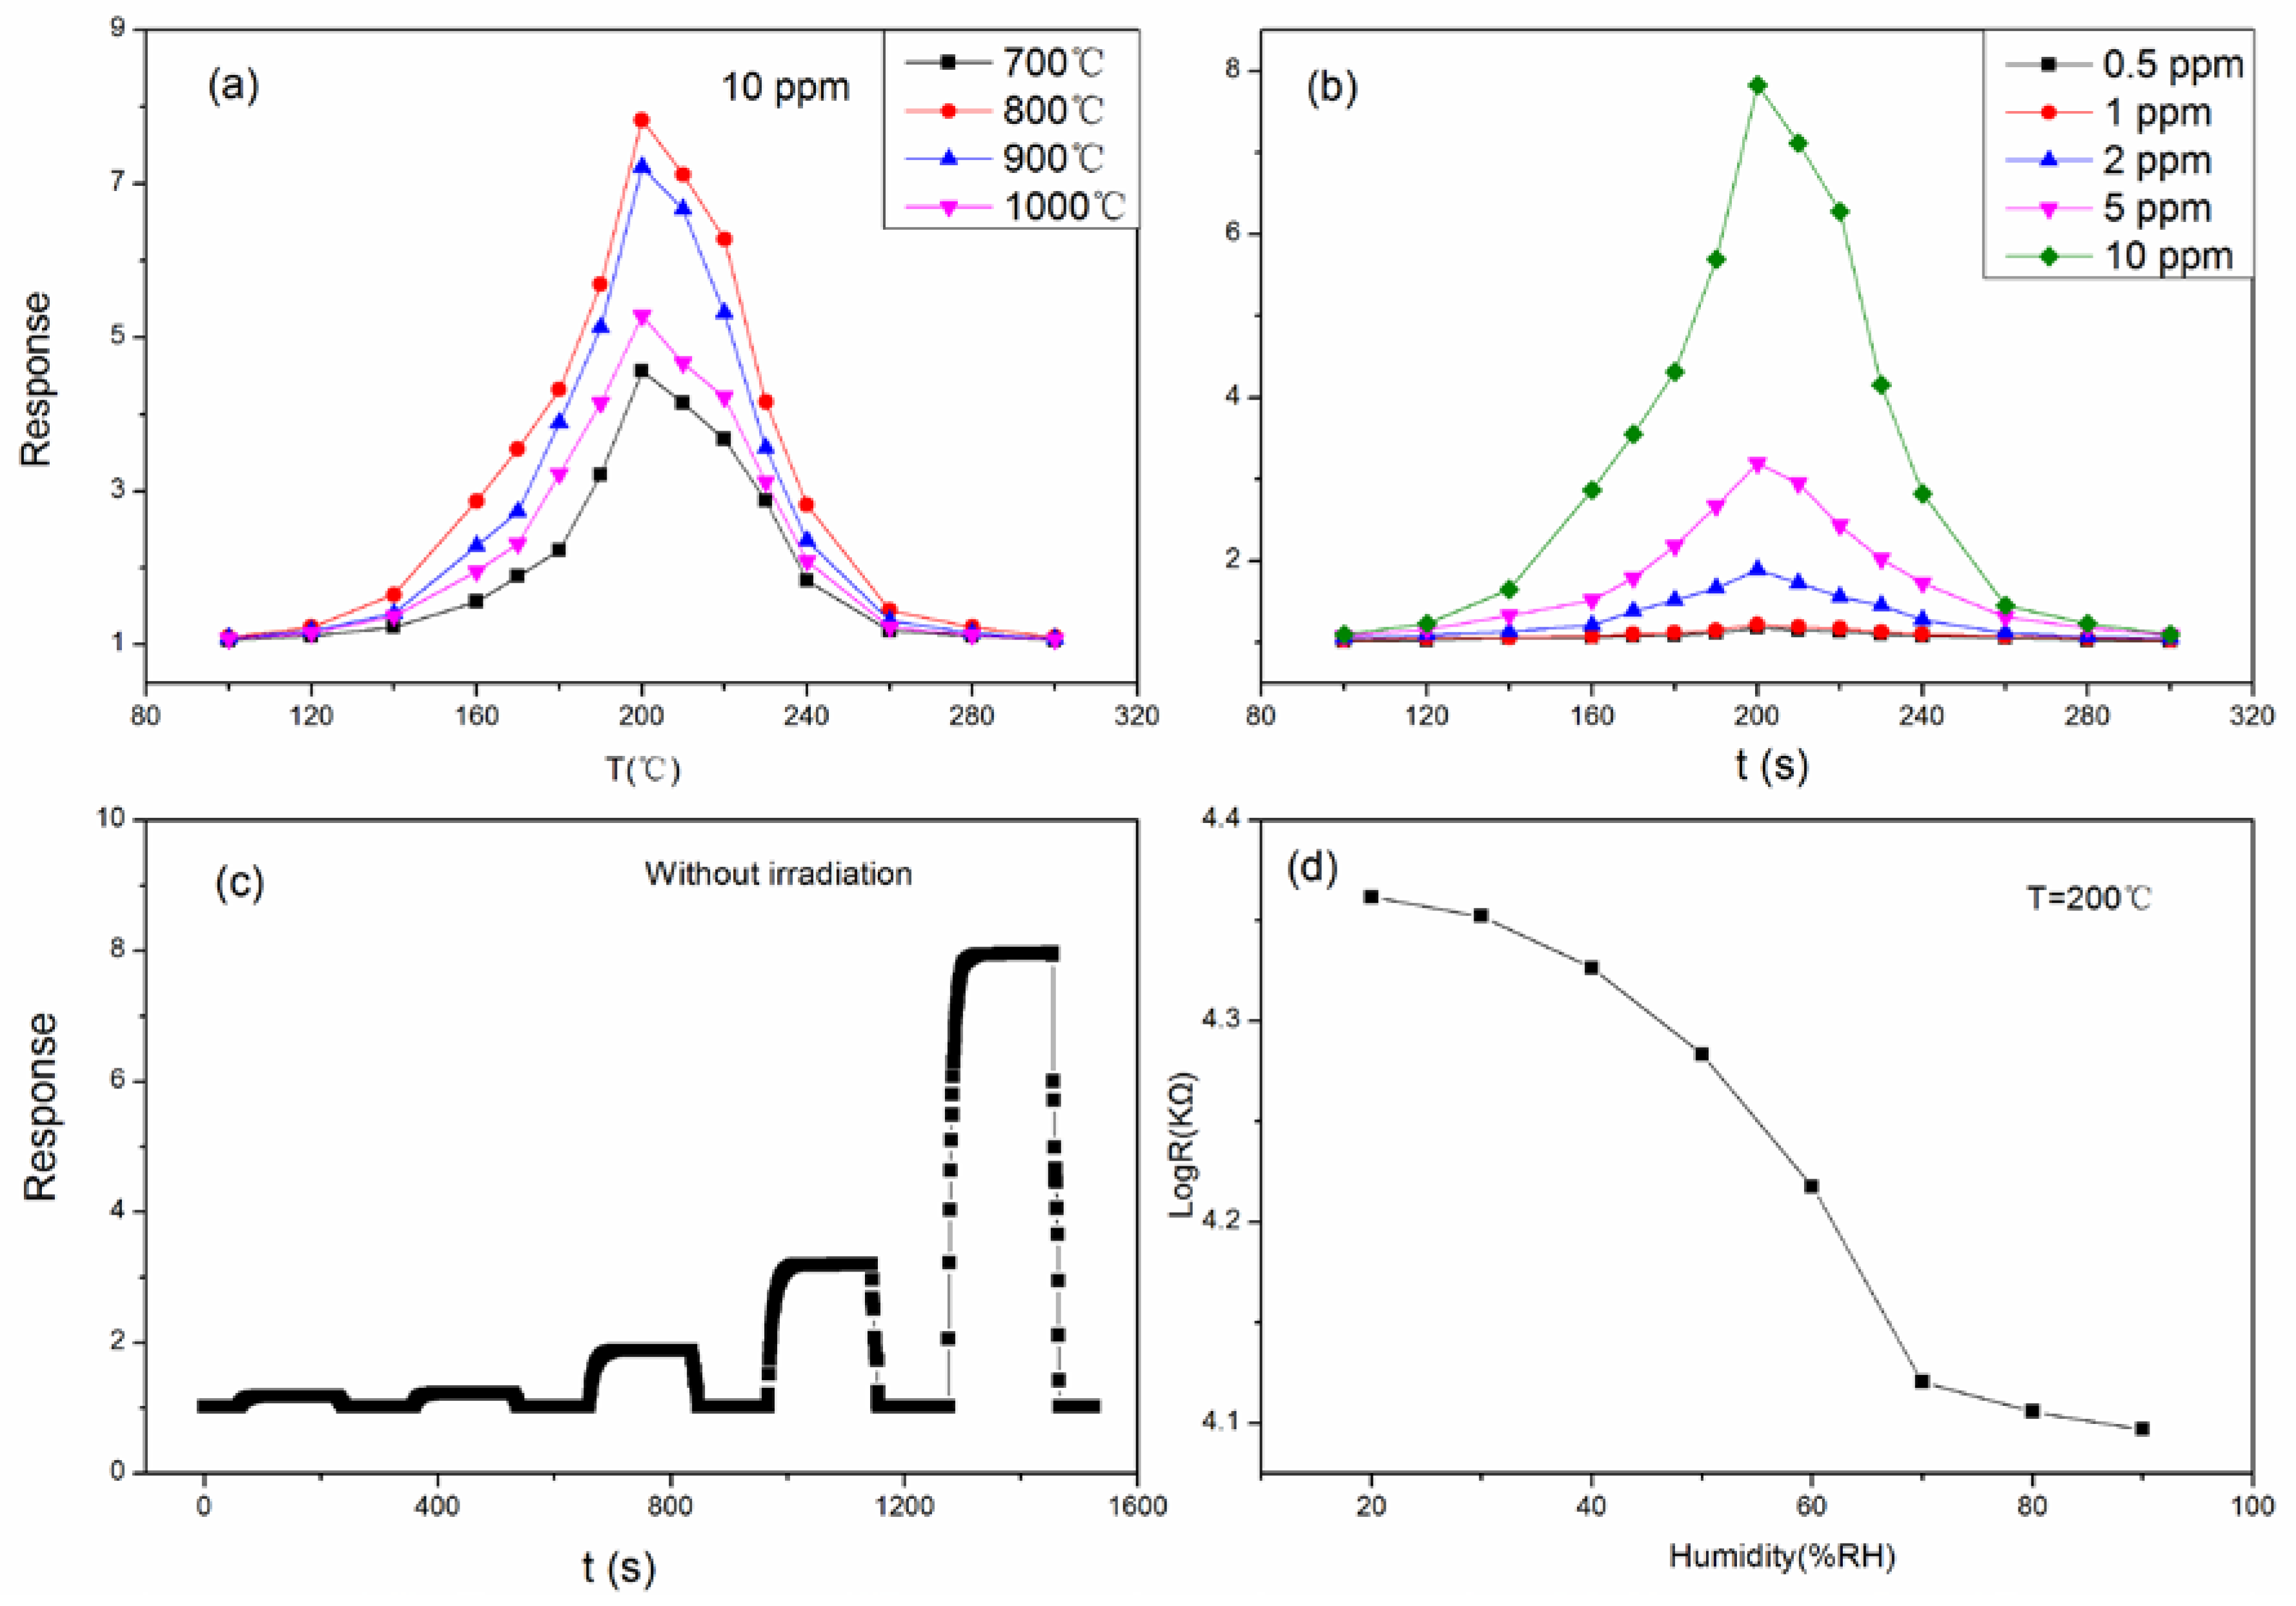
Figure 5a shows the sensing response of LaFeO3 annealed at different temperatures (700, 800, 900, 1000 °C) to 10 ppm acetone vapor. The responses are 4.56, 7.83, 7.22 and 5.28, respectively, at the optimum operating temperature of 200 °C. LaFeO3 annealed at 800 °C showed the maximum response. Next, we focused on investigating in detail the sensing proprieties of LaFeO3 material annealed at 800 °C. The responses obtained toward different concentrations of acetone vapor at different temperature are shown in Figure 5b. The maximum responses toward 0.5, 1, 2, 5 and 10 ppm acetone vapor are 1.18, 1.22, 1.89, 3.2 and 7.83, respectively. The optimum operating temperature for all measurements was 200 °C. The dynamic response curves for LaFeO3 to different concentration of acetone vapor at 200 °C are shown in Figure 5c. Since the response is define as Rg/Ra, the sensor is p-type if the response is greater than 1. The dynamic curves of the response are the same as the dynamic curves of the resistance of the sensor. The resistance of the sensor is kept relatively steady before acetone vapor is introduced. Upon the introduction of acetone vapor, the resistance increases rapidly. When the resistance reaches the maximum value, it soon maintains a relatively stable state. When the tested vapor is removed, the Rg/Ra response of the sensor decreases rapidly, which means the resistance of sensor decreases rapidly. All the sensors have a short response and recovery time. The response and recovery times of LaFeO3 to 10 ppm acetone vapor are 21 s and 6 s, respectively. There is adsorption oxygen on the sensor’s surface, adsorbed from the outside air. Meanwhile, the absorbed oxygen also desorbs from the sensor’s surface to the outside medium. However, the rate of oxygen absorption is greater than that for oxygen desorption at low temperature; therefore, much adsorption oxygen remains on the sensor’s surface. Adsorbed oxygen causes a series of chemical reactions to become anionic oxygen as shown through following chemical reactions:
O2 (gas) + e− → O2− (adsorption),
O2− (adsorption) + e− → 2O− (adsorption),
2O− (adsorption) + h+ → O2− (adsorption),
The h+ means the holes with positive charge.
After the acetone vapor is introduced, the oxygen species containing O− and O2− will react with acetone molecules, resulting in the increase of sensor sensitivity. With the rise in temperature, the rates of oxygen adsorption and desorption are improved, with the rate of adsorption becoming greater than that of desorption. Therefore, the amount of oxygen species increases on sensor’s surface. At 200 °C, the amount of oxygen species reaches the maximum value, which means that the chemical reaction between acetone molecules and oxygen species is the most efficient and the sensor shows maximum sensitivity toward acetone vapors. On the other hand, the energy from the rise in temperature provides the required activation energy for the reaction with the electron transfer in the chemical reaction to reach a maximum, which is also an important factor in improving the sensitivity toward acetone vapor. With a further increase in the temperature, the rate of oxygen desorption is improved by the heat energy from the rise in temperature. Additionally, the acetone vapor also begins to desorb from the surface of sensor. A small amount of acetone molecules also reacts with oxygen species, resulting in a declining trend in the sensor sensitivity. The following are the possible reactions occurring:
CH3COCH3 (vapor) + 8O− (adsorption) → 3CO2 + 3H2O + 8e−,
e− + h+ → null + energy,
The h+ means the holes with positive charge.
The dynamic resistance change curve of LaFeO3 in varied relative humidity is shown in Figure 5d. As the humidity increases, the resistance decreases. Especially from 40% to 70%, the decreasing trend is clear. Water molecules adsorbed on the surface of the sensor increase with the rise in humidity. At high temperature, the OH groups rather than H2O molecule exist on the surface of the semiconductor, and the other neutral H atom reacts with the lattice oxygen to form another OH and to form holes in the sensor. Concentration of holes increases with the increase in OH, decreasing the resistance of sensor.
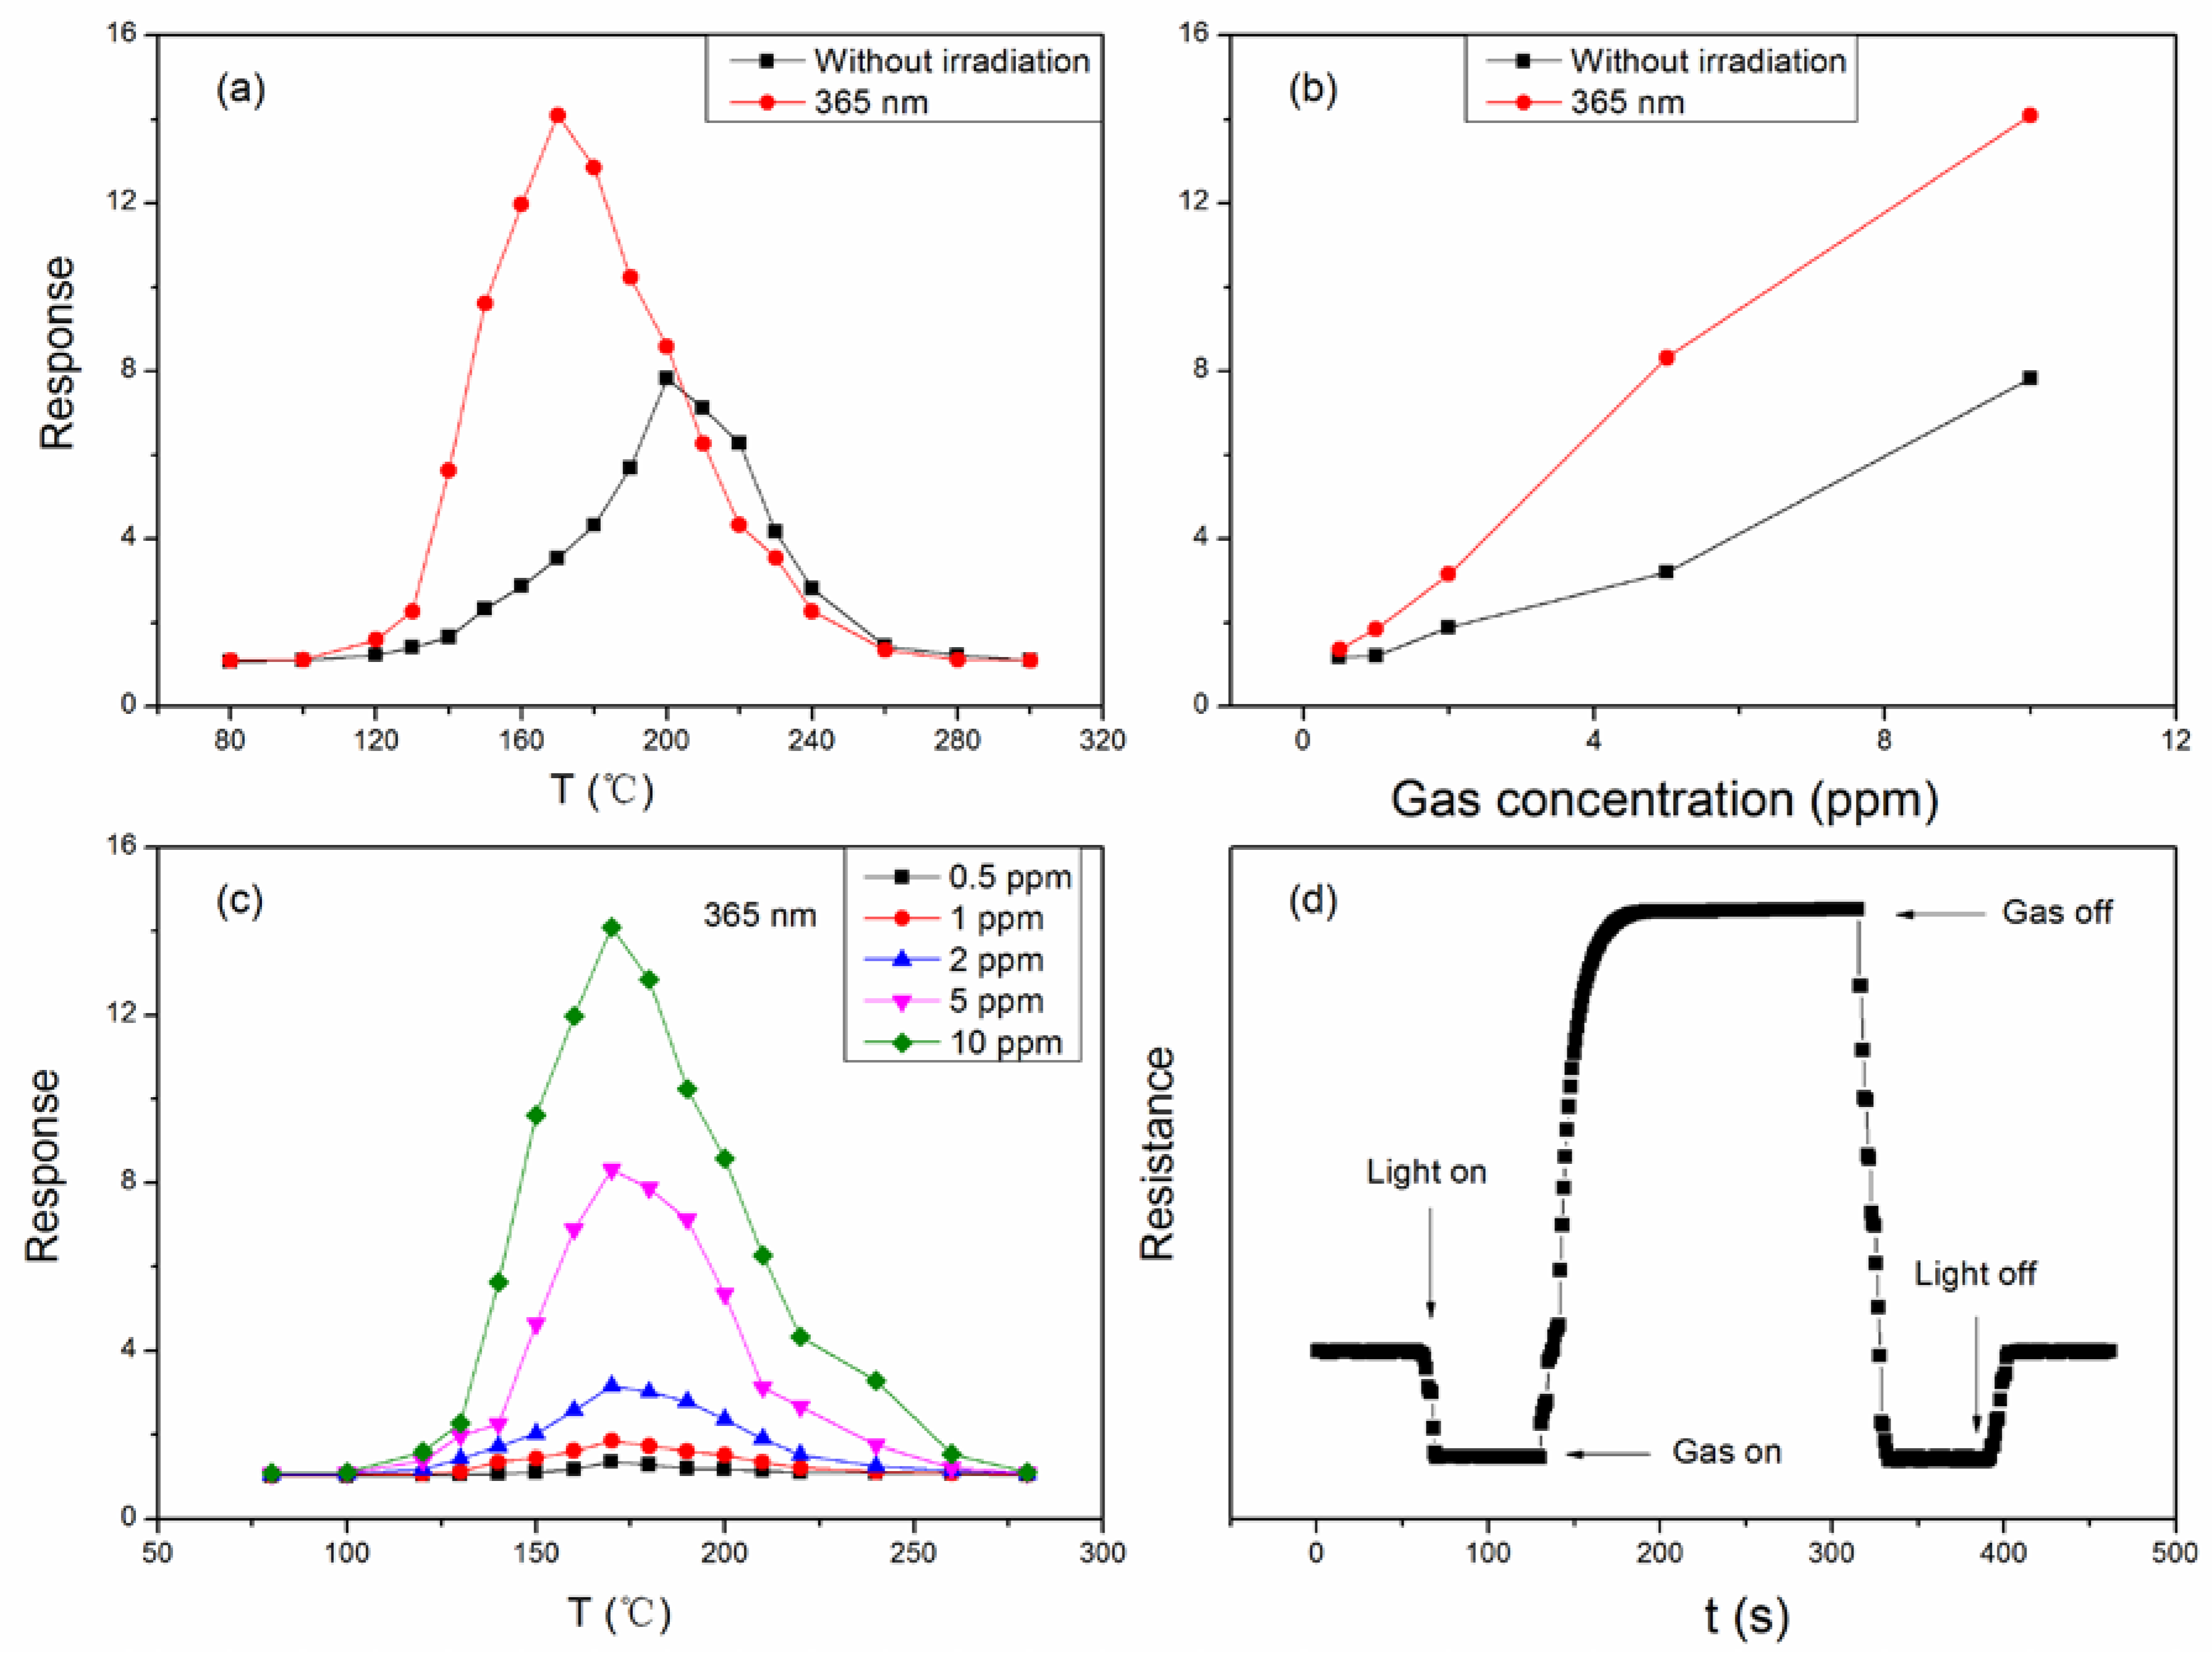
The optimum operating temperature of 200 °C for the sensor is rather high, and then the acetone becomes dangerous. Therefore, from a practicality perspective, the optimum operation temperature of the sensor should be reduced. A UV-LED with 365 nm wavelength was introduced to irradiate the vapor sensor in this measurement system. The power consumption of the UV-LED was 50 mW. From Figure 6a, we can see that when the UV light is introduced, the optimum operating temperature is lower than that that without the UV light. The optimum operating temperature is 170 °C when the wavelength of the UV radiation is 365 nm. The smaller the wavelength, the lower the optimum operating temperature will be. In addition, compared with the natural environment, there is a big change in the response of the sensor when it is illuminated under UV light. The response of the sensor is 14.1 to 10 ppm acetone vapor when the wavelength is 365 nm, compared with a response of 7.83 in the natural environment. Light illumination has a positive effect and promotes the sensitivity of the sensor toward acetone. Figure 6b shows the response of the sensor with light illumination (red) and without irradiation (black) to different concentrations of acetone vapor at the optimum operating temperature. The response increases when the concentration of acetone increases. At lower concentrations of acetone vapor, the response of the sensor under UV light shows little difference compared to the response of the sensor without UV light illumination. However, the response of the sensor under UV light illumination increases more pronouncedly than that of the sensor without irradiation. Figure 6c shows the responses of the sensor under light illumination toward acetone vapor at different concentrations. The sensitivity is improved under the UV light illumination. Toward 0.5–10 ppm acetone, responses are 1.37, 1.85, 3.16, 8.32 and 14.1 under UV light illumination with a wavelength of 365 nm.
The dynamic curve of resistance for LaFeO3 under UV light illumination of 365 nm wavelength at 170 °C to acetone vapor of varying concentration is shown in Figure 6d. The resistance of the sensor was kept constant before the UV light was turned on. Upon the introduction of the UV light in the measuring system, the resistance soon starts to decrease rapidly and reach a stable value. The sensor absorbs energy from the light illumination and generates electron-hole pairs. The light-induced holes arrive on the surface of sensor, and capture electrons from the oxygen species, which will become oxygen molecules and desorb from the sensor surface. However, the number of oxygen species on the surface of the sensor is large; especially for p-type Fe-based perovskites [35], a lot of oxygen species will leave the sensor surface. When the acetone vapor is injected into the glass, the resistance will rise quickly and reach a stable value. The products thus produced by a chemical reaction between acetone molecules and the oxygen species will react with acetone molecules to trap electrons. The light-induced hole can trap OH− from acetone to form OH•, which has strong oxidation capability. Thus, OH• can speed up the reaction between acetone molecules and oxygen species. As the number of holes decreases, resistance of the sensor increases. The plausible reactions are:
LaFeO3 + hv → e− + h+,
h+ + OH− → OH•,
h+ + O2− → O•,
CH3COCH3 + O2− + OH• → CO2 + H2O + e−,
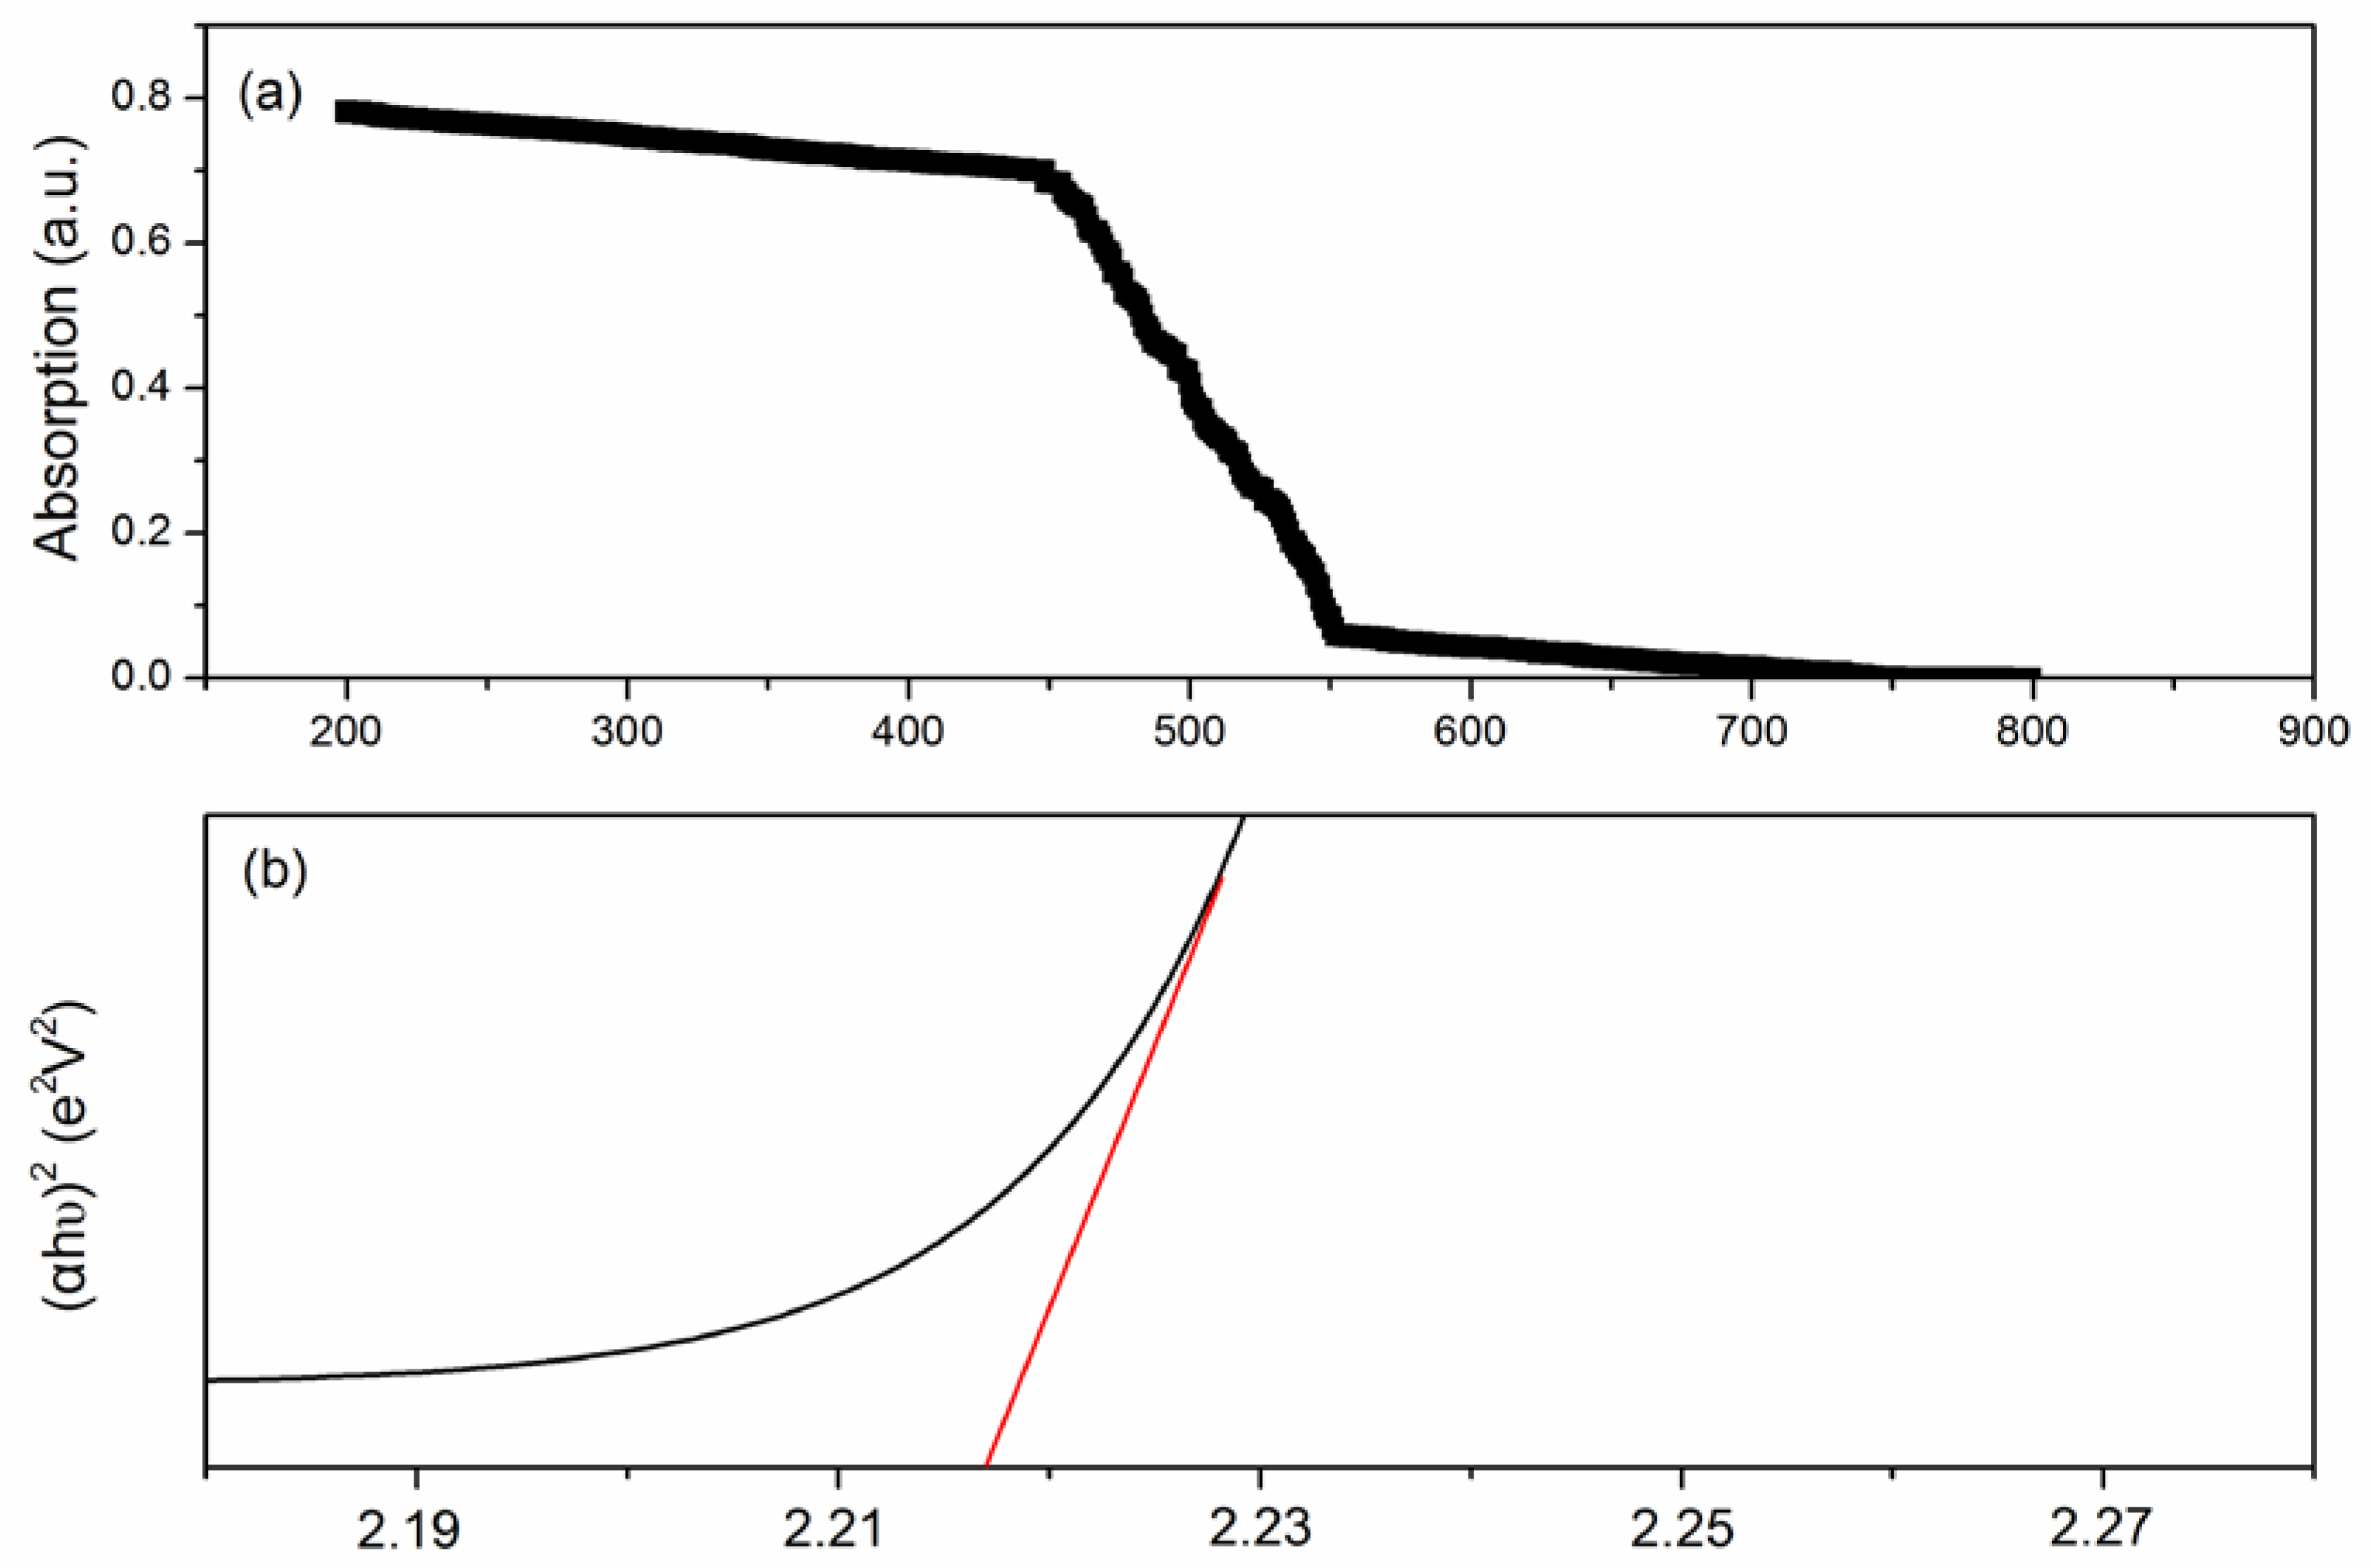
Figure 7a shows the UV-visible diffuse reflectance spectra of LaFeO3. By calculation, Figure 8a is obtained. We can see that the band gap of LaFeO3 is about 2.218. The photon energy that the sensor can absorb is obtained through the formula: Eg = 1240/λ (λ is the wavelength of light). The photon energy is 3.39 eV (365 nm). The photon energy of the violet light (wavelength λ = 365 nm) is larger than the band gap of LaFeO3. Therefore, we can draw the conclusion that the sensitivity can be influenced or improved when the photons energy is larger than band gap of sensor.
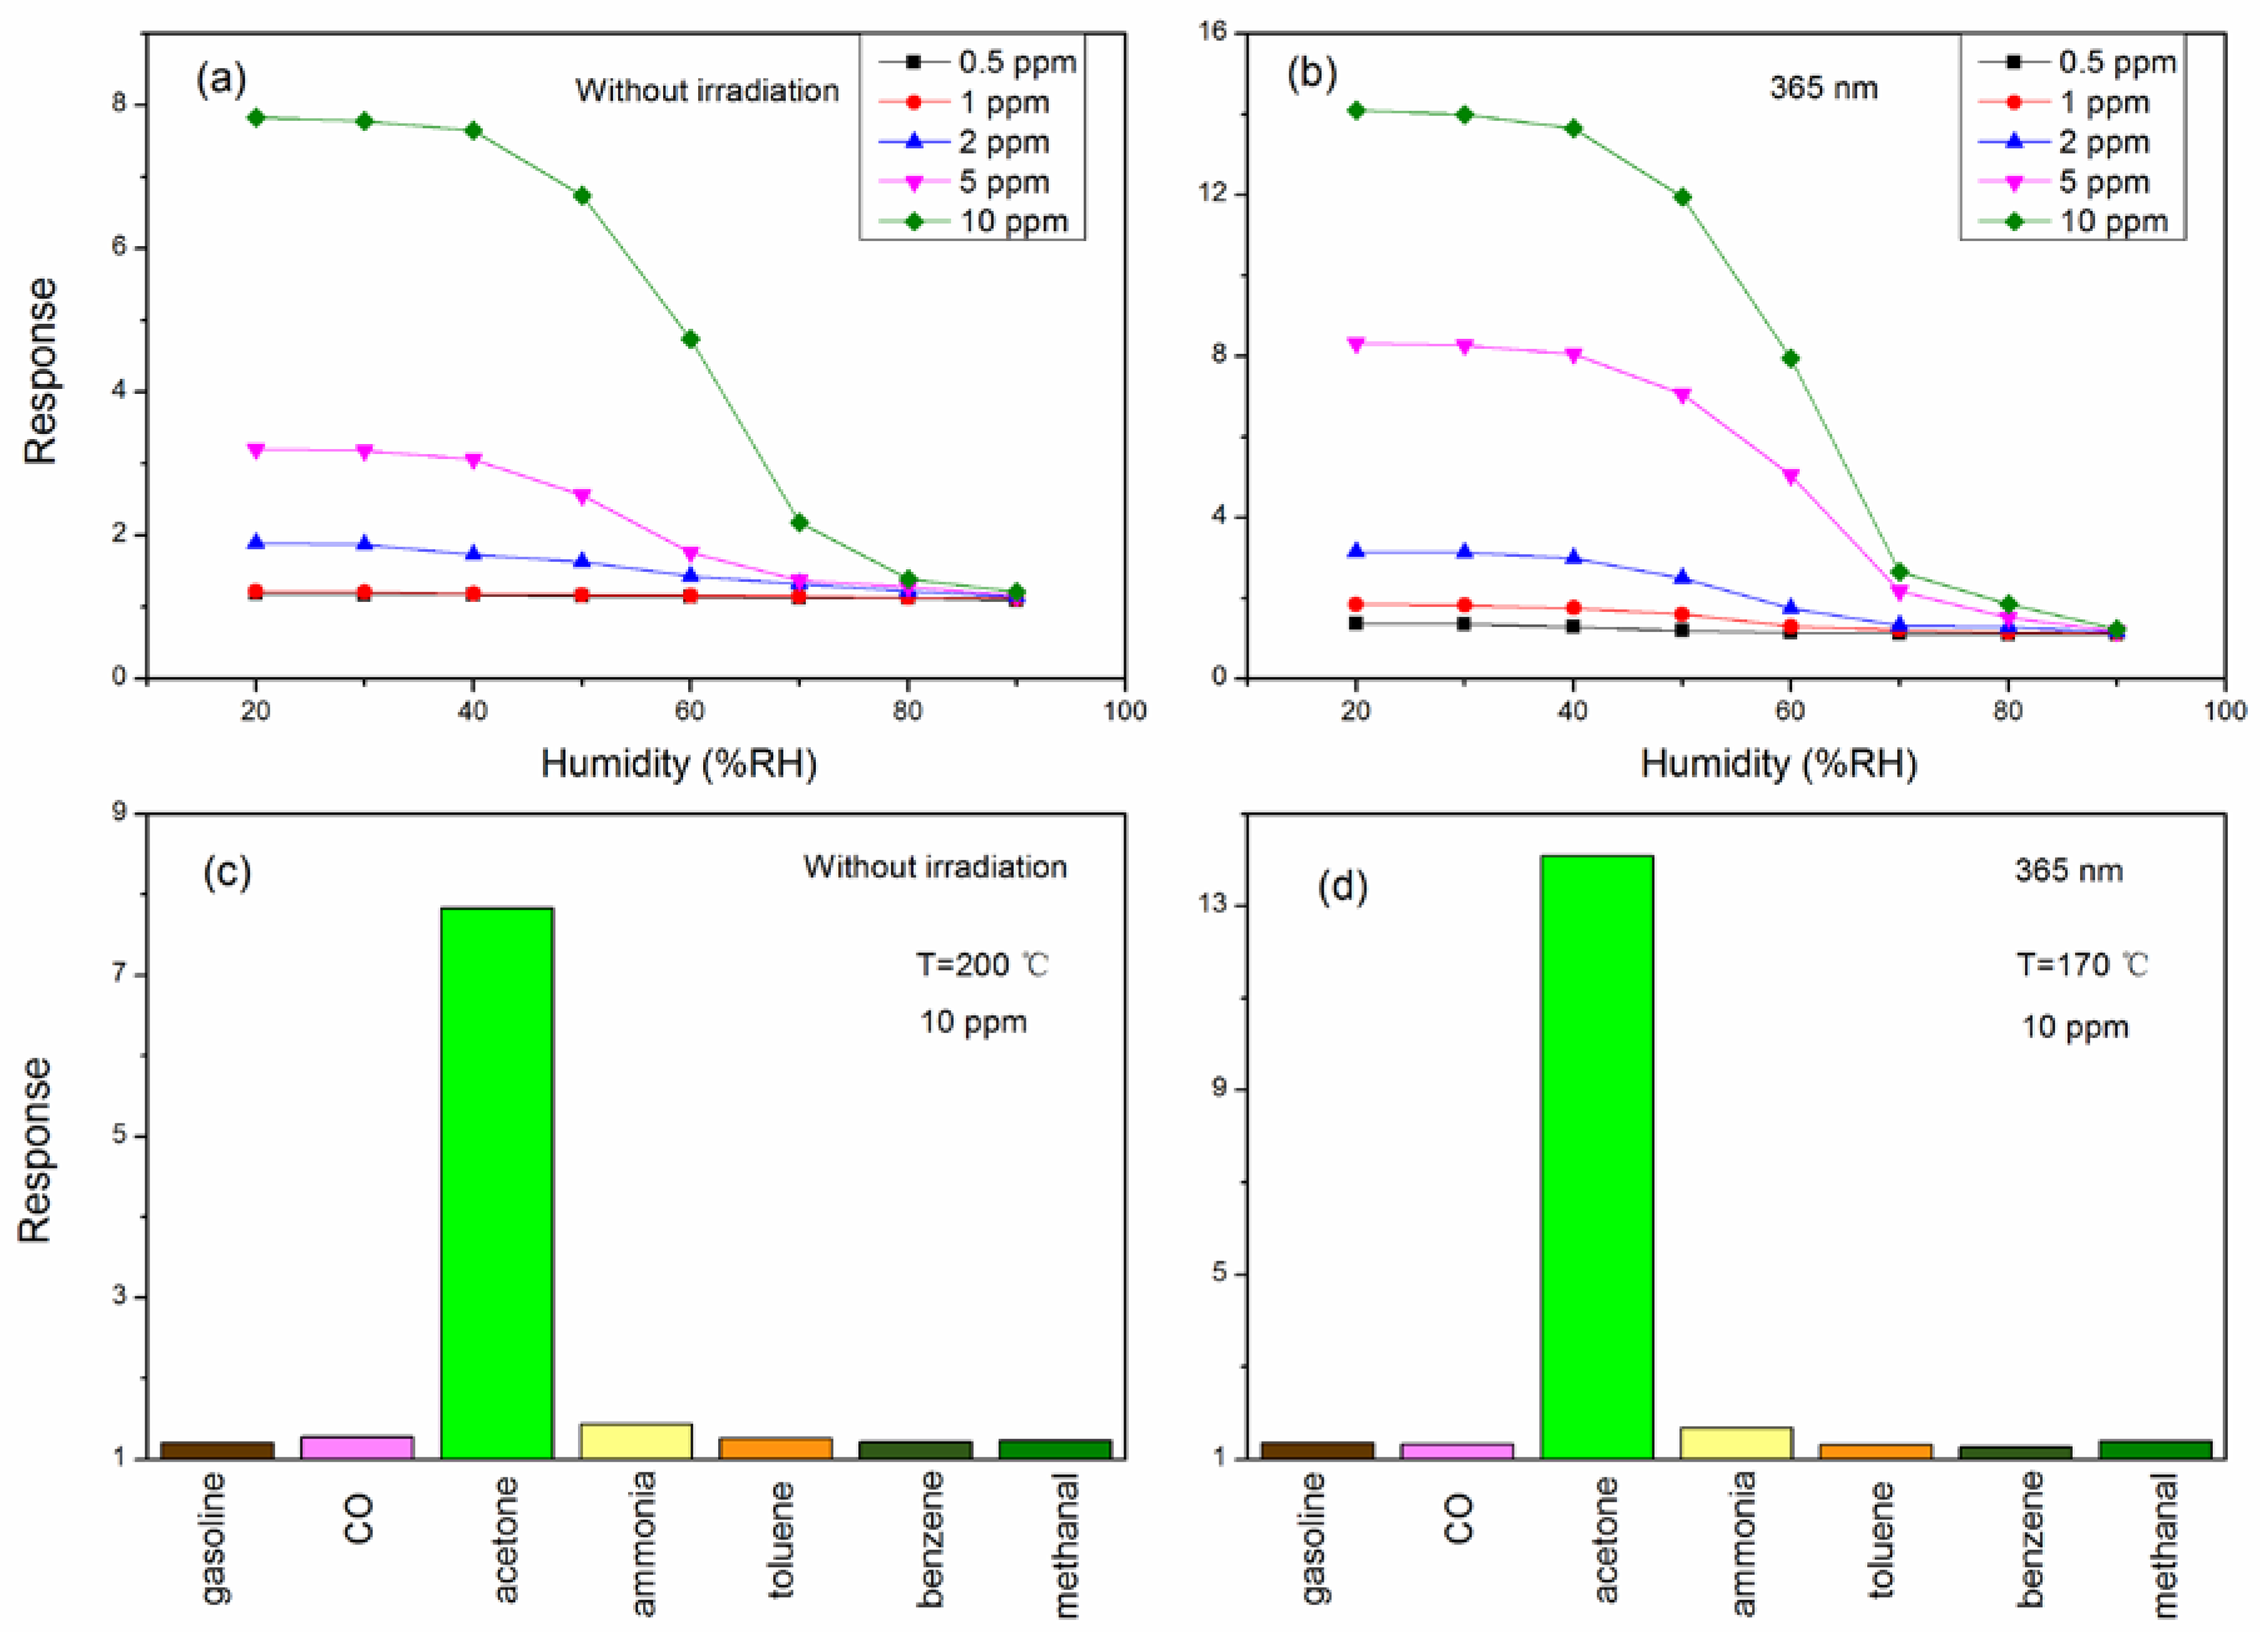
Figure 8a,b shows the relationship between the humidity and the response of LaFeO3 to different concentrations of acetone vapor at its optimum operating temperature. We can see that the trend of response decreases whether the sensor is under light illumination or not. Especially at relative humidity of 50% to 70%, the decreasing trend is more pronounced. However, the responses of the irradiated sensor are greater than the responses of the sensor which is not exposed to irradiation at the same relative humidity when the relative humidity is below 80%. When the relative humidity is greater than 80%, there is almost no response to acetone vapor. The acetone sensing process is that O− (adsorbed O species) reacts with acetone vapor, and the reaction products are CO2 and H2O. Therefore, with an increase in humidity, the reaction is slowed down and the response is reduced.
In the practical application process, many different kinds of gases may co-exist. As such, for accurate detection of acetone, the performance of the sensor should not be impacted by the presence of other gases. Therefore, evaluation of the performance and selectivity of the sensor in real-life situations is important. Figure 8c,d shows the selectivity of the sensor for acetone in the presence of different gases at 10 ppm. It can be seen form this figure that the sensor shows great selectivity toward acetone compared with other gases. The nano-particles of LaFeO3 adsorb acetone molecules with a large dipole moment (2.88 D). Additionally, the functional group in the acetone structure is broken rather easily. These factors both result in a high selectivity for the sensor toward acetone vapor.
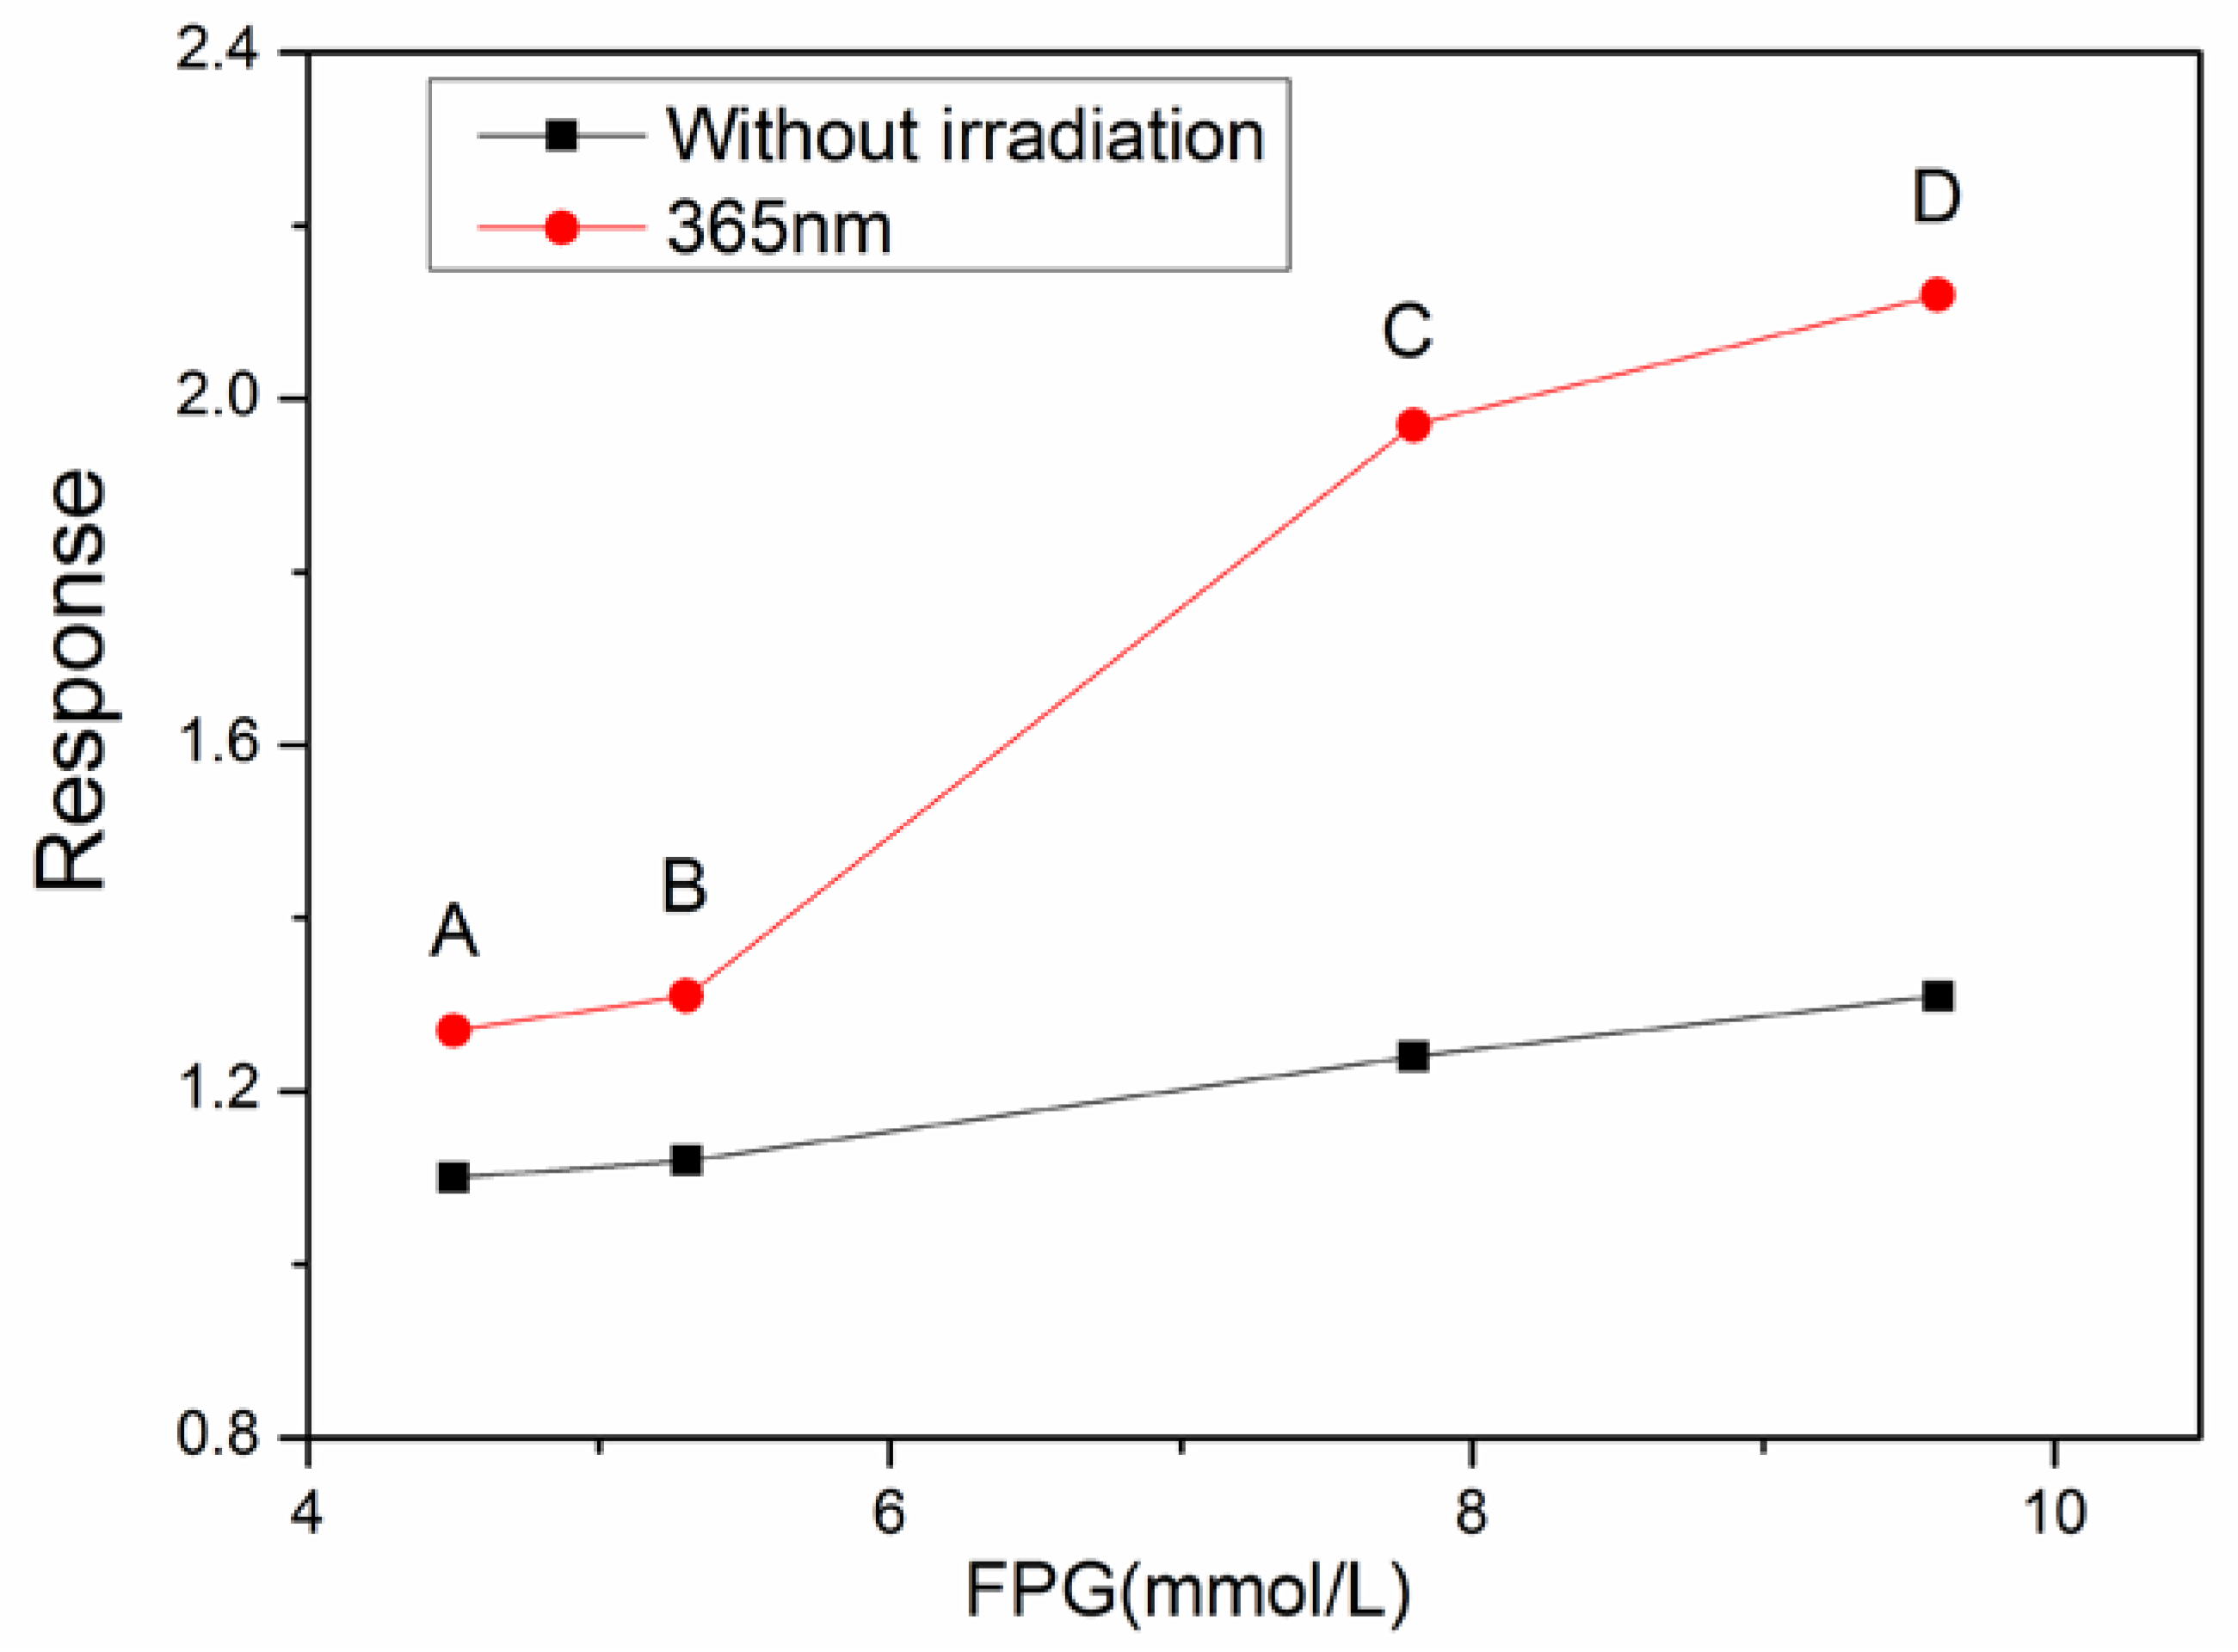
To evaluate the real-life application of the sensor in detecting diabetes, the following experiment is performed. The concentration of acetone in exhaled breath from a healthy patient is about 0.3–0.9 ppm, and it can reach 1.8 ppm in people with diabetes. Four volunteers were invited to participate in real-life testing of the sensor. Their details are shown in Table 2. The first two are healthy, and are used as the references, and the other two are individuals with diabetes. FPG means concentration of fasting glucose. The four samples of exhaled breath from volunteers were kept in vacuum bags. During the measurement, the exhaled breath was injected within 5 s. As is known, there are 40,000 ppm of CO2 in exhaled breath, which should be subtracted from the final data. Other gases, like H2S, toluene, etc., are there in extremely low concentrations in exhaled breath. Therefore, the other gases above are ignored. Figure 9 shows the detection results of acetone by the sensor. All the data are as obtained after the sensitivity toward CO2 was subtracted. The comparison of acetone vapor sensitivity data in volunteers show that the acetone level is about 0.3 ppm in volunteer A, and 0.35 ppm in volunteer B, and for the last two volunteers, there is more than 1 ppm acetone in their exhaled breath. The results correspond very well with their basic health or diabetic condition. These results indicate that LaFeO3 is a potential sensor to preliminarily examine the concentration of acetone in exhaled breath. People who are detected as diabetic may then proceed to a hospital for a further detection and evaluation of concentration of acetone in their exhaled breath.
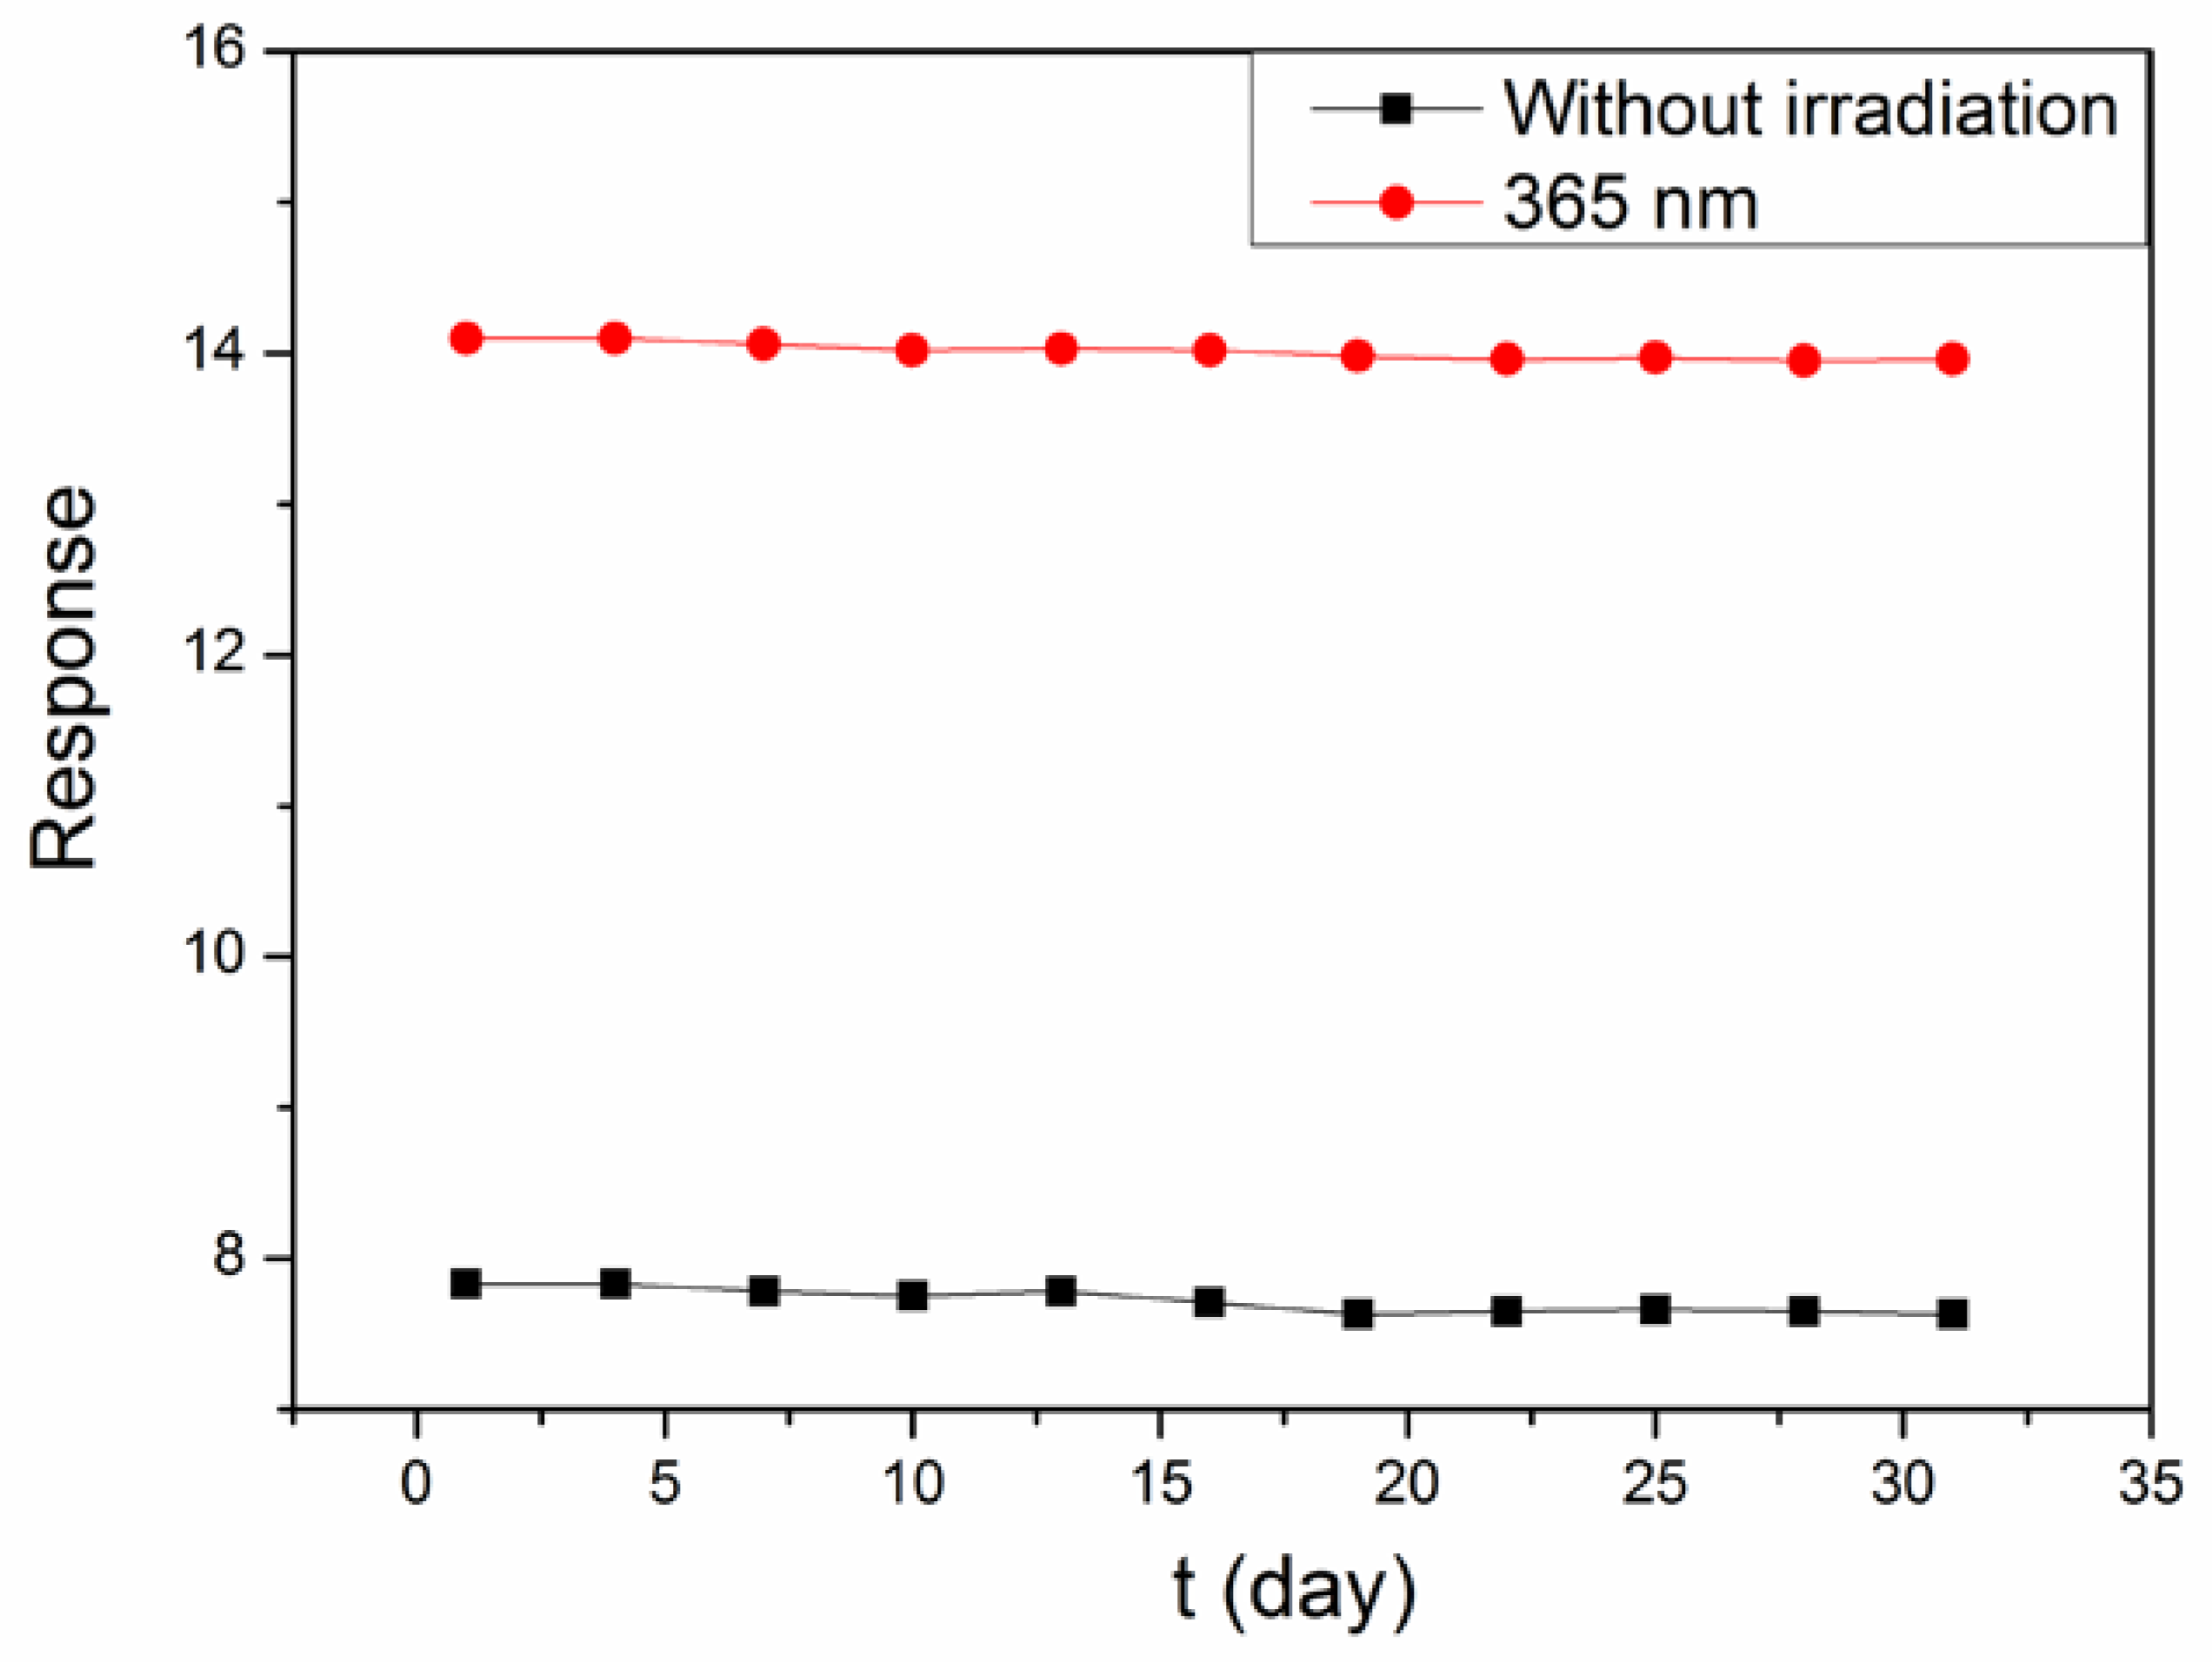
Additionally, the stability of the sensor is also important in practical applications. A good stable sensor will have a larger application scope. To measure the stability of the sensor, the following measurement is performed. The sensor is measured once every 3 days for a month (31 days) and retained in a vacuum bag after every measurement. Figure 10 shows the experiment results of the sensor for stability testing. It is observed that the sensor has a good selectivity whether under irradiation or not. However, the sensor shows better selectivity when used under UV light illumination, and the smaller the wavelength of light, the better selectivity there is.
4. Conclusions
LaFeO3 is synthesized by the sol-gel method. The sensitivity of the LaFeO3 sensor is measured for detecting acetone vapor. The sensor shows a maximum response at 200 °C. As the relative humidity increases, the resistance and sensitivity of sensor are found to decrease. The sensor may be made to work at a low optimum operating temperature by introducing UV light; by doing so, the sensitivity is improved and the optimum operating temperature is decreased. Through the dynamic resistance curve measured under sensor irradiation by UV light, the improved sensitivity mechanism was researched. Additionally, the sensor has a good selectivity toward acetone with an absolute advantage compared with other gases. The sensor can also be used to preliminarily judge if people are diabetic or not, based on the concentration of acetone in their exhaled breath. The sensor shows a better sensitivity and stability when under UV light illumination than that without irradiation.
Author Contributions
This research paper was completed by all authors. H.Z. performed the measurements and wrote the paper. H.Z., H.Q., C.G., G.Z., Y.C., and J.H. jointly developed the theoretical foundations.
Funding
This work was supported by National Natural Science Foundation of China (Nos: 51472145, 51772174 and 51272133), Shandong Natural Science Foundation (No. ZR2013MM016).
Conflicts of Interest
The authors declare no conflict of interest.
References
- Liu, F.; Guan, Y.; Sun, R.; Liang, X.; Sun, P.; Liu, F.; Lu, G. Mixed potential type acetone sensor using stabilized zirconia and M3V2O8 (M: Zn, Co and Ni) sensing electrode. Sens. Actuators B Chem. 2015, 221, 673–680. [Google Scholar] [CrossRef]
- Wang, C.-C.; Weng, Y.C.; Chou, T.C. Acetone sensor using lead foil as working electrode. Sens. Actuators B Chem. 2007, 122, 591–595. [Google Scholar] [CrossRef]
- Makisimovich, N.; Vorottyntsev, V.; Nikitina, N.; Kaskevich, O.; Karabum, P.; Martynenko, F. Adsorption semiconductor sensor for diabetic ketoacidosis diagnosis. Sens. Actuators B Chem. 1996, 36, 419–421. [Google Scholar] [CrossRef]
- Epifani, M.; Comini, E.; Díaz, R.; Genç, A.; Andreu, T.; Siciliano, P.; Morante, J.R. Acetone sensors based on TiO2 nanocrystals modified with tungsten oxide species. J. Alloy. Compd. 2016, 665, 345–351. [Google Scholar] [CrossRef]
- Bian, H.; Ma, S.; Sun, A.; Xu, X.; Yang, G.; Gao, J.; Zhang, Z.; Zhu, H. Characterization and acetone gas sensing properties of electrospun TiO2 nanorods. Superlattice Microstruct. 2015, 81, 107–113. [Google Scholar] [CrossRef]
- Bhowmik, B.; Hazra, A.; Dutta, K.; Bhattacharyya, P. Repeatability and Stability of Room-Temperature Acetone Sensor Based on Nanotubes: Influence of Stoichiometry Variation. IEEE Trans. Device Mater. Reliab. 2014, 14, 961–967. [Google Scholar] [CrossRef]
- Wang, L.; Lou, Z.; Fei, T.; Zhang, T. Enhanced acetone sensing performances of hierarchical hollow Au-loaded NiO hybrid structures. Sens. Actuators B Chem. 2012, 161, 178–183. [Google Scholar] [CrossRef]
- Wang, C.; Liu, J.; Yang, Q.; Sun, P.; Gao, Y.; Liu, F.; Zheng, J.; Lu, G. Ultrasensitive and low detection limit of acetone gas sensor based on W-doped NiO hierarchical nanostructure. Sens. Actuators B Chem. 2015, 220, 59–67. [Google Scholar] [CrossRef]
- Wei, S.; Zhou, M.; Du, W. Improved acetone sensing properties of ZnO hollow nanofibers by single capillary electrospinning. Sens. Actuators B Chem. 2011, 160, 753–759. [Google Scholar] [CrossRef]
- An, D.; Tong, X.; Liu, J.; Wang, Q.; Zhou, Q.; Dong, J.; Li, Y. Template-free hydrothermal synthesis of ZnO micro/nano-materials and their application in acetone sensing properties. Superlattice Microstruct. 2015, 77, 1–11. [Google Scholar] [CrossRef]
- Al-Hardan, N.H.; Abdullah, M.J.; Aziz, A.A. Performance of Cr-doped ZnO for acetone sensing. Appl. Surf. Sci. 2013, 270, 480–485. [Google Scholar] [CrossRef]
- Peng, C.; Guo, J.; Yang, W.; Shi, C.; Liu, M.; Zheng, Y.; Xu, J.; Chen, P.; Huang, T.; Yang, Y. Synthesis of three-dimensional flower-like hierarchical ZnO nanostructure and its enhanced acetone gas sensing properties. J. Alloy. Compd. 2016, 654, 371–378. [Google Scholar] [CrossRef]
- Rajgure, A.V.; Patil, J.Y.; Pawar, R.C.; Lee, C.S.; Suryavanshi, S.S. Aqueous chemical route deposition of nanocrystalline ZnO thin films as acetone sensor: Effect of molarity. Ceram. Int. 2013, 39, 87–92. [Google Scholar] [CrossRef]
- Zhang, Z.; Wen, Z.; Ye, Z.; Zhu, L. Gas sensors based on ultrathin porous Co3O4 nanosheets to detect acetone at low temperature. RSC Adv. 2015, 5, 59976–59982. [Google Scholar] [CrossRef]
- Su, C.; Liu, C.; Liu, L.; Ni, M.; Li, H.; Bo, X.; Liu, L.; Chi, X. Excellent acetone sensing properties of Sm-doped alpha-Fe2O3. Appl. Surf. Sci. 2014, 314, 931–935. [Google Scholar] [CrossRef]
- Shan, H.; Liu, C.; Liu, L.; Li, S.; Wang, L.; Zhang, X.; Bo, X.; Chi, X. Highly sensitive acetone sensors based on La-doped alpha-Fe2O3 nanotubes. Sens. Actuators B Chem. 2013, 184, 243–247. [Google Scholar] [CrossRef]
- Kim, S.; Park, S.; Park, S.; Lee, C. Acetone sensing of Au and Pd-decorated WO3 nanorod sensors. Sens. Actuators B Chem. 2015, 209, 180–185. [Google Scholar] [CrossRef]
- Chen, D.; Hou, X.; Li, T.; Yin, L.; Fan, B.; Wang, H.; Li, X.; Xu, H.; Lu, H.; Zhang, R.; et al. Effects of morphologies on acetone-sensing properties of tungsten trioxide nanocrystals. Sens. Actuators B Chem. 2011, 153, 373–381. [Google Scholar] [CrossRef]
- Tomer, V.K.; Singh, K.; Kaur, H.; Shorie, M.; Sabherwal, P. Rapid acetone detection using indium loaded WO3/SnO2 nanohybrid sensor. Sens. Actuators B Chem. 2017, 253, 703–713. [Google Scholar] [CrossRef]
- Malik, R.; Tomer, V.K.; Dankwort, T.; Misha, Y.K.; Kienle, L. Cubic mesoporous Pd–WO3 loaded graphitic carbon nitride (g-CN) nanohybrids: Highly sensitive and temperature dependent VOC sensors. J. Mater. Chem. A 2018, 6, 10718–10730. [Google Scholar] [CrossRef]
- Mishra, R.K.; Kushwaha, A.; Sahay, P.P. Cr-induced modifications in the structural, photoluminescence and acetone-sensing behaviour of hydrothermally synthesised SnO2 nanoparticles. J. Exp. Nanosci. 2014, 10, 1042–1056. [Google Scholar] [CrossRef]
- Jin, W.X.; Ma, S.Y.; Sun, A.M.; Luo, J.; Cheng, L.; Li, W.Q.; Tie, Z.Z.; Jiang, X.H.; Wang, T.T. Synthesis of hierarchical SnO2 nanoflowers and their high gas-sensing properties. Mater. Lett. 2015, 143, 283–286. [Google Scholar] [CrossRef]
- Punginsang, M.; Wisitsoraat, A.; Tuantranont, A.; Phanichphant, S.; Liewhiran, C. Effects of cobalt doping on nitric oxide, acetone and ethanol sensing performances of FSP-made SnO2 nanoparticles. Sens. Actuators B Chem. 2015, 210, 589–601. [Google Scholar] [CrossRef]
- Singkammo, S.; Wisitsoraat, A.; Sriprachuabwong, C.; Tuantranont, A.; Phanichphant, S.; Liewhiran, C. Electrolytically Exfoliated Graphene-Loaded Flame-Made Ni-Doped SnO2 Composite Film for Acetone Sensing. ACS Appl. Mater. Interfaces 2015, 7, 3077–3092. [Google Scholar] [CrossRef] [PubMed]
- Patil, S.B.; Patil, P.P.; More, M.A. Acetone vapour sensing characteristics of cobalt-doped SnO2 thin films. Sens. Actuators B Chem. 2007, 125, 126–130. [Google Scholar] [CrossRef]
- Tomer, V.K.; Malik, R.; Kailasam, K. Near-Room-Temperature Ethanol Detection Using Ag-Loaded Mesoporous Carbon Nitrides. ACS Omega 2017, 2, 3658–3668. [Google Scholar] [CrossRef]
- Wu, Z.L.; Zhang, R.; Zhao, M.; Fang, S.M.; Han, Z.X.; Hu, J.F.; Wang, K.Y. Effect of Pd doping on the acetone-sensing properties of NdFeO3. Int. J. Miner. Metall. Mater. 2012, 19, 141–145. [Google Scholar] [CrossRef]
- Liu, X.; Hu, J.; Cheng, B.; Qin, H.; Jiang, M. Acetone gas sensing properties of SmFe1-xMgxO3 perovskite oxides. Sens. Actuators B Chem. 2008, 134, 483–487. [Google Scholar] [CrossRef]
- Zhang, P.; Qin, H.; Lv, W.; Zhang, H.; Hu, J. Gas sensors based on ytterbium ferrites nanocrystalline powders for detecting acetone with low concentrations. Sens. Actuators B Chem. 2017, 246, 9–19. [Google Scholar] [CrossRef]
- Yang, M.; Huo, L.; Zhao, H.; Gao, S.; Rong, Z. Electrical properties and acetone-sensing characteristics of LaNi1−xTixO3 perovskite system prepared by amorphous citrate decomposition. Sens. Actuators B Chem. 2009, 143, 111–118. [Google Scholar] [CrossRef]
- Chen, T.; Zhou, Z.; Wang, Y. Surfactant CATB-assisted generation and gas-sensing characteristics of LnFeO3 (Ln=La, Sm, Eu) materials. Sens. Actuators B Chem. 2009, 143, 124–131. [Google Scholar] [CrossRef]
- Liu, X.; Ji, H.; Gu, Y.; Xu, M. Preparation and acetone sensitive characteristics of nano LaFeO3 semiconductor thin films by polymerization complex method. Mater. Sci. Eng. B Adv. 2006, 133, 98–101. [Google Scholar] [CrossRef]
- Song, P.; Zhang, H.; Han, D.; Li, J.; Yang, Z.; Wang, Q. Preparation of biomorphic porous LaFeO3 by sorghum straw biotemplate method and its acetone sensing properties. Sens. Actuators B Chem. 2014, 196, 140–146. [Google Scholar] [CrossRef]
- Fan, K.; Qin, H.; Zhang, Z.; Sun, L.; Sun, L.; Hu, J. Gas sensing properties of nanocrystalline La0.75Ba0.25FeO3 thick-film sensors. Sens. Actuators B Chem. 2012, 171, 302–308. [Google Scholar] [CrossRef]
- Shi, C.M.; Qin, H.W.; Zhao, M.; Wang, X.F.; Li, L.; Hu, J.F. Investigation on electrical transport, CO sensing characteristics and mechanism for nanocrystalline La1−xCaxFeO3 sensors. Sens. Actuators B Chem. 2014, 190, 25–31. [Google Scholar] [CrossRef]
Figure 1.
Schematic structure of the gas sensor.

Figure 2.
The XRD patterns of LaFeO3 (x = 0, 0.1, 0.2, 0.3) annealed at 800 °C.

Figure 3.
(a) EDS of LaFeO3; (b) La Mapping; (c) Fe Mapping; (d) O Mapping.

Figure 4.
SEM images of LaFeO3 annealed at 800 °C. (a,b) The given scale is 200 nm; (c,d) The given scale is 500 nm.
Figure 4.
SEM images of LaFeO3 annealed at 800 °C. (a,b) The given scale is 200 nm; (c,d) The given scale is 500 nm.

Figure 5.
(a) The response of LaFeO3 with different annealing temperatures toward 10 ppm acetone vapor; (b) the sensitivity for LaFeO3 (with Ta = 800 °C) at different operating temperatures toward acetone vapor; (c) the dynamic curves of vapor sensitivity for LaFeO3 toward acetone vapor; (d) relationship between relative humidity and sensing resistance.

Figure 6.
(a) Sensitivity of LaFeO3 to 10 ppm acetone vapor measured. (red): irradiated by 365 nm light; (black): without irradiation. (b) Response dependence on the acetone concentration at its optimum operating temperature. (c) The sensitivity for LaFeO3 (with Ta = 800 °C) measured toward acetone vapor under light illumination. (d) Dynamic resistance of LaFeO3 to acetone vapor at 170 °C under light.

Figure 7.
The UV−visible diffuse reflectance spectra (a), and the energy band gap (b) of the as-prepared LaFeO3 samples.
Figure 7.
The UV−visible diffuse reflectance spectra (a), and the energy band gap (b) of the as-prepared LaFeO3 samples.

Figure 8.
The sensitivity of the sensor toward acetone at different relative humidities: (a) Without irradiation at 200 °C; (b) 365 nm at 170 °C. The response of sensors based on LaFeO3 toward different 10 ppm vapors: (c) Without irradiation at 200 °C; (d) 365 nm at 170 °C.
Figure 8.
The sensitivity of the sensor toward acetone at different relative humidities: (a) Without irradiation at 200 °C; (b) 365 nm at 170 °C. The response of sensors based on LaFeO3 toward different 10 ppm vapors: (c) Without irradiation at 200 °C; (d) 365 nm at 170 °C.

Figure 9.
The response dependence on the concentration of FPG in four volunteers. A/B/C/D means the four volunteers.
Figure 9.
The response dependence on the concentration of FPG in four volunteers. A/B/C/D means the four volunteers.

Figure 10.
Sensitivity stability of LaFeO3 sensor. (black): Without irradiation at 200 °C; (red): 365 nm at 170 °C.
Figure 10.
Sensitivity stability of LaFeO3 sensor. (black): Without irradiation at 200 °C; (red): 365 nm at 170 °C.


Table 1.
Sensing performance toward acetone vapor for other sensors. T0 means the optimum operating temperature. C means the concentration of acetone. S means the sensitivity toward acetone vapor.
Table 1.
Sensing performance toward acetone vapor for other sensors. T0 means the optimum operating temperature. C means the concentration of acetone. S means the sensitivity toward acetone vapor.
| Author | Materials | To | C | S | Ref. |
|---|---|---|---|---|---|
| Epifani et al. | TiO2 | 400 | 100 | 1.2 | [4] |
| Bian et al. | TiO2 | 500 | 10 | 9 | [5] |
| Bhowmik et al. | TiO2 | 270 | 10 | 1.136 | [6] |
| Wang et al. | Au-doped NiO | 240 | 20 | 7.6 | [7] |
| Wang et al. | W-doped NiO | 250 | 100 | 198.1 | [8] |
| Wei et al. | ZnO | 220 | 1 | 7.1 | [9] |
| An et al. | ZnO | 220 | 100 | 6.0 | [10] |
| Al-Hardan et al. | Cr-doped ZnO | 400 | 500 | 90 | [11] |
| Peng et al. | ZnO | 300 | 100 | 18.6 | [12] |
| Rajgure et al. | ZnO | 350 | 2000 | 92 | [13] |
| Zhang et al. | Co3O4 | 150 | 10 | 1.7 | [14] |
| Su et al. | Sm-doped α-Fe2O3 | 240 | 0.5 | 2.3 | [15] |
| Shan et al. | La-doped α-Fe2O3 | 240 | 50 | 26 | [16] |
| Kim et al. | WO3 with both Pd and Au | 300 | 200 | 152.4 | [17] |
| Chen et al. | WO3 | 300 | 2 | 2 | [18] |
| Tomer et al. | WO3-SnO2 | 200 | 50 | 31.3 | [19] |
| Malik et | Pd-WO3 | 200 | 25 | 21.3 | [20] |
| Mishra et al. | SnO2 | 250 | 10 | 42 | [21] |
| Jin et al. | SnO2 | 260 | 25 | 40 | [22] |
| Punginsang et al. | Co-doped SnO2 | 250 | 20 | 36.9 | [23] |
| Singkammo et al. | Ni-Doped SnO2 | 350 | 200 | 54.2 | [24] |
| Patil et al. | Co-doped SnO2 | 270 | 60 | 32 | [25] |
| Tomer et | Ag-CN | 250 | 50 | 16.1 | [26] |
| Wu et al. | NdFeO3 | 120 | 50 | 300 | [27] |
| Liu et al. | SmFe0.9Mg0.1O3 | 260 | 300 | 353 | [28] |
| Zhang et al. | Ca-doped YbFeO3 | 230 | 0.1 | 1.72 | [29] |
| Yang et al. | LaNi0.5Ti0.5O3 | 350 | 5 | 29.3 | [30] |
| Chen et al. | SmFeO3 | 250 | 380 | 2.6 | [31] |
| Liu et al. | LaFeO3 | 400 | 80 | 204 | [32] |
| Song et al. | LaFeO3 | 240 | 200 | 12.2 | [33] |
| Fan et al. | La0.75Ba0.25FeO3 | 240 | 50 | 17 | [34] |
| LaFeO3 | 200 | 0.5 | 1.18 | Present work | |
| LaFeO3 | 200 | 1 | 1.22 | Present work | |
| LaFeO3 | 200 | 2 | 1.89 | Present work | |
| LaFeO3 | 200 | 5 | 3.2 | Present work | |
| LaFeO3 | 200 | 10 | 7.83 | Present work | |
| LaFeO3 under 365 nm | 180 | 0.5 | 1.37 | Present work | |
| LaFeO3 under 365 nm | 180 | 1 | 1.85 | Present work | |
| LaFeO3 under 365 nm | 180 | 2 | 3.16 | Present work | |
| LaFeO3 under 365 nm | 180 | 5 | 8.32 | Present work | |
| LaFeO3 under 365 nm | 180 | 10 | 14.1 | Present work |
Table 2.
Basic physical status of the four volunteers. FPG means fasting plasma glucose.
| Number | Condition | Gender | Age | FPG (mmol/L) |
|---|---|---|---|---|
| A | Healthy | man | 52 | 4.5 |
| B | Healthy | woman | 52 | 5.3 |
| C | diabetic | man | 52 | 7.8 |
| D | diabetic | woman | 52 | 9.6 |
© 2018 by the authors. Licensee MDPI, Basel, Switzerland. This article is an open access article distributed under the terms and conditions of the Creative Commons Attribution (CC BY) license (http://creativecommons.org/licenses/by/4.0/).
Share and Cite
MDPI and ACS Style
Zhang, H.; Qin, H.; Gao, C.; Zhou, G.; Chen, Y.; Hu, J. UV Light Illumination Can Improve the Sensing Properties of LaFeO3 to Acetone Vapor. Sensors 2018, 18, 1990. https://doi.org/10.3390/s18071990
AMA Style
Zhang H, Qin H, Gao C, Zhou G, Chen Y, Hu J. UV Light Illumination Can Improve the Sensing Properties of LaFeO3 to Acetone Vapor. Sensors. 2018; 18(7):1990. https://doi.org/10.3390/s18071990
Chicago/Turabian StyleZhang, Heng, Hongwei Qin, Chengyong Gao, Guangjun Zhou, Yanping Chen, and Jifan Hu. 2018. "UV Light Illumination Can Improve the Sensing Properties of LaFeO3 to Acetone Vapor" Sensors 18, no. 7: 1990. https://doi.org/10.3390/s18071990
Note that from the first issue of 2016, this journal uses article numbers instead of page numbers. See further details here.