Estimating Angle-of-Arrival and Time-of-Flight for Multipath Components Using WiFi Channel State Information

 , ,
, ,
Abstract
:1. Introduction
- proposal of a fast algorithm that estimates the AoA and ToF of the dominant multipath components from WiFi CSI data based on the MMP algorithm;
- demonstrating the advantage of changing the estimation order in the MMP algorithm;
- introducing a multi-packet CSI aggregation method that utilizes the information provided by multiple packets to deliver better estimation performance;
- numerical analysis in different scenarios illustrating the performance of the AoA and ToF estimation using the MMP and 2D MUSIC algorithms, effects of change of the estimation order in MMP, and benefits of the mutli-packet CSI aggregation method.
2. Related Work
3. MMP for Joint AoA–ToF Estimation
3.1. System Model
3.2. Pairing the AoA and ToF Estimates
3.3. Some Notable Challenges
4. Multi-Packet CSI Aggregation
5. Simulation Results
5.1. Without Ambient Noise
5.2. With Ambient Noise
5.3. Lower Grid Resolution
5.4. Larger Channel Bandwidth
5.5. Order of Estimation
5.6. Multi-Packet CSI Aggregation
6. Conclusions
Author Contributions
Conflicts of Interest
References
- Wang, Z.; Yang, Z.; Dong, T. A Review of Wearable Technologies for Elderly Care that Can Accurately Track Indoor Position, Recognize Physical Activities and Monitor Vital Signs in Real Time. Sensors 2017, 17, 341. [Google Scholar] [CrossRef] [PubMed]
- Farid, Z.; Nordin, R.; Ismail, M. Recent advances in wireless indoor localization techniques and system. J. Comput. Netw. Commun. 2013, 2013, 1–12. [Google Scholar] [CrossRef]
- Wang, X.; Gao, L.; Mao, S.; Pandey, S. CSI-based fingerprinting for indoor localization: A deep learning approach. IEEE Trans. Veh. Technol. 2016, 66, 763–776. [Google Scholar] [CrossRef]
- Wielandt, S.; Strycker, L.D. Indoor multipath assisted angle of arrival localization. Sensors 2017, 17, 2522. [Google Scholar] [CrossRef] [PubMed]
- Ertel, R.B.; Cardieri, P.; Sowerby, K.W.; Rappaport, T.S.; Reed, J.H. Overview of spatial channel models for antenna array communication systems. IEEE Pers. Commun. 1998, 5, 10–22. [Google Scholar] [CrossRef]
- Kotaru, M.; Joshi, K.; Bharadia, D.; Katti, S. Spotfi: Decimeter level localization using wifi. In Proceedings of the ACM SIGCOMM Computer Communication Review, London, UK, 17–21 August 2015; ACM: New York, NY, USA, 2015; Volume 45, pp. 269–282. [Google Scholar]
- Wu, D.; Zhang, D.; Xu, C.; Wang, Y.; Wang, H. WiDir: Walking direction estimation using wireless signals. In Proceedings of the 2016 ACM International Joint Conference on Pervasive and Ubiquitous Computing, Heidelberg, Germany, 12–16 September 2016; ACM: New York, NY, USA, 2016; pp. 351–362. [Google Scholar]
- Vasisht, D.; Kumar, S.; Katabi, D. Decimeter-level localization with a single wifi access point. In Proceedings of the 13th USENIX Symposium on Networked Systems Design and Implementation (NSDI 16), Santa Clara, CA, USA, 16–18 March 2016; USENIX Association: Berkeley, CA, USA, 2016; pp. 165–178. [Google Scholar]
- Li, X.; Li, S.; Zhang, D.; Xiong, J.; Wang, Y.; Mei, H. Dynamic-music: Accurate device-free indoor localization. In Proceedings of the 2016 ACM International Joint Conference on Pervasive and Ubiquitous Computing, Heidelberg, Germany, 12–16 September 2016; ACM: New York, NY, USA, 2016; pp. 196–207. [Google Scholar]
- Hua, Y. Estimating two-dimensional frequencies by matrix enhancement and matrix pencil. IEEE Trans. Signal Process. 1992, 40, 2267–2280. [Google Scholar] [CrossRef]
- Chen, F.J.; Fung, C.C.; Kok, C.W.; Kwong, S. Estimation of two-dimensional frequencies using modified matrix pencil method. IEEE Trans. Signal Process. 2007, 55, 718–724. [Google Scholar] [CrossRef]
- Chen, J.; Gu, H.; Su, W. A new method for joint DOD and DOA estimation in bistatic MIMO radar. Signal Process. 2010, 90, 714–718. [Google Scholar] [CrossRef]
- Gu, J.F.; Wei, P. Joint SVD of two cross-correlation matrices to achieve automatic pairing in 2-D angle estimation problems. IEEE Antennas Wirel. Propag. Lett. 2007, 6, 553–556. [Google Scholar] [CrossRef]
- Gu, J.F.; Zhu, W.P.; Swamy, M. Joint 2-D DOA estimation via sparse L-shaped array. IEEE Trans. Signal Process. 2015, 63, 1171–1182. [Google Scholar] [CrossRef]
- Khalajmehrabadi, A.; Gatsis, N.; Pack, D.; Akopian, D. A joint indoor WLAN localization and outlier detection scheme using LASSO and elastic-net optimization techniques. IEEE Trans. Mob. Comput. 2016, 16, 2079–2092. [Google Scholar] [CrossRef]
- Khan, E. Joint delay and angle of arrival estimation using EM algorithm for multipath signals arriving at antenna array. In Proceedings of the 5th International Conference and exhibition on Digital Signal Processing and Its Applications, Moscow, Russia, 12–14 March 2003. [Google Scholar]
- Lin, D.D.; Pacheco, R.A.; Lim, T.J.; Hatzinakos, D. Joint estimation of channel response, frequency offset, and phase noise in OFDM. IEEE Trans. Signal Process. 2006, 54, 3542–3554. [Google Scholar]
- Liu, X.; Guang, L.; Yang, L.; Zhu, H. PARALIND-based blind joint angle and delay estimation for multipath signals with uniform linear array. EURASIP J. Adv. Signal Process. 2012, 2012, 130. [Google Scholar] [CrossRef]
- Van der Veen, A.J.; Vanderveen, M.C.; Paulraj, A. Joint angle and delay estimation using shift-invariance techniques. IEEE Trans. Signal Process. 1998, 46, 405–418. [Google Scholar] [CrossRef]
- Vanderveen, M.C.; Papadias, C.B.; Paulraj, A. Joint angle and delay estimation (JADE) for multipath signals arriving at an antenna array. IEEE Commun. Lett. 1997, 1, 12–14. [Google Scholar] [CrossRef]
- Wang, Y.Y.; Chen, J.T.; Fang, W.H. TST-MUSIC for joint DOA-delay estimation. IEEE Trans. Signal Process. 2001, 49, 721–729. [Google Scholar] [CrossRef]
- Zhu, Y.; Liu, L.; Zhang, J. Joint angle and delay estimation for 2D active broadband MIMO-OFDM systems. In Proceedings of the 2013 IEEE Global Communications Conference (GLOBECOM), Atlanta, GA, USA, 9–13 December 2013; pp. 3300–3305. [Google Scholar]
- Vanderveen, M.C.; Van der Veen, A.J.; Paulraj, A. Estimation of multipath parameters in wireless communications. IEEE Trans. Signal Process. 1998, 46, 682–690. [Google Scholar] [CrossRef]
- Kedia, V.S.; Chandna, B. A new algorithm for 2-D DOA estimation. Signal Process. 1997, 60, 325–332. [Google Scholar] [CrossRef]
- Yilmazer, N.; Sarkar, T.K. 2-D unitary matrix pencil method for efficient direction of arrival estimation. Digit. Signal Process. 2006, 16, 767–781. [Google Scholar] [CrossRef]
- Ye, Z.; Liu, C. 2-D DOA estimation in the presence of mutual coupling. IEEE Trans. Antennas Propag. 2008, 56, 3150–3158. [Google Scholar] [CrossRef]
- Chen, F.J.; Kwong, S.; Kok, C.W. ESPRIT-like two-dimensional DOA estimation for coherent signals. IEEE Trans. Aerosp. Electron. Syst. 2010, 46, 1477–1484. [Google Scholar] [CrossRef]
- Gan, L.; Gu, J.F.; Wei, P. Estimation of 2-D DOA for noncircular sources using simultaneous SVD technique. IEEE Antennas Wirel. Propag. Lett. 2008, 7, 385–388. [Google Scholar] [CrossRef]
- Nie, W.; Xu, K.; Feng, D.; Wu, C.Q.; Hou, A.; Yin, X. A Fast Algorithm for 2D DOA Estimation Using an Omnidirectional Sensor Array. Sensors 2017, 17, 515. [Google Scholar] [CrossRef] [PubMed]
- Huang, W.; Yang, X.; Liu, D.; Chen, S. Diffusion LMS with component-wise variable step-size over sensor networks. IET Signal Process. 2016, 10, 37–45. [Google Scholar] [CrossRef]
- Zhang, X.; Xu, L.; Xu, L.; Xu, D. Direction of departure (DOD) and direction of arrival (DOA) estimation in MIMO radar with reduced-dimension MUSIC. IEEE Commun. Lett. 2010, 14, 1161–1163. [Google Scholar] [CrossRef]
- Barabell, A. Improving the resolution performance of eigenstructure-based direction-finding algorithms. In Proceedings of the IEEE International Conference on Acoustics, Speech, and Signal Processing (ICASSP’83), Boston, MA, USA, 14–16 April 1983; Volume 8, pp. 336–339. [Google Scholar]
- Yilmazer, N.; Sarkar, T.K.; Salazar-Palma, M. DOA estimation using matrix pencil and ESPRIT methods using single and multiple snapshots. In Proceedings of the 2010 URSI International Symposium on Electromagnetic Theory (EMTS), Berlin, Germany, 16–19 August 2010; pp. 215–218. [Google Scholar]
- Waweru, N.; Konditi, D.; Langat, P. Performance analysis of MUSIC, root-MUSIC and ESPRIT DOA estimation algorithm. Int. J. Electr. Comput. Energ. Electron. Commun. Eng. 2014, 8, 209–216. [Google Scholar]
- Kleibergen, F.; Paap, R. Generalized reduced rank tests using the singular value decomposition. J. Econom. 2006, 133, 97–126. [Google Scholar] [CrossRef]
- Electromagnetic Simulation Software by REMCOM. Available online: http://www.remcom.com/wireless-insite (accessed on 15 December 2016).
- Qian, H. Counting the Floating Point Operations (FLOPS). Available online: https://au.mathworks.com/matlabcentral/fileexchange/50608-counting-the-floating-point-operations--flops- (accessed on 5 May 2018).
- Xie, Y. Atheros CSI Tool. 2016. Available online: pdcc.ntu.edu.sg/wands/Atheros/ (accessed on 15 December 2016).

| Parameter | Value |
|---|---|
| radio frequency | 5.63 GHz |
| bandwidth | 40 MHz |
| number of subcarriers | 30 |
| AoA range | −90 to + 90 degree |
| AoA steps (for 2D MUSIC) | 101 |
| ToF range | 0 to 50 ns |
| ToF steps (for 2D MUSIC) | 101 |
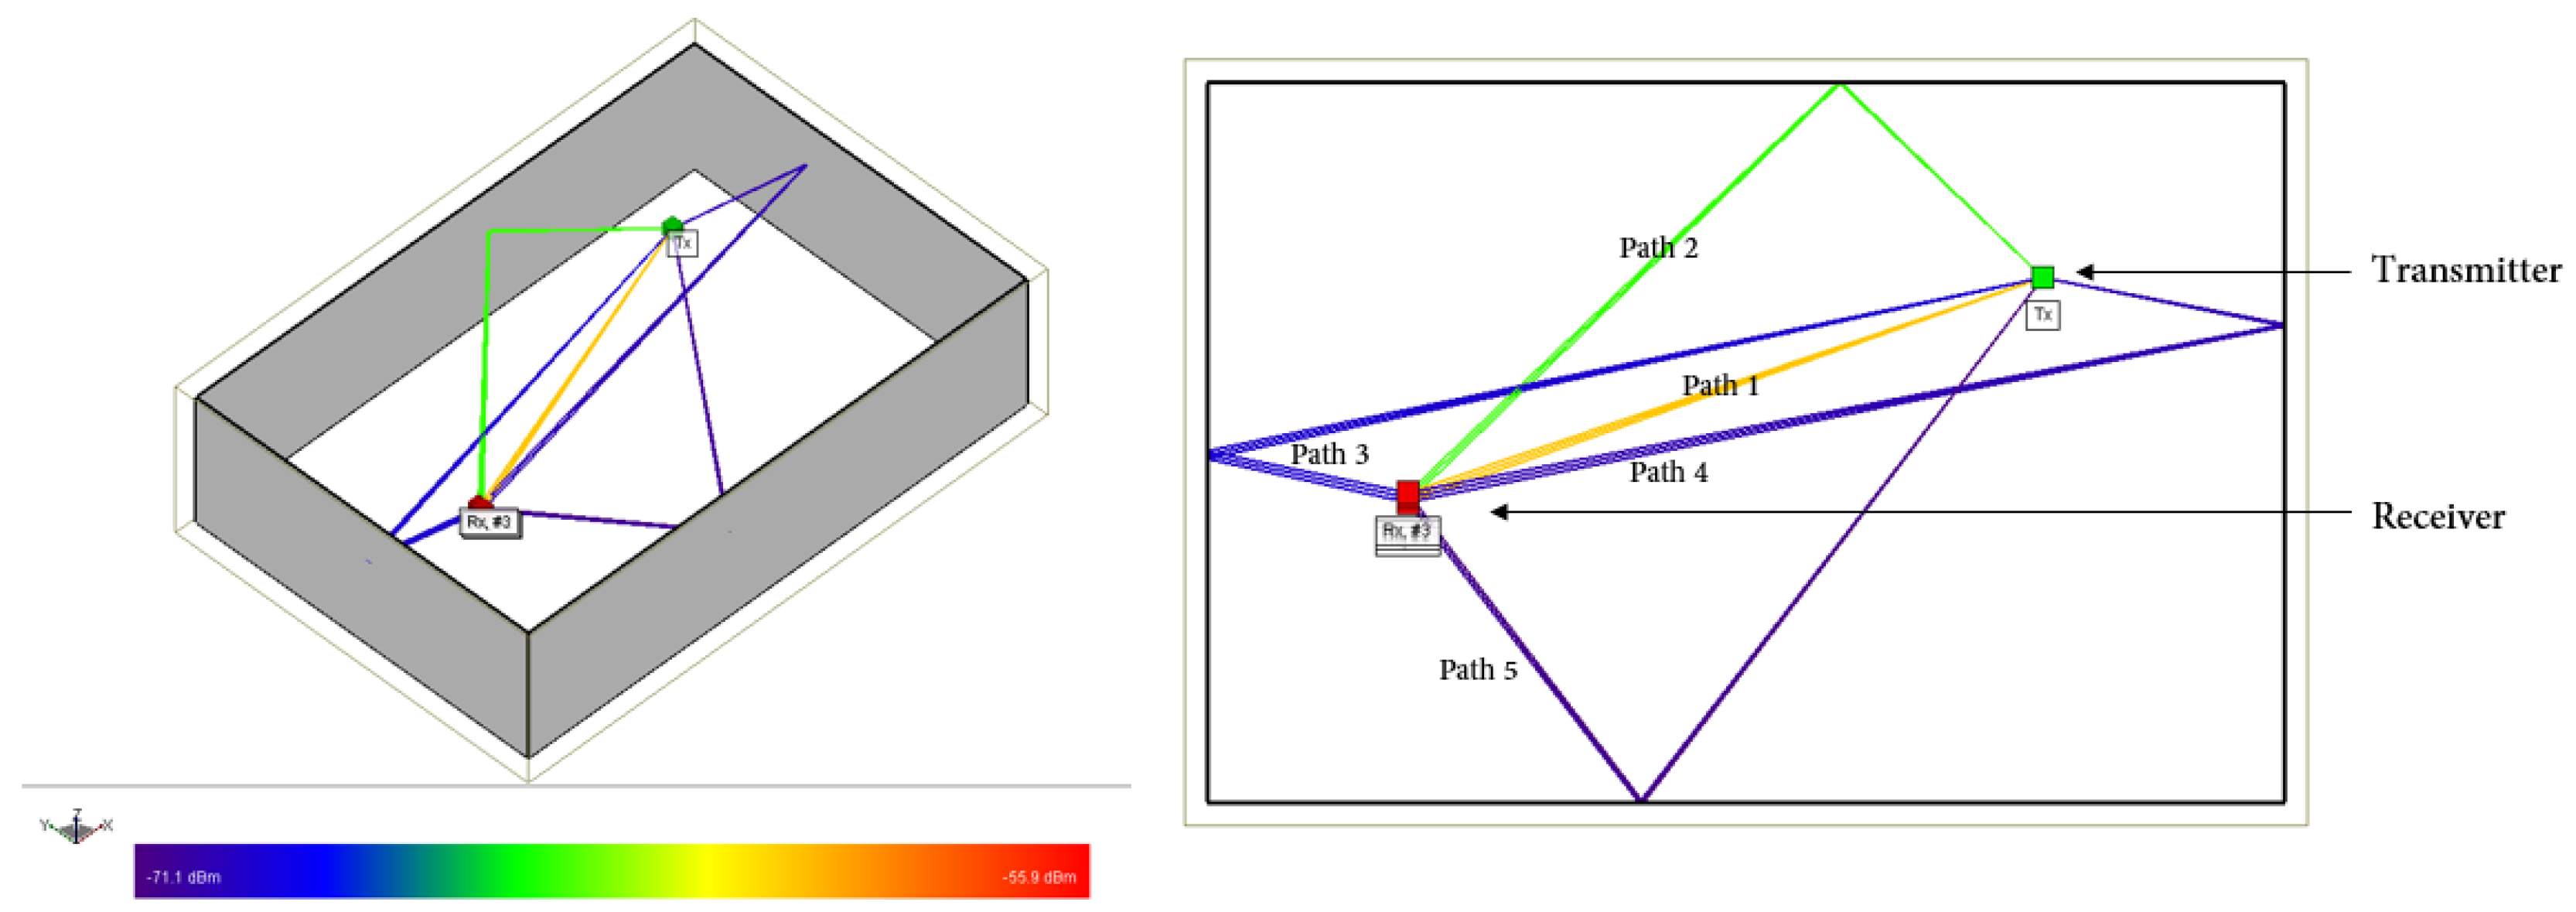
| Component | RSSI (dBm) | AoA (deg) | ToF () |
|---|---|---|---|
| path 1 | −60.603 | 19.4553 | 2.49486 |
| path 2 | −64.391 | 44.0316 | 3.267340 |
| path 3 | −69.270 | 167.794 | 3.93585 |
| path 4 | −69.976 | 11.3285 | 4.23677 |
| path 5 | −70.797 | −52.3761 | 3.87655 |
| 2D MUSIC | MMP | |
|---|---|---|
| time (ms) | ||
| FLOPs () | 381 |
© 2018 by the authors. Licensee MDPI, Basel, Switzerland. This article is an open access article distributed under the terms and conditions of the Creative Commons Attribution (CC BY) license (http://creativecommons.org/licenses/by/4.0/).
Share and Cite
Ahmed, A.U.; Arablouei, R.; De Hoog, F.; Kusy, B.; Jurdak, R.; Bergmann, N. Estimating Angle-of-Arrival and Time-of-Flight for Multipath Components Using WiFi Channel State Information. Sensors 2018, 18, 1753. https://doi.org/10.3390/s18061753
Ahmed AU, Arablouei R, De Hoog F, Kusy B, Jurdak R, Bergmann N. Estimating Angle-of-Arrival and Time-of-Flight for Multipath Components Using WiFi Channel State Information. Sensors. 2018; 18(6):1753. https://doi.org/10.3390/s18061753
Chicago/Turabian StyleAhmed, Afaz Uddin, Reza Arablouei, Frank De Hoog, Branislav Kusy, Raja Jurdak, and Neil Bergmann. 2018. "Estimating Angle-of-Arrival and Time-of-Flight for Multipath Components Using WiFi Channel State Information" Sensors 18, no. 6: 1753. https://doi.org/10.3390/s18061753