Evaluation of Image Reconstruction Algorithms for Confocal Microwave Imaging: Application to Patient Data

 ,
,  , , , and
Abstract
1. Introduction
- Delay-And-Sum (DAS)
- Improved Delay-And-Sum (IDAS)
- Delay-Multiply-And-Sum (DMAS)
- Coherence Factor Based DAS (CF-DAS)
- Channel Ranked DAS (CR-DAS)
- Robust Capon Beamformer (RCB)
2. Imaging Algorithms
2.1. Delay-And-Sum
2.2. Delay-Multiply-And-Sum
2.3. Improved Delay-And-Sum
2.4. Coherence Fator Based Delay-And-Sum
2.5. Channel Ranked Delay-And-Sum
2.6. Robust Capon Beamformer
3. Patient Scanning and Preprocessing
3.1. Patient Information
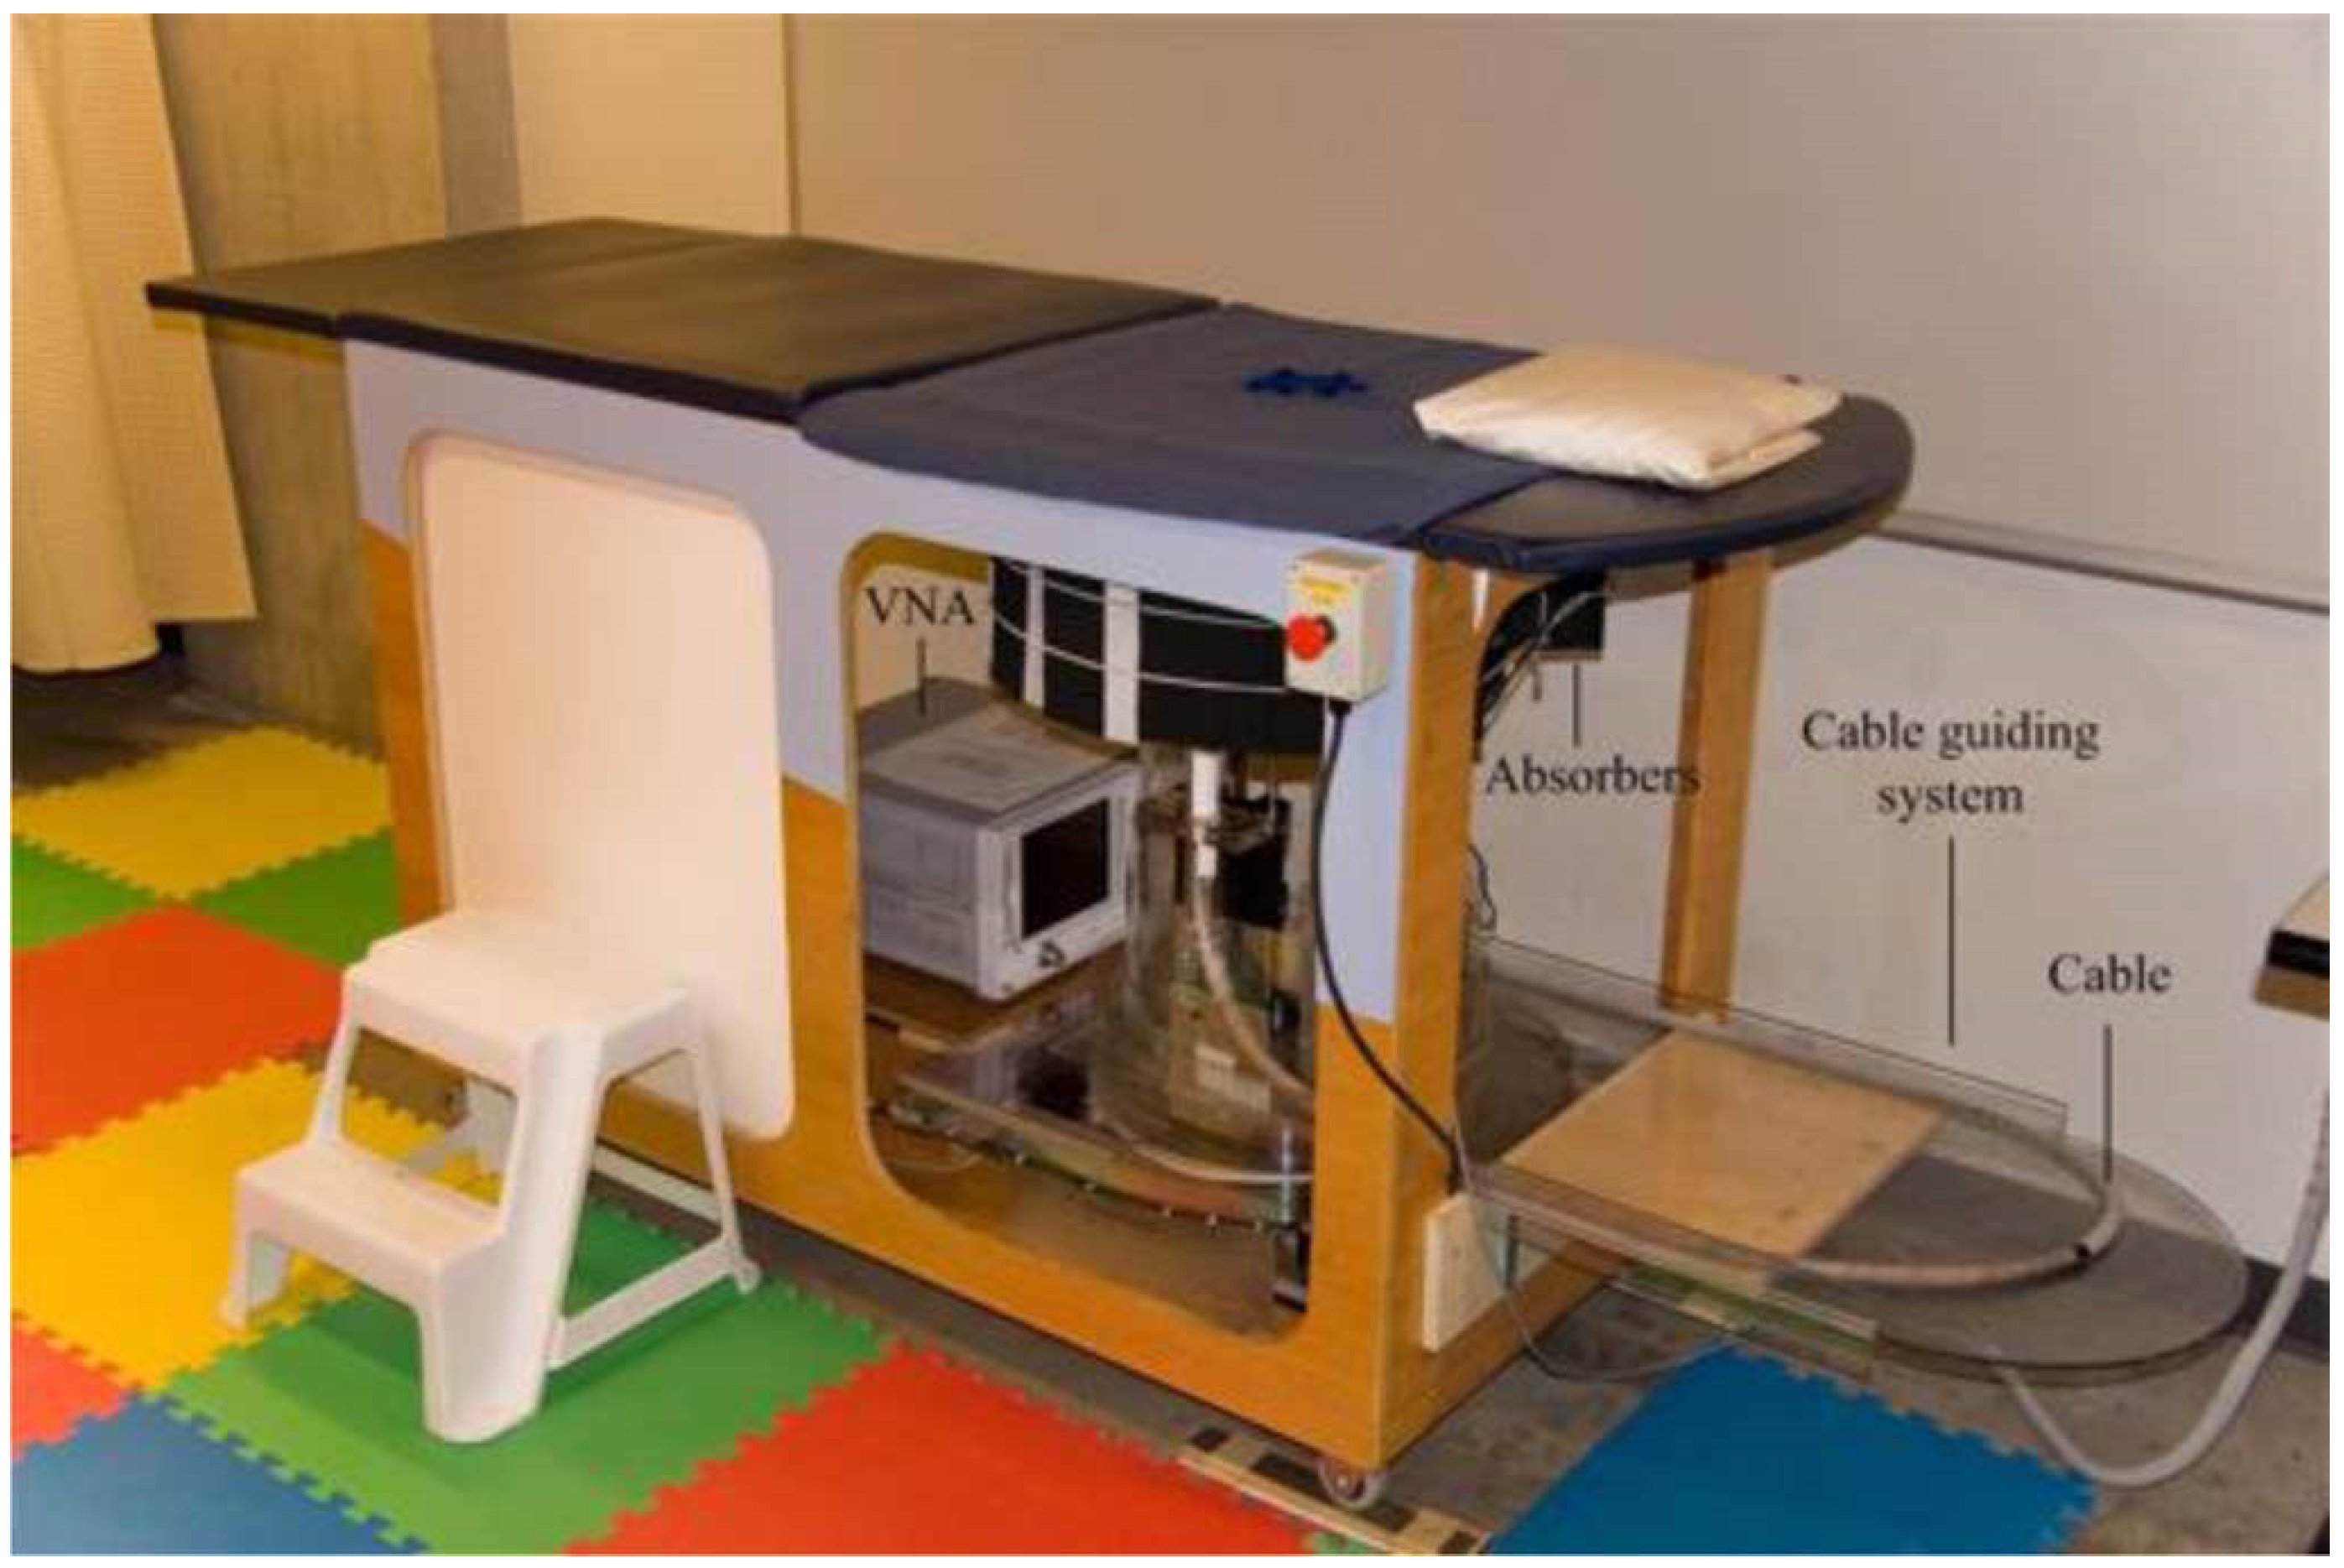
3.2. Patient Scanning
3.3. Preprocessing
4. Results
- The first column in each table lists the imaging algorithm used to image the patient.
- The second column lists clinically identified (CI) regions of interest (ROI) that were detected through either clinical imaging or clinical examination and are expected to be detected in the microwave images. Any additional high intensity (HI) regions identified in microwave images (MI) are also listed in this column.
- The third column indicates whether CI-ROIs were detected in microwave images (MI).
- The fourth column of the table lists the Signal-to-Mean Ratio (SMR) of each high intensity region detected in the microwave images. The SMR is a measure of the quality of the beamformed image that provides a measure of separation between the ROI and the background clutter. It is defined as the ratio of the average intensity of the ROI to the average intensity of the overall 3D image.
- The fifth column lists the Full-width Half Maximum (FWHM) of each high intensity region detected in the microwave images. The FWHM may be used to estimate the extent of the ROI in the image. The FWHM is defined as twice the distance from peak intensity in the ROI to the point where intensity of ROI drops by half. The FWHM is computed by growing a region around the centroid of the ROI until the ROI intensity drops by half. Twice the average Euclidean distance from the centroid of the ROI to the end of the region is estimated to be the FWHM.
- The last column ranks the performance of each algorithm in terms of the detection of the CI-ROI and the quality of the image.
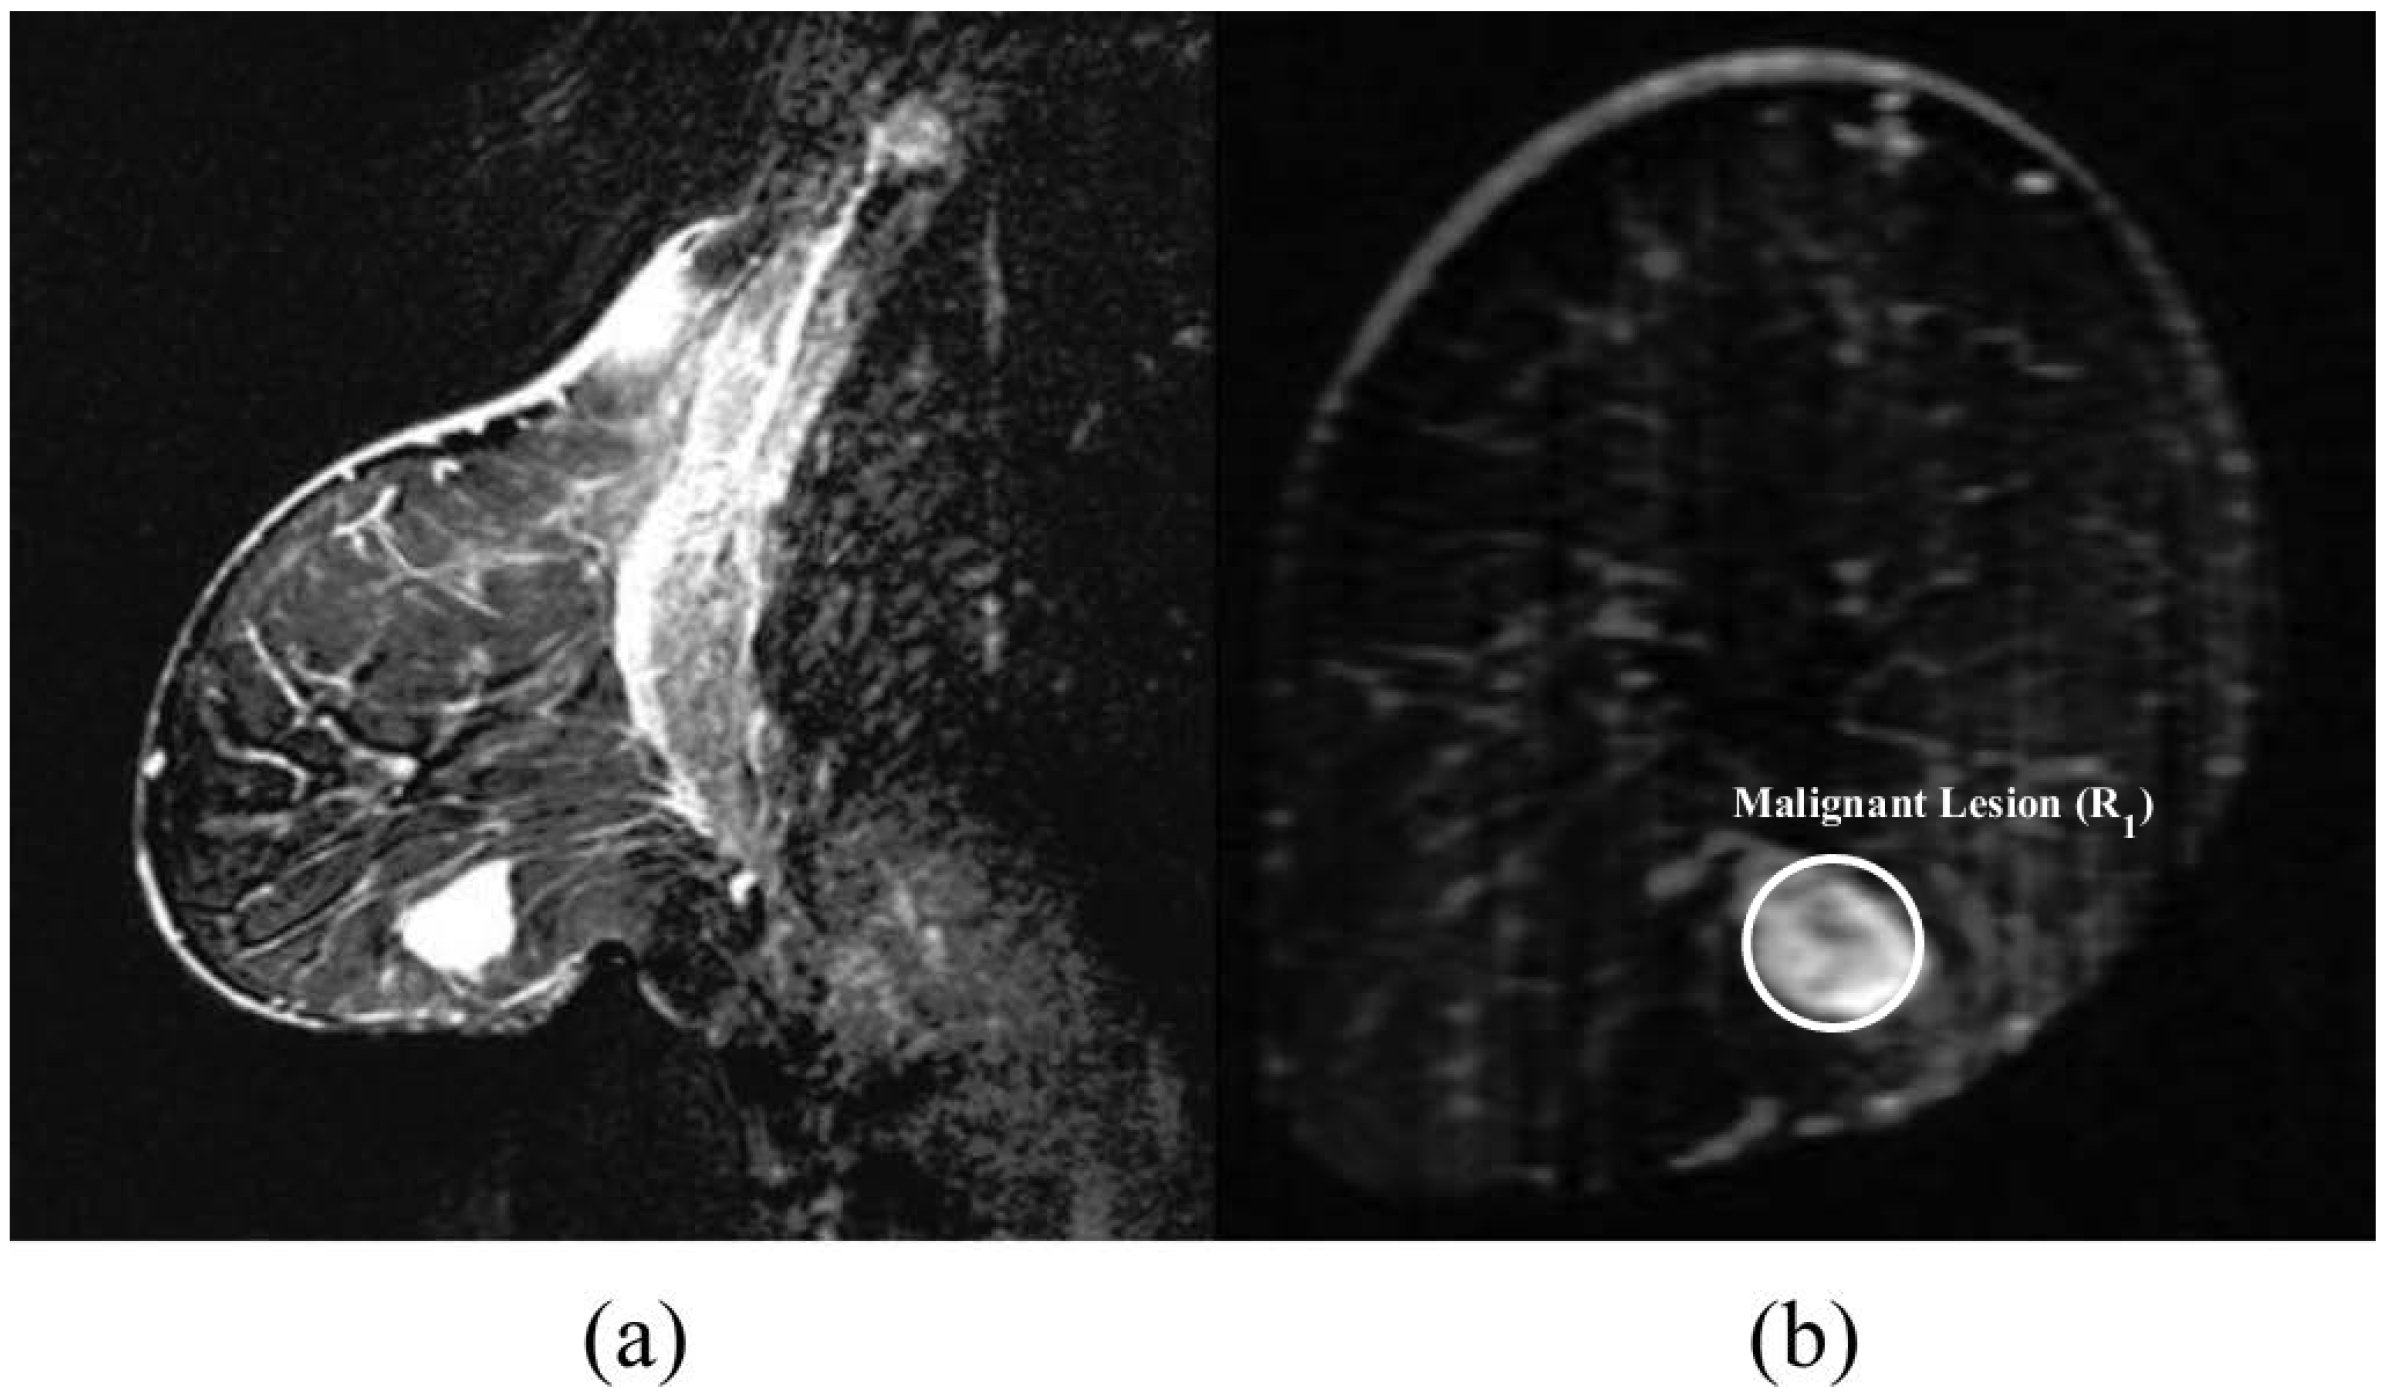
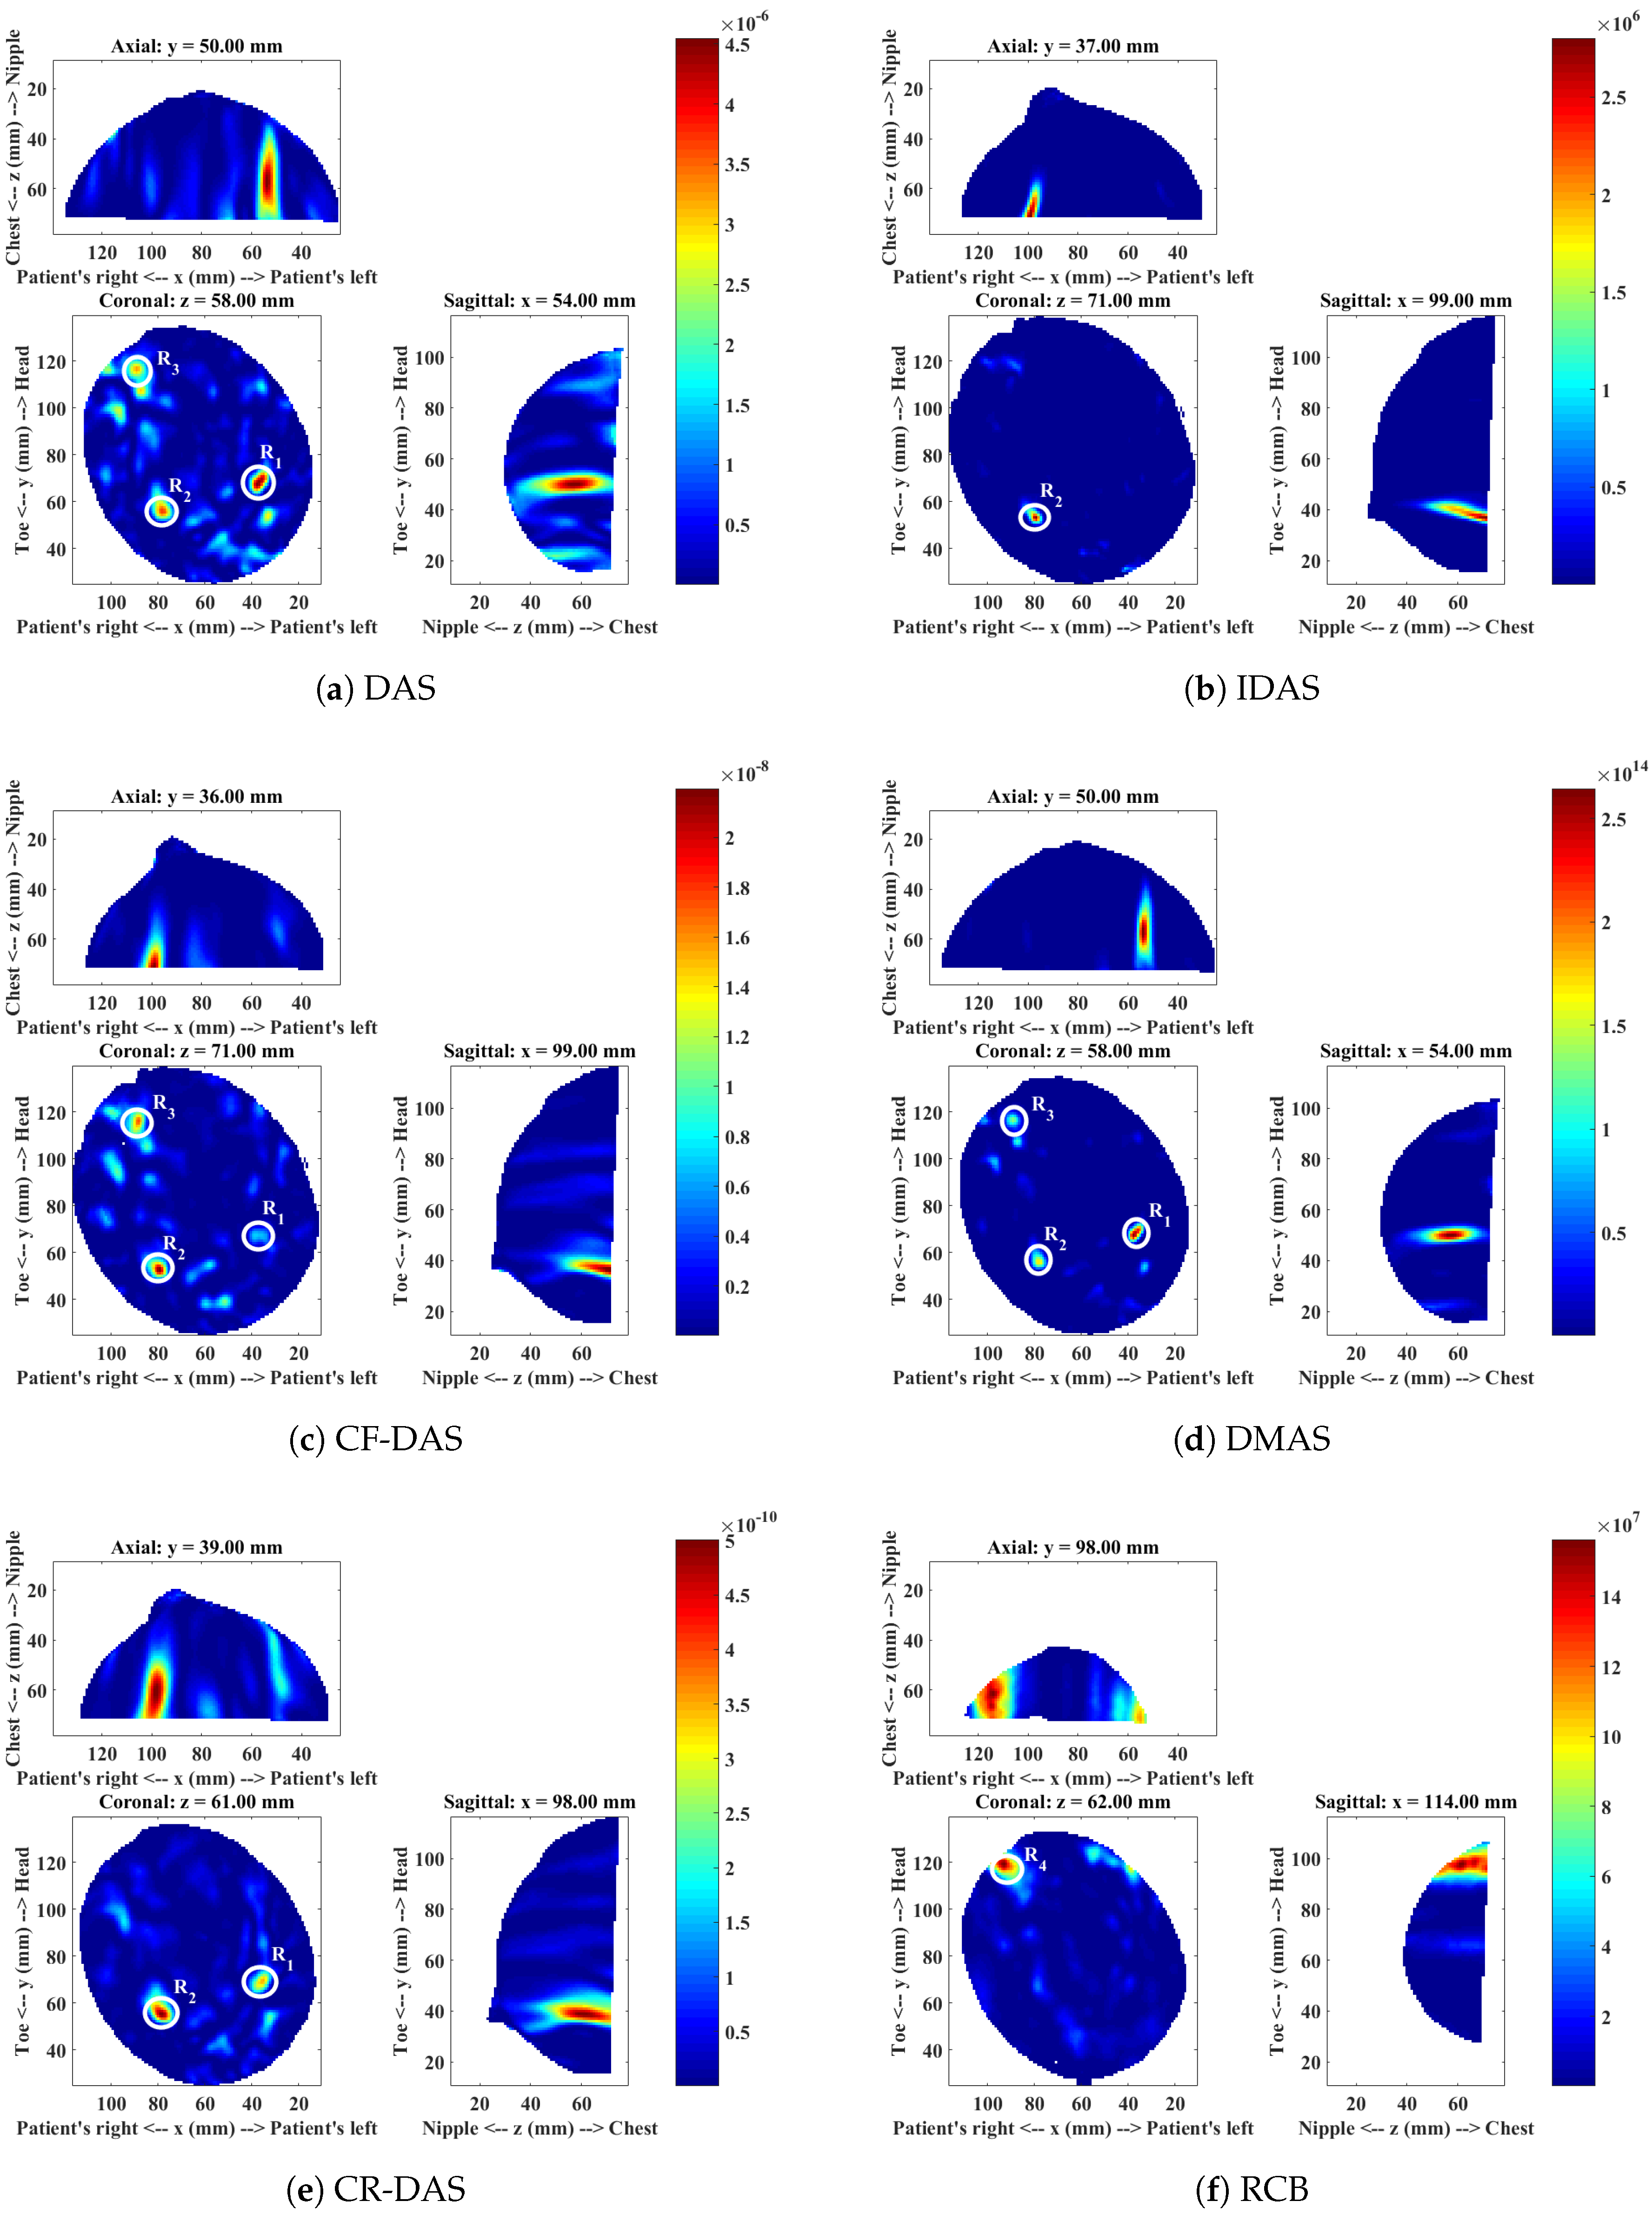
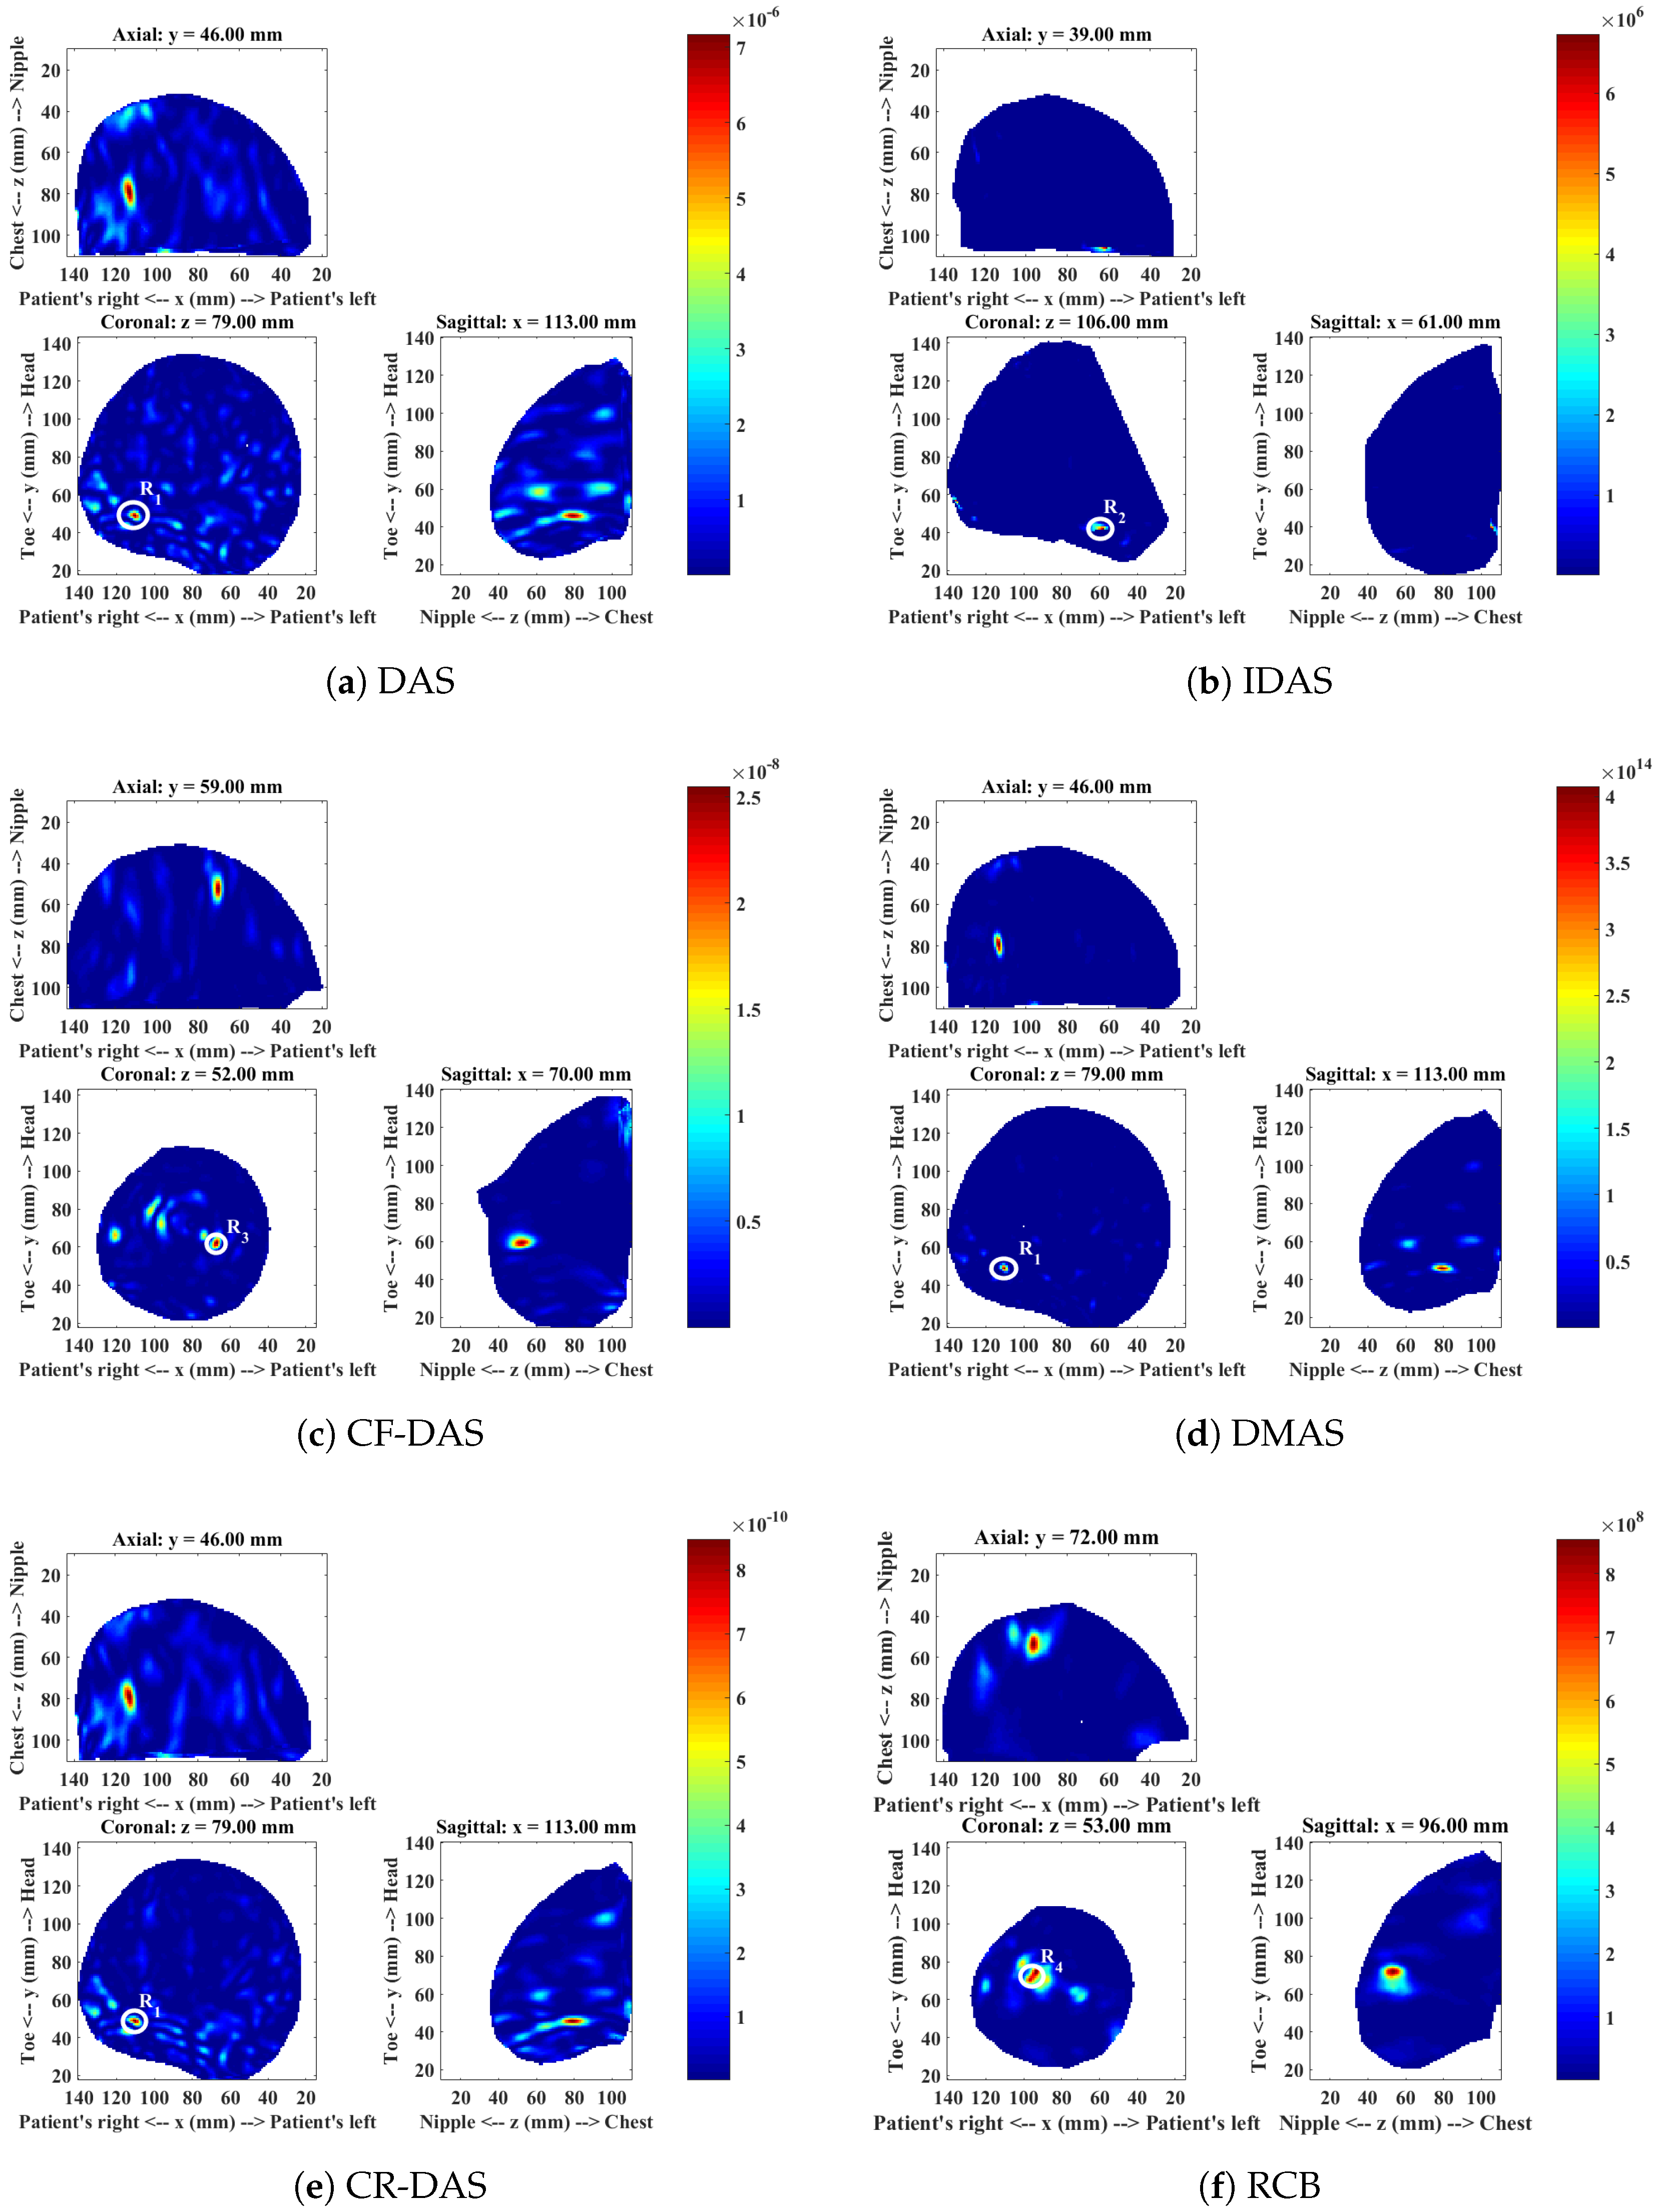
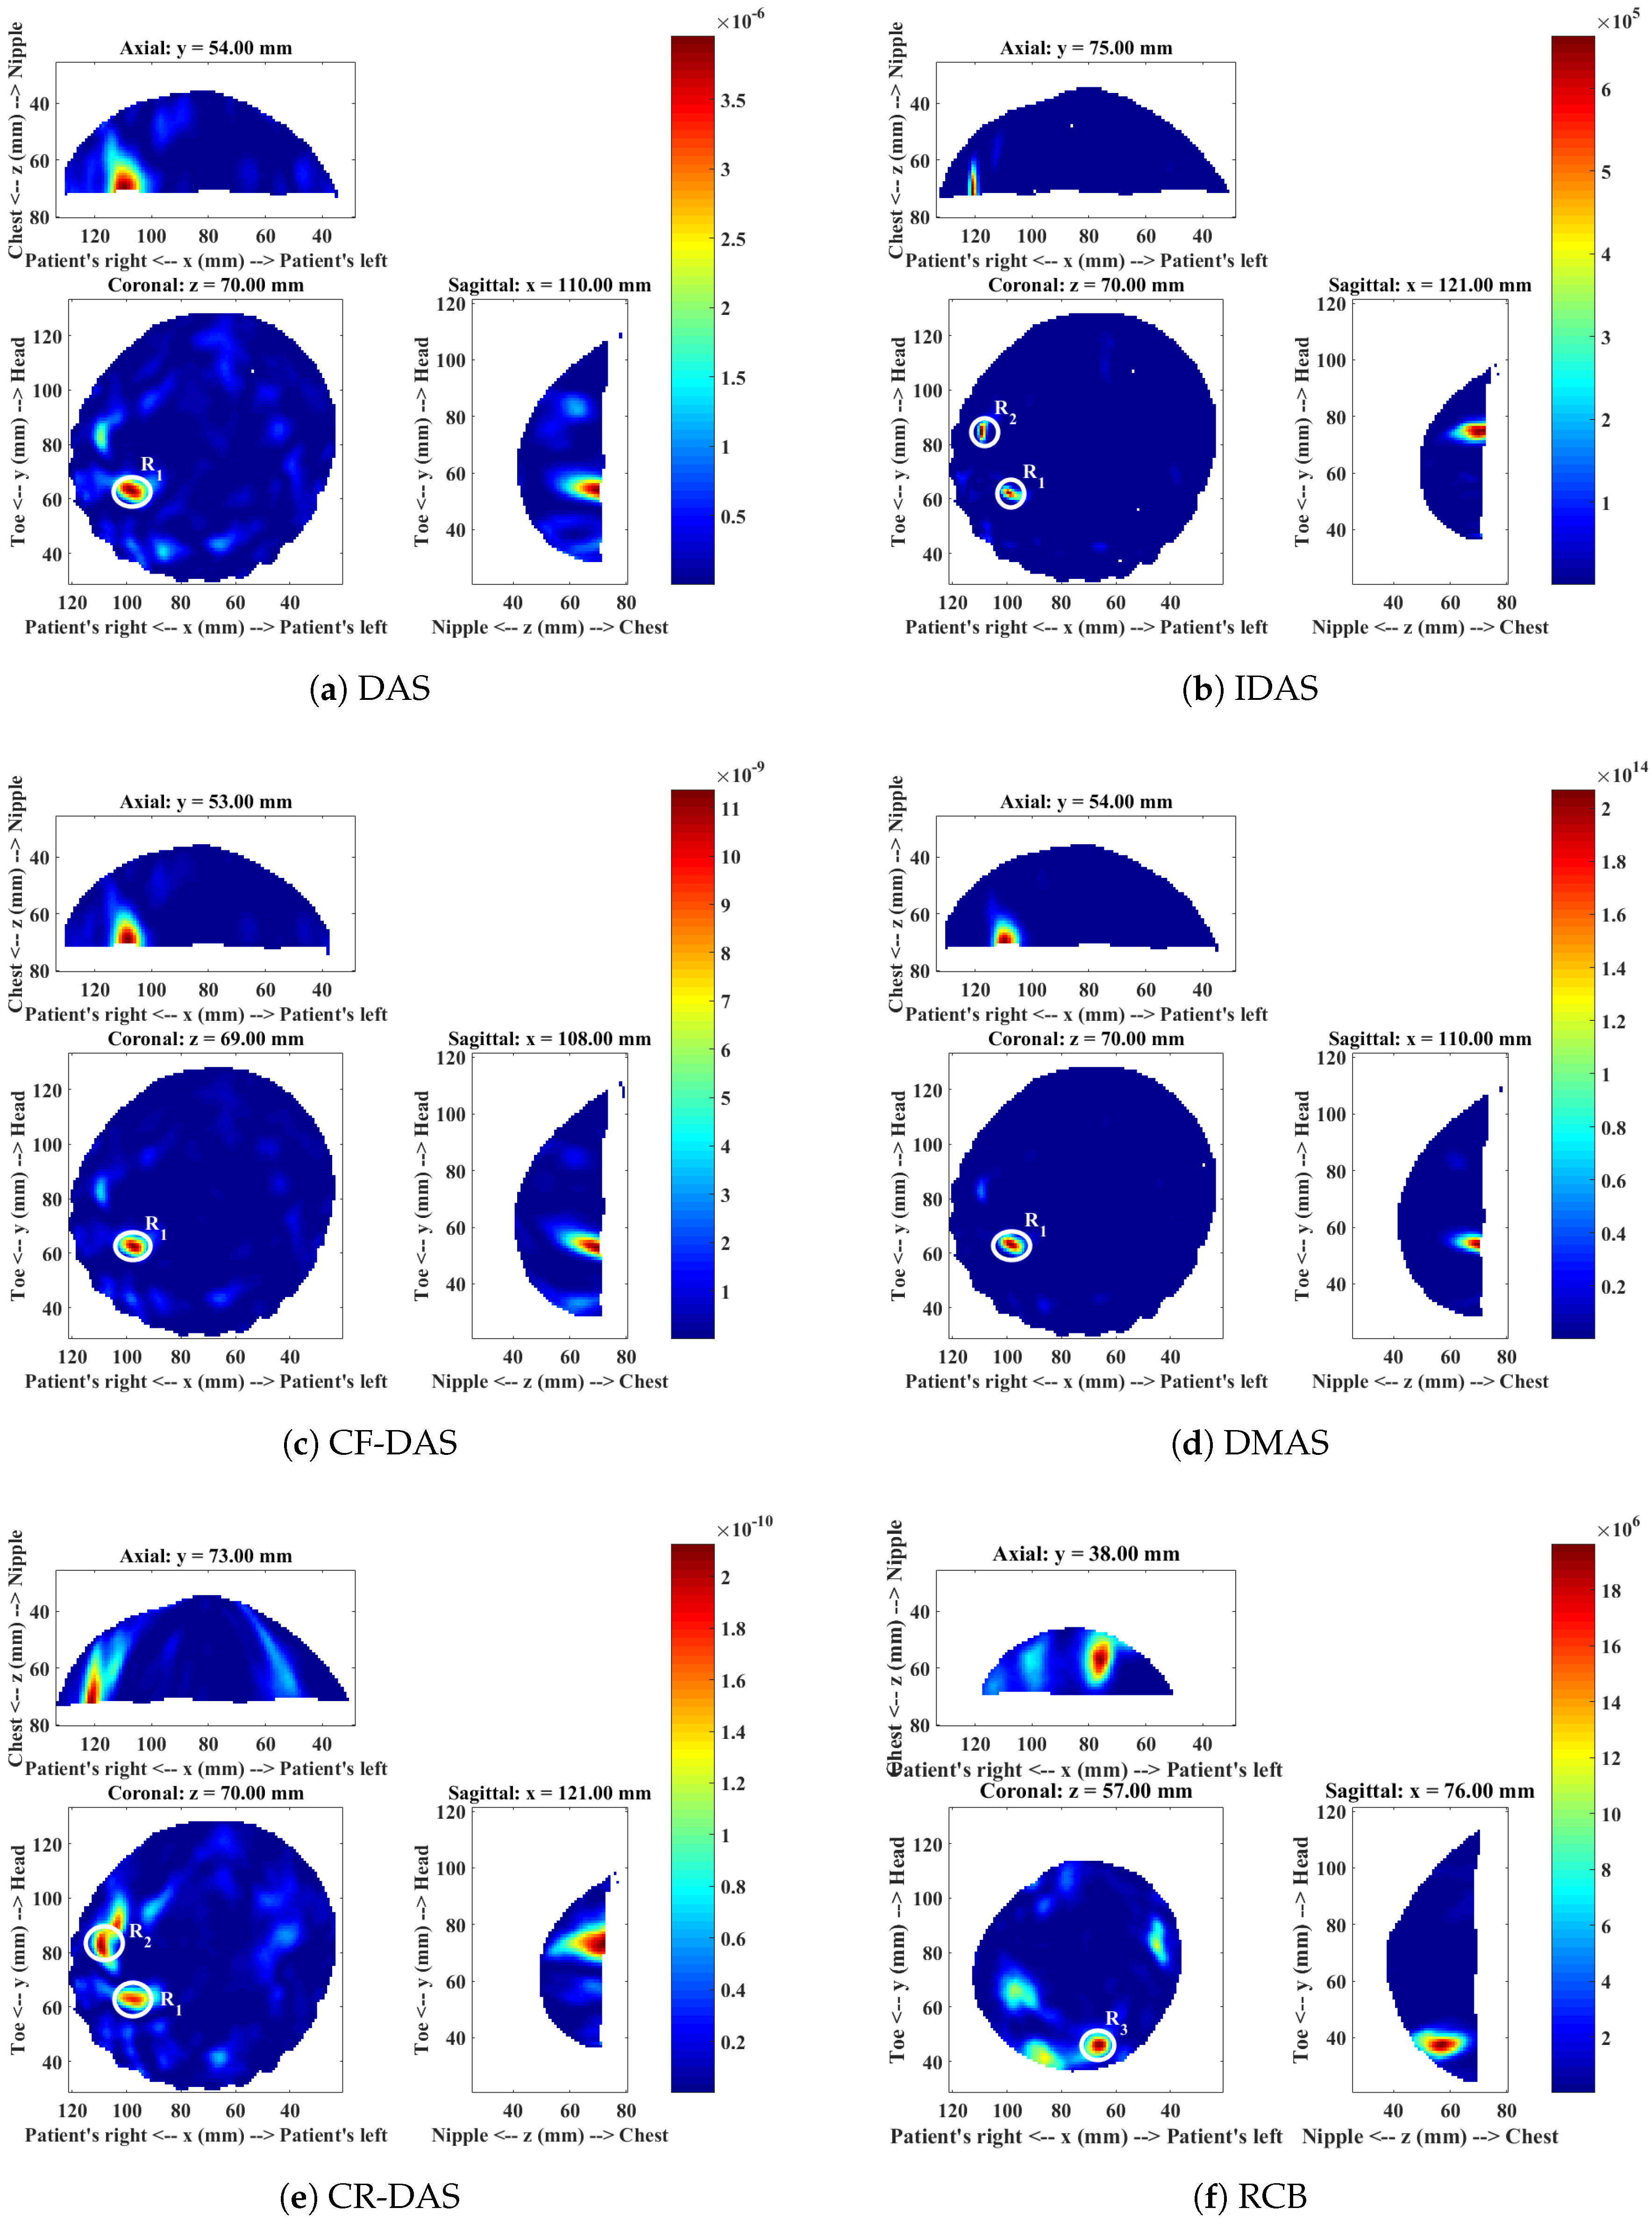
4.1. Patient 1
4.2. Patient 2
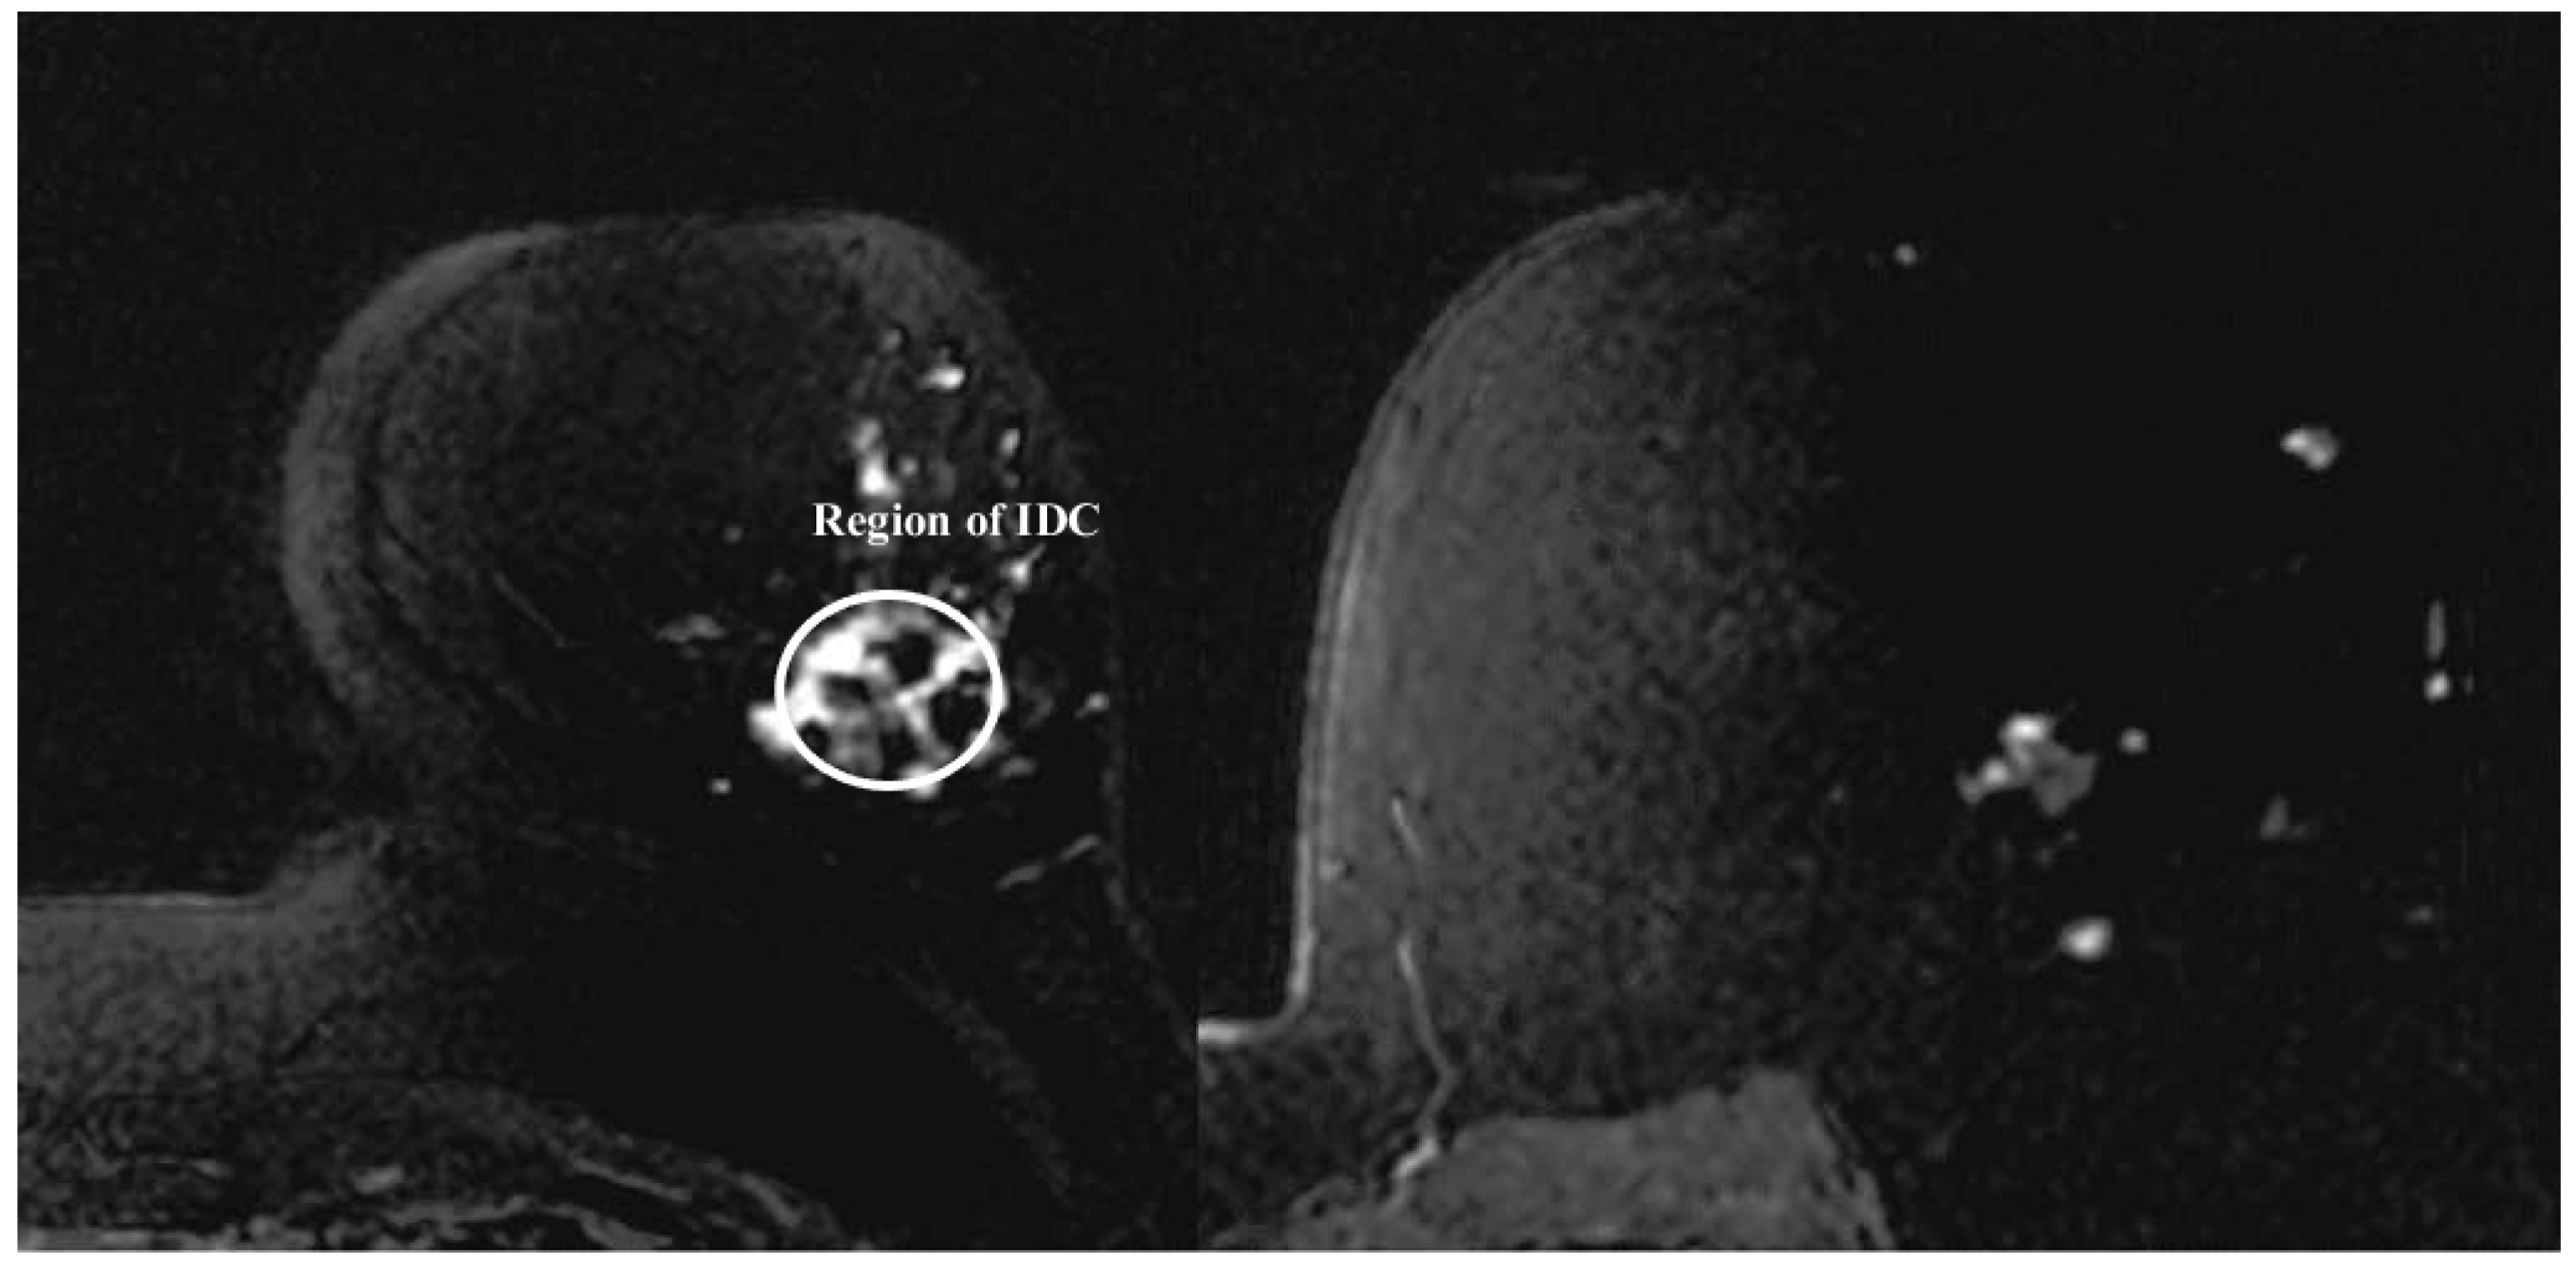
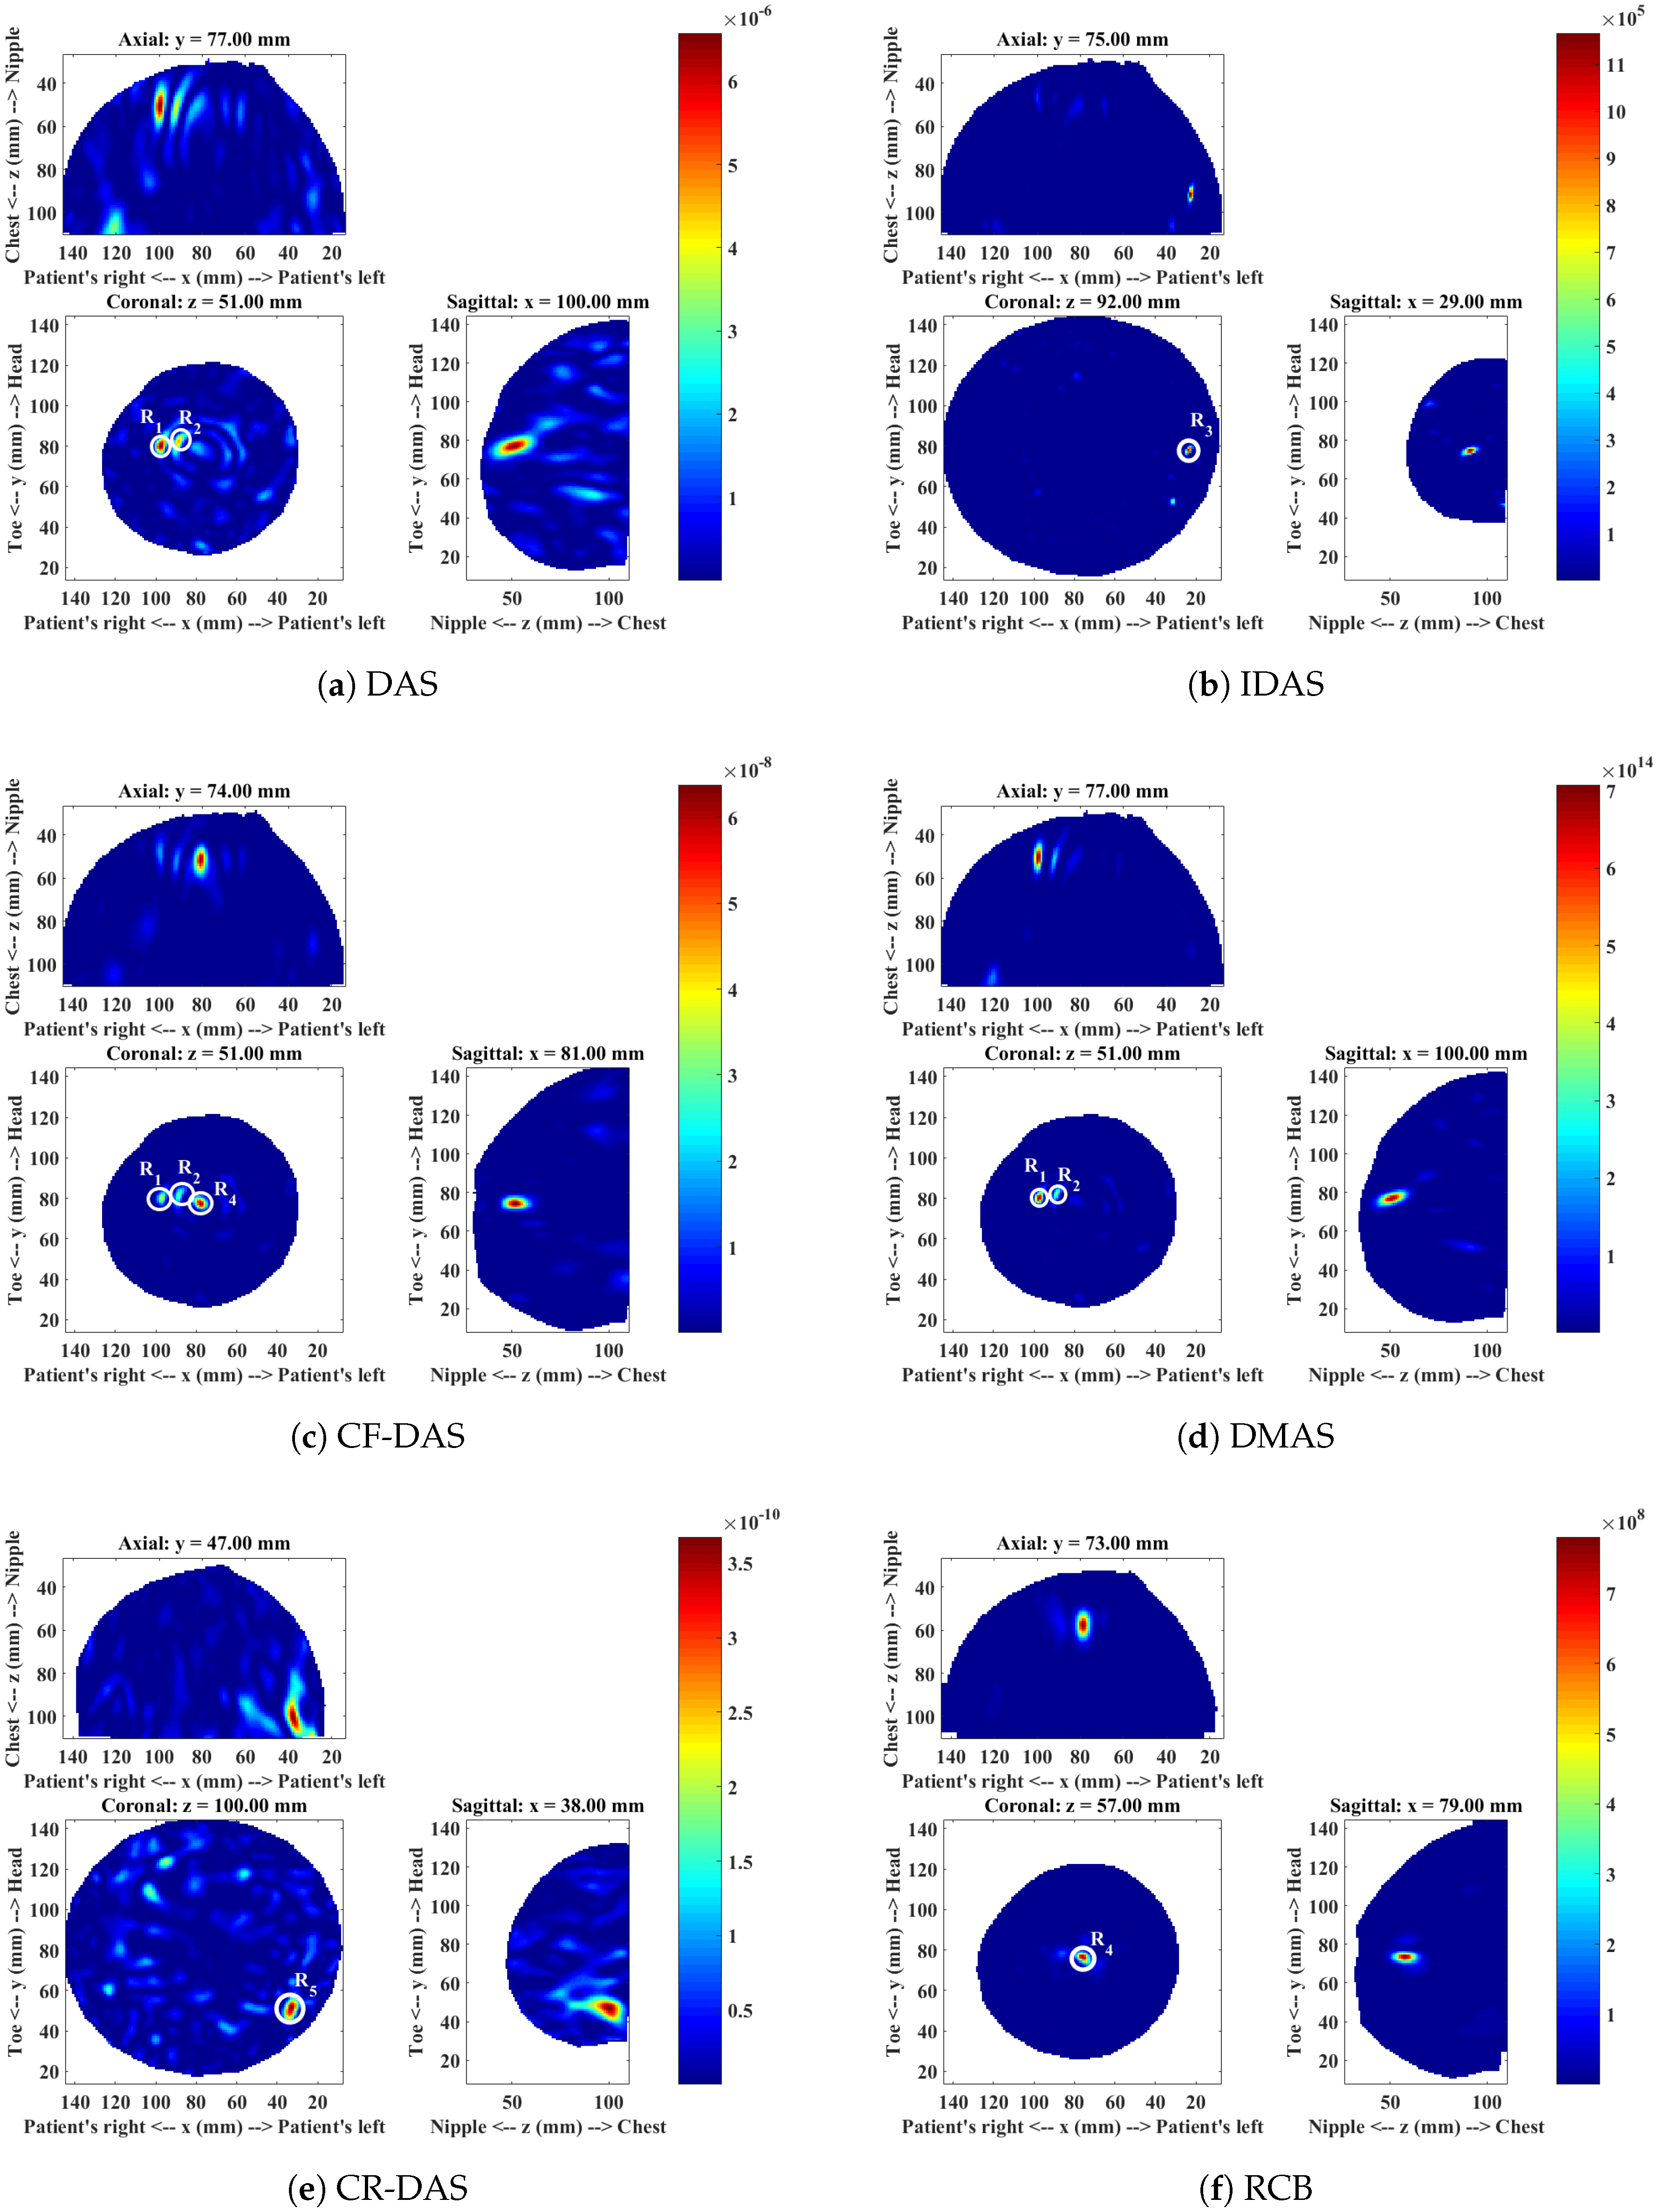
4.3. Patient 3
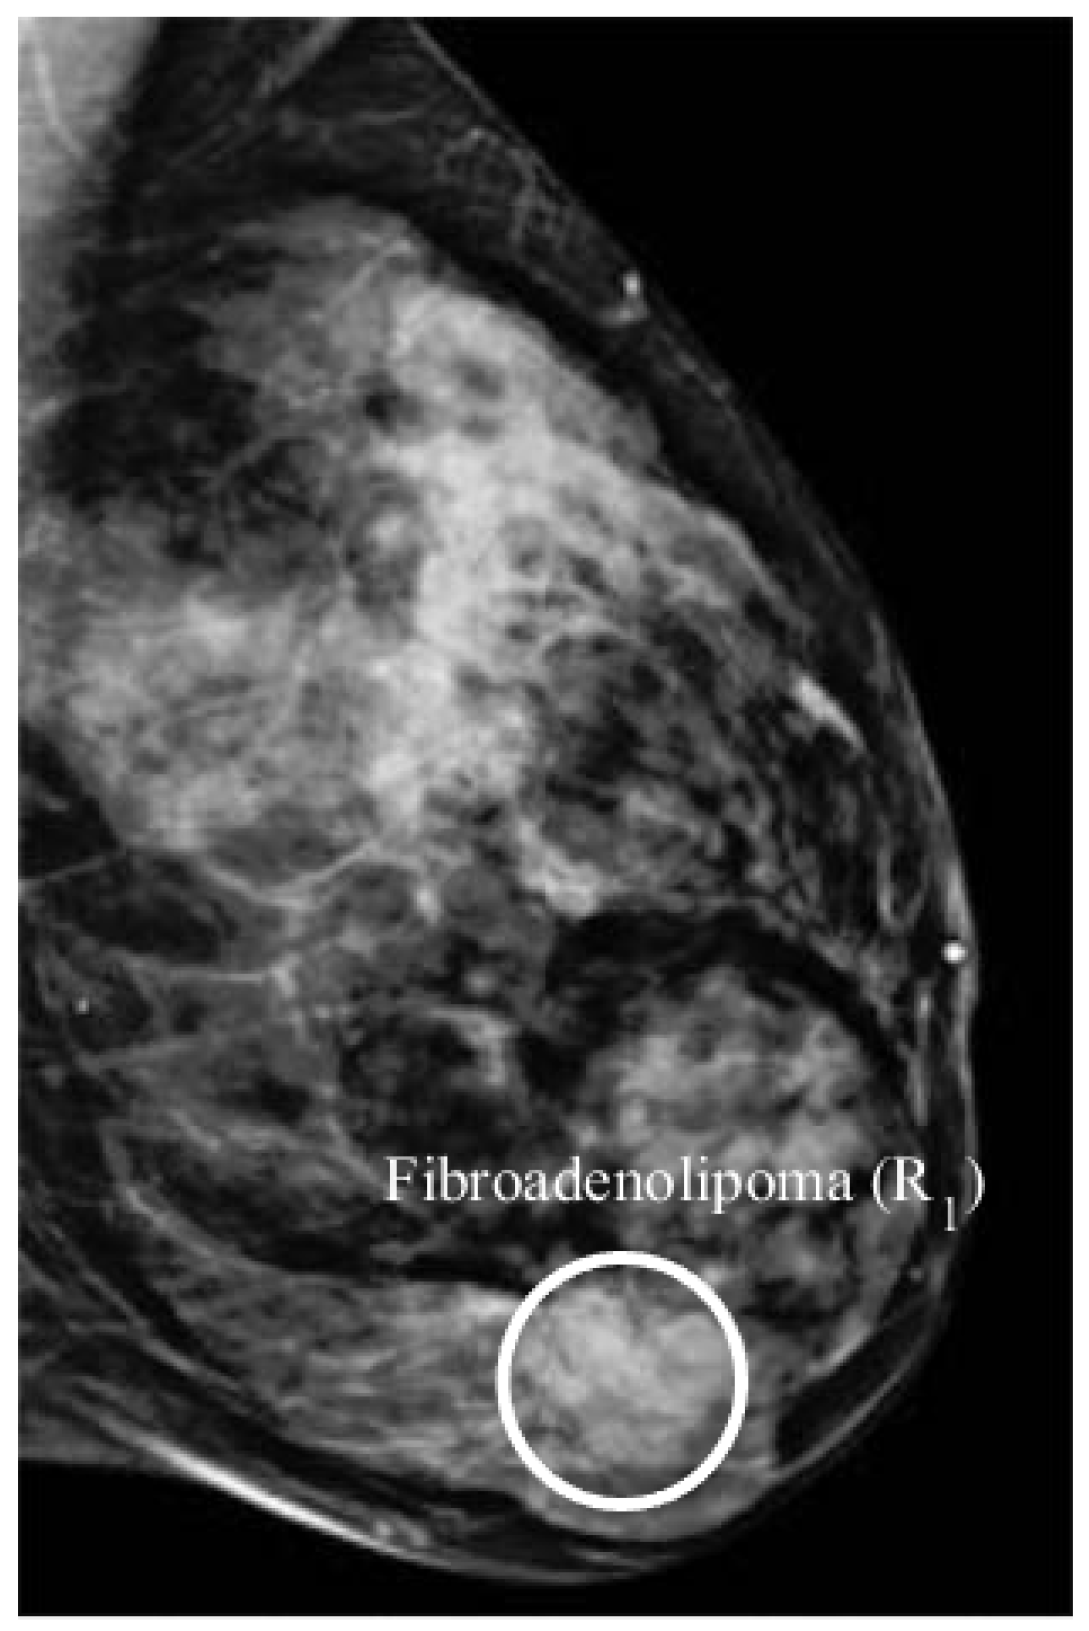
4.4. Patient 4
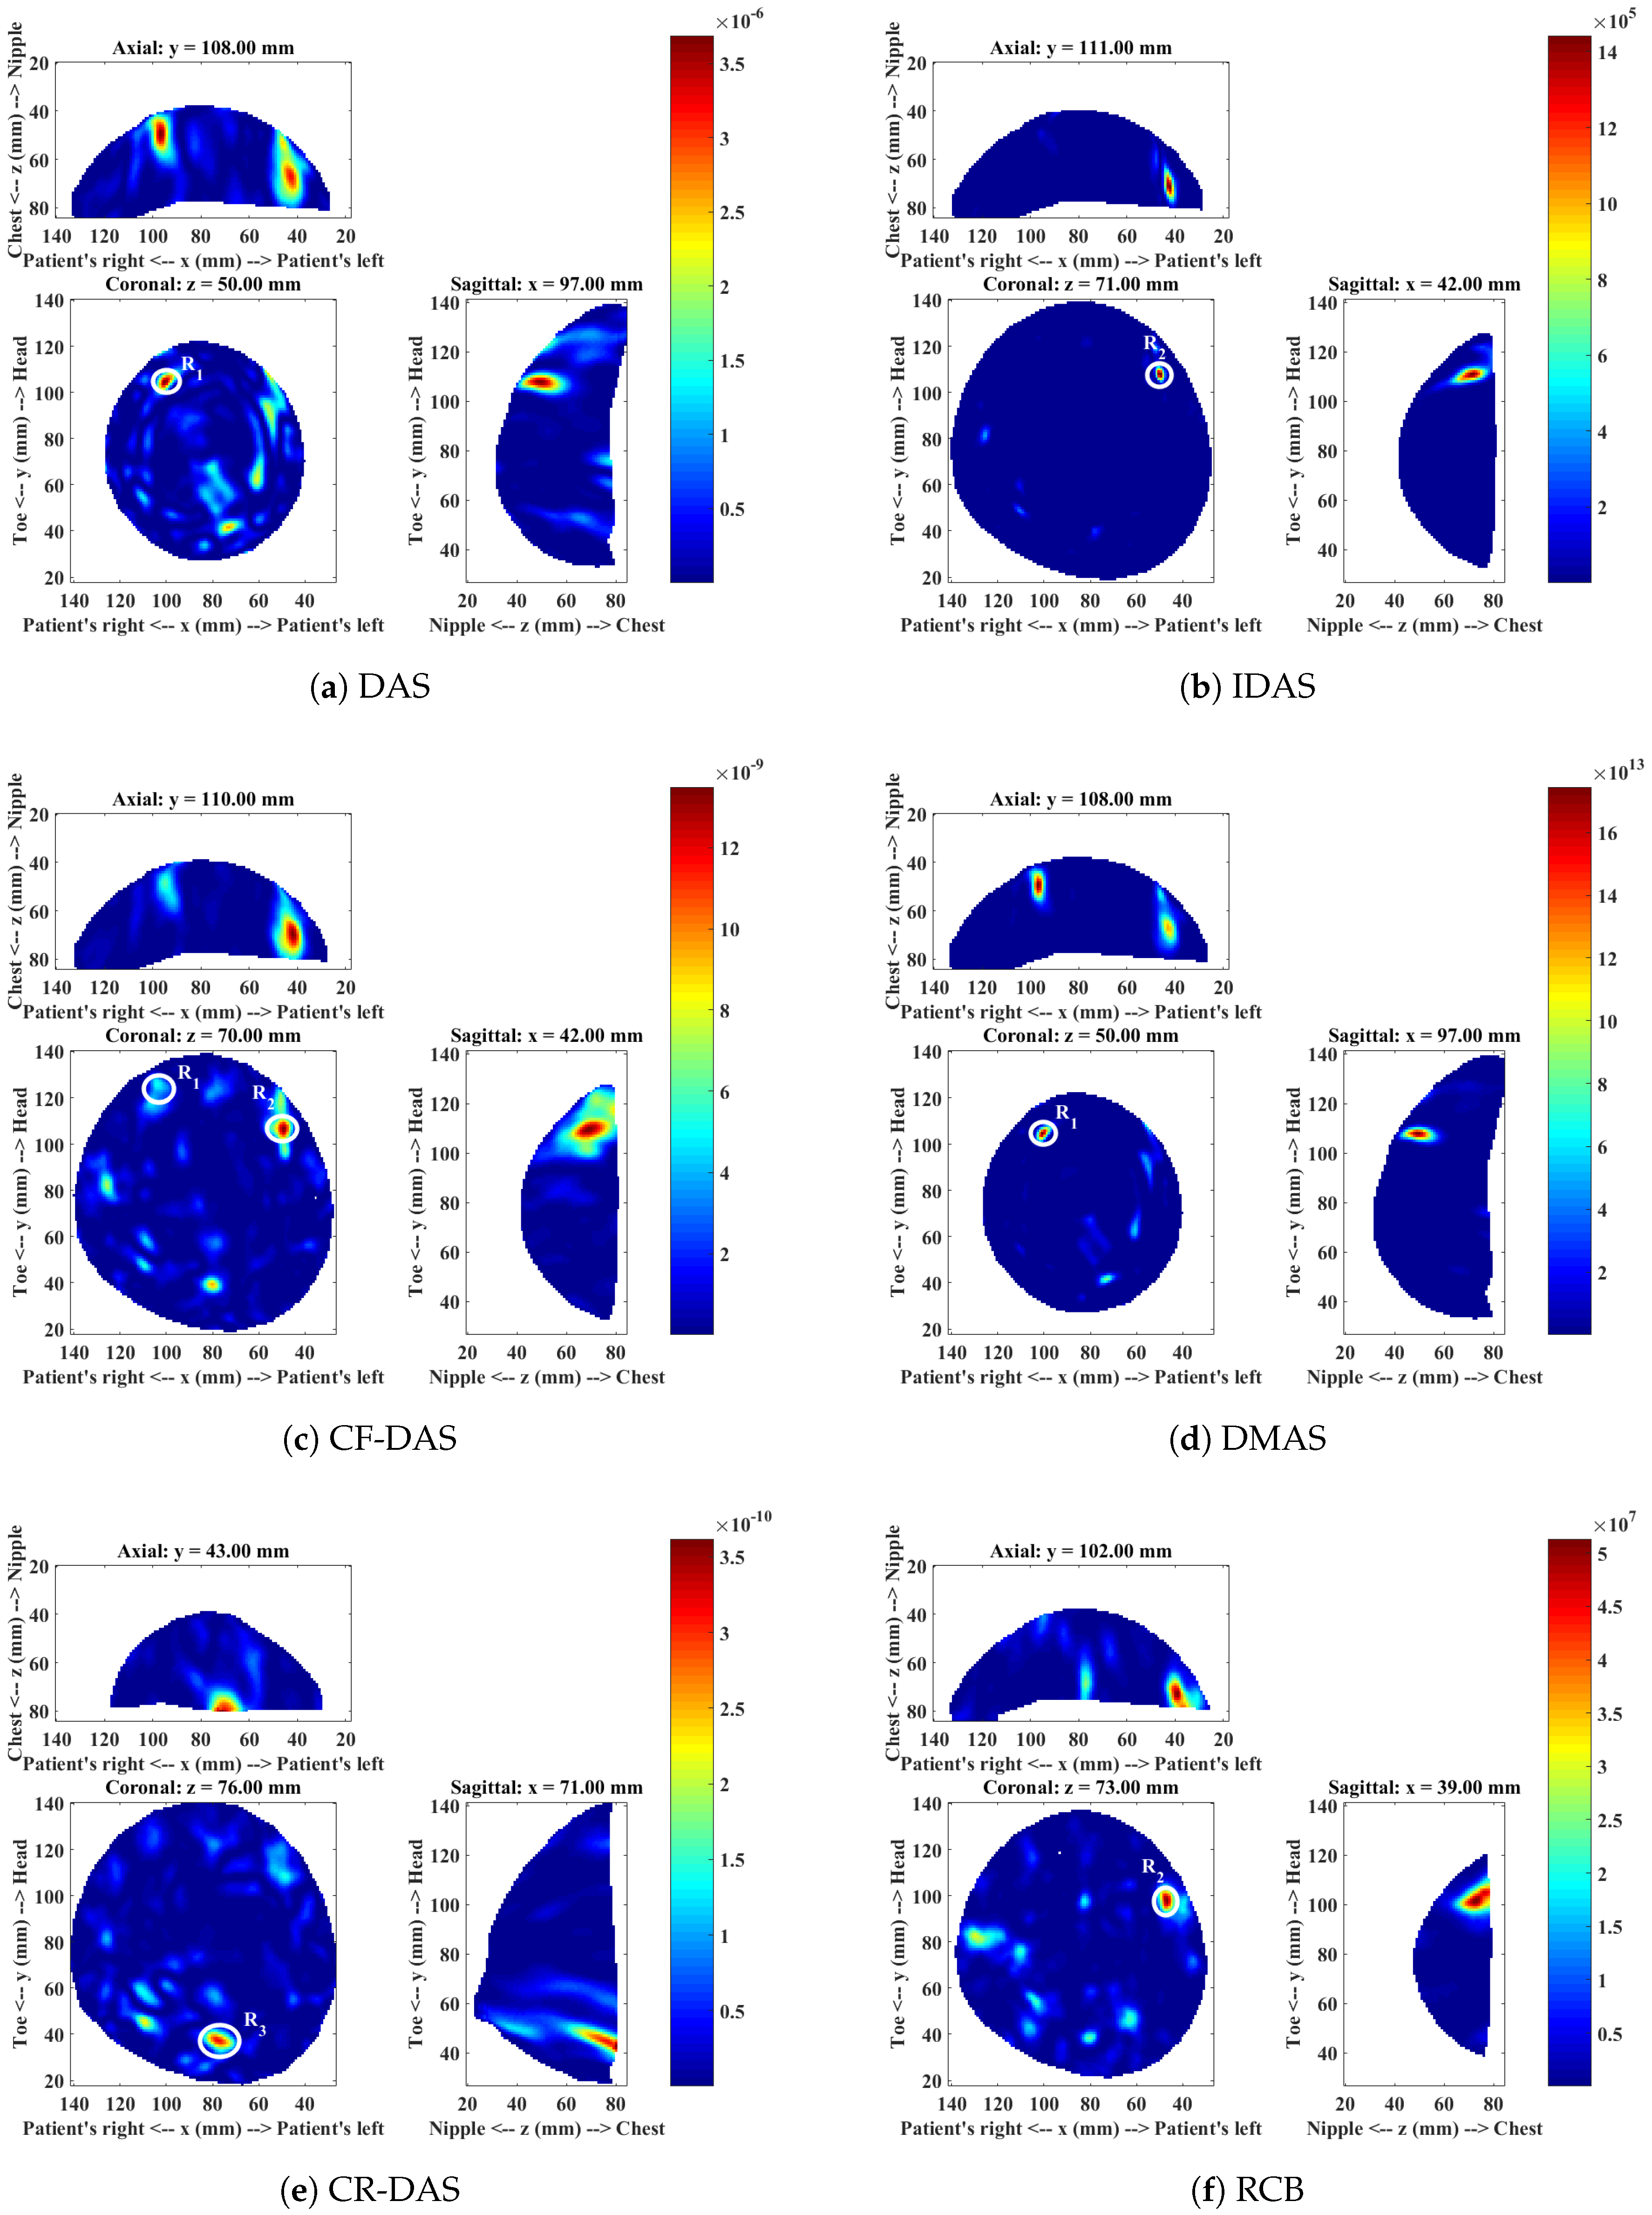
4.5. Patient 5
5. Discussion
6. Conclusions
Author Contributions
Acknowledgments
Conflicts of Interest
References
- Hagness, S.C.; Taflove, A.; Bridges, J.E. Three-dimensional FDTD analysis of a pulsed microwave confocal system for breast cancer detection: Design of an antenna-array element. IEEE Trans. Antennas Propag. 1999, 47, 783–791. [Google Scholar] [CrossRef]
- Fear, E.C.; Li, X.; Member, S.; Hagness, S.C.; Stuchly, M.A. Confocal Microwave Imaging for Breast Cancer Detection: Localization of Tumors in Three Dimensions. IEEE Trans. Biomed. Eng. 2002, 49, 812–822. [Google Scholar] [CrossRef] [PubMed]
- Davis, S.K.; Li, X.; Bond, E.J.; Hagness, S.C.; Van Veen, B.D. Frequency-Domain penalized least-squares beamformer design for early detection of breast cancer via microwave imaging. In Proceedings of the Sensor Array and Multichannel Signal Processing Workshop, Rosslyn, VA, USA, 6 August 2002; pp. 120–124. [Google Scholar]
- Bond, E.J.; Li, X.; Hagness, S.C.; Van Veen, B.D. Microwave imaging via space-time beamforming for early detection of breast cancer. IEEE Trans. Antennas Propag. 2003, 51, 1690–1705. [Google Scholar] [CrossRef]
- Li, X.; Davis, S.K.; Hagness, S.C.; Van Der Weide, D.W.; Van Veen, B.D. Microwave imaging via space-time beamforming: Experimental investigation of tumor detection in multilayer breast phantoms. IEEE Trans. Microw. Theory Tech. 2004, 52, 1856–1865. [Google Scholar] [CrossRef]
- Klemm, M.; Craddock, I.J.; Preece, A.; Leendertz, J.; Benjamin, R. Evaluation of a hemi-spherical wideband antenna array for breast cancer imaging. Radio Sci. 2008, 43, 1–15. [Google Scholar] [CrossRef]
- Klemm, M.; Craddock, I.J.; Leendertz, J.A.; Preece, A.; Benjamin, R. Radar-Based Breast Cancer Detection Using a Hemispherical Antenna Array—Experimental Results. IEEE Trans. Antennas Propag. 2009, 57, 1692–1704. [Google Scholar] [CrossRef]
- O’Halloran, M.; Glavin, M.; Jones, E. Improved Confocal Microwave Imaging of the breast using path-dependent signal weighting. In Proceedings of the 2011 XXXth URSI General Assembly and Scientific Symposium, Istanbul, Turkey, 13 –20 August 2011; pp. 1–4. [Google Scholar]
- Stoica, P.; Wang, Z.; Li, J. Robust capon beamforming. IEEE Signal Process. Lett. 2003, 10, 172–175. [Google Scholar] [CrossRef]
- Li, J.; Stoica, P.; Wang, Z. On robust Capon beamforming and diagonal loading. IEEE Trans. Signal Process. 2003, 51, 1702–1715. [Google Scholar]
- Guo, B.; Wang, Y.; Li, J.; Stoica, P.; Wu, R. Microwave imaging via adaptive beamforming methods for breast cancer detection. J. Electromagn. Waves Appl. 2006, 20, 53–63. [Google Scholar] [CrossRef]
- Xie, Y.; Guo, B.; Xu, L.; Li, J.; Stoica, P. Multistatic adaptive microwave imaging for early breast cancer detection. IEEE Trans. Biomed. Eng. 2006, 53, 1647–1657. [Google Scholar] [CrossRef] [PubMed]
- Loughlin, D.O.; Elahi, M.A.; Porter, E.; Shahzad, A.; Oliveira, B.L.; Glavin, M.; Jones, E.; Halloran, M.O. Open-source Software for Microwave Radar- based Image Reconstruction. In Proceedings of the 12th European Conference on Antennas and Propagation, London, UK, 9–13 April 2018; pp. 9–13. [Google Scholar]
- Noghanian, S.; Sabouni, A.; Desell, T.; Ashtari, A. Microwave Tomography; Springer: New York, NY, USA, 2014. [Google Scholar]
- Byrne, D.; O’Halloran, M.; Jones, E.; Glavin, M. A comparison of data-independent microwave beamforming algorithms for the early detection of breast cancer. In Proceedings of the 2009 Annual International Conference of the IEEE Engineering in Medicine and Biology Society, Minneapolis, MN, USA, 3–6 September 2009; pp. 2731–2734. [Google Scholar]
- O’Halloran, M.; Glavin, M.; Jones, E. Effects of Fibroglandular Tissue Distribution on Data-Independent Beamforming Algorithms. Prog. Electromagn. Res. 2009, 97, 141–158. [Google Scholar] [CrossRef]
- Byrne, D.; O’Halloran, M. Data independent radar beamforming algorithms for breast cancer detection. Prog. Electromagn. Res. 2010, 107, 331–348. [Google Scholar] [CrossRef]
- Byrne, D.; O’Halloran, M.; Jones, E.; Glavin, M. Transmitter-grouping robust Capon beamforming for breast cancer detection. Prog. Electromagn. Res. 2010, 108, 401–416. [Google Scholar] [CrossRef]
- Kirshin, E.; Zhu, G.K. Evaluation of the mono-static microwave radar algorithms for breast imaging. In Proceedings of the 5th European Conference on Antennas and Propagation (EuCAP 2011), Rome, Italy, 11–15 April 2011; pp. 881–885. [Google Scholar]
- Moll, J.; Kexel, C.; Krozer, V. A comparison of beamforming methods for microwave breast cancer detection in homogeneous and heterogeneous tissue. In Proceedings of the 2013 European Radar Conference (EuRAD), Nuremberg, Germany, 6–10 October 2013; pp. 527–530. [Google Scholar]
- Li, Y.; Porter, E.; Coates, M. Imaging-based classification algorithms on clinical trial data with injected tumour responses. In Proceedings of the 9th European Conference on Antennas and Propagation (EuCAP 2015), Lisbon, Portugal, 13–17 April 2015; pp. 1–5. [Google Scholar]
- Elahi, M.A.; Lavoie, B.R.; Porter, E.; Olavini, M.; Jones, E.; Fear, E.C.; O’Halloran, M. Comparison of radar-based microwave imaging algorithms applied to experimental breast phantoms. In Proceedings of the 2017 IEEE XXXIInd General Assembly and Scientific Symposium of the International Union of Radio Science (URSI GASS), Montreal, QC, Canada, 19–26 August 2017; pp. 1–4. [Google Scholar]
- O’Loughlin, D.; O’Halloran, M.J.; Moloney, B.M.; Glavin, M.; Jones, E.; Elahi, M.A. Microwave Breast Imaging: Clinical Advances and Remaining Challenges. IEEE Trans. Biomed. Eng. 2018. [Google Scholar] [CrossRef]
- Fear, E.C.; Bourqui, J.; Curtis, C.; Mew, D.; Docktor, B.; Romano, C. Microwave breast imaging with a monostatic radar-based system: A study of application to patients. IEEE Trans. Microw. Theory Tech. 2013, 61, 2119–2128. [Google Scholar] [CrossRef]
- Bourqui, J.; Fear, E.C.; Sill, J.M. A Prototype System for Measuring Microwave Frequency Reflections from the Breast. Int. J. Biomed. Imaging 2012, 2012, 851234. [Google Scholar] [CrossRef] [PubMed]
- Hagness, S.C.; Taflove, A.; Bridges, J.E.; Fellow, L. Two-Dimensional FDTD Analysis of a Pulsed Microwave Confocal System for Breast Cancer Detection: Fixed-Focus and Antenna-Array Sensors. IEEE Trans. Biomed. Eng. 1998, 45, 1470–1479. [Google Scholar] [CrossRef] [PubMed]
- Lim, H.B.; Nhung, N.T.T. Confocal microwave imaging for breast cancer detection: Delay-multiply-and-sum image reconstruction algorithm. IEEE Trans. Biomed. Eng. 2008, 55, 1697–1704. [Google Scholar] [PubMed]
- Klemm, M.; Craddock, I.J.; Leendertz, J.A.; Preece, A.; Benjamin, R. Improved Delay-and-Sum Beamforming Algorithm for Breast Cancer Detection. Int. J. Antennas Propag. 2008, 2008, 761402. [Google Scholar] [CrossRef]
- Klemm, M.; Leendertz, J.A.; Gibbins, D.; Craddock, I.J.; Preece, A.; Benjamin, R. Microwave Radar-Based Breast Cancer Detection : Imaging in Inhomogeneous Breast Phantoms. IEEE Antennas Wirel. Propag. Lett. 2009, 8, 1349–1352. [Google Scholar] [CrossRef]
- Wang, S.L.; Chang, C.H.; Yang, H.C.; Chou, Y.H.; Li, P.C. Performance evaluation of coherence-based adaptive imaging using clinical breast data. IEEE Trans. Ultrason. Ferroelectr. Freq. Control 2007, 54, 1669–1679. [Google Scholar] [CrossRef] [PubMed]
- Bourqui, J.; Okoniewski, M.; Fear, E.C. Balanced antipodal Vivaldi antenna with dielectric director for near-field microwave imaging. IEEE Trans. Antennas Propag. 2010, 58, 2318–2326. [Google Scholar] [CrossRef]
- Williams, T.C.; Bourqui, J.; Cameron, T.R.; Okoniewski, M.; Fear, E.C.; Lim, H.B.; Nhung, N.T.T. Laser Surface Estimation for Microwave Breast Imaging Systems. IEEE Trans. Biomed. Eng. 2011, 58, 1193–1199. [Google Scholar] [CrossRef] [PubMed]
- Sill, J.M.; Fear, E.C. Tissue Sensing Adaptive Radar for Breast Cancer Detection-Experimental Investigation of Simple Tumor Models. IEEE Trans. Microw. Theory Tech. 2005, 53, 3312–3319. [Google Scholar] [CrossRef]
- Maklad, B.; Curtis, C. Neighborhood-based algorithm to facilitate the reduction of skin reflections in radar-based microwave imaging. Prog. Electromagn. Res. B 2012, 39, 115–139. [Google Scholar] [CrossRef]
- Jiang, Y.; Stoica, P.; Wang, Z.; Li, J. Capon beamforming in the presence of steering vector errors and coherent signals. In Proceedings of the 11th Annual Workshop on Adaptive Sensor Array Processing, Lexington, MA, USA, 11–13 March 2003. [Google Scholar]
- Li, Y.; Porter, E.; Santorelli, A.; Popović, M.; Coates, M. Microwave breast cancer detection via cost-sensitive ensemble classifiers: Phantom and patient investigation. Biomed. Signal Process. Control 2017, 31, 366–376. [Google Scholar] [CrossRef]


| Patient | Age | Breast Imaged | # of Rows | Measurements per Row | Breast Density | Disease |
|---|---|---|---|---|---|---|
| Patient 1 | 53 | R | 6 | 30 | Heterogeneous | Malignancy |
| Patient 2 | 64 | L | 8 | 20 | Extremely dense | Benign |
| Patient 3 | 35 | L | 9 | 20 | Scattered/heterogeneous | Malignancy |
| Patient 4 | 44 | L | 5 | 30 | Heterogeneous | No disease |
| Patient 5 | 32 | L | 6 | 30 | Heterogeneous | No disease |
| Imaging Algorithms | ROI | CI-ROI Present in MI? | SMR (dB) | FWHM (mm) | Algorithms Rank | |
|---|---|---|---|---|---|---|
| DAS | CI | Malignant lesion () | Yes | 23.04 | 32.57 | 4 |
| CI | Benign lesion () | Yes | 21.32 | 31.19 | ||
| CI | Fibroglandular concentration () | Yes | 21.39 | 36.07 | ||
| IDAS | CI | Malignant lesion () | No | - | - | - |
| CI | Benign lesion () | Yes | 49.92 | 36.07 | ||
| CI | Fibroglandular concentration () | No | - | - | ||
| CFDAS | CI | Malignant lesion () | Yes | 25.80 | 27.14 | 2 |
| CI | Benign lesion () | Yes | 29.55 | 17.23 | ||
| CI | Fibroglandular concentration () | Yes | 27.16 | 23.62 | ||
| DMAS | CI | Malignant lesion () | Yes | 39.60 | 20.04 | 1 |
| CI | Benign lesion () | Yes | 36.27 | 23.22 | ||
| CI | Fibroglandular concentration () | Yes | 37.82 | 17.55 | ||
| CRDAS | CI | Malignant lesion () | Yes | 23.88 | 31.82 | 3 |
| CI | Benign lesion () | Yes | 27.34 | 29.20 | ||
| CI | Fibroglandular concentration () | No | - | - | ||
| RCB | CI | Malignant lesion () | No | - | - | - |
| CI | Benign lesion () | No | - | - | ||
| CI | Fibroglandular concentration () | No | - | - | ||
| MI | HI region near to chest wall () | - | 31.79 | 15.60 | ||
| Imaging Algorithm | ROI | CI-ROI Present in MI? | SMR (dB) | FWHM (mm) | Algorithm Rank | |
|---|---|---|---|---|---|---|
| DAS | CI | Benign lesion () | Yes | 26.41 | 13.60 | 3 |
| IDAS | CI | Benign lesion () | No | - | - | - |
| MI | HI region close to the chest wall () | - | 59.56 | 5.00 | ||
| CFDAS | CI | Benign lesion () | No | - | - | - |
| MI | HI region at the lower outer quadrant of the breast () | - | 35.48 | 10.72 | ||
| DMAS | CI | Benign lesion () | Yes | 45.66 | 8.78 | 1 |
| CRDAS | CI | Benign lesion () | Yes | 30.06 | 13.34 | 2 |
| RCB | CI | Benign lesion () | No | - | - | - |
| MI | HI region below the nipple () | - | 38.03 | 6.96 | ||
| Imaging Algorithm | ROI | CI-ROI Present in MI? | SMR (dB) | FWHM (mm) | Algorithm Rank | |
|---|---|---|---|---|---|---|
| DAS | CI | Malignant tumour | No | - | - | 4 |
| CI | Focal mass () | Yes | 28.38 | 17.11 | ||
| MI | HI region near to the nipple (). Probably part of the focal mass. | 24.62 | 20.15 | |||
| IDAS | CI | Malignant tumour () | Yes | 58.74 | 5.74 | 1 |
| CI | Focal mass () | No | - | - | ||
| CFDAS | CI | Malignant tumour | No | - | - | 3 |
| CI | Focal mass () | Yes | 38.89 | 11.35 | ||
| MI | HI region near to the nipple (). | - | 43.89 | 11.05 | ||
| DMAS | CI | Malignant tumour | No | - | - | 2 |
| CI | Focal mass () | Yes | 52.11 | 11.58 | ||
| CRDAS | CI | Malignant tumour | No | - | - | - |
| CI | Focal mass () | No | - | - | ||
| MI | HI region at 4’o clock () | - | 30.75 | 20.92 | ||
| RCB | CI | Malignant tumour | No | - | - | - |
| CI | Focal mass () | No | - | - | ||
| MI | HI region near to the nipple () | 56.78 | 9.06 | |||
| Imaging Algorithm | ROI | CI-ROI Present in MI? | SMR (dB) | FWHM (mm) | Algorithm Rank | |
|---|---|---|---|---|---|---|
| DAS | CI | Benign lesion () | Yes | 22.04 | 25.40 | 2 |
| IDAS | CI | Benign lesion () | No | - | - | - |
| MI | HI region near to 2’o clock (R2) | - | 54.55 | 11.18 | ||
| CFDAS | CI | Benign lesion () | No | - | - | - |
| MI | HI region near to 2’o clock (R2) | - | 27.26 | 28.17 | ||
| DMAS | CI | Benign lesion () | Yes | 39.81 | 11.04 | 1 |
| CRDAS | CI | Benign lesion () | No | - | - | - |
| MI | HI region closer to the chest wall (R3) | - | 29.60 | 24.51 | ||
| RCB | CI | Benign lesion () | No | - | - | - |
| MI | HI region near to 2’o clock () | - | 33.15 | 15.30 | ||
| Imaging Algorithm | ROI | CI-ROI Present in MI? | SMR (dB) | FWHM (mm) | Algorithm Rank | |
|---|---|---|---|---|---|---|
| DAS | CI | Fibroglandular concentration () | Yes | 28.20 | 17.11 | 4 |
| IDAS | CI | Fibroglandular concentration () | Yes | 48.65 | 8.18 | 2 |
| MI | HI region near to 9 o’ clock () | - | 49.15 | 9.49 | ||
| CFDAS | CI | Fibroglandular concentration () | Yes | 34.88 | 14.14 | 3 |
| DMAS | CI | Fibroglandular concentration () | Yes | 49.37 | 10.49 | 1 |
| CRDAS | CI | Fibroglandualar concentration () | Yes | 23.61 | 20.80 | 5 |
| MI | HI region near to 9 o’clock () | - | 25.03 | 27.77 | ||
| RCB | CI | Fibroglandular concentration (R1) | No | - | - | - |
| MI | HI region near to 6 o’clock () | - | 30.72 | 12.04 | ||
© 2018 by the authors. Licensee MDPI, Basel, Switzerland. This article is an open access article distributed under the terms and conditions of the Creative Commons Attribution (CC BY) license (http://creativecommons.org/licenses/by/4.0/).
Share and Cite
Elahi, M.A.; O’Loughlin, D.; Lavoie, B.R.; Glavin, M.; Jones, E.; Fear, E.C.; O’Halloran, M. Evaluation of Image Reconstruction Algorithms for Confocal Microwave Imaging: Application to Patient Data. Sensors 2018, 18, 1678. https://doi.org/10.3390/s18061678
Elahi MA, O’Loughlin D, Lavoie BR, Glavin M, Jones E, Fear EC, O’Halloran M. Evaluation of Image Reconstruction Algorithms for Confocal Microwave Imaging: Application to Patient Data. Sensors. 2018; 18(6):1678. https://doi.org/10.3390/s18061678
Chicago/Turabian StyleElahi, Muhammad Adnan, Declan O’Loughlin, Benjamin R. Lavoie, Martin Glavin, Edward Jones, Elise C. Fear, and Martin O’Halloran. 2018. "Evaluation of Image Reconstruction Algorithms for Confocal Microwave Imaging: Application to Patient Data" Sensors 18, no. 6: 1678. https://doi.org/10.3390/s18061678
APA StyleElahi, M. A., O’Loughlin, D., Lavoie, B. R., Glavin, M., Jones, E., Fear, E. C., & O’Halloran, M. (2018). Evaluation of Image Reconstruction Algorithms for Confocal Microwave Imaging: Application to Patient Data. Sensors, 18(6), 1678. https://doi.org/10.3390/s18061678