Hysteresis Compensation in a Tactile Device for Arterial Pulse Reproduction


Abstract
:1. Introduction
2. Proposed System
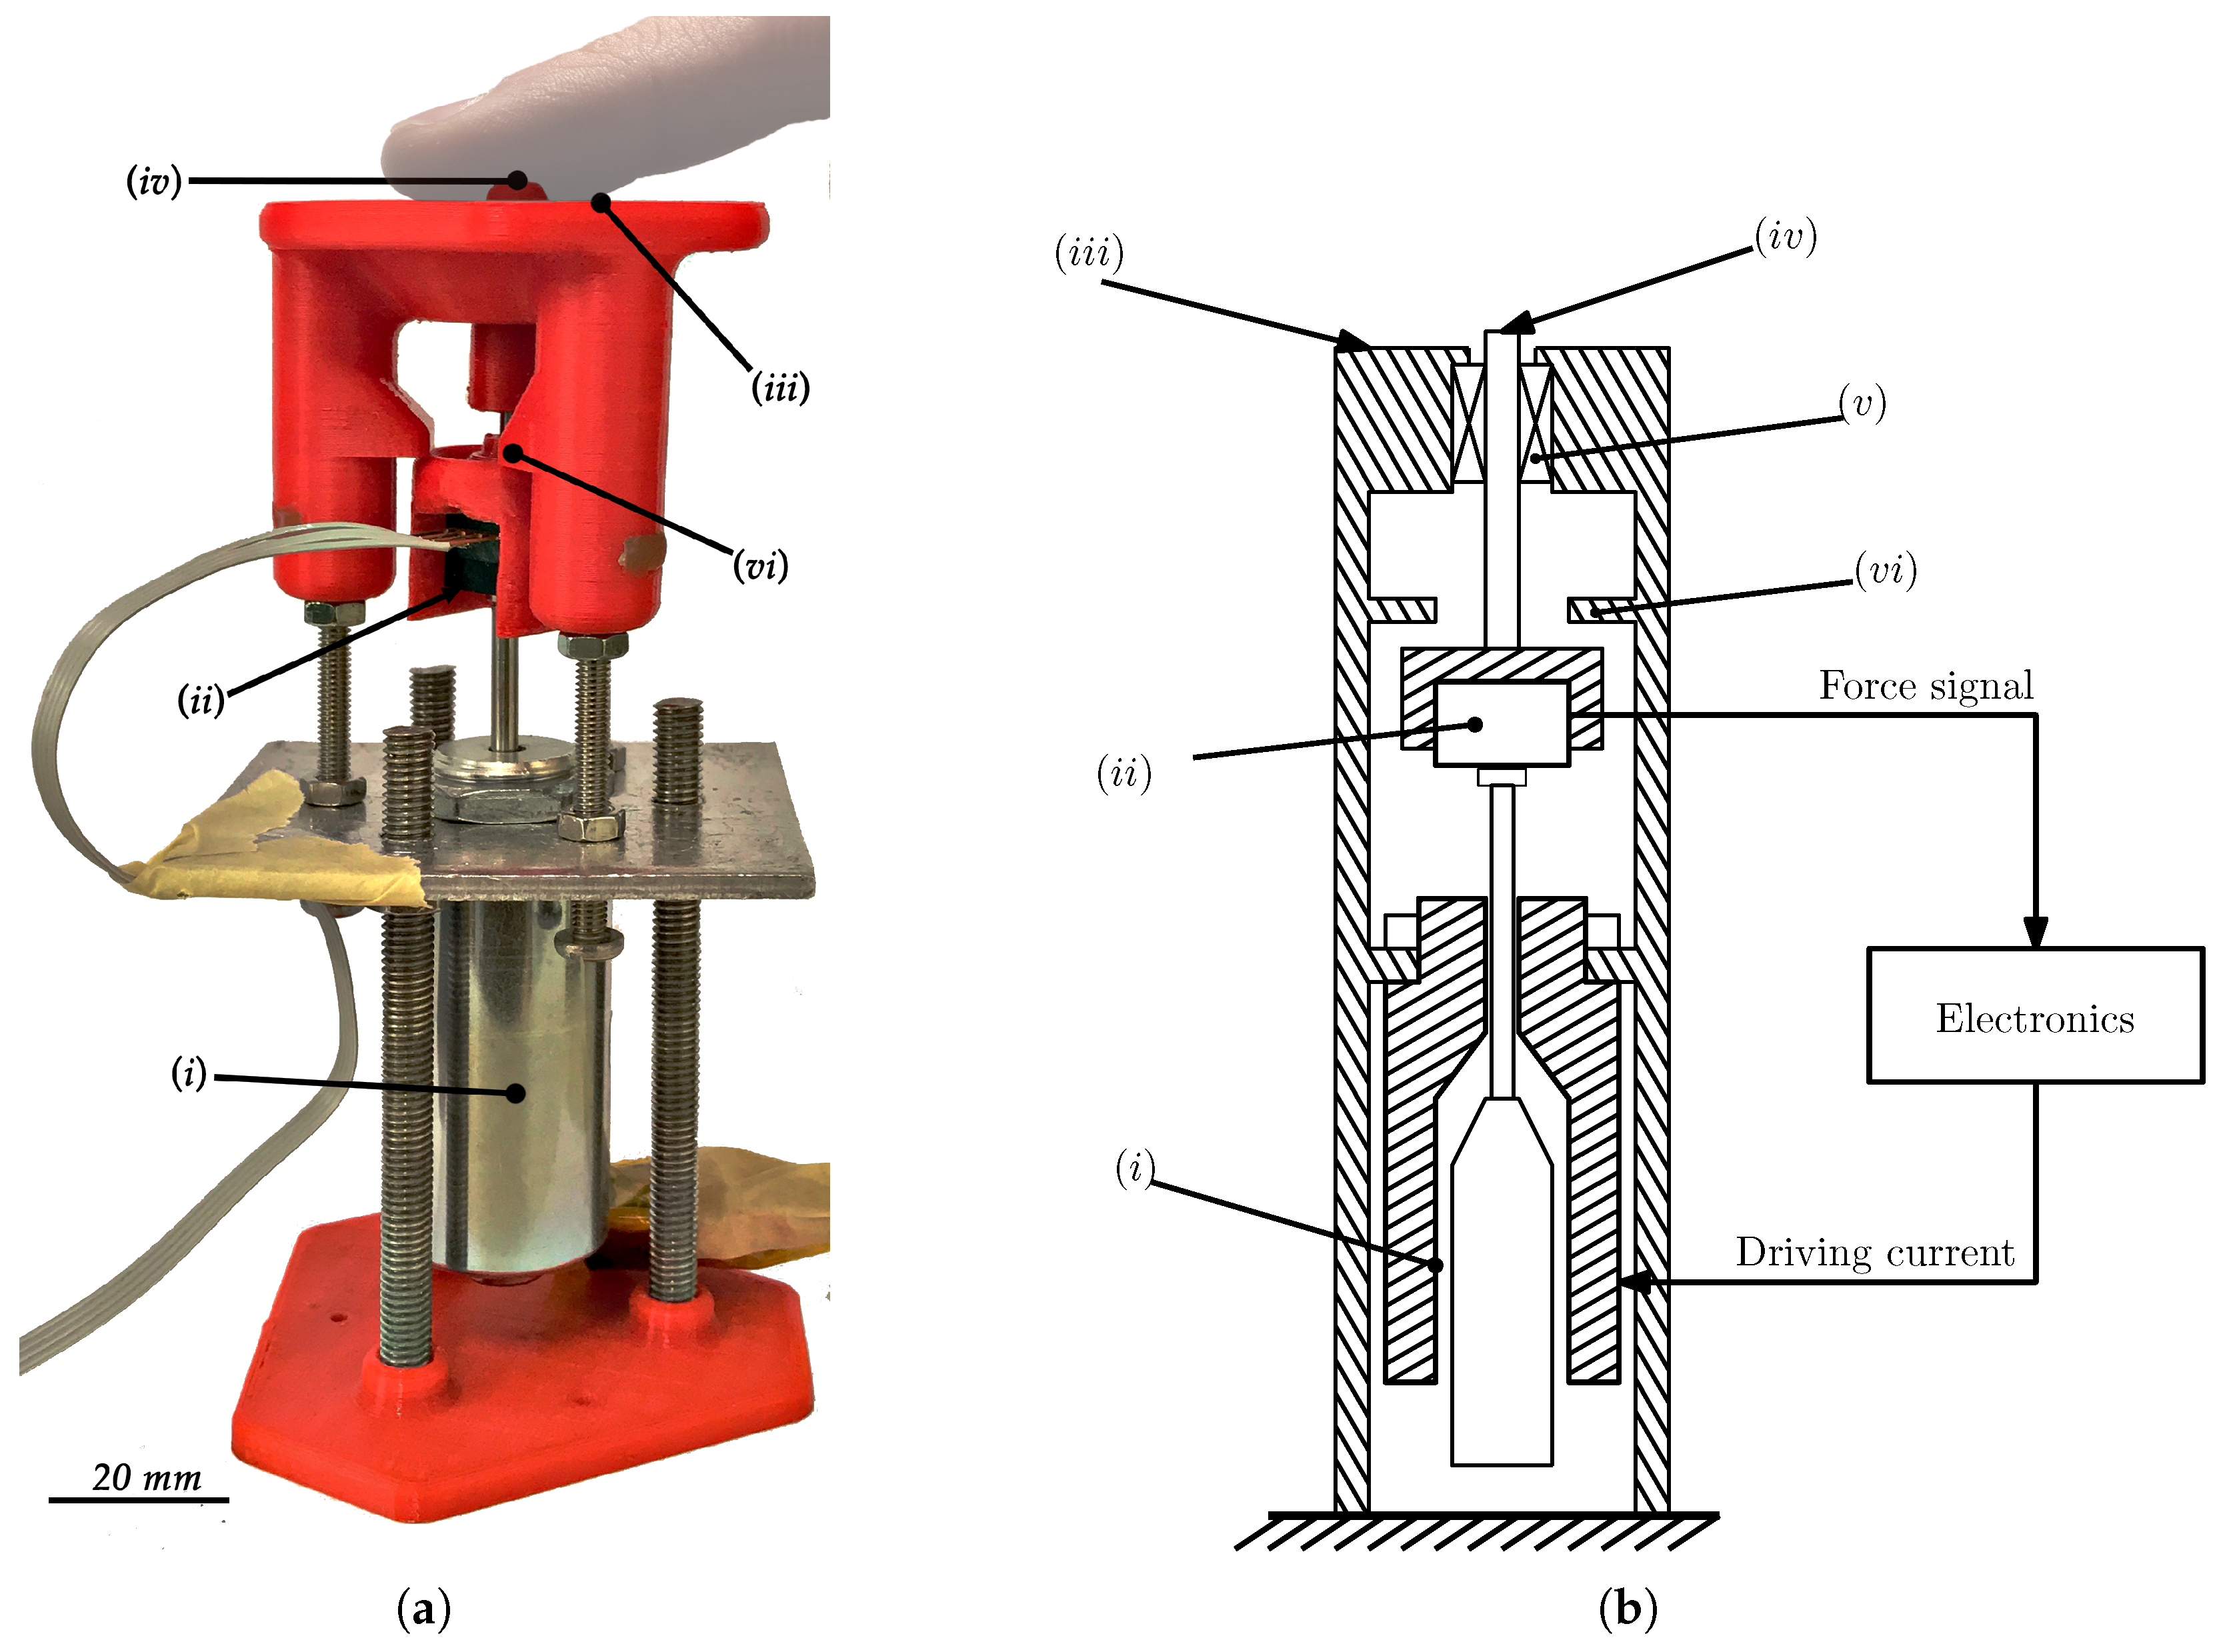
2.1. The Mechanical System
2.2. Electronics
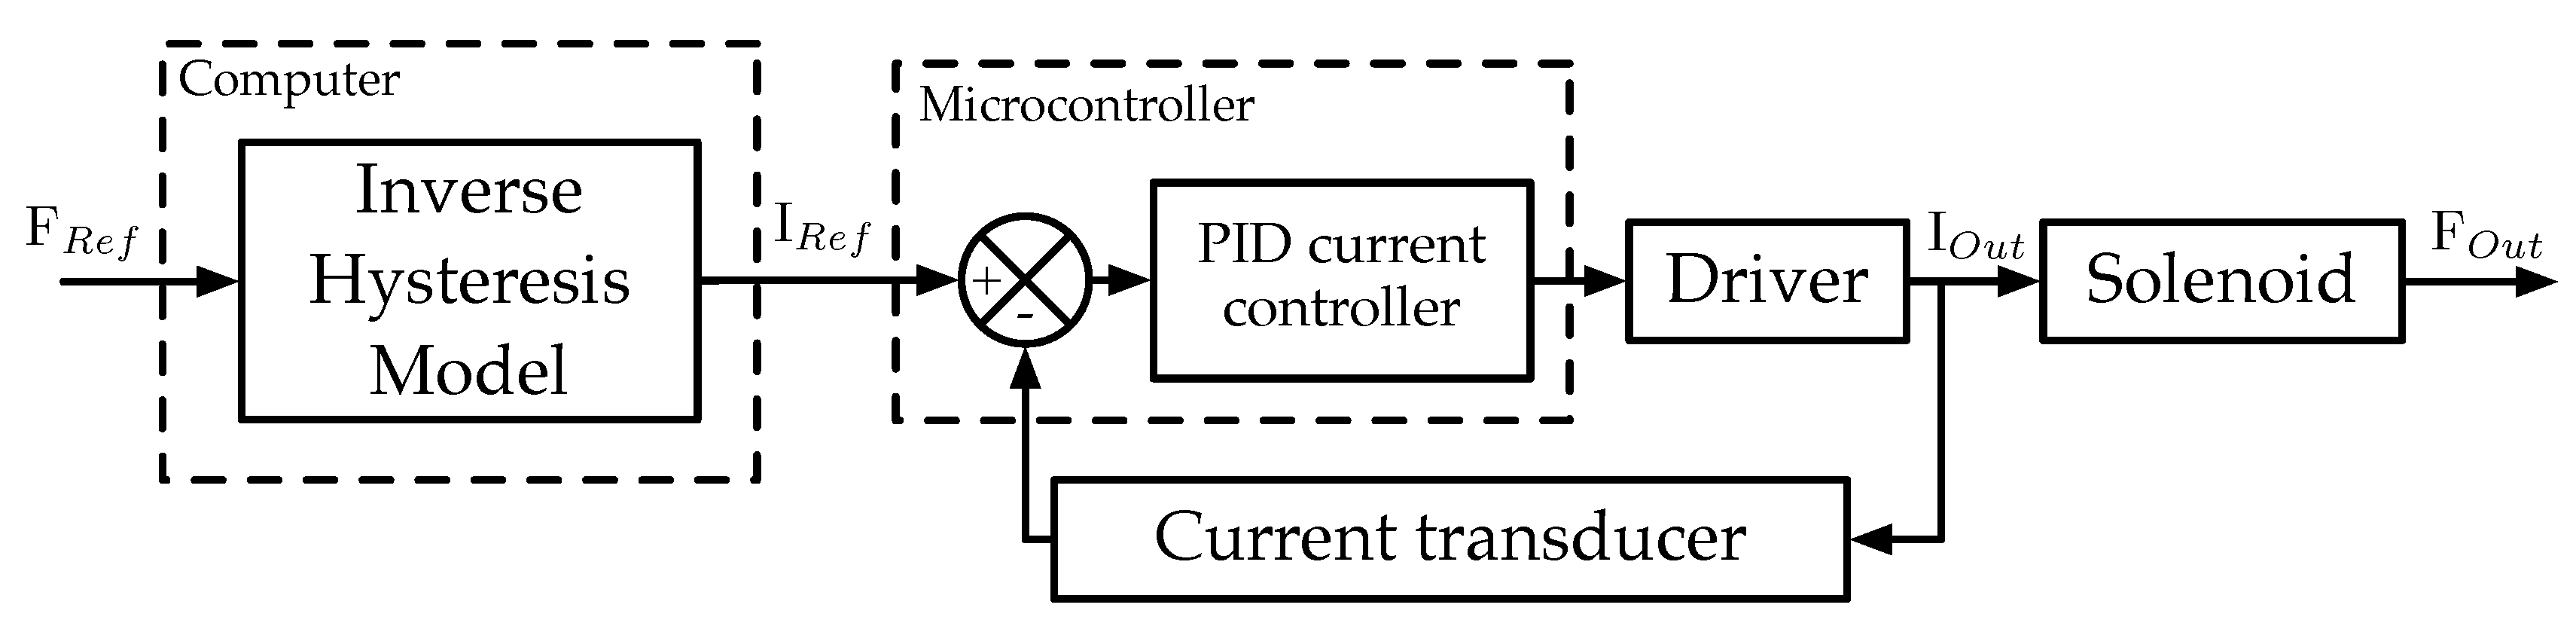
2.3. Control
3. Hysteresis Compensation
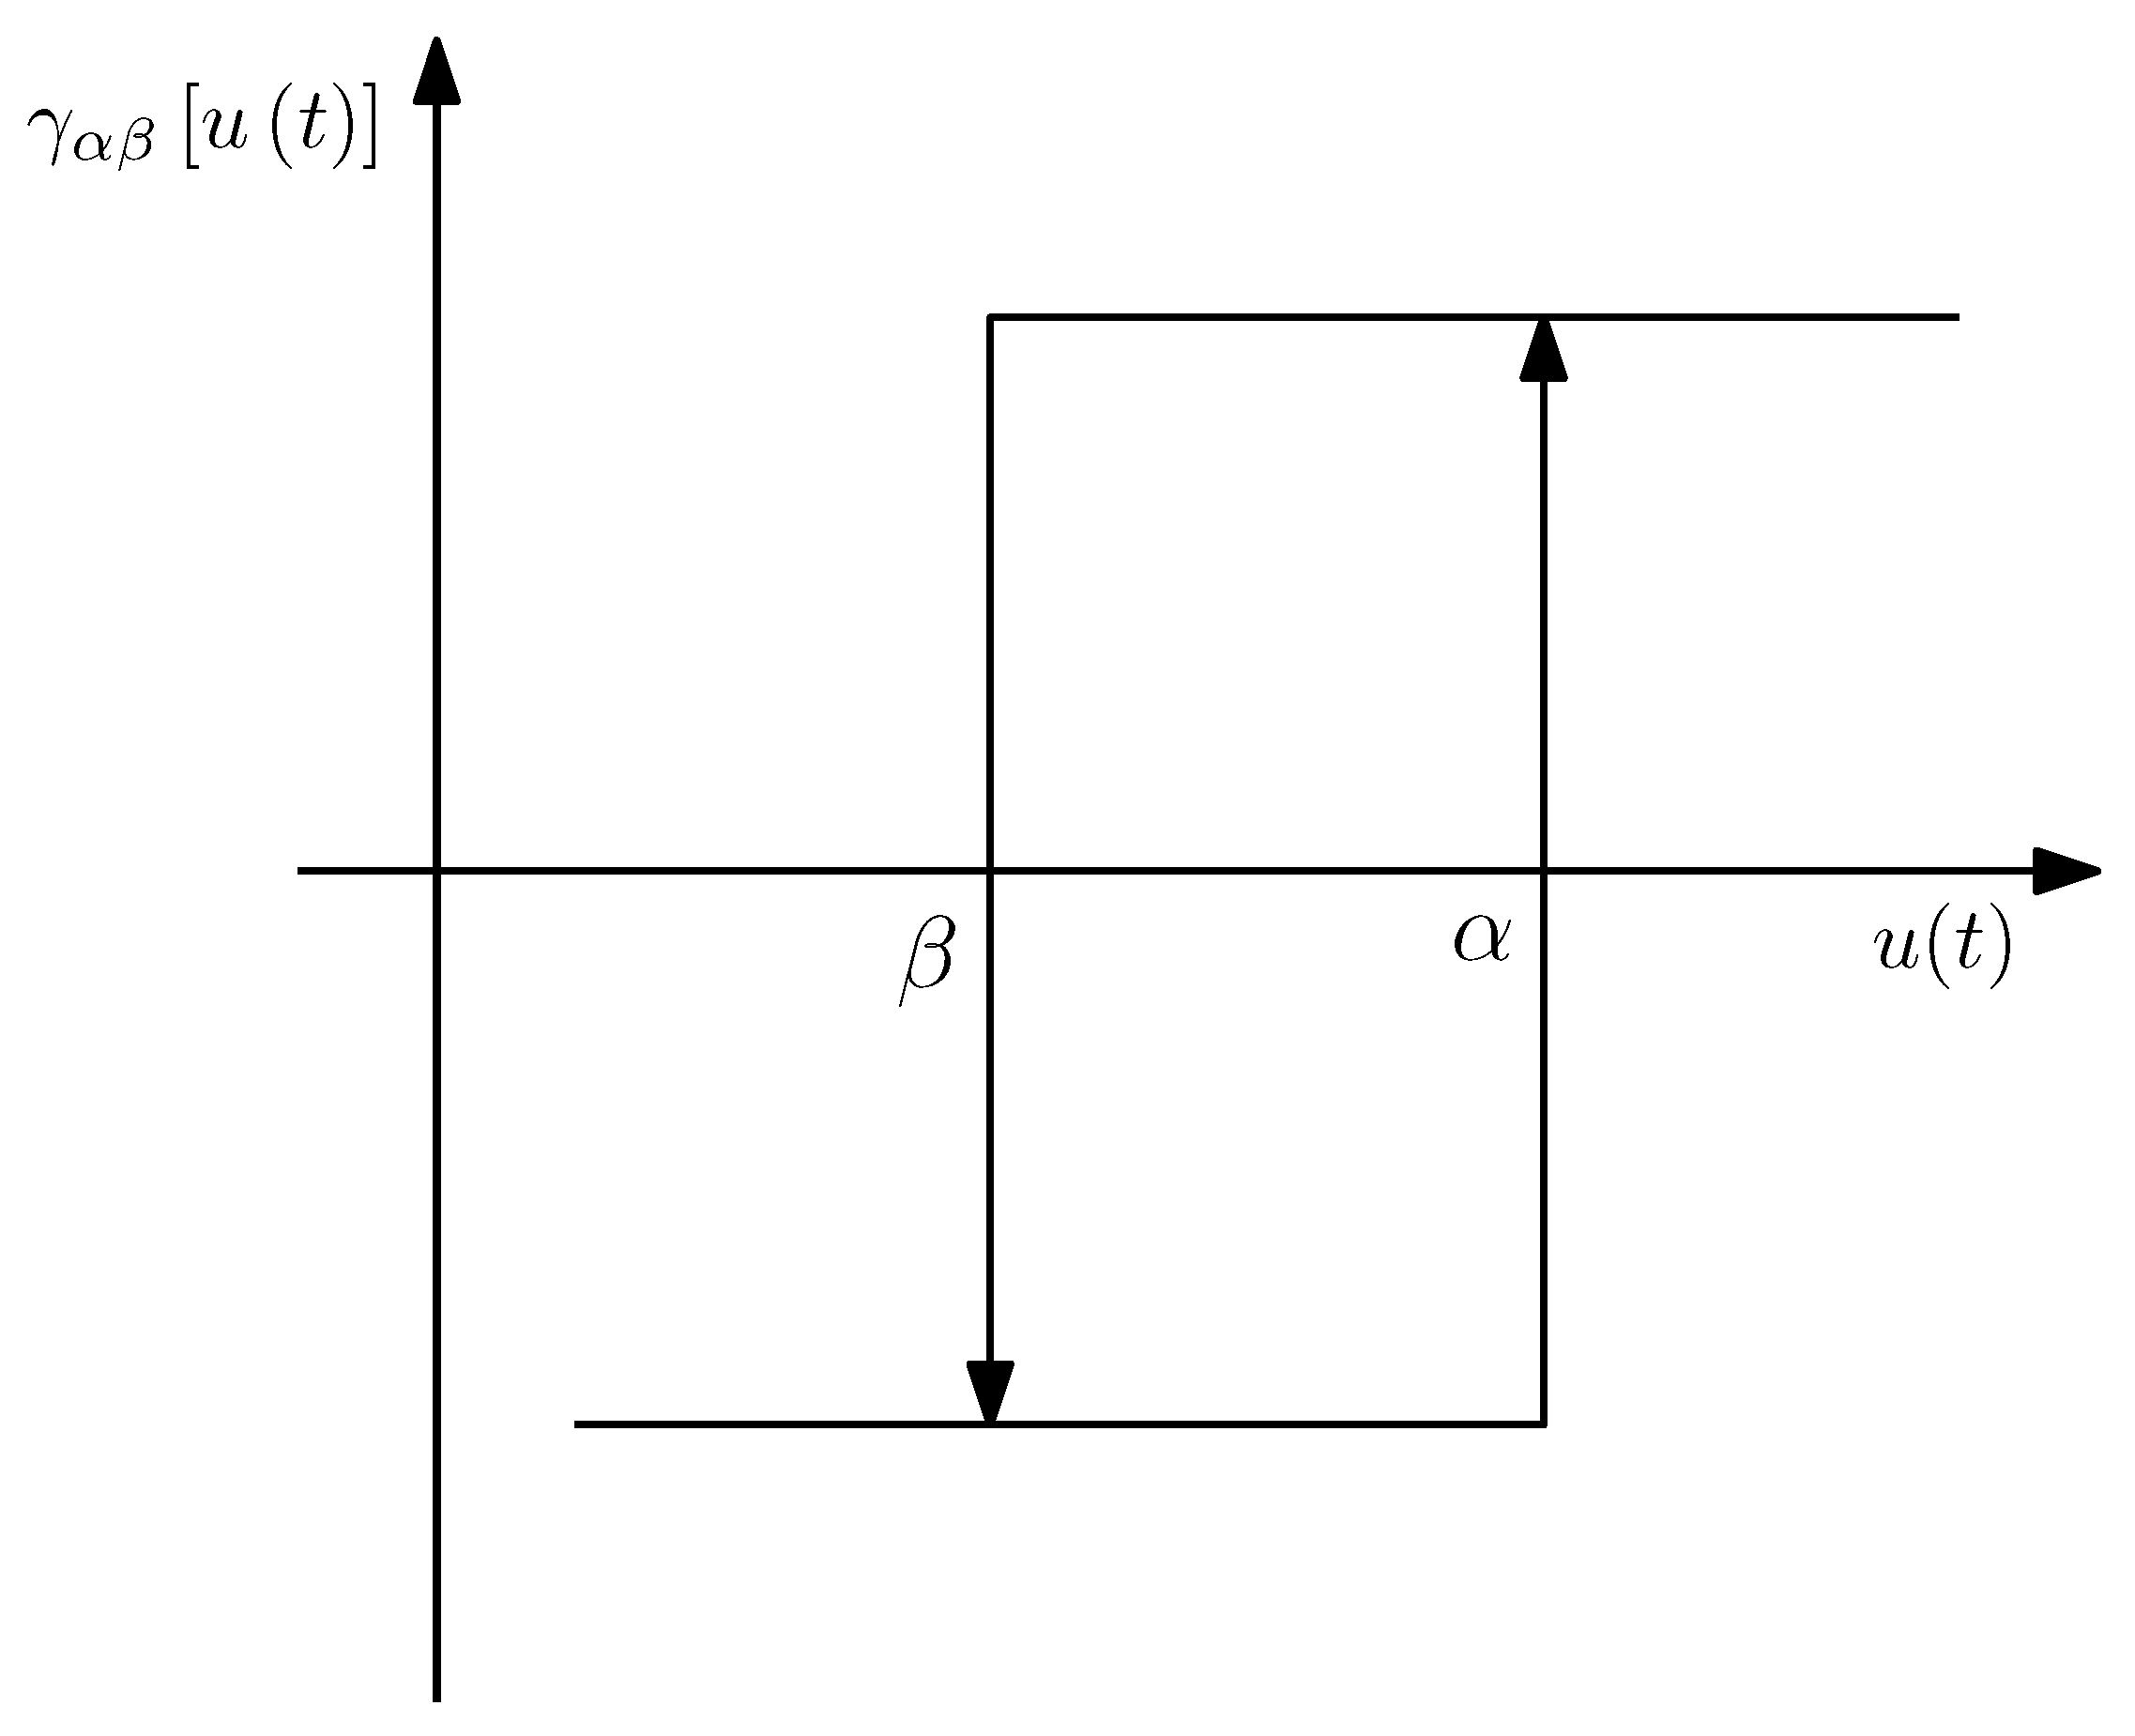
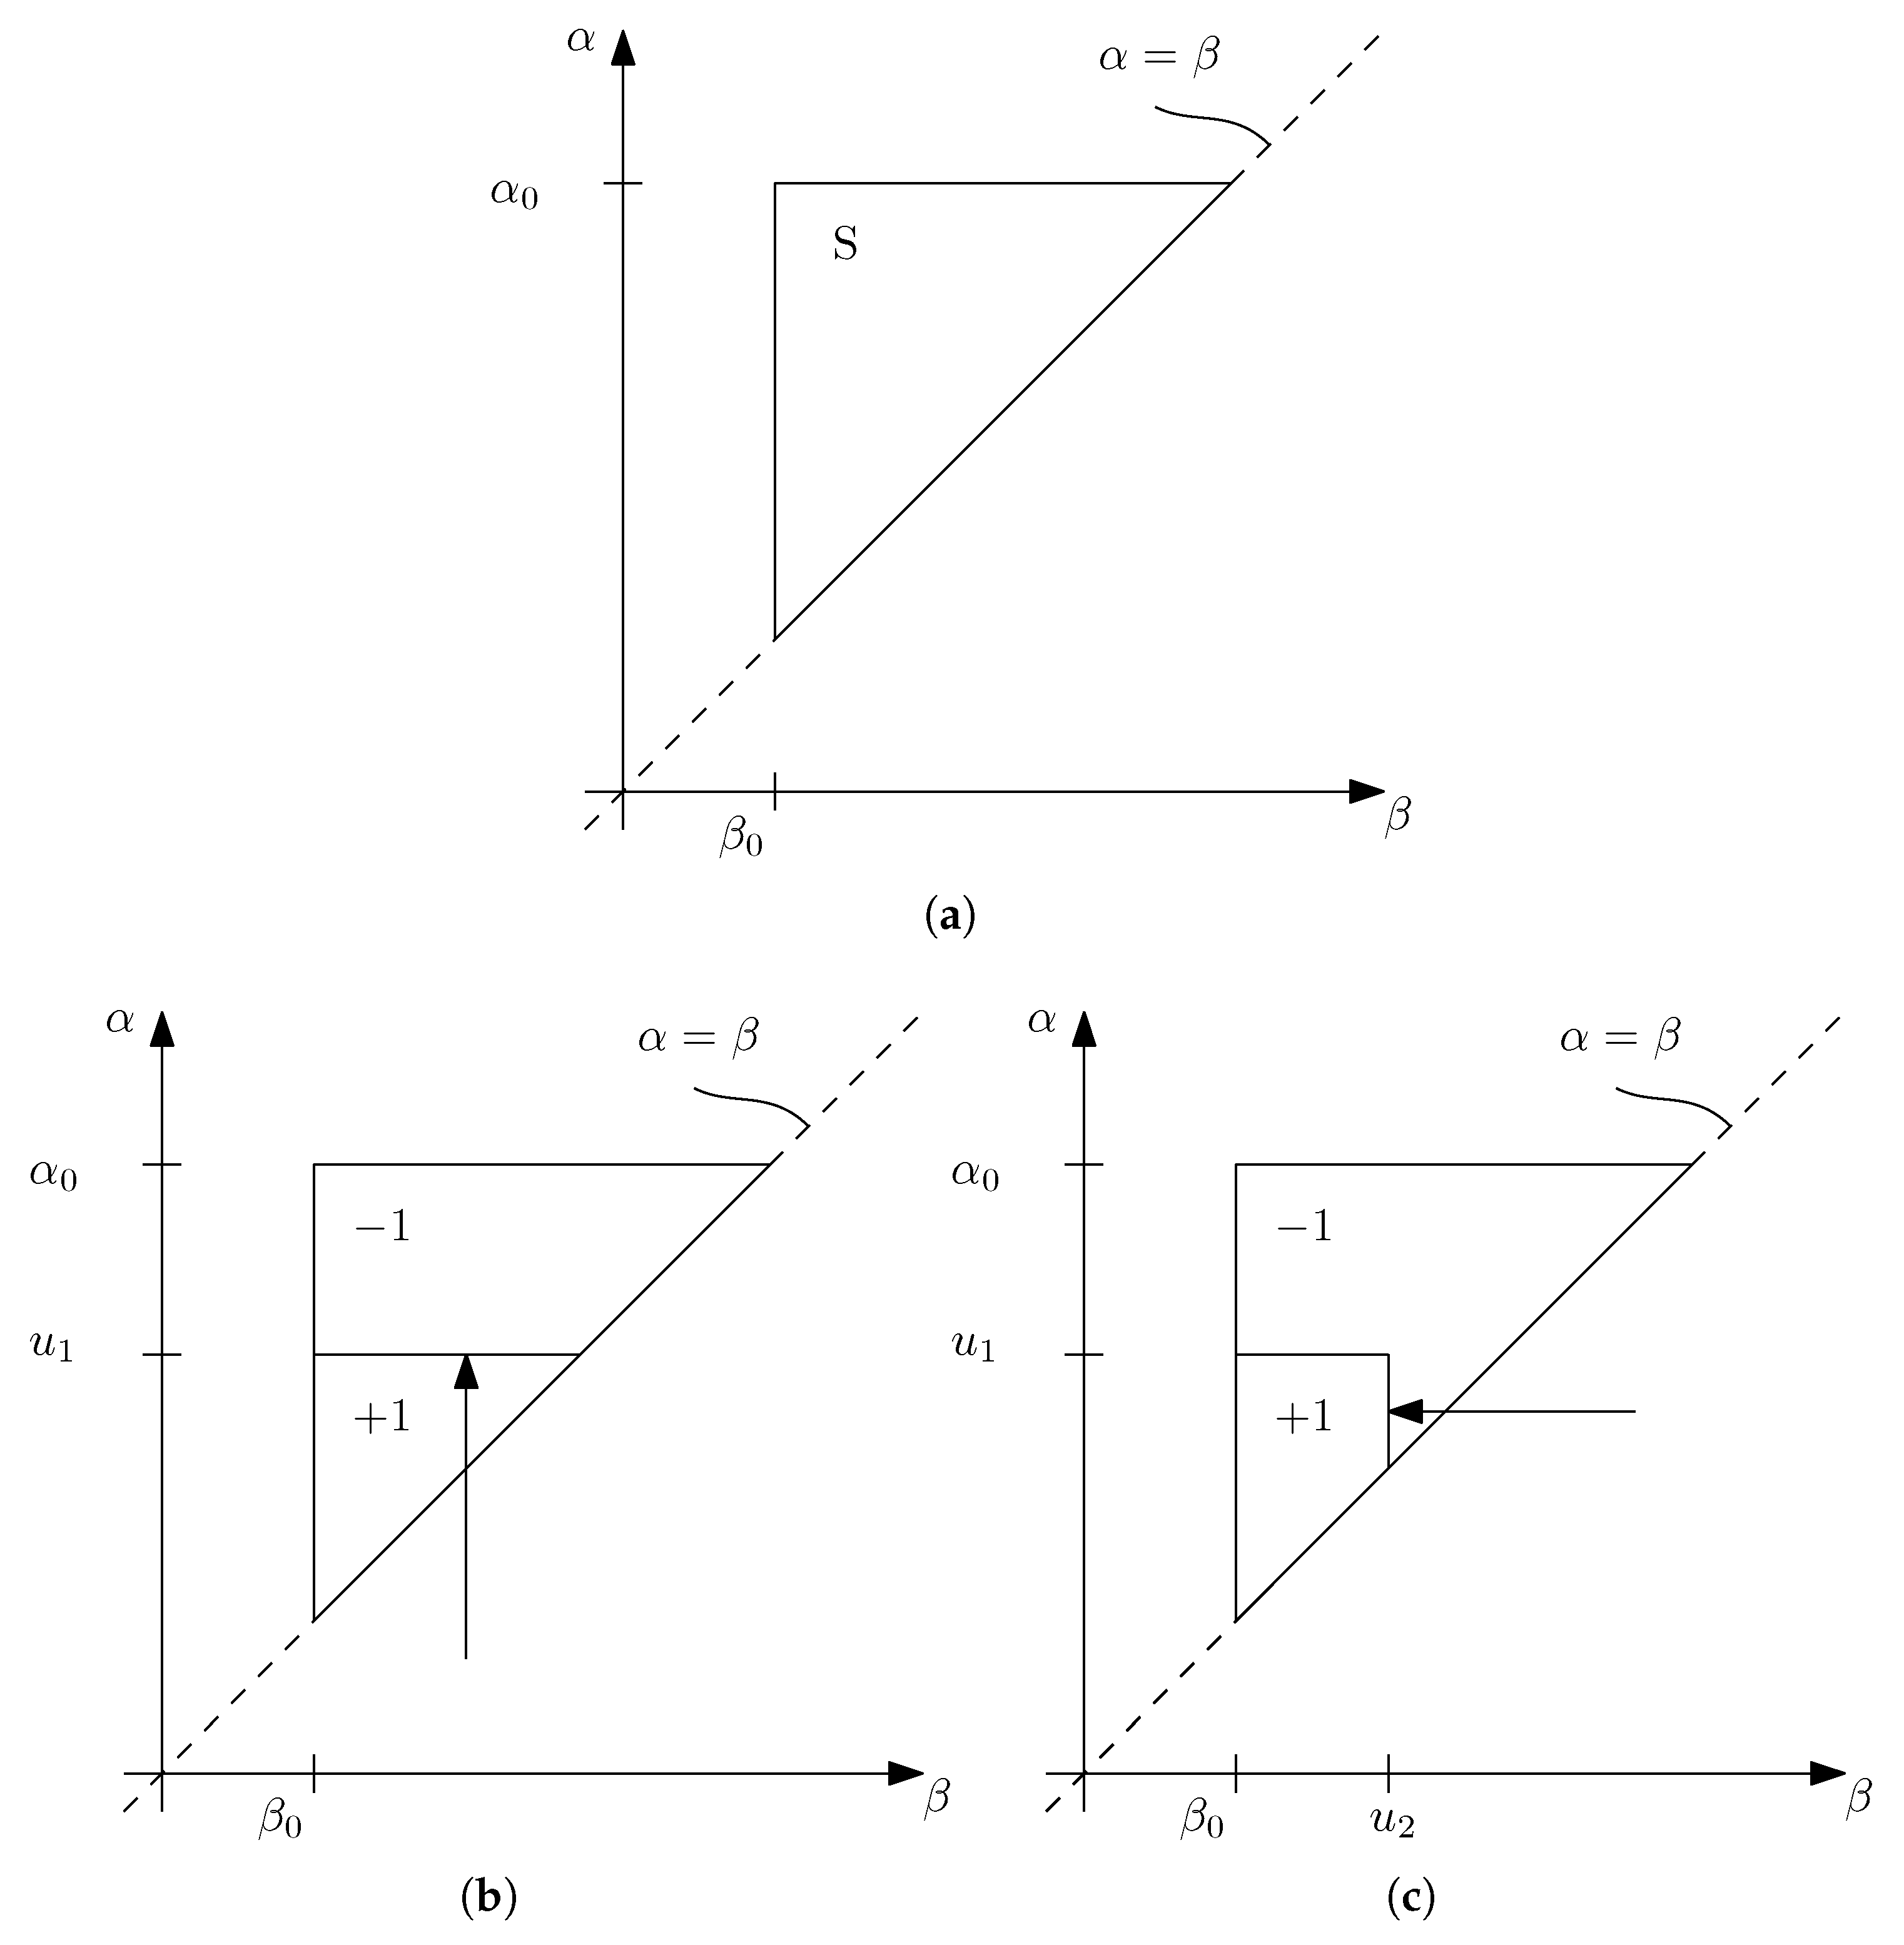
3.1. Hysteresis Model
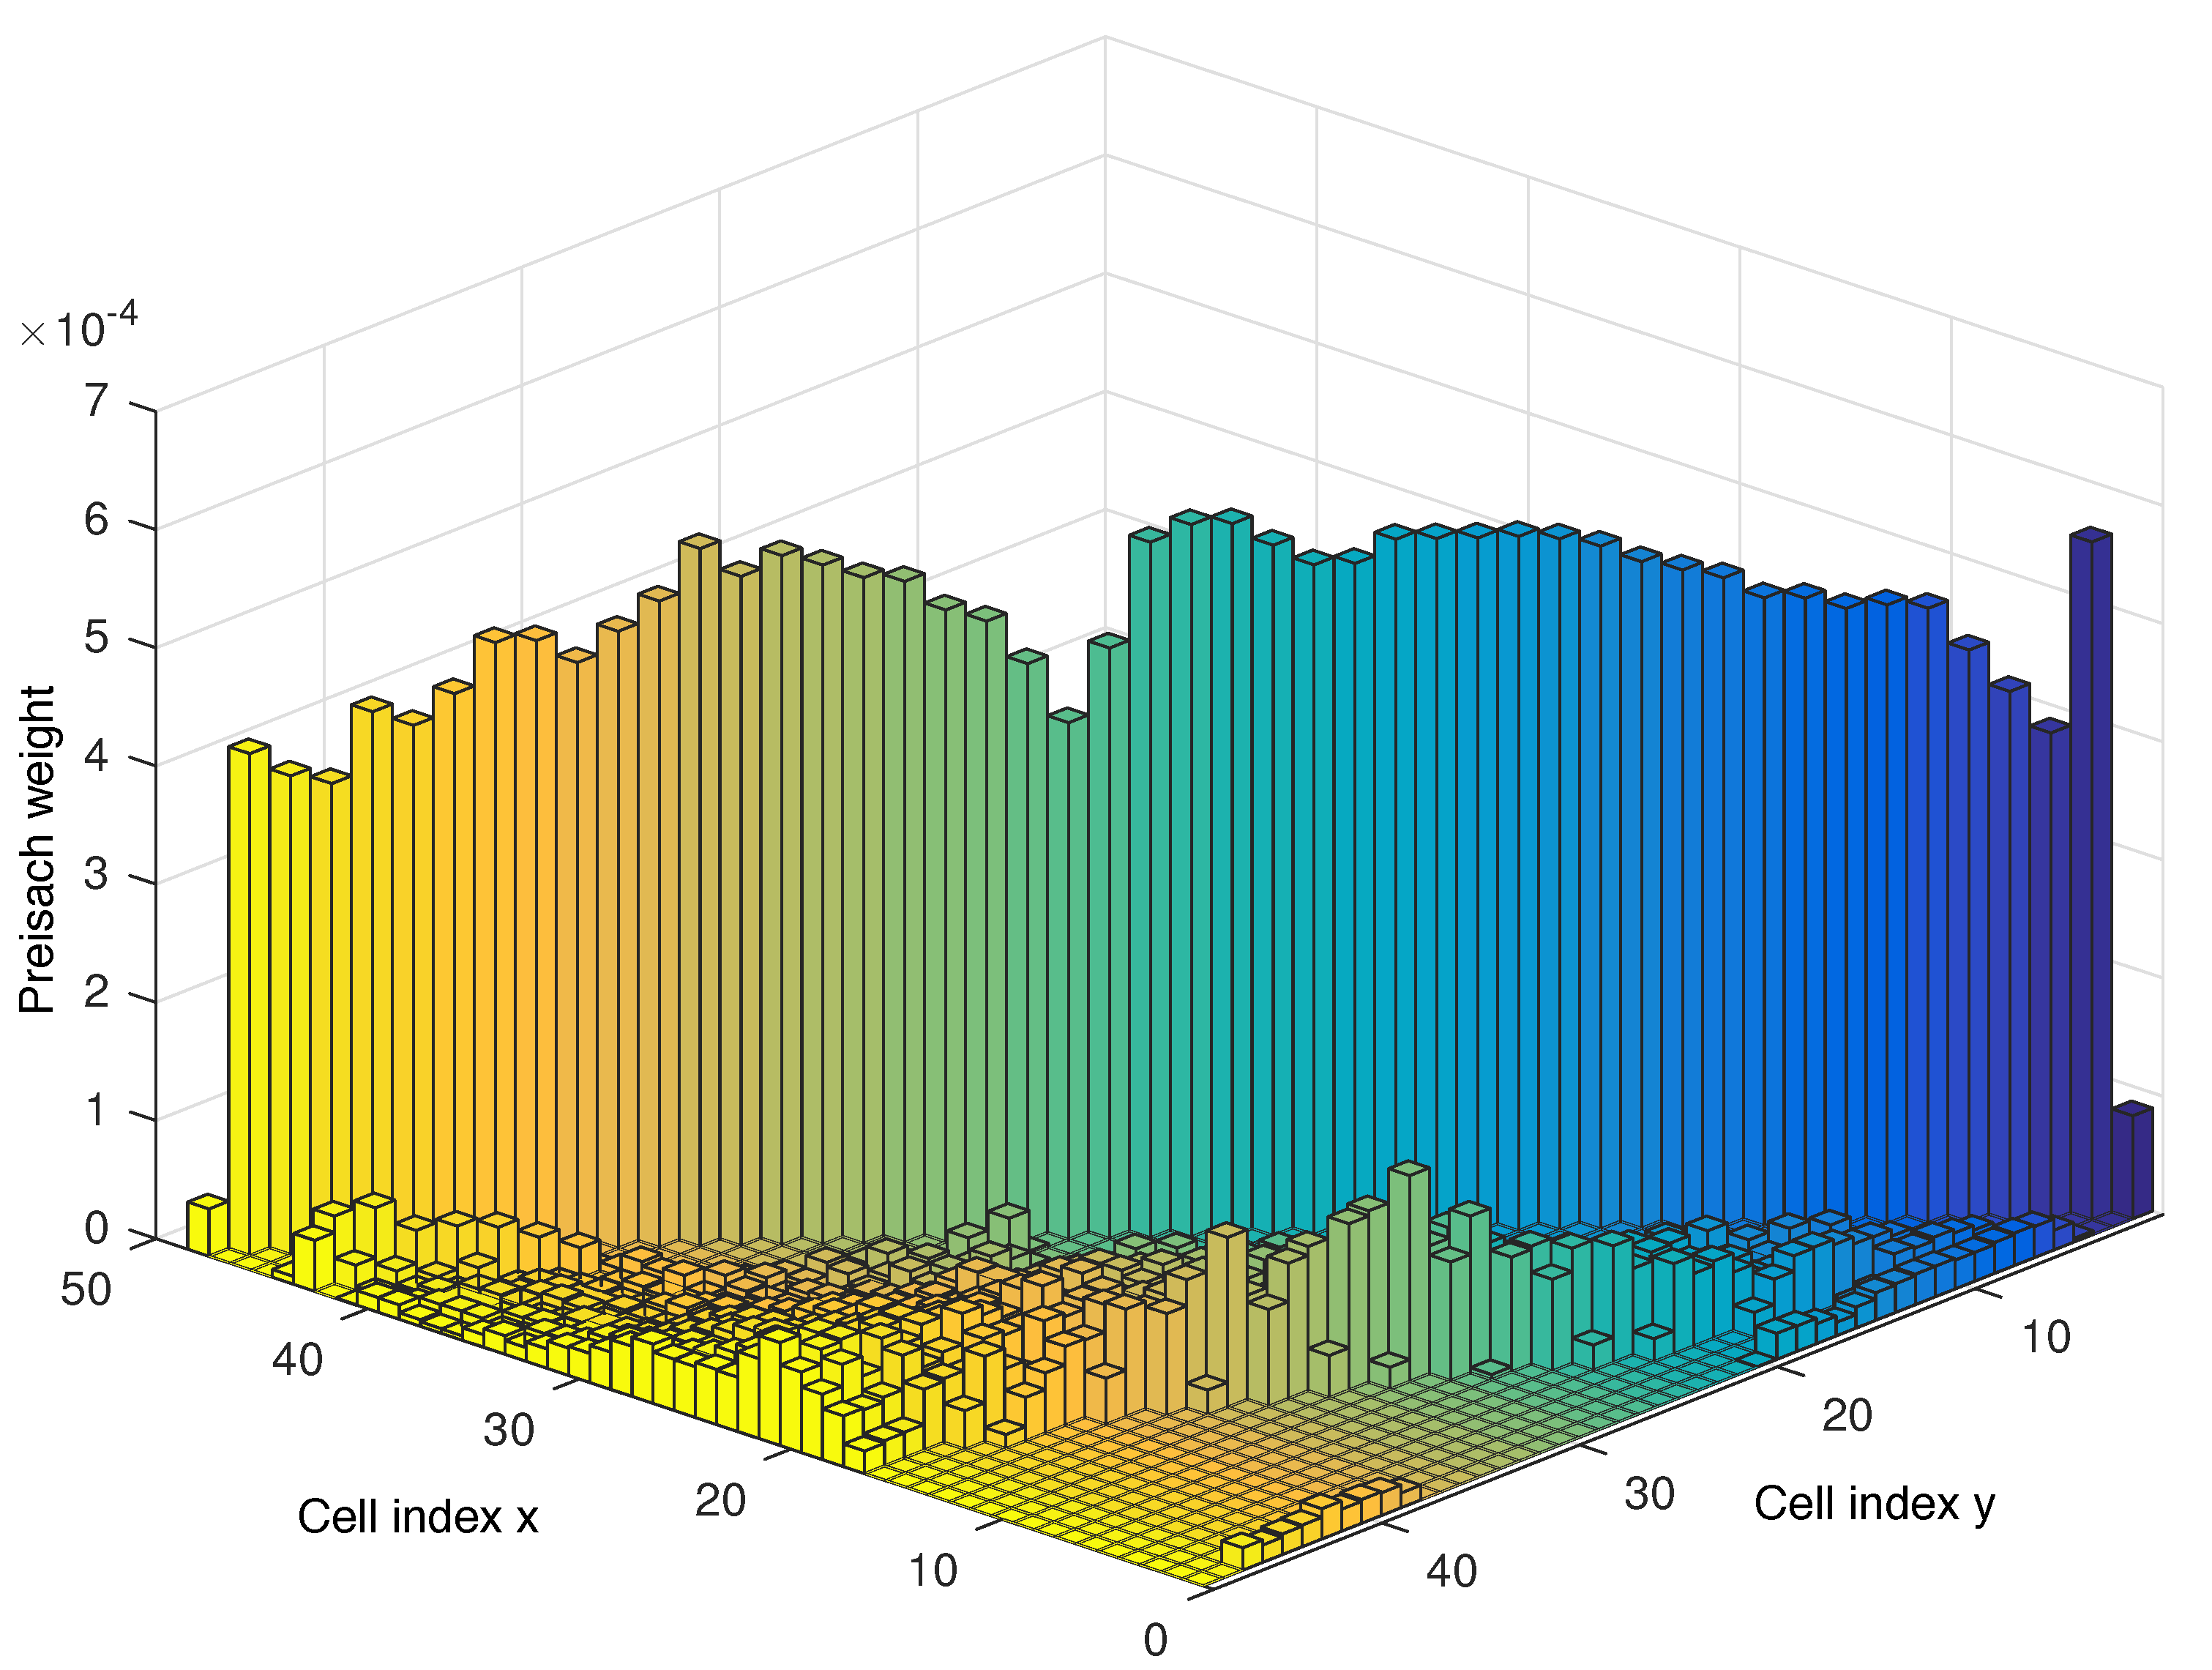
3.2. Identification
3.3. Implementation
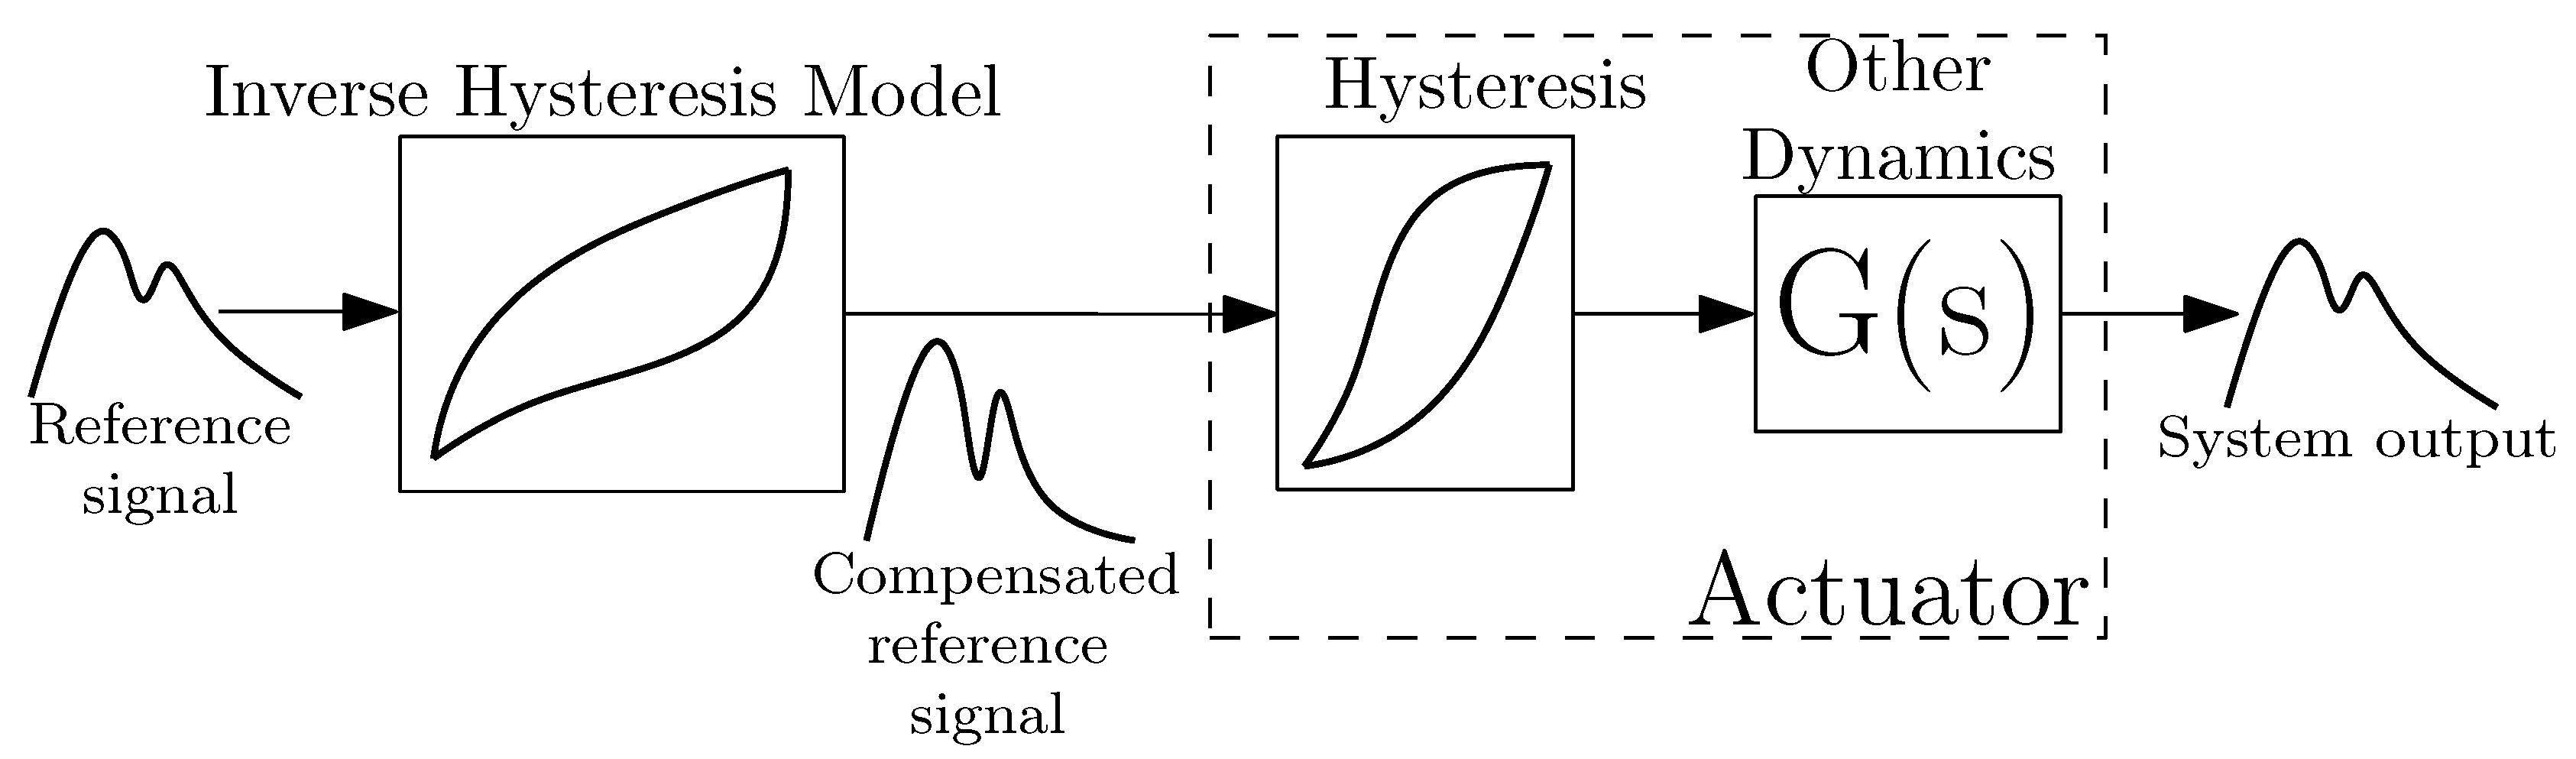
3.4. Inversion
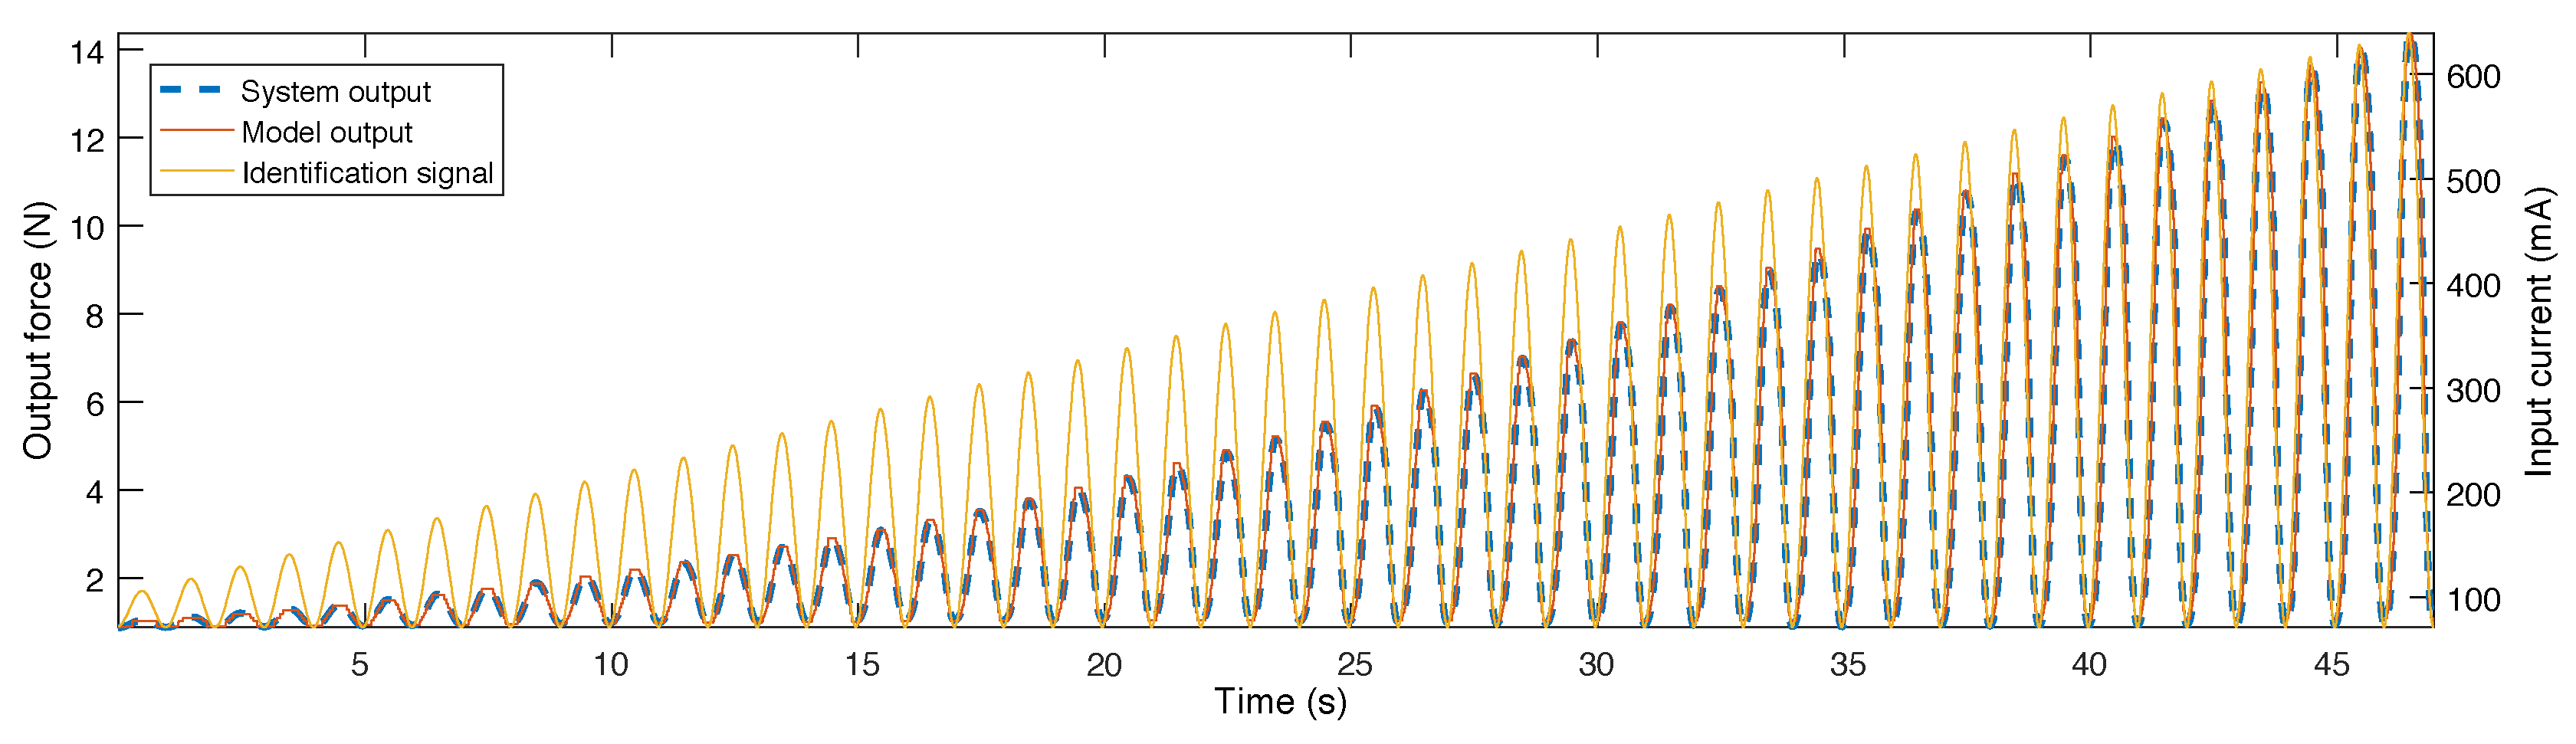
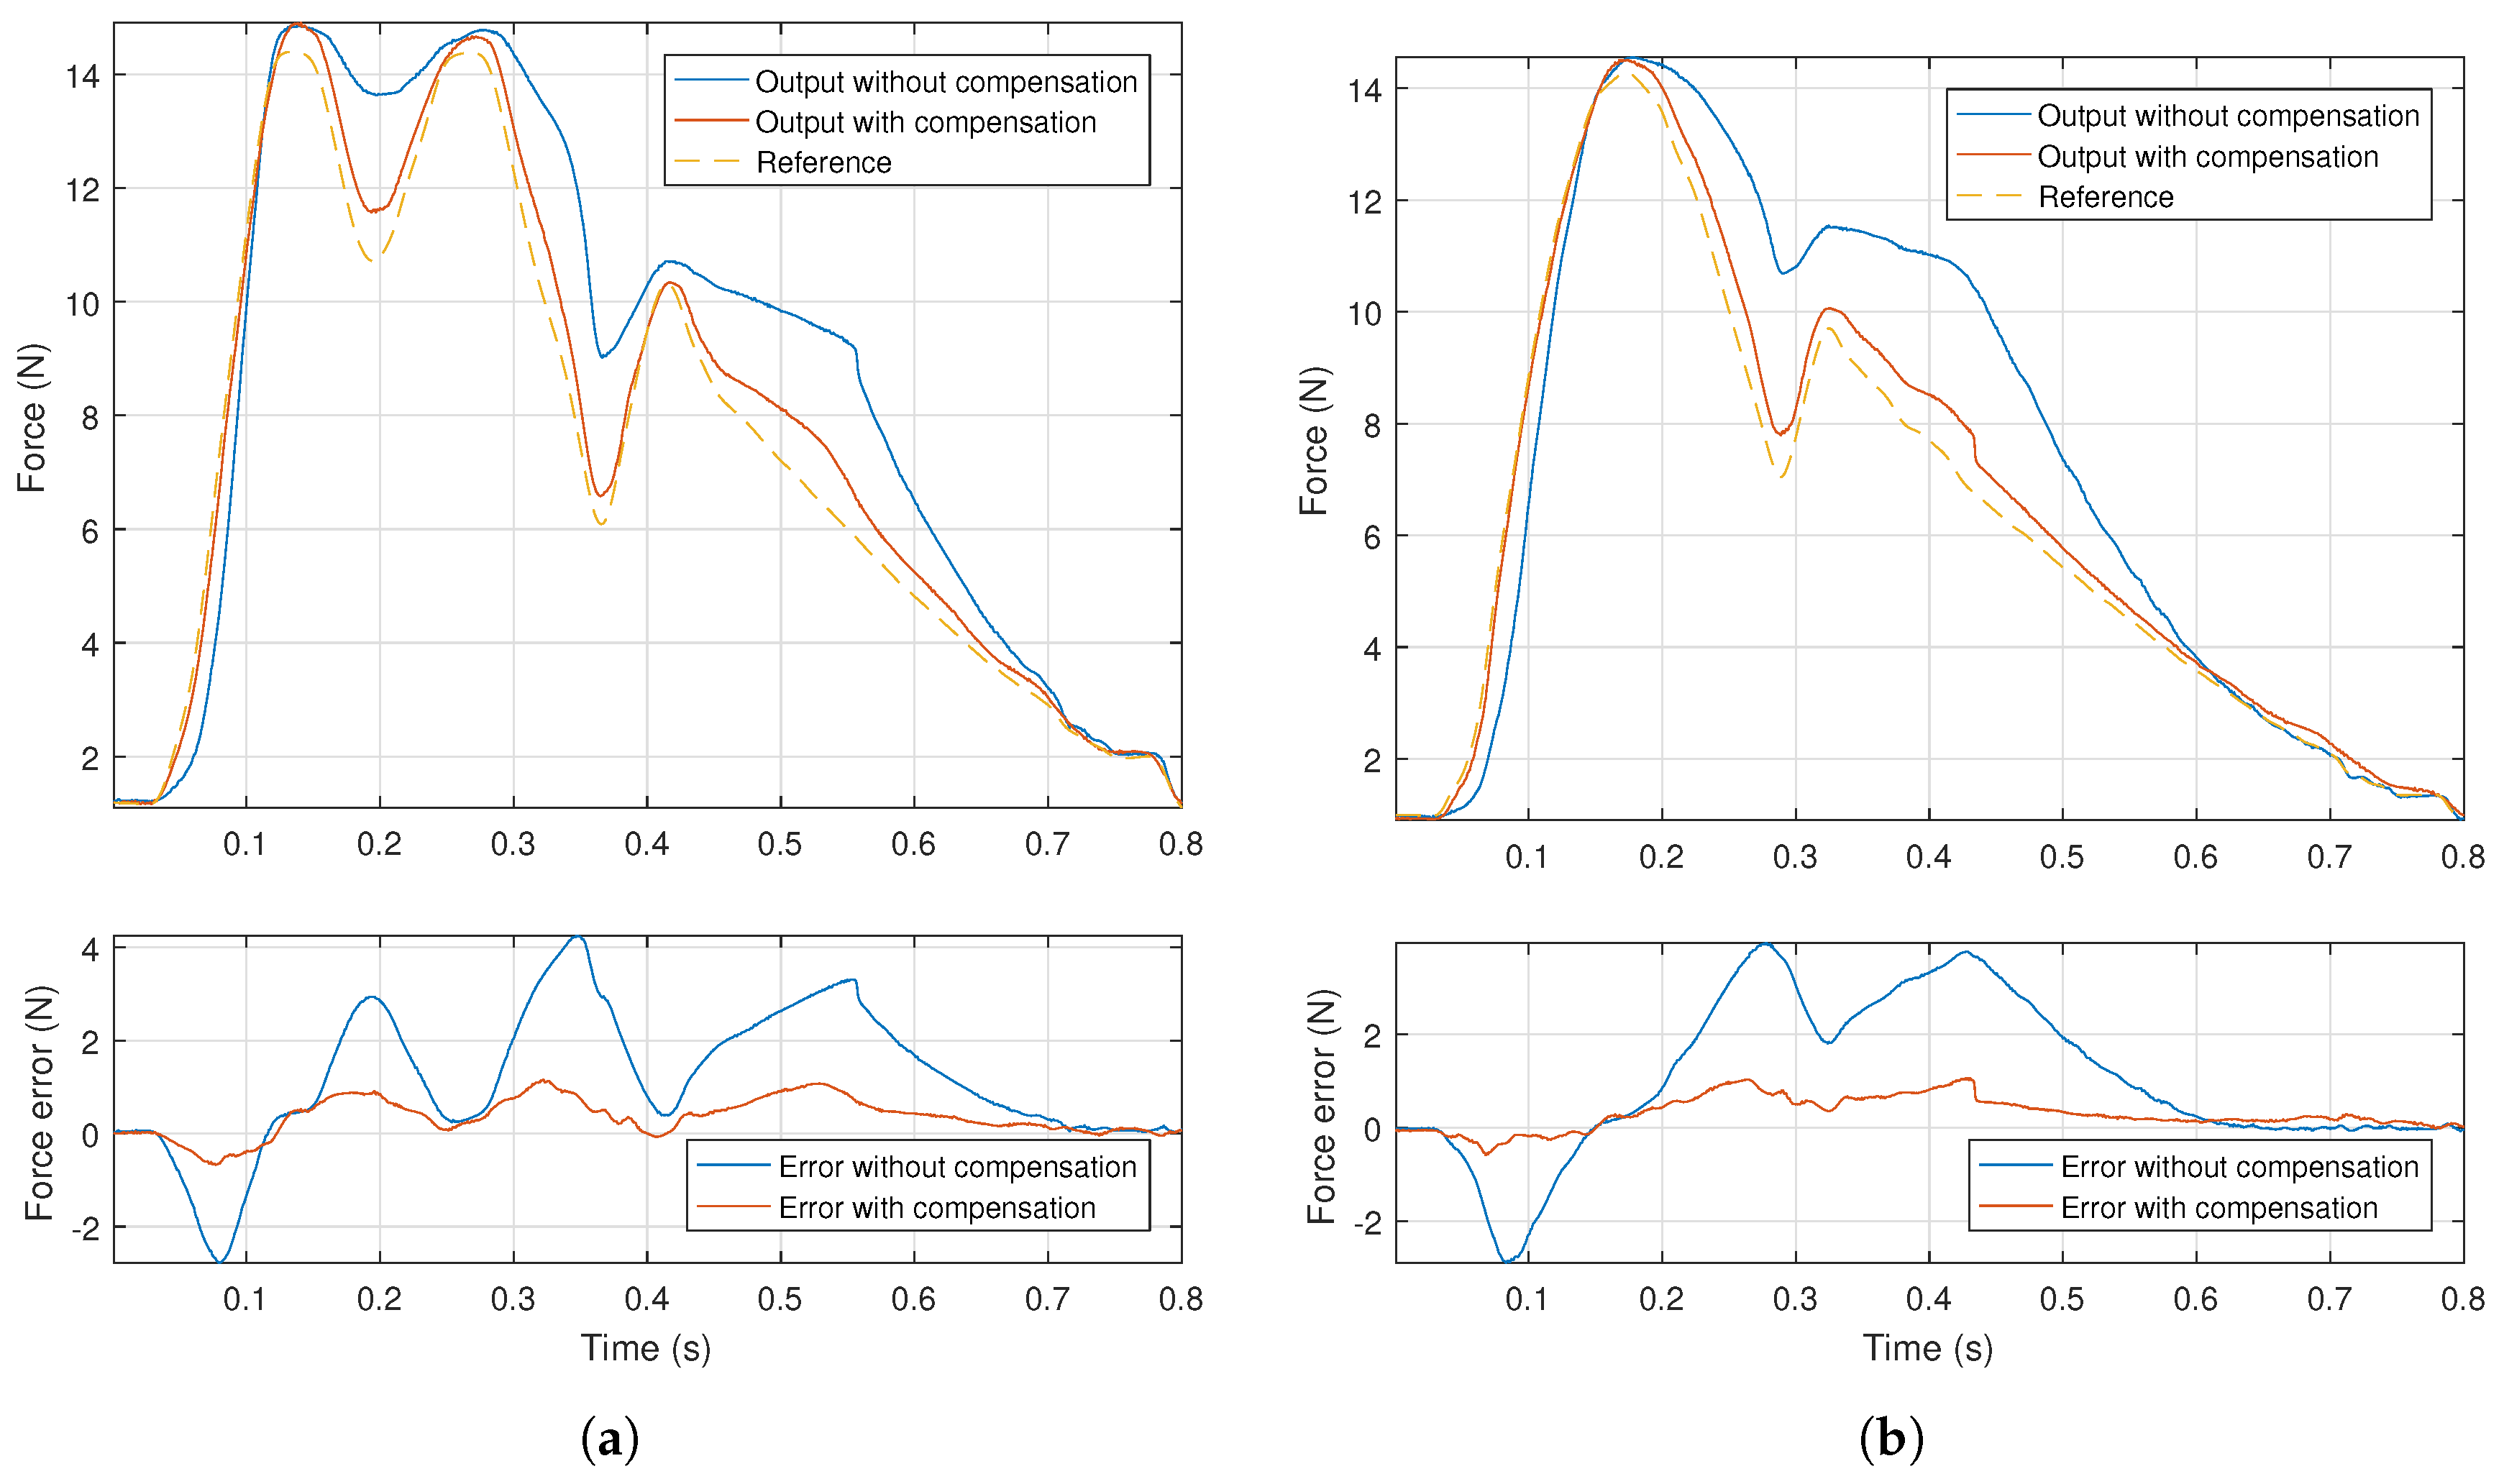
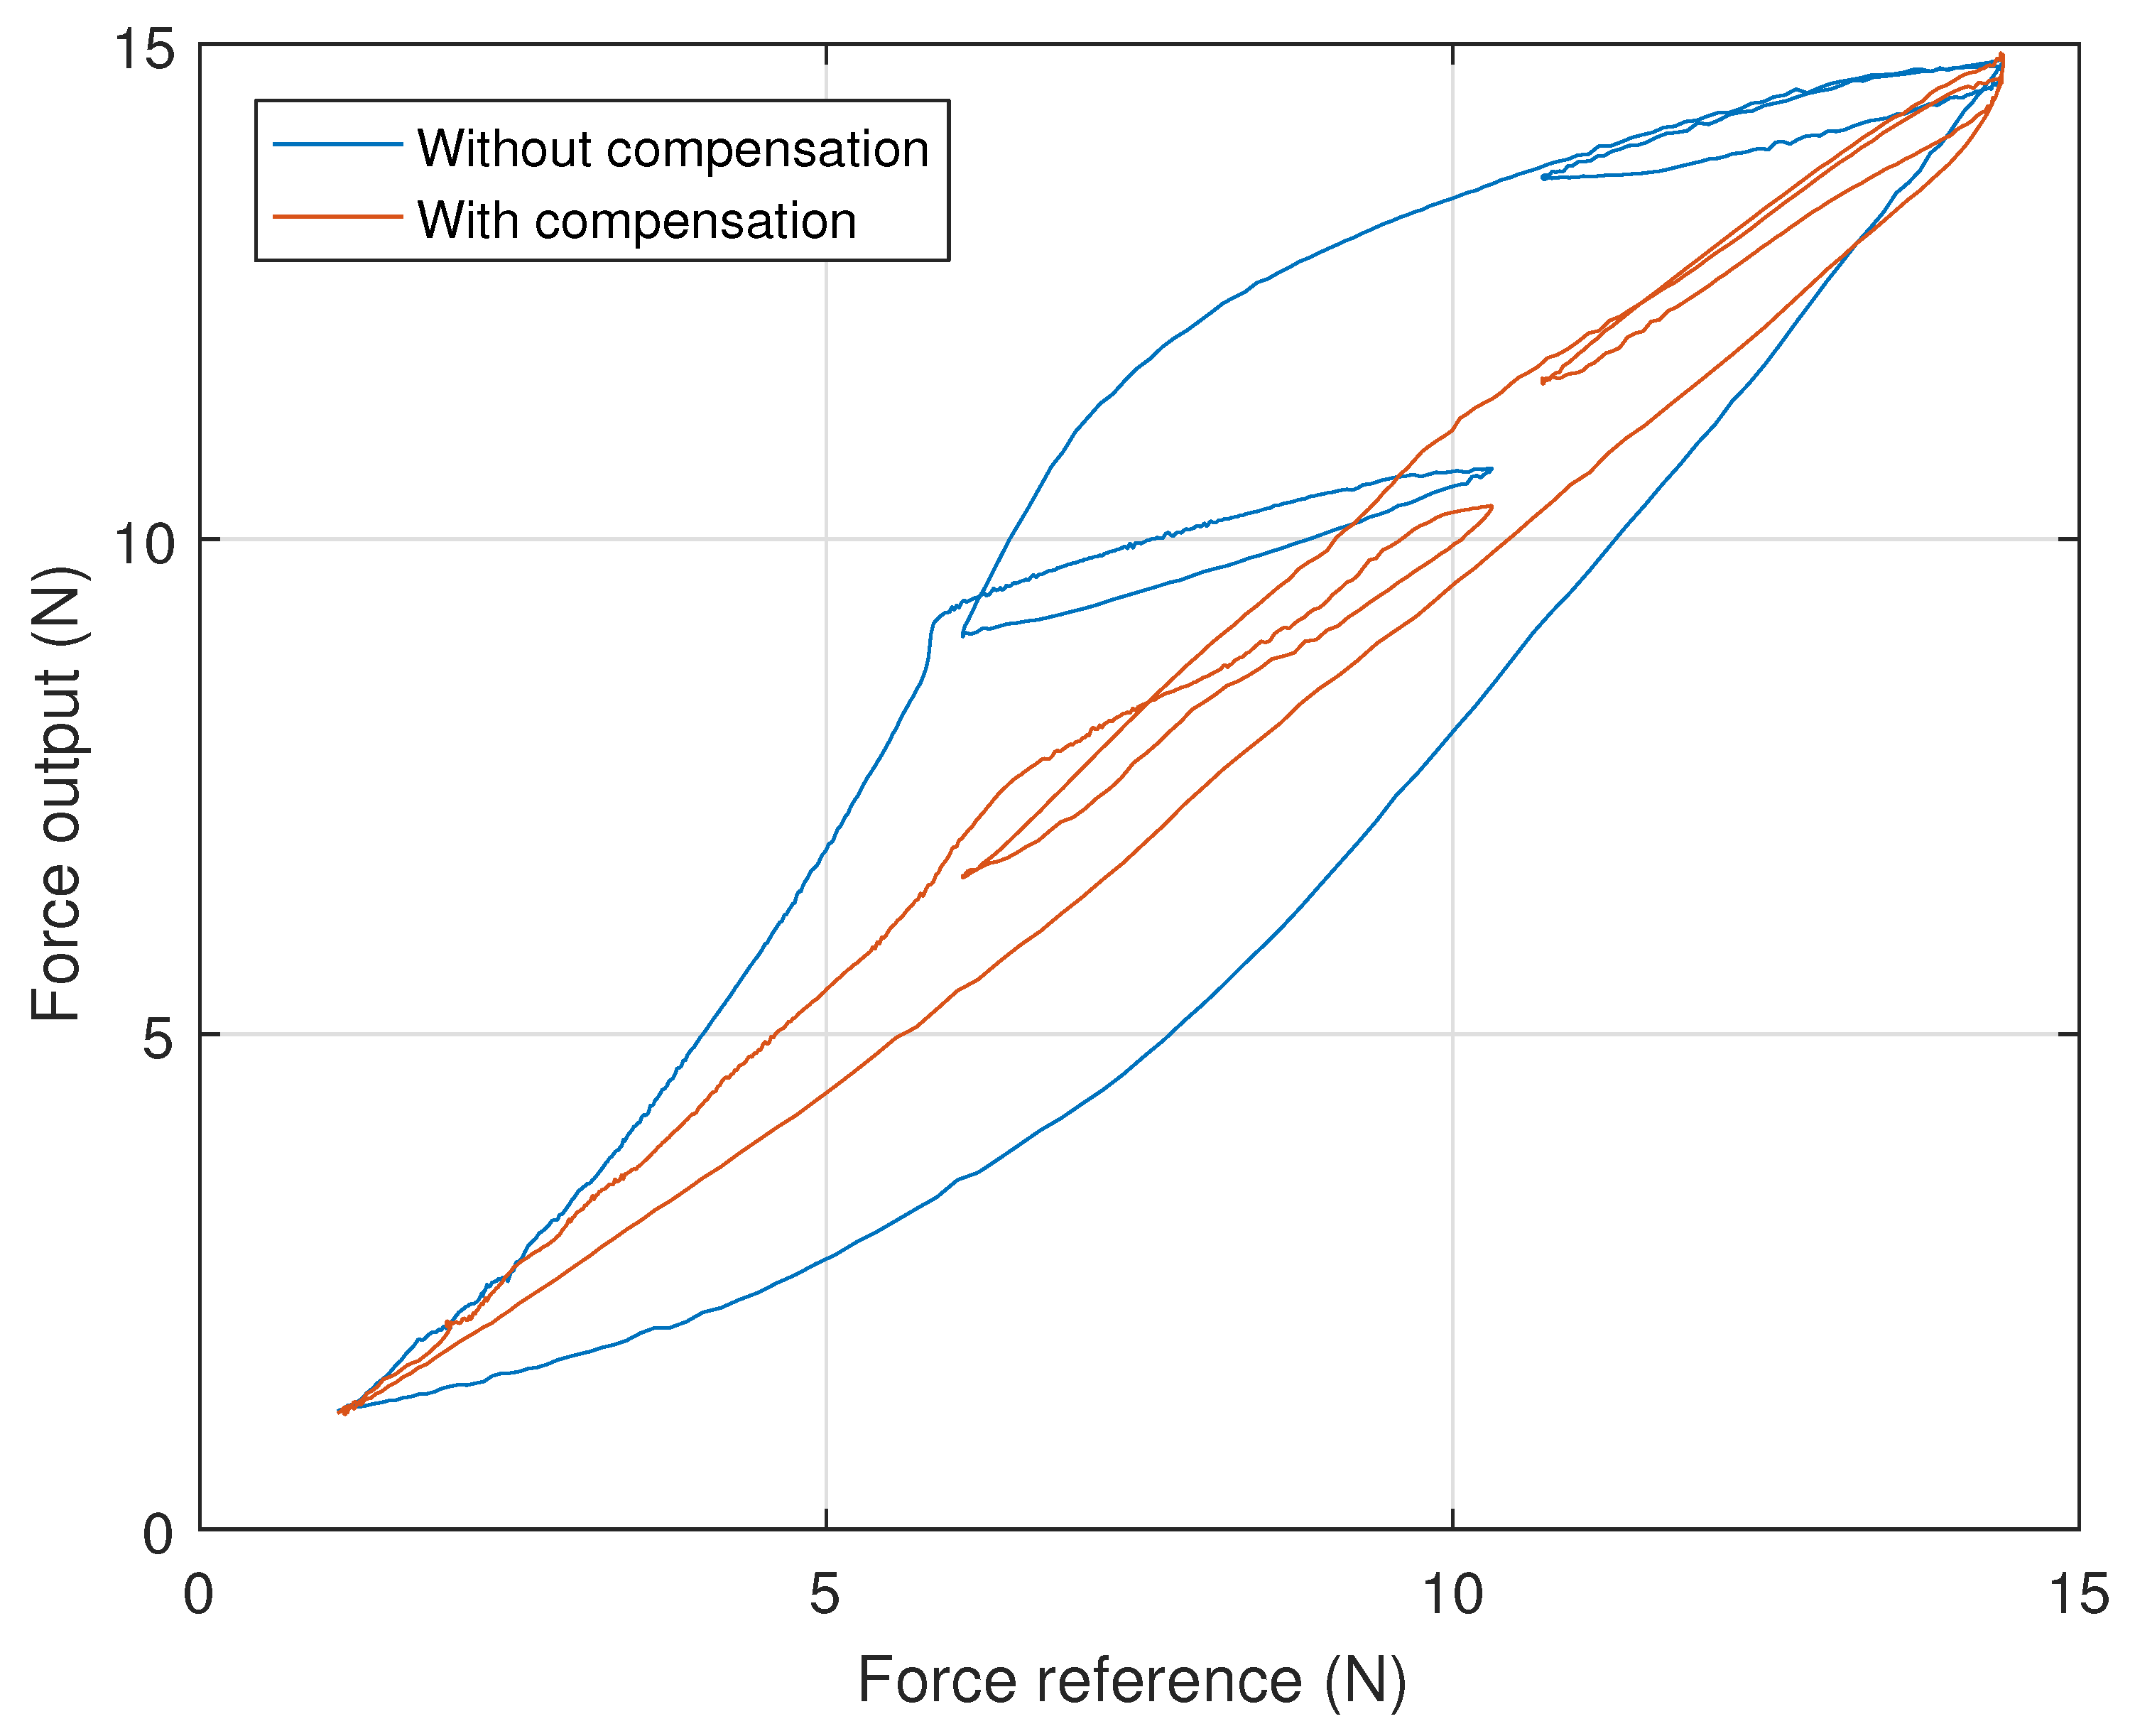
4. Experimental Results and Discussion
- The desired signal was put through the inverse model and the inverse output signal was determined;
- The desired signal was scaled, so that its extreme values matched the extremes of the inverse signal, generating the scaled signal;
- The inverse and scaled signals were alternately supplied to the system, the corresponding force output measured and recorded.
5. Conclusions and Future Work
Author Contributions
Funding
Conflicts of Interest
References
- Faria, S.H. Assessment of peripheral arterial pulses. Home Care Provid. 1999, 4, 140–141. [Google Scholar] [CrossRef]
- Moran, J.F. Pulse. In Clinical Methods: The History, Physical, and Laboratory Examinations, 3rd ed.; Book Section 17; Butterworths: London, UK; Boston, MA, USA, 1990. [Google Scholar]
- Karnath, B.; Thornton, W. Precordial and Carotid Pulse Palpation. Hospital Physician 2002, 20–24. Available online: http://www.hospitalphysician.com/pdf/hp_jul02_pulse.pdf (accessed on 18 May 2018).
- Schlant, R.C.; Felner, J.M. The arterial pulse—Clinical manifestations. Curr. Probl. Cardiol. 1977, 2, 1–5. [Google Scholar] [CrossRef]
- McGee, S. Chapter 15—Pulse Rate and Contour. In Evidence-Based Physical Diagnosis, 4th ed.; McGee, S., Ed.; Content Repository Only; Elsevier: Philadelphia, PA, USA, 2018; pp. 95–108. [Google Scholar]
- Londero, L.S.; Lindholt, J.S.; Thomsen, M.D.; Hoegh, A. Pulse palpation is an effective method for population-based screening to exclude peripheral arterial disease. J. Vasc. Surg. 2016, 63, 1305–1310. [Google Scholar] [CrossRef] [PubMed]
- Atallah, P.C.; Atallah, P.; Kashyap, V. Internal Carotid Artery Aneurysm Discovered by Palpation of Asymmetric Pulses. Am. J. Med. 2010, 123, e1–e2. [Google Scholar] [CrossRef] [PubMed]
- Tibballs, J.; Russell, P. Reliability of pulse palpation by healthcare personnel to diagnose paediatric cardiac arrest. Resuscitation 2009, 80, 61–64. [Google Scholar] [CrossRef] [PubMed]
- Lundin, M.; Wiksten, J.P.; Peräkylä, T.; Lindfors, O.; Savolainen, H.; Skyttä, J.; Lepäntalo, M. Distal Pulse Palpation: Is It Reliable? World J. Surg. 1999, 23, 252–255. [Google Scholar] [CrossRef] [PubMed]
- Brearley, S.; Shearman, C.P.; Simms, M.H. Peripheral pulse palpation: An unreliable physical sign. Ann. R. Coll. Surg. Engl. 1992, 74, 169–171. [Google Scholar] [PubMed]
- Tibballs, J.; Weeranatna, C. The influence of time on the accuracy of healthcare personnel to diagnose paediatric cardiac arrest by pulse palpation. Resuscitation 2010, 81, 671–675. [Google Scholar] [CrossRef] [PubMed]
- Ray, S.A.; Srodon, P.D.; Taylor, R.S.; Dormandy, J.A. Reliability of ankle: Brachial pressure index measurement by junior doctors. Br. J. Surg. 1994, 81, 188–190. [Google Scholar] [CrossRef] [PubMed]
- Levine, A.I.; DeMaria, S., Jr.; Schwartz, A.D.; Sim, A.J. The Comprehensive Textbook of Healthcare Simulation; Springer Science & Business Media: New York, NY, USA, 2013. [Google Scholar]
- Barry Issenberg, S.; McGaghie, W.C.; Petrusa, E.R.; Lee Gordon, D.; Scalese, R.J. Features and uses of high-fidelity medical simulations that lead to effective learning: A BEME systematic review. Med. Teach. 2005, 27, 10–28. [Google Scholar] [CrossRef] [PubMed]
- Gould, D.A.; Reekers, J.A. The Role of Simulation in Training Endovascular Interventions. Eur. J. Vasc. Endovasc. Surg. 2008, 35, 633–636. [Google Scholar] [CrossRef] [PubMed]
- Samia, H.; Khan, S.; Lawrence, J.; Delaney, C.P. Simulation and Its Role in Training. Clin. Colon Rectal Surg. 2013, 26, 47–55. [Google Scholar] [CrossRef] [PubMed]
- Alhalabi, M.O.; Daniulaitis, V.; Kawasaki, H.; Hori, T. Medical training simulation for palpation of subsurface tumor using HIRO. In Proceedings of the First Joint Eurohaptics Conference and Symposium on Haptic Interfaces for Virtual Environment and Teleoperator Systems, World Haptics Conference, Pisa, Italy, 18–20 March 2005; pp. 623–624. [Google Scholar] [CrossRef]
- Langrana, N.; Burdea, G.; Ladeji, J.; Dinsmore, M. Human performance using virtual reality tumor palpation simulation. Comput. Graph. 1997, 21, 451–458. [Google Scholar] [CrossRef]
- Daniulaitis, V.; Alhalabi, M.O.; Kawasaki, H.; Tanaka, Y. Medical palpation of deformable tissue using physics-based model for haptic interface robot (HIRO). In Proceedings of the 2004 IEEE/RSJ International Conference on Intelligent Robots and Systems (IROS) (IEEE Cat. No.04CH37566), Sendai, Japan, 28 September–2 October 2004; Volume 4, pp. 3907–3911. [Google Scholar] [CrossRef]
- Li, M.; Luo, S.; Nanayakkara, T.; Seneviratne, L.D.; Dasgupta, P.; Althoefer, K. Multi-fingered haptic palpation using pneumatic feedback actuators. Sens. Actuators A Phys. 2014, 218, 132–141. [Google Scholar] [CrossRef]
- Coles, T.R.; John, N.W.; Gould, D.; Caldwell, D.G. Integrating Haptics with Augmented Reality in a Femoral Palpation and Needle Insertion Training Simulation. IEEE Trans. Haptics 2011, 4, 199–209. [Google Scholar] [CrossRef] [PubMed]
- Ullrich, S.; Kuhlen, T. Haptic Palpation for Medical Simulation in Virtual Environments. IEEE Trans. Vis. Comput. Graph. 2012, 18, 617–625. [Google Scholar] [CrossRef] [PubMed]
- LeClair, A.; Wolfer, J. Haptic palpation of aortic pressure waveforms. In Proceedings of the 2015 3rd Experiment International Conference (exp.at’15), Ponta Delgada, Portugal, 2–4 June 2015; pp. 116–117. [Google Scholar] [CrossRef]
- Heo, H.; Kim, E.G.; Nam, K.C.; Huh, Y. Radial artery pulse wave simulator using a linear motor. Conf. Proc. IEEE Eng. Med. Biol. Soc. 2008, 2008, 4895–4898. [Google Scholar] [CrossRef] [PubMed]
- Ullrich, S.; Mendoza, J.; Ntouba, A.; Rossaint, R.; Kuhlen, T. Haptic pulse simulation for virtual palpation. In Bildverarbeitung für die Medizin 2008; Springer: Berlin/Heidelberg, Germany, 2008; pp. 187–191. [Google Scholar]
- Coles, T.; John, N.W.; Gould, D.A.; Caldwell, D.G. Haptic Palpation for the Femoral Pulse in Virtual Interventional Radiology. In Proceedings of the 2009 Second International Conferences on Advances in Computer-Human Interactions, Cancun, Mexico, 1–7 February 2009; pp. 193–198. [Google Scholar] [CrossRef]
- Takeuchi, A.; Kobayashi, T.; Hirose, M.; Masuda, T.; Sato, T.; Ikeda, N. Arterial pulsation on a human patient simulator improved students’ pulse assessment. J. Biomed. Sci. Eng. 2012, 5, 285–289. [Google Scholar] [CrossRef]
- Loftin, C.; Garner, K.; Eames, J.; West, H. Use of Harvey® the Cardiopulmonary Patient Simulator in Physician Assistant Training. J. Phys. Assist. Educ. 2016, 27, 32–39. [Google Scholar] [CrossRef]
- Gordon, M.S.; Ewy, G.A.; DeLeon, A.C.; Waugh, R.A.; Felner, J.M.; Forker, A.D.; Gessner, I.H.; Mayer, J.W.; Patterson, D. “Harvey,” the cardiology patient simulator: Pilot studies on teaching effectiveness. Am. J. Cardiol. 1980, 45, 791–796. [Google Scholar] [CrossRef]
- Goldberger, A.L.; Amaral, L.A.N.; Glass, L.; Hausdorff, J.M.; Ivanov, P.C.; Mark, R.G.; Mietus, J.E.; Moody, G.B.; Peng, C.K.; Stanley, H.E. PhysioBank, PhysioToolkit, and PhysioNet: Components of a New Research Resource for Complex Physiologic Signals. Circulation 2000, 101, e215–e220. [Google Scholar] [CrossRef] [PubMed]
- Hart, J. Normal resting pulse rate ranges. J. Nurs. Educ. Pract. 2015, 5, 95. [Google Scholar] [CrossRef]
- Tan, X.; Baras, J.S. Adaptive identification and control of hysteresis in smart materials. IEEE Trans. Autom. Control 2005, 50, 827–839. [Google Scholar] [CrossRef]
- Gu, G.Y.; Zhu, L.M.; Su, C.Y. Modeling and Compensation of Asymmetric Hysteresis Nonlinearity for Piezoceramic Actuators With a Modified Prandtl-Ishlinskii Model. IEEE Trans. Ind. Electron. 2014, 61, 1583–1595. [Google Scholar] [CrossRef]
- Jiles, D.C.; Atherton, D.L. Theory of ferromagnetic hysteresis. J. Magn. Magn. Mater. 1986, 61, 48–60. [Google Scholar] [CrossRef]
- Hassani, V.; Tjahjowidodo, T.; Do, T.N. A survey on hysteresis modeling, identification and control. Mech. Syst. Signal Process. 2014, 49, 209–233. [Google Scholar] [CrossRef]
- Iyer, R.V.; Xiaobo, T.; Krishnaprasad, P.S. Approximate inversion of the Preisach hysteresis operator with application to control of smart actuators. IEEE Trans. Autom. Control 2005, 50, 798–810. [Google Scholar] [CrossRef]
- Iyer, R.V.; Tan, X. Control of hysteretic systems through inverse compensation. IEEE Control Syst. 2009, 29, 83–99. [Google Scholar] [CrossRef]
- Mayergoyz, I.D. Mathematical Models of Hysteresis; Springer: New York, NY, USA, 1991. [Google Scholar]
- Eielsen, A.A. Topics in Control of Nanopositioning Devices. Ph.D. Thesis, Norwegian University of Science and Technology, Trondheim, Norway, 2012. [Google Scholar]
- Stakvik, J.; Ragazzon, M.R.; Eielsen, A.A.; Gravdahl, J.T. On Implementation of the Preisach Model: Identification and Inversion for Hysteresis Compensation. Model. Identif. Control 2015, 36, 9. [Google Scholar] [CrossRef]
- Stakvik, J. Identification, Inversion and Implementaion of the Preisach Hysteresis Model in Nanopositioning. Master’s Thesis, Institutt for Teknisk Kybernetikk, Trondheim, Norway, 2014. [Google Scholar]
- Tan, X.; Bennani, O. Fast inverse compensation of Preisach-type hysteresis operators using field-programmable gate arrays. In Proceedings of the 2008 American Control Conference, Seattle, WA, USA, 11–13 June 2008; pp. 2365–2370. [Google Scholar] [CrossRef]
- Tan, X.; Venkataraman, R.; Krishnaprasad, P.S. Control of hysteresis: Theory and experimental results. In Proceedings of the SPIE’s 8th Annual International Symposium on Smart Structures and Materials, Newport Beach, CA, USA, 4–8 March 2001; International Society for Optics and Photonics: New York, NY, USA, 2001; pp. 101–112. [Google Scholar]
- Yang, M.J.; Li, C.X.; Gu, G.Y.; Zhu, L.M. A Modified Prandtl-Ishlinskii Model for Rate-dependent Hysteresis Nonlinearity Using m th-power Velocity Damping Mechanism. Int. J. Adv. Robot. Syst. 2014, 11, 163. [Google Scholar] [CrossRef]
- Stroehla, T.; Radler, O.; Volkert, R.; Zöppig, V. Hysteresis compensation of electromagnets. Facta Univ. Ser. Mech. Eng. 2006, 4, 35–44. [Google Scholar]
- Song, G.; Jinqiang, Z.; Xiaoqin, Z.; Abreu-Garcia, J.A.D. Tracking control of a piezoceramic actuator with hysteresis compensation using inverse Preisach model. IEEE/ASME Trans. Mech. 2005, 10, 198–209. [Google Scholar] [CrossRef]


© 2018 by the authors. Licensee MDPI, Basel, Switzerland. This article is an open access article distributed under the terms and conditions of the Creative Commons Attribution (CC BY) license (http://creativecommons.org/licenses/by/4.0/).
Share and Cite
Carneiro, F.; Abreu, P.; Restivo, M.T. Hysteresis Compensation in a Tactile Device for Arterial Pulse Reproduction. Sensors 2018, 18, 1631. https://doi.org/10.3390/s18051631
Carneiro F, Abreu P, Restivo MT. Hysteresis Compensation in a Tactile Device for Arterial Pulse Reproduction. Sensors. 2018; 18(5):1631. https://doi.org/10.3390/s18051631
Chicago/Turabian StyleCarneiro, Fernando, Paulo Abreu, and Maria Teresa Restivo. 2018. "Hysteresis Compensation in a Tactile Device for Arterial Pulse Reproduction" Sensors 18, no. 5: 1631. https://doi.org/10.3390/s18051631