1. Introduction
Wireless Sensor Networks (WSNs) enable the monitoring and controlling of the physical environment from a remote location with high accuracy. Supporting technology is applied to various domains such as monitoring of environmental, agricultural, healthcare, public-safety, military, industrial, transportation systems [
1], and smart homes for appliances [
2]. Early detection of natural disasters, such as tsunamis, earthquakes, landslides, flash floods, fires, and hurricanes, is very important. The main supporting technology for early-warning-detection systems involves integrating sensors into a network, which can be wired or wireless.
WSNs are usually composed of components that are smaller than those in wired networks, low-cost, and applicable for a wide range of applications. The main components are sensing, processing, communication, and power units [
3]. With these WSNs, it is possible to collect, process, and analyze data and send the results; therefore, their placement can be flexible [
4]. These advantages make WSNs very powerful; however, they also have many limitations, such as dependence on batteries as energy sources, smaller central processing unit (CPU) and memory capacity [
5], security vulnerabilities [
6,
7], and radio inference [
8,
9]. Because of these limitations, a resource-aware policy [
10,
11,
12,
13] for adaptation mechanisms and security-aware policy [
14,
15,
16,
17] for data security based on the available resources of sensor nodes are required.
The placement of a sensor node is not always in an area that is easy to reach and sometimes placed in extremely dangerous areas [
18]. It is difficult to maintain a sensor node that has been deployed to monitor an area where routine maintenance, such as changing batteries, cannot be undertaken. Hence, WSNs must operate over long periods, and their resources must be used as efficiently as possible [
3]. The regulation of energy consumption via adaptation is a method for increasing the lifetime of a sensor node [
5,
18,
19].
This study is a continuation of our previous research in which we proposed an Adaptable Resource and Security (ARSy) Framework [
20], which implements resource and security adaptations. Resource adaptation is used to manage battery, CPU, and memory use of a sensor node, and security adaptation is used to implement a certain security level to compensate for the excessive use of resources. Security adaptation works on the basis of resource availability. If the average use of a resource is above a critical threshold, the security of the generated data is at a high or medium level; however, if resource availability decreases beyond the threshold, the security of such data is at a low level or even very low level.
The remainder of this paper is as follows. In
Section 2, we discuss related studies. In
Section 3, we discuss the requirements and architecture of a security system and its adaptation mechanisms and processes. In
Section 4, we discuss the laboratory testing we conducted and the results. In
Section 5, we provide discussion and present the conclusion and direction for future study in
Section 6.
2. Related Studies
There were challenges in previous studies on data processing in a sensor node because data mining was executed on data streams [
10,
11]. Online and real-time data storage and processing are executed with limited computing capabilities [
12,
21,
22]. To overcome energy inefficiency in WSNs, the first solution is to reduce the amount of data communication by moving the data-processing algorithm to the sensor network, and the second solution is to combine data-processing and communication units [
13].
Data mining is required to reduce the amount of data that must be transmitted through data communications [
22,
23]. There are many algorithms for mining data such as clustering [
24], classification [
25], and frequent items [
26]. To avoid massive data transfers, a sensor node is implemented for on-board analysis, with which data are processed at the source location. Previous projects, such as VEDAS [
27], EVE [
28], and Diamond Eye [
29], have used this method.
Security systems offer as much protection as possible; thus, power consumption will increase and the lifetime of the system will decrease. System services are reduced to decrease power consumption, which decreases the lifetime of the system [
30]. In fact, security is almost always higher than potential threats. When security is very strong, it affects the overall performance of the system, excessive protection will reduce reliability and availability and affect security globally. An appropriate level of security can be estimated in terms of providing different security-quality protection models for each type of data [
31].
The concept of green security [
32] or re-engineering of security [
30] can be an alternative solution, but it requires time and money to implement. Secure smart home concept using Home Area Network (HAN) [
2], and Home Automation System (HAS) using Virtual Machines [
8] make it easier to manage the security system. Previous studies focused on a security policy to model the security level of data that may have different outputs generated over time because determining the security level of data is based on the availability of resources. With a better availability of resources, the security level of data becomes higher [
14,
20].
The absolute requirement of a security system is the guarantee of high data security; however, in cases in which WSNs are used, high data security affects the performance and lifetime of the system because a higher data-security level means greater energy consumption for cryptographic data functions [
3,
33,
34]. The solution is to balance the use of resources through the security level of data [
14,
15], which is basically used to offset the use of resources when their availability has entered a critical phase. The policy of applying a high level of security to each output affects the lifetime of a WSN because higher security levels of data put greater demands on the CPU and increase battery consumption [
33].
3. System Design
Initially, hardware systems were designed with embedded sensor devices to guarantee the compatibility of the sensor and system. The largest obstacle is finding a device that can integrate the battery, memory, CPU, and communication units. Large-capacity CPU and memory are required because data processing is done on-board. After reviewing several types of components, a Raspberry Pi 3 Model B and DS18B20 temperature sensor were chosen for our laboratory testing.
The Raspberry Pi 3 Model B was chosen because it is a single-board model, simple, and lightweight. The model has built-in Wi-Fi, eliminating the need for extra USB Wi-Fi adapters [
35]. Another advantage is its compatibility with several operating systems and its plug-and-play compatibility with a variety of equipment. The specifications for this model are listed in
Table 1.
Devices with the Raspberry Pi 3 Model B pose challenges. One challenge involves memory sharing between a CPU and graphic processing unit (GPU) [
37]. Some programs are not as demanding on the CPU, and some also run on the GPU such as Blu-ray video playback. A GPU is powerful enough to handle applications. The second challenge is with the power-supply-management system.
The DS18B20 temperature sensor is a single-wire digital sensor [
36] that uses only one cable for communication with the CPU and for grounding. The sensor can derive power directly from the data line. The specifications are also listed in
Table 1.
3.1. Architecture System
We conducted our laboratory testing on a single node; however, future work will involve integrating the node with a wider network system, such as the architecture system shown in
Figure 1. The data collected by each node are processed with local node resources in accordance with the conditions of the resource node. The output data are sent at certain times to the server, which is the final destination of the data.
3.2. ARSy Framework
Generally, our ARSy framework [
20] consists of two parts, i.e., a client node, which applies the method of collecting data on-board [
28], and a data server, which stores sensor-node results, as shown in
Figure 2.
The client node is a worker node. The process that occurs on the client node is divided into the following process blocks. Details of the relationship between the resources and security level of this process are listed in
Section 3.2.2.
Data-input block: This block collects data. The collection time was every second in our study. Before the data are processed by the data-mining block, the system checks the conditions of the battery, CPU and memory resources in the resource-monitoring block.
Resource-monitoring block: This block reports the latest update of the average amount of the sensor node’s resources. This information is then input for the resource-adaptation block.
Resource-adaptation block: This block updates the resource condition with two modes, the first is the status of the resource under adaptation conditions and the second is the status of the resource not under such conditions.
Workload-system block: This block provides the workload status of the sensor node if the resources system has a heavy or light workload; heavy workload status if information resources received from resource adaptation blocks under adaptation conditions and light workload status if resource information from the resource-adaptation block is not under adaptation conditions.
Resource-, workload-, and security-level-setting block: This block contains the summary of the all the system’s resource conditions, such as amount of resources that can be used to execute data mining, security-level status that will be given at data output, and overall system workload.
Data-mining block: This block involves mining data based on light-weight frequent algorithm [
22,
38]. The data-mining process is carried out by creating counter data. All the same data are placed on the same counter data and new counter data are created for new data types.
Data-mining-result block: This block temporarily stores the results of data mining whose time-limited, before the data-mining-result sent to the Security-implementation block.
Security-implementation block: This block implements the appropriate security level based on the resource-sensor-node condition, then the results are sent to the data server, i.e., the final destination of all data.
3.2.1. Resource Adaptation
The battery, CPU, and memory are the main resources; therefore, resource availability must be maintained. This is achieved through adaptation [
11,
12], whereas the parameters data and process are maintained based on our ARSy framework. Each resource in a security system is limited by the critical threshold. If the threshold is exceeded, adaptation will be triggered to reduce excessive resource usage.
We divided resource adaptation of the sensor node into three mechanisms, i.e.,
input,
process, and
output. Input adaptation is triggered using the battery resource, process adaptation is triggered using the CPU resource, and output adaptation is triggered using the memory resource. The resource-adaptation formulas are listed in
Table 2.
When an adaptation occurs in one of the sensor-node resources by applying the specific adaptation policy to that resource (see
Table 2). These mechanisms are described in more detail as follows.
Input: Battery adaptation is triggered on the input side and is based on battery resource availability via the sampling interval (SI) [
10,
12]. If the battery usage exceeded the threshold, adaptation will be triggered. Before battery-resource adaptation occurs, the input-data-collection time is normal (does not exceed the threshold), but adaptation is triggered when the input-data-collection time changes based on the available resources.
Process: CPU adaptation is triggered on the process-data side and is based the availability of the processor resource (CPU) via the random factor (RF) [
10,
12]. If the CPU usage does not exceed the threshold, all the collected data will be maintained on the counter data; otherwise, the system only stores some counter data with priority based on dominant and non-dominant counter data. Some non-dominant counter data will be eliminated to relieve the CPU; its value will be based on the RF value.
Output: Memory adaptation is triggered on the output-data side and is based on the availability of the memory resource via the radius threshold (RT) [
10,
12]. When the resource memory is normal (not exceeding the threshold), the final result is sent to the data server; as much as 50% of all counter data is saved. If the memory usage exceeds the threshold, the system will reduce memory utilization by limiting the amount of counter data created, and the counter data are stored as output data based on the RT presentation value.
3.2.2. Security Adaptation
The adaptation of resources affects the security level of data. The security-adaptation model we applied is for estimating the security level of output data based on the resource condition. When the resource condition does not exceed the threshold, the output data have the maximum security level, but when resource availability falls below the threshold, the security level changes [
20], as shown in
Table 3.
4. Results
Our testing was limited to single node, and the goal was to observe the differences in resource behavior and time efficiency when a security system operates under normal and stressful conditions and implementing an ARSy framework and a non-ARSy framework.
The testing design is illustrated in
Figure 3. Testing with the ARSy framework involved combining resource adaptation and security adaptation in the security system, while testing with the non-ARSy framework involved resources that do not adapt under critical conditions and all security output data are generated with a high security level.
4.1. Testing Scenarios
We tested under two scenarios: normal and stress. Normal testing was conducted by allowing the system to run normally without any intervention or special treatment that would cause the CPU to become busier than usual. Stress testing was conducted by making the CPU busier, such as by playing games, browsing websites, and streaming videos. The sensor was touched so that variants data could be collected; otherwise, there would be too few data variants. Stress testing continued until the resources were completely exhausted. The uniform testing parameters are listed in
Table 4.
Critical threshold of battery, CPU, and memory: The resource used exceeded the threshold and triggered resource adaptation. Data capture: the time of collecting data was every second. Release data: The data results to be sent to the data server, the time of which was set according to the requirement testing. Battery capacity: The battery capacity differed depending on the test, as shown in
Table 5. Testing scenarios: Normal and stress. Sensor treatment: because we used a temperature sensor, then to see the variation of data capture, treatment with the sensor is touched and untouched to show the data-mining functions for variants data captured, as described in
Section 4.3.
4.2. Resources
The resource activities of a WSN are interrelated. In general, battery consumption is strongly affected by the activity of the CPU, i.e., busy, normal, or idle. Increased CPU activity increases battery consumption [
33].
4.2.1. Battery
Figure 4 shows the battery slowly entering the critical phase and exceeding the threshold until the battery is completely discharged. The system’s policy before the battery exceeded the threshold significantly affected the sensor’s data-input process. Data were collected every second when the battery was not in the adaptation phase, as shown in
Figure 5, and gradually changed as the battery entered the critical phase. Adaptation of the battery through the input data affected the data-collection time. Under normal battery-resource availability, the data-collection time was 1 s per datum and gradually changed when the availability of the battery resource was running low.
As shown in
Figure 5, when the adaptation began to trigger battery consumption, data collection gradually decreased because data input did not occur every second, but was based on the SI adaptation value. The time between one instance of data collection and the next was up to 2.5 s. When the data-collection time changed, CPU performance became more lightweight.
4.2.2. CPU
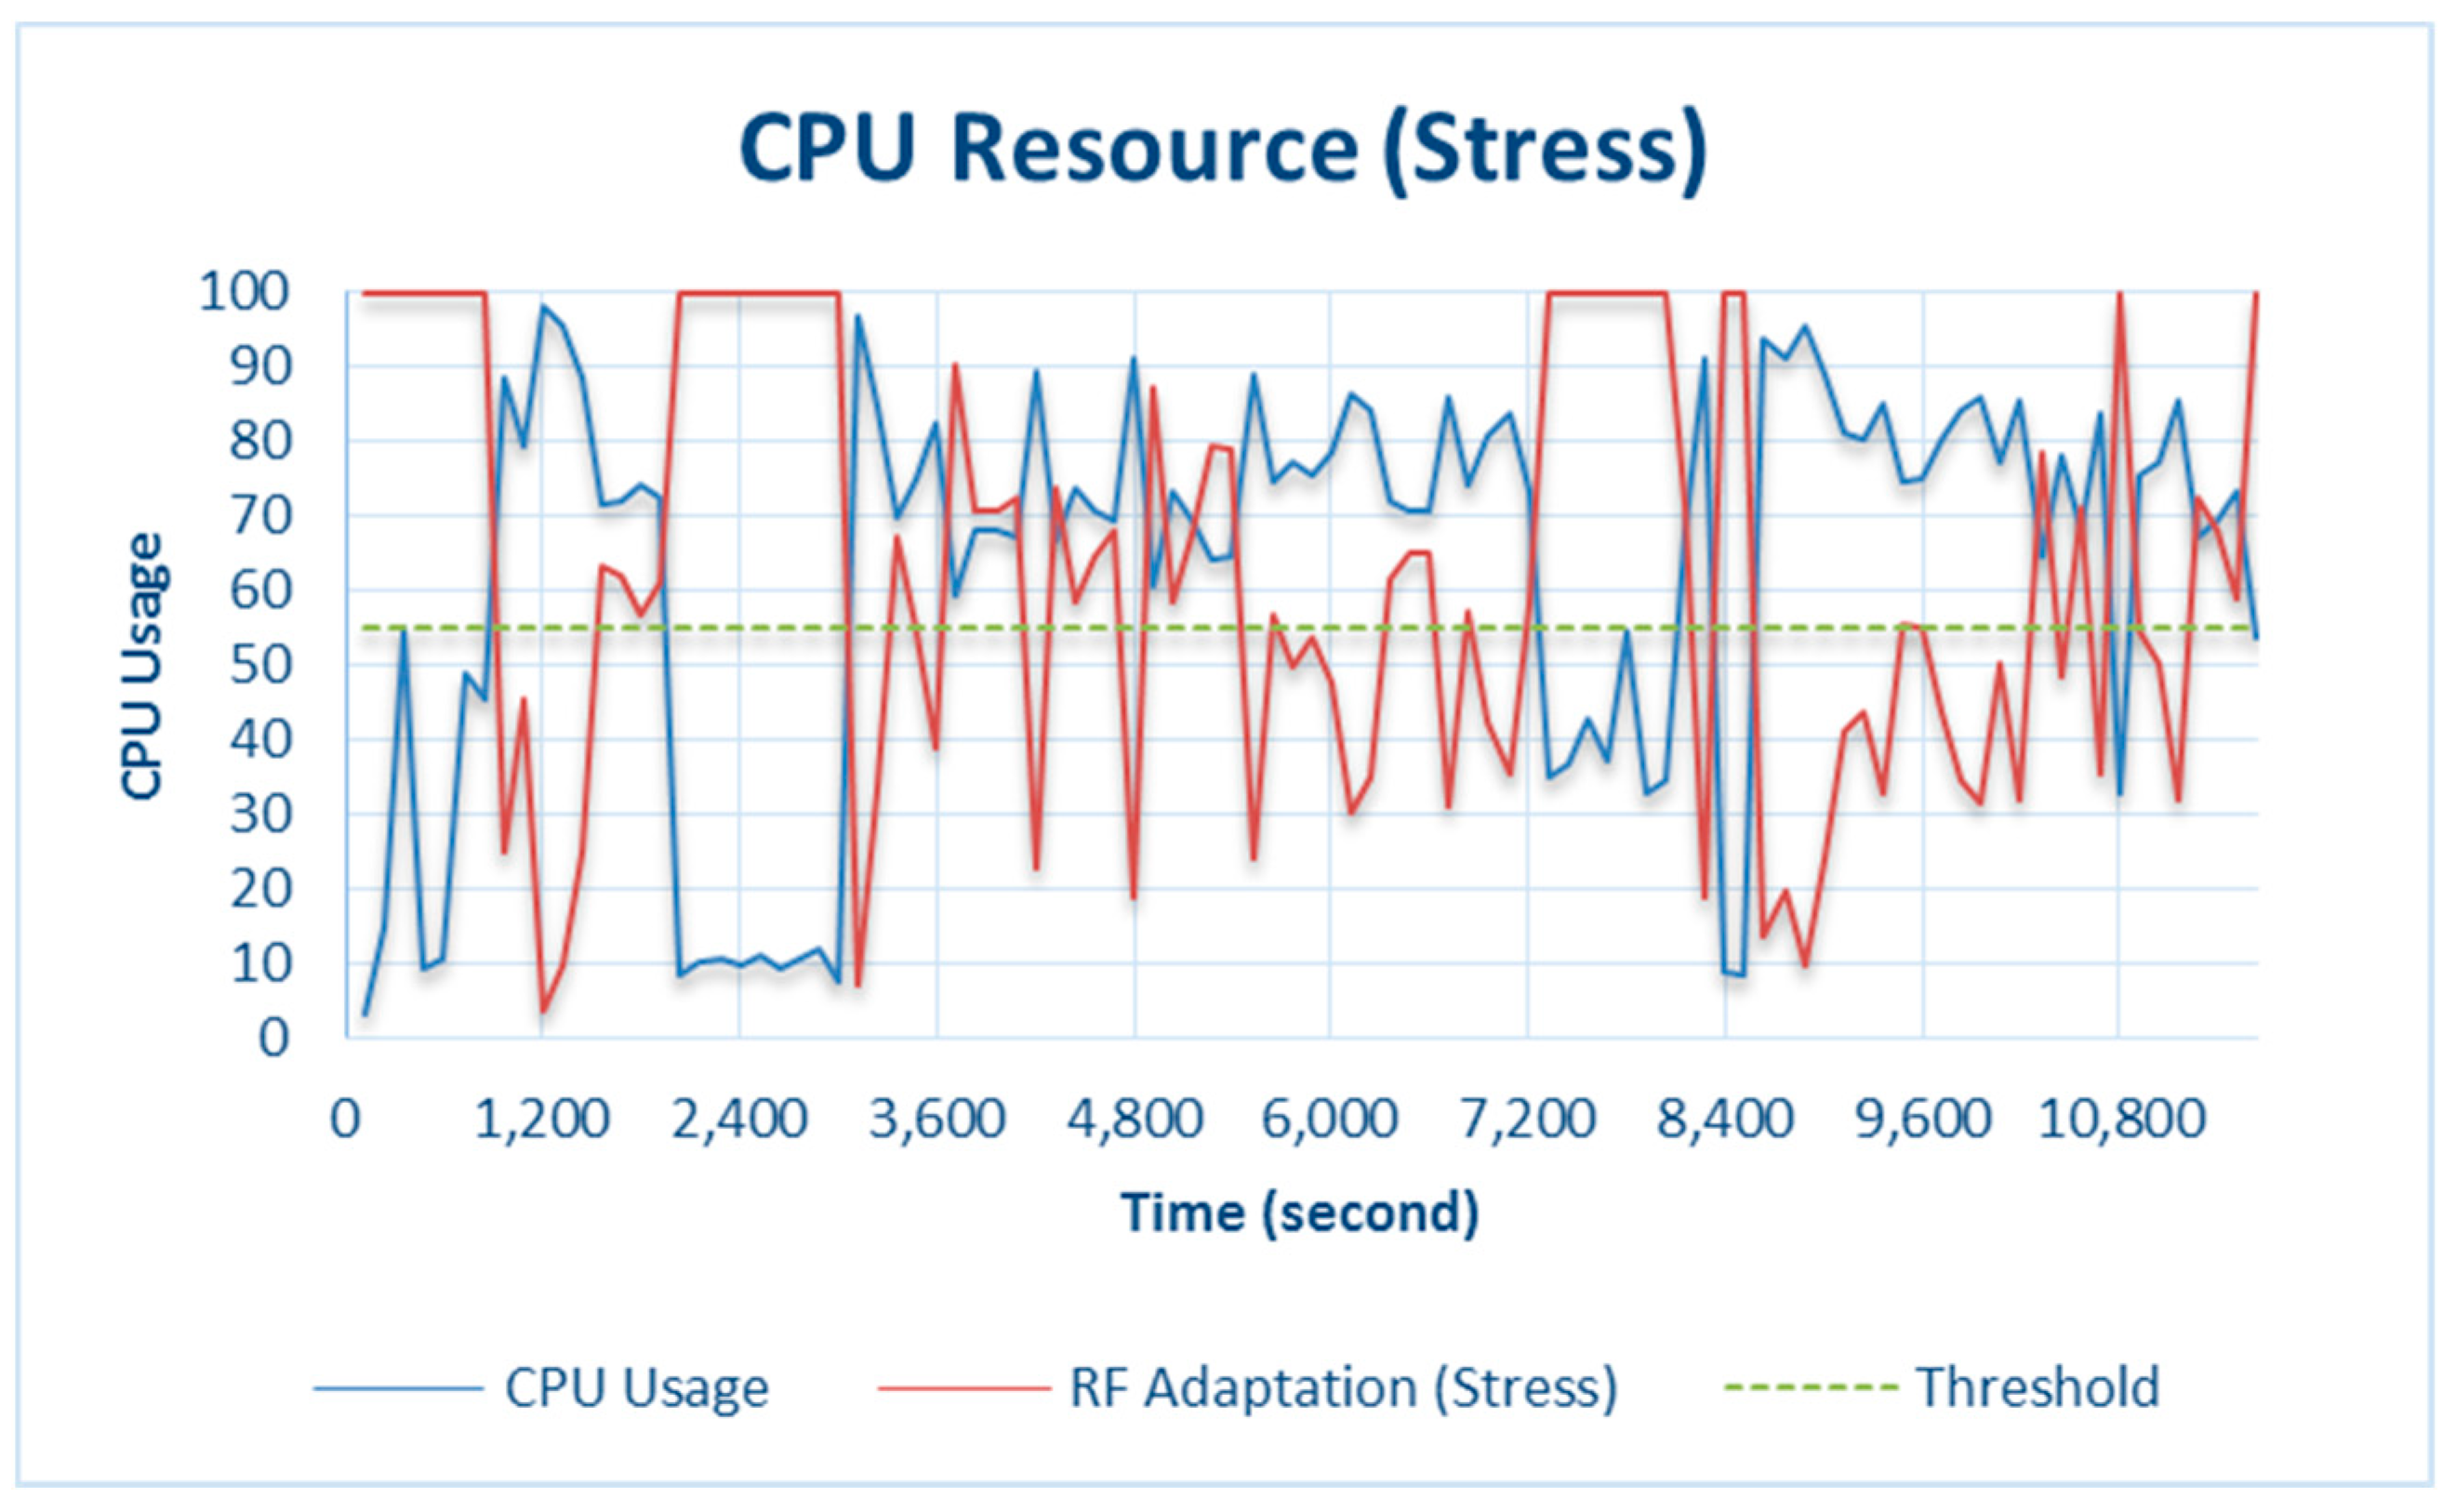
The results from testing under CPU stress conditions are shown in
Figure 6. Testing was conducted by making the CPU busier than usual by playing games, browsing websites, and streaming videos. This was done because Raspberry Pi 3 Model B has a large CPU capacity (see
Table 1). Testing was conducted by allowing the CPU to run normally, and the results indicate that the CPU activity never exceeded the threshold, as shown in
Figure 7.
When the CPU did not exceed the threshold, the RF did not initiate adaptation; therefore, all the collected data were processed. However, when resource availability decreased below the threshold under critical conditions, CPU adaptation through the RF was triggered on the basis of the amount of CPU used, as shown in
Figure 6. In 7200 s, the
CPU_used capacity was 73.6% and CPU adaptation was 58.6%. This means that the CPU only processed 58.6% of the total data on the counter. Another condition at 7320 s was when
CPU_used was 35.2% and CPU adaptation (RF) was 100%, i.e., the CPU processed all the data. In general, when system is in the adaptation phase, all the data collected through data mining will not be stored, but only some of the data that have more dominant data variants than others. For more details, see
Section 3.2.1. Resource Adaptation.
The results shown in
Figure 7 are for normal testing, where CPU_used was greatest at 6.2% at 28,200 s. This did not exceed the 55% critical threshold, so the system was not in the resource-adaptation phase.
4.2.3. Memory
As mentioned above, the memory of Raspberry Pi 3 Model B is shared by the CPU and GPU. It is very difficult to monitor the memory exceeding the threshold value, so the procedure for testing the CPU was also conducted for the memory.
Figure 8 and
Figure 9 show the results of the stress and normal testing of the memory, respectively.
As shown in
Figure 8, the memory initially ran normally without adaptation because usage did not yet exceed the threshold. Under this condition, the data were processed by the memory and stored. The applied system policy adaptations will save 50% of the most dominant counter data, which are the final data sent to the server. However, when the memory usage exceeded the threshold, the amount of final data sent to the data server was calculated on the basis of the value of memory adaptation through the RT.
For example, at 2400 s, memory_usage was 19.5%, which means no adaptation was triggered and the default RT adaptation value was 50%, so half the total amount of counter data was saved and sent to the data server. Furthermore, at 6000 s, memory_usage was 80.4%, which exceeded the threshold, so adaptation was triggered. The data to be stored constituted 19.6%.
Figure 9 shows the results of memory usage during normal testing. Memory usage at 32,160 s, resulted in memory_usage being 14.78%, which did not exceed the memory threshold, so memory adaptation was not triggered.
4.3. Collecting and Mining Data
Data collected by the sensors are processed by an on-board mechanism [
27,
28,
29], i.e., by directly applying a data-mining algorithm known as the Lightweight Frequent Item Algorithm [
20,
22,
38]. The data are placed on the counter data based on the similarity of the data and new counter data are created if the collected data differ from those previously formed on the counter data. This data-mining process continues until the time limit is reached.
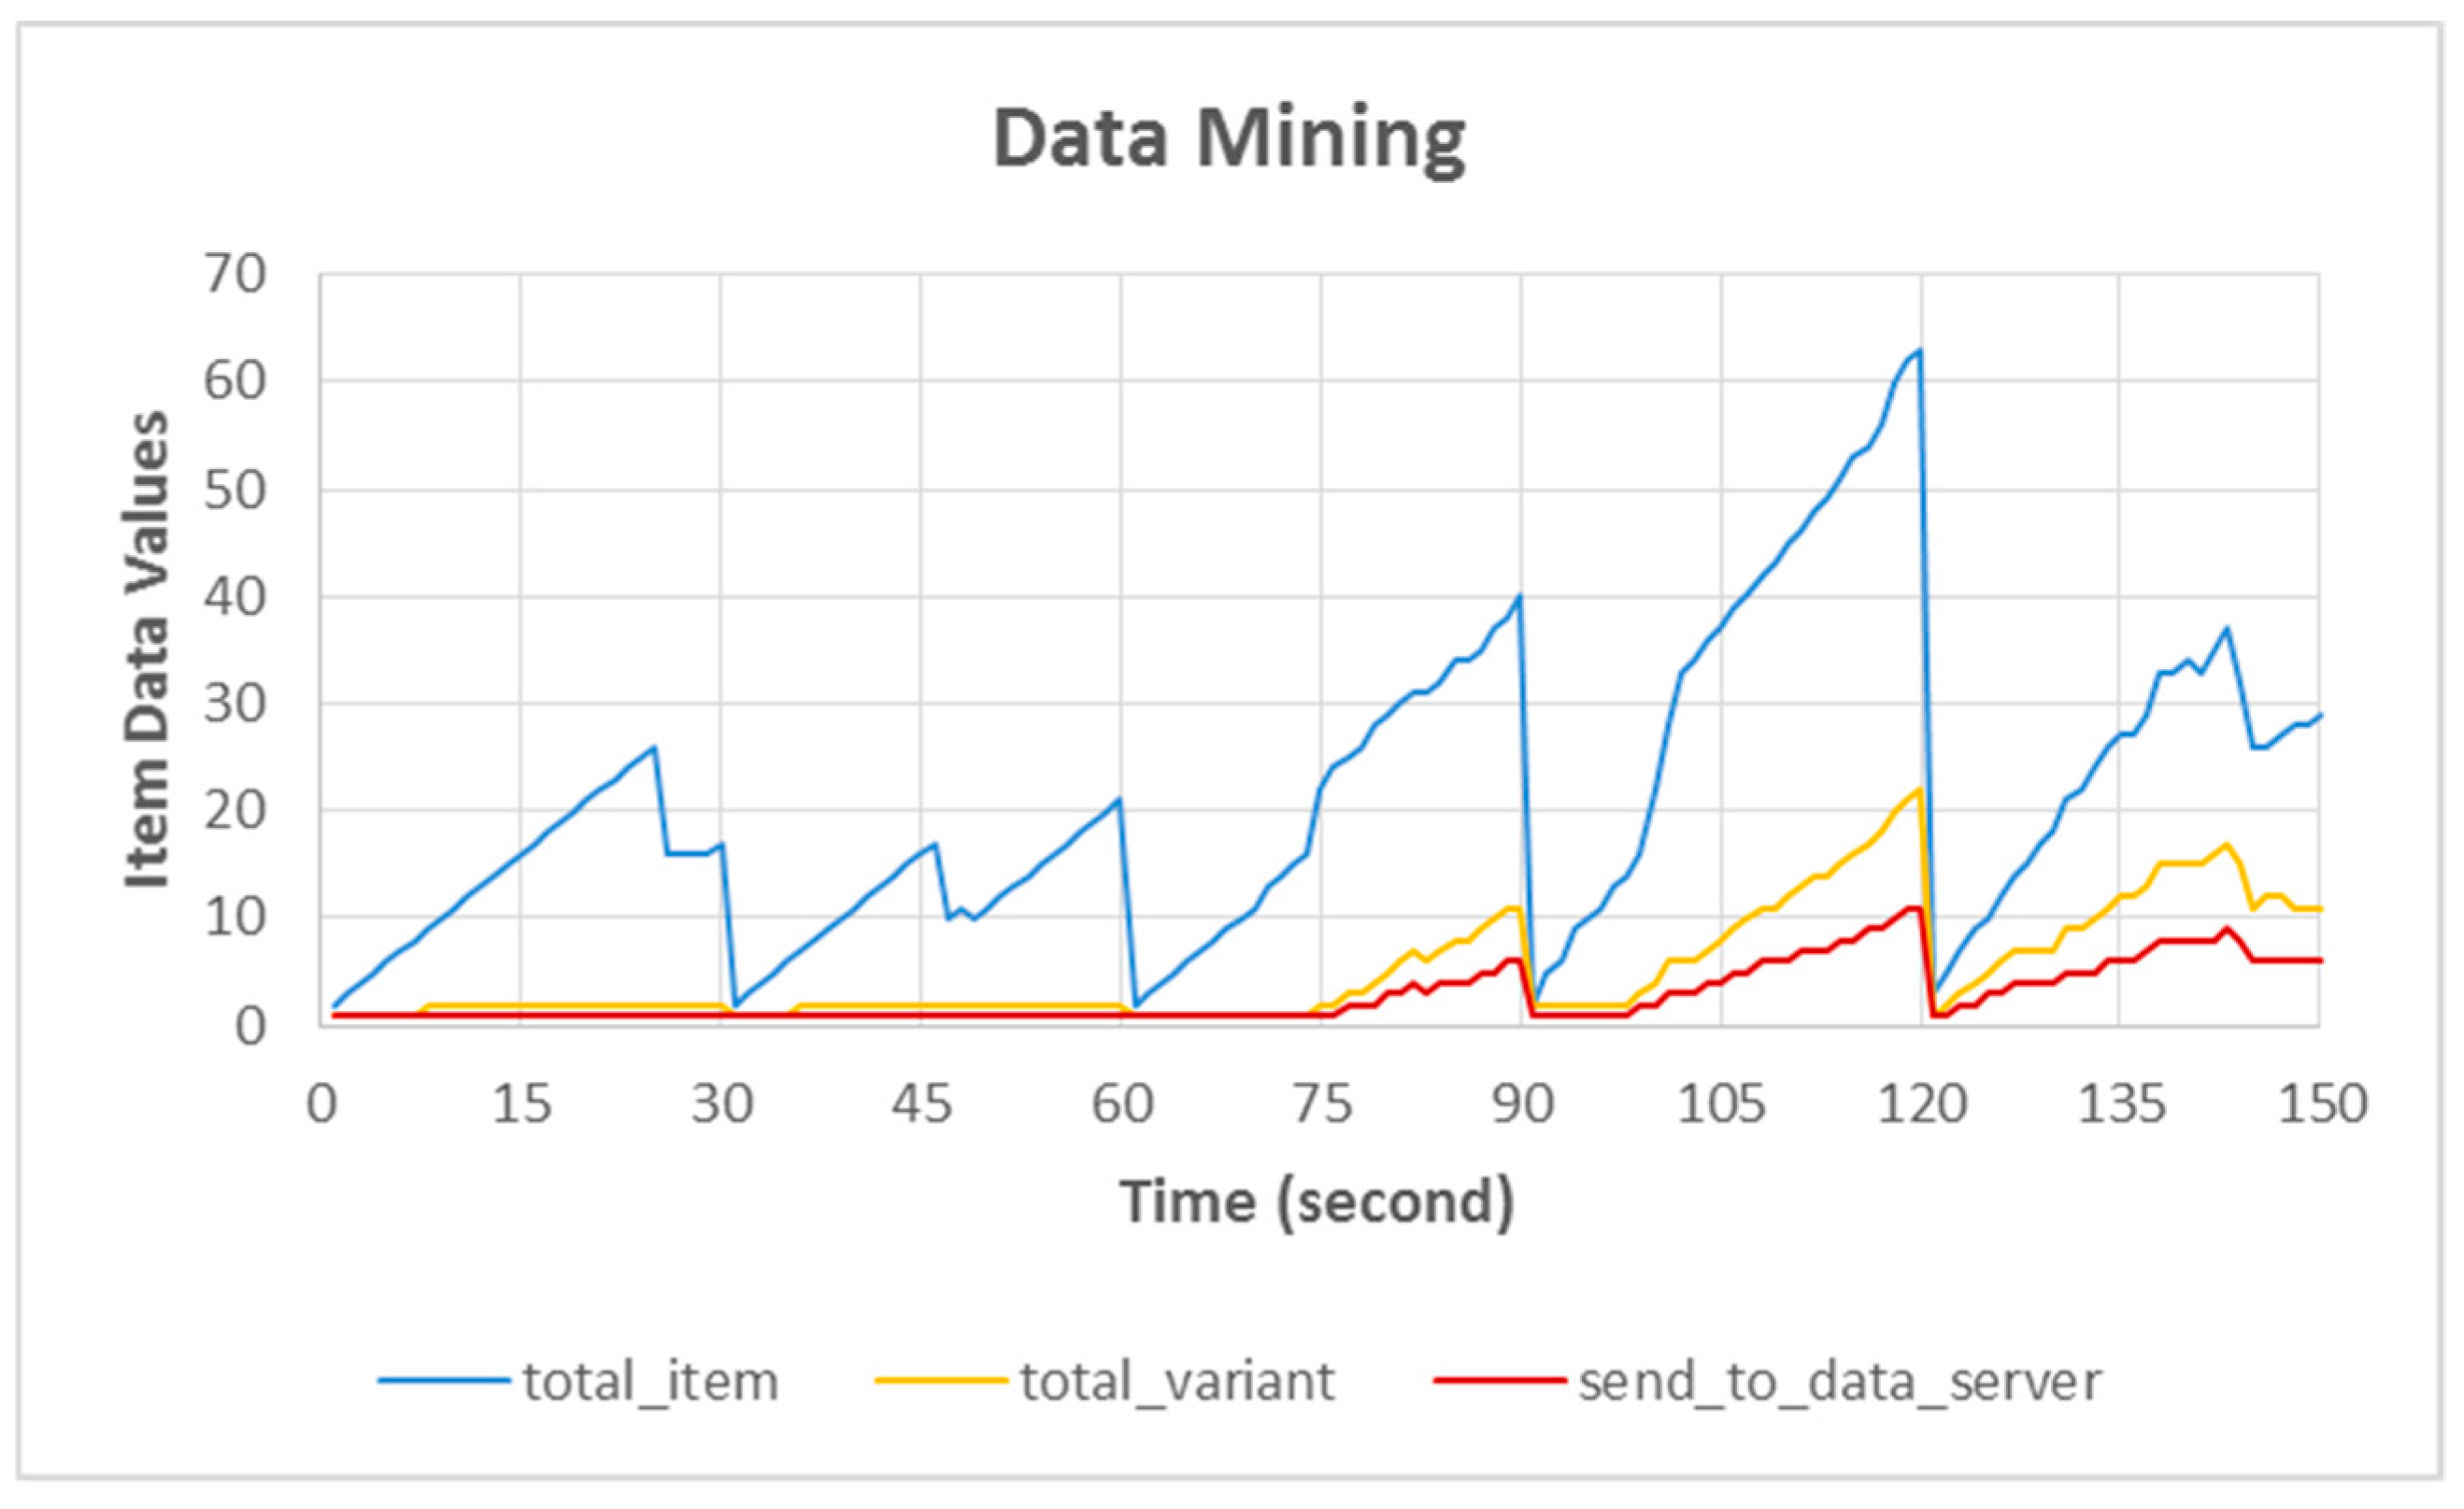
Figure 10 compares the three types of data collected after the data-mining process, the release period of the data-mining result was every 30 s: (1)
total_item, all data collected by sensors that were limited by the timer; (2)
total_variant, the number of data variants obtained during the data-mining period; and (3)
send_to_server, the final data to be sent to the data server.
For example, the data in this graph are at 120 s, total_item 63 data, total_variant 22 data, and send_to_server 11 variant data. This graph is based on our ARSy framework and shows the difference between total_item, total_variant, and send_to_server. During data mining, a large amount of data were captured by the sensor (total_item 63), but the data-mining mechanism filters by grouping similar collected data (varian_data 22). For the final result after processing (send_to_server 11), only some of the data with the most variants were sent to the data server as the final result due to the adaptation policy of the system.
4.4. Security Level
Determining the security level [
15] is the last stage before data are sent to the data server. There are four security levels based on the availability of resources (see
Table 3): level 3 is high security level, which is the most ideal because the output data sent to the data server have the maximum level of security, with the average resource availability of the network being 75–100%; level 2 is medium security level with the average resource availability being 50–75%; level 1 is low security level with average resource availability being 20–50%; and level 0 is very-low security level with average resource availability being 0–20%.
Figure 11 shows the security levels during stress and normal testing. During stress testing, the security level of the data output fluctuated and reflected the current conditions. Normal testing showed more stable results at the high and medium security levels. Hence, maintaining resource stability can also stabilize the security level at the maximum average condition.
4.5. Operating Time
Time operation is the duration or the length of operation time that measured in second units. Battery consumption [
39] was divided into several modes, such as boot, idle, video playback, normal operation, and stress. The testing was conducted on an ARSy framework and a non-ARSy framework under normal and stress operating conditions. The results are listed in
Table 5. The battery capacities were 30, 100, and 1000-mAh and release times were 30, 60, and 120 s. Details of this testing scenario are summarized in
Table 4. With the ARSy framework for 1000-mAh battery capacity during normal testing, the operating duration reached 9.19 h, whereas during stress testing, the duration reached only 2.76 h. With the non-ARSy framework for 1000-mAh battery capacity during normal testing, the duration reached 3.44 h, and during stress testing, the duration reached 2.74 h.
5. Discussion
The availability of resources and data security on WSN devices is an absolute requirement, but resource capacity is very limited. The limited battery, CPU, and memory resources of WSN devices force the devices to use the resources as efficiently as possible. Security is the largest resource used when the highest security is required for the output security data. Resource-adaptation and security-adaptation solutions on sensors nodes are extremely important, particularly if they are used to monitor extreme areas where maintenance, such as replacing batteries or just checking the proper position of the device, is very difficult.
We implemented the ARSy Framework investigated in our previous study using Raspberry Pi 3 Model B and DS18B20 temperature sensor. The advantage of Raspberry Pi 3 Model B is that it has large CPU and memory capacities. With these advantages, are highly manageable of resources and allow integration of several types of sensors in one Raspberry Pi unit. The weakness of Raspberry Pi 3 Model B is sharing memory between a CPU and GPU; therefore, it was difficult for us to analyze in more detail the cost of memory during our testing, as shown in
Table 6, where memory consume during operation in normal and stress. It was difficult to distinguish the causes of memory fluctuations due to the CPU or GPU processes. Another weakness Raspberry Pi 3 Model B is it consumes a large amount of energy. In this case, using a battery as an energy source becomes an option because other alternatives use energy harvesting or the main power source based on the design requirements.
Sending all collected data to the server is not a solution. This will consume the limited resources. Selecting data collected by a sensor is done through data mining. The data-mining is done on-board, each datum is collected by the sensor directly, and selection is done with the data-mining algorithm at the board node. The final result is then sent to the data server.
For security, data in this research is collected by estimating security-level based on average resources availability in sensor node. The more average resource availability, the higher the security level that will be implemented in the output data. The discussion in this research has not yet implemented cryptography.
Radio communication is also one of the main resources of a sensor node and consumes the largest amount of resources. However, in this study implement the ARSy framework, we limited resource adaptation to the battery, CPU, and memory because the implementation and testing were on a single node.
6. Conclusions and Future Study
The limited battery, CPU, and memory resources of WSN devices force such devices to use resources as efficiently as possible. We evaluated a security adaptation for limited resources in a WSN through the ARSy framework. By mining data on-board and applying resource and security adaptation, the operation duration can be tripled. Normal testing showed that the result is more stable at the high and medium security levels. Therefore, maintaining resource stability can also stabilize the security level under the maximum average condition. The comparison of the ARSy framework and a non-ARSy framework showed significant results during operation time.
To conserve the battery of the sensor node, harvesting energy can be the best solution, depending on the area where the system is deployed. Because our testing was conducted on a single node, for the future work testing should be conducted on several nodes integrated with a network system involving energy harvesting as the power source and implement security level based on cryptography.
Author Contributions
All authors in this study have made substantial contributions, starting from research ideas, design models, device requirement and components used, then implementation and analysis. In particular, J.M.P. and A.K. supported each other in this research. A.K. fully supports the overall financial requirements of this research.
Acknowledgments
Jumadi Mabe Parenreng is supported by a special fund for the Doctoral Program, by Ministry of Research, Technology and Higher Education of the Republic of Indonesia, Guarantee Letter No. 985/E4.4/K/2015 and Akio Kitagawa is supported by JSPS KAKENHI Grant Number 17K18875, 15K12504, 15K13926 and CREST, Japan Science and Technology Agency.
Conflicts of Interest
The authors declare no conflict of interest.
References
- Rault, T.; Bouabdallah, A.; Challal, Y. Energy efficiency in wireless sensor networks: A top-down survey. Comput. Netw. 2014, 67, 104–122. [Google Scholar] [CrossRef]
- Batalla, J.; Vasilakos, A.; Gajewski, M. Secure Smart Homes: Opportunities and Challenges. ACM Comput. Surv. 2017, 50, 75. [Google Scholar] [CrossRef]
- Raghunathan, V.; Schurgers, C.; Park, S.; Srivastava, M.B. Energy-aware wireless microsensor networks. IEEE Signal Process. Mag. 2002, 19, 40–50. [Google Scholar] [CrossRef]
- Hill, J.L. System Architecture for Wireless Sensor Networks. Ph.D. Thesis, University of California, Berkeley, CA, USA, 2003; p. 186. [Google Scholar]
- Tubaishat, M. Sensor Networks: An Overview. IEEE Potentials 2003, 22, 20–23. [Google Scholar] [CrossRef]
- Chelli, K. Security issues in wireless sensor networks: Attacks and countermeasures. In Proceedings of the World Congress on Engineering, London, UK, 1–3 July 2015; Volume 1, pp. 1–3, ISBN 978-988-19253-4-3. [Google Scholar]
- Zou, Y.; Zhu, J.; Wang, X.; Hanzo, L. A survey on wireless security: Technical challenges, recent advances and future trends. Proc. IEEE 2015, 104, 1727–1765. [Google Scholar] [CrossRef]
- Batalla, J.M.; Mastorakis, G.; Mavromoustakis, C.; Żurek, J. On cohabitating networking technologies with common wireless access for Home Automation Systems purposes. IEEE Wirel. Commun. 2016, 23, 76–83. [Google Scholar] [CrossRef]
- Yang, D.; Xu, Y.; Gidlund, M. Wireless Coexistence between IEEE 802.11-and IEEE 802.15.4-Based Networks: A Survey. Int. J. Distrib. Sens. Netw. 2011, 7, 912152. [Google Scholar] [CrossRef]
- Gaber, M.M.; Yu, P.S. A framework for resource-aware knowledge discovery in data streams: A holistic approach with its application to clustering. In Proceedings of the 2006 ACM Symposium on Applied Computing, Dijon, France, 23–27 April 2006; pp. 649–656. [Google Scholar]
- Parenreng, J.M.; Syarif, M.I.; Djanali, S.; Shiddiqi, A.M. Performance analysis of resource-aware framework classification, clustering and frequent items in wireless sensor networks. In Proceedings of the 2011 International Conference on e-Education, Entertainment and e-Management (ICEEE), Bali, Indonesia, 27–29 December 2011; pp. 117–120. [Google Scholar]
- Phung, N.D.; Gaber, M.M.; Röhm, U. Resource-aware online data mining in wireless sensor networks. In Proceedings of the 2007 IEEE Symposium on Computational Intelligence and Data Mining (CIDM), Honolulu, HI, USA, 1 March–5 April 2007; pp. 139–146. [Google Scholar]
- Uwe, R.; Tse, Q. Enabling resource-awareness for in-network data processing in wireless sensor networks. In Proceedings of the Nineteenth Conference on Australasian Database, Gold Coast, Australia, 3–4 December 2007; Volume 75, pp. 107–114. [Google Scholar]
- Ksiezopolski, B.; Szalachowski, P.; Kotulski, Z. SPOT : Optimization Tool for Network; Springer: Berlin/Heidelberg, Germany, 2010; pp. 269–279. [Google Scholar]
- Xie, T.; Qin, X.; Sung, A. SAREC: A security-aware scheduling strategy for real-time applications on clusters. In Proceedings of the 2005 International Conference on Parallel Processing (ICPP), Oslo, Norway, 14–17 June 2005; Volume 2005, pp. 5–12. [Google Scholar]
- Son, S.H.; Zimmerman, R.; Hansson, J. An adaptable security manager for real-time transactions. In Proceedings of the 12th Euromicro Conference on Real-Time Systems, Stockholm, Sweden, 19–21 June 2000; pp. 63–70. [Google Scholar]
- Ksiezopolski, B.; Kotulski, Z. Adaptable security mechanism for dynamic environments. Comput. Secur. 2007, 26, 246–255. [Google Scholar] [CrossRef]
- Rashvand, H.F.; Abedi, A. Wireless Sensor Systems for Extreme Environments Space, Underwater, Underground, and Industrial; JohnWiley & Sons: Hoboken, NJ, USA, 2017; pp. 1–19. ISBN 978-1-119-12646-1. [Google Scholar]
- Akyildiz, I.F.; Su, W.; Sankarasubramaniam, Y.; Cayirci, E. Wireless sensor networks: A survey. Comput. Netw. 2002, 38, 393–422. [Google Scholar] [CrossRef]
- Parenreng, J.M.; Kitagawa, A. A model of security adaptation for limited resources in wireless sensor network. J. Comput. Commun. 2017, 5, 10–23. [Google Scholar] [CrossRef][Green Version]
- Aggarwal, C.C. Data Streams: Models and Algorithms; Kluwer Academic Publishers: Boston, MA, USA; Dordrecht, The Netherlands; London, UK, 2006; p. 365. ISBN 9780387475349. [Google Scholar]
- Parenreng, J.M.; Djanali, S.; Shiddiqi, A.M. Analisa kinerja resource-aware framework pada algoritma light-weight frequent item (LWF). In Proceedings of the Seminar Nasional Pascasarjana X—ITS, Surabaya, Indonesia, 4 August 2010. [Google Scholar]
- Mahmood, A.; Shi, K.; Khatoon, S.; Xiao, M. Data Mining Techniques for Wireless Sensor Networks: A Survey. Int. J. Distrib. Sens. Netw. 2013, 9, 406316. [Google Scholar] [CrossRef]
- Aggarwal, C.C.; Wang, J. Chapter 2 on clustering massive data streams: A summarization paradigm. Data Streams 2007, 31, 9–38. [Google Scholar] [CrossRef]
- Gaber, M.M.; Zaslavsky, A.; Krishnaswamy, S. A survey of classification methods in data streams. Challenges 2007, 31, 39–59. [Google Scholar] [CrossRef]
- Jin, R.; Agrawal, G. Frequent Pattern Mining in Data Streams. Data Streams 2007, 31, 61–84. [Google Scholar] [CrossRef]
- Kargupta, H.; Bhargava, R.; Liu, K.; Powers, M.; Blair, P.; Bushra, S.; Dull, J.; Sarkar, K.; Klein, M.; Vasa, M.; et al. VEDAS: A mobile and distributed data stream mining system for real-time vehicle monitoring. In Proceedings of the 2004 SIAM International Conference on Data Mining, Lake Buena Vista, FL, USA, 22–24 April 2004; Volume 23, pp. 300–311. [Google Scholar]
- Tanner, S.; Alshayeb, M.; Criswell, E. EVE: On-board process planning and execution. Earth Sci. 2002, 39. [Google Scholar] [CrossRef]
- Burl, M.C.; Fowlkes, C.; Roden, J.; Stechert, A.; Mukhtar, S. Diamond Eye: A Distributed Architecture for Image Data Mining; International Society for Optical Engineering: Bellingham, WA, USA, 1999; Volume 3695. [Google Scholar]
- Caviglione, L.; Merlo, A. The energy impact of security mechanisms in modern mobile devices. Netw. Secur. 2012, 2012, 11–14. [Google Scholar] [CrossRef]
- Ksiezopolski, B.; Kotulski, Z.; Szalachowski, P. Adaptive Approach to Network Security. In International Conference on Computer Networks; Springer: Berlin/Heidelberg, Germany, 2009; pp. 233–241. ISBN 978-3-642-02671-3. [Google Scholar]
- Caviglione, L.; Merlo, A.; Migliardi, M. What is Green Security? In Proceedings of the 7th International Conference on Information Assurance and Security (IAS 2011), Malacca, Malaysia, 5–8 December 2011. [Google Scholar]
- Potlapally, N.R.; Ravi, S.; Raghunathan, A.; Jha, N.K. A study of the energy consumption characteristics of cryptographic algorithms and security protocols. IEEE Trans. Mob. Comput. 2006, 5, 128–143. [Google Scholar] [CrossRef]
- Sen, J. A survey on wireless sensor network security. Comput. Netw. 2009, 1, 55–78. [Google Scholar] [CrossRef]
- Monk, S. Raspberry Pi Cookbook; O’Reilly Media, Inc.: Sebastopol, CA, USA, 2016; ISBN 1118464478. [Google Scholar]
- Maxim Integrated. Datasheet DS18B20. Maxim Integr. 2015, 92, 20. [Google Scholar]
- McManus, S.; Cook, M. Raspberry Pi® For Dummies®, 3rd ed.; John Wiley & Sons, Inc.: Hoboken, NJ, USA, 2017; ISBN 9781119412007. [Google Scholar]
- Gaber, M.M.; Krishnaswamy, S.; Zaslavsky, A. Adaptive Mining Techniques for Data Streams Using Algorithm Output Granularity; AusDM: Caulfield East, Australia, 2003. [Google Scholar]
- Power. Available online: https://www.raspberrypi.org/help/faqs/#topPower (accessed on 21 February 2018).
© 2018 by the authors. Licensee MDPI, Basel, Switzerland. This article is an open access article distributed under the terms and conditions of the Creative Commons Attribution (CC BY) license (http://creativecommons.org/licenses/by/4.0/).


