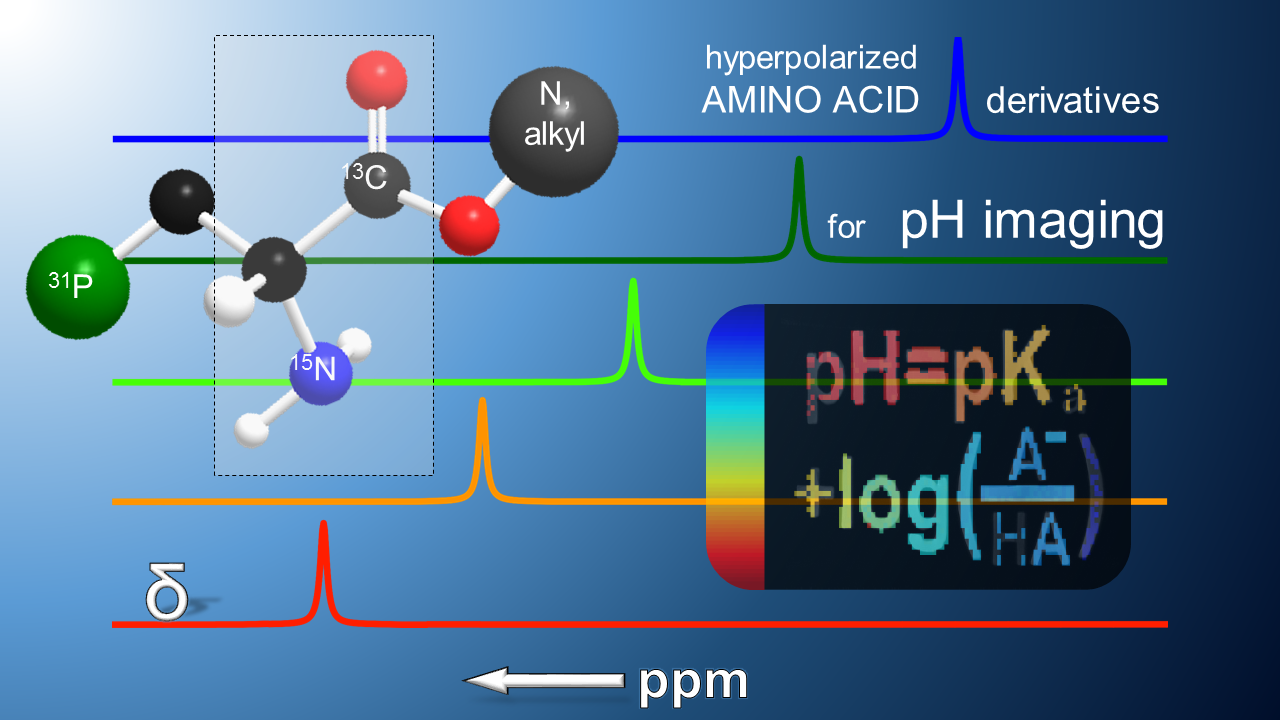
Hyperpolarized Amino Acid Derivatives as Multivalent Magnetic Resonance pH Sensor Molecules

 , ,
, ,
Abstract
:
1. Introduction
2. Materials and Methods
2.1. Chemicals
2.2. Synthesis of 15N-Labelled 2,3-Diamino Propionic Acid (DAP)
2.3. Synthesis of Serine Ethyl and Propyl Ester
2.4. NMR Measurements
2.5. Analysis of NMR Titration Curves
2.6. WST-1 Cytotoxicity Tests
2.7. 13C-Hyperpolarization and T1 Measurements
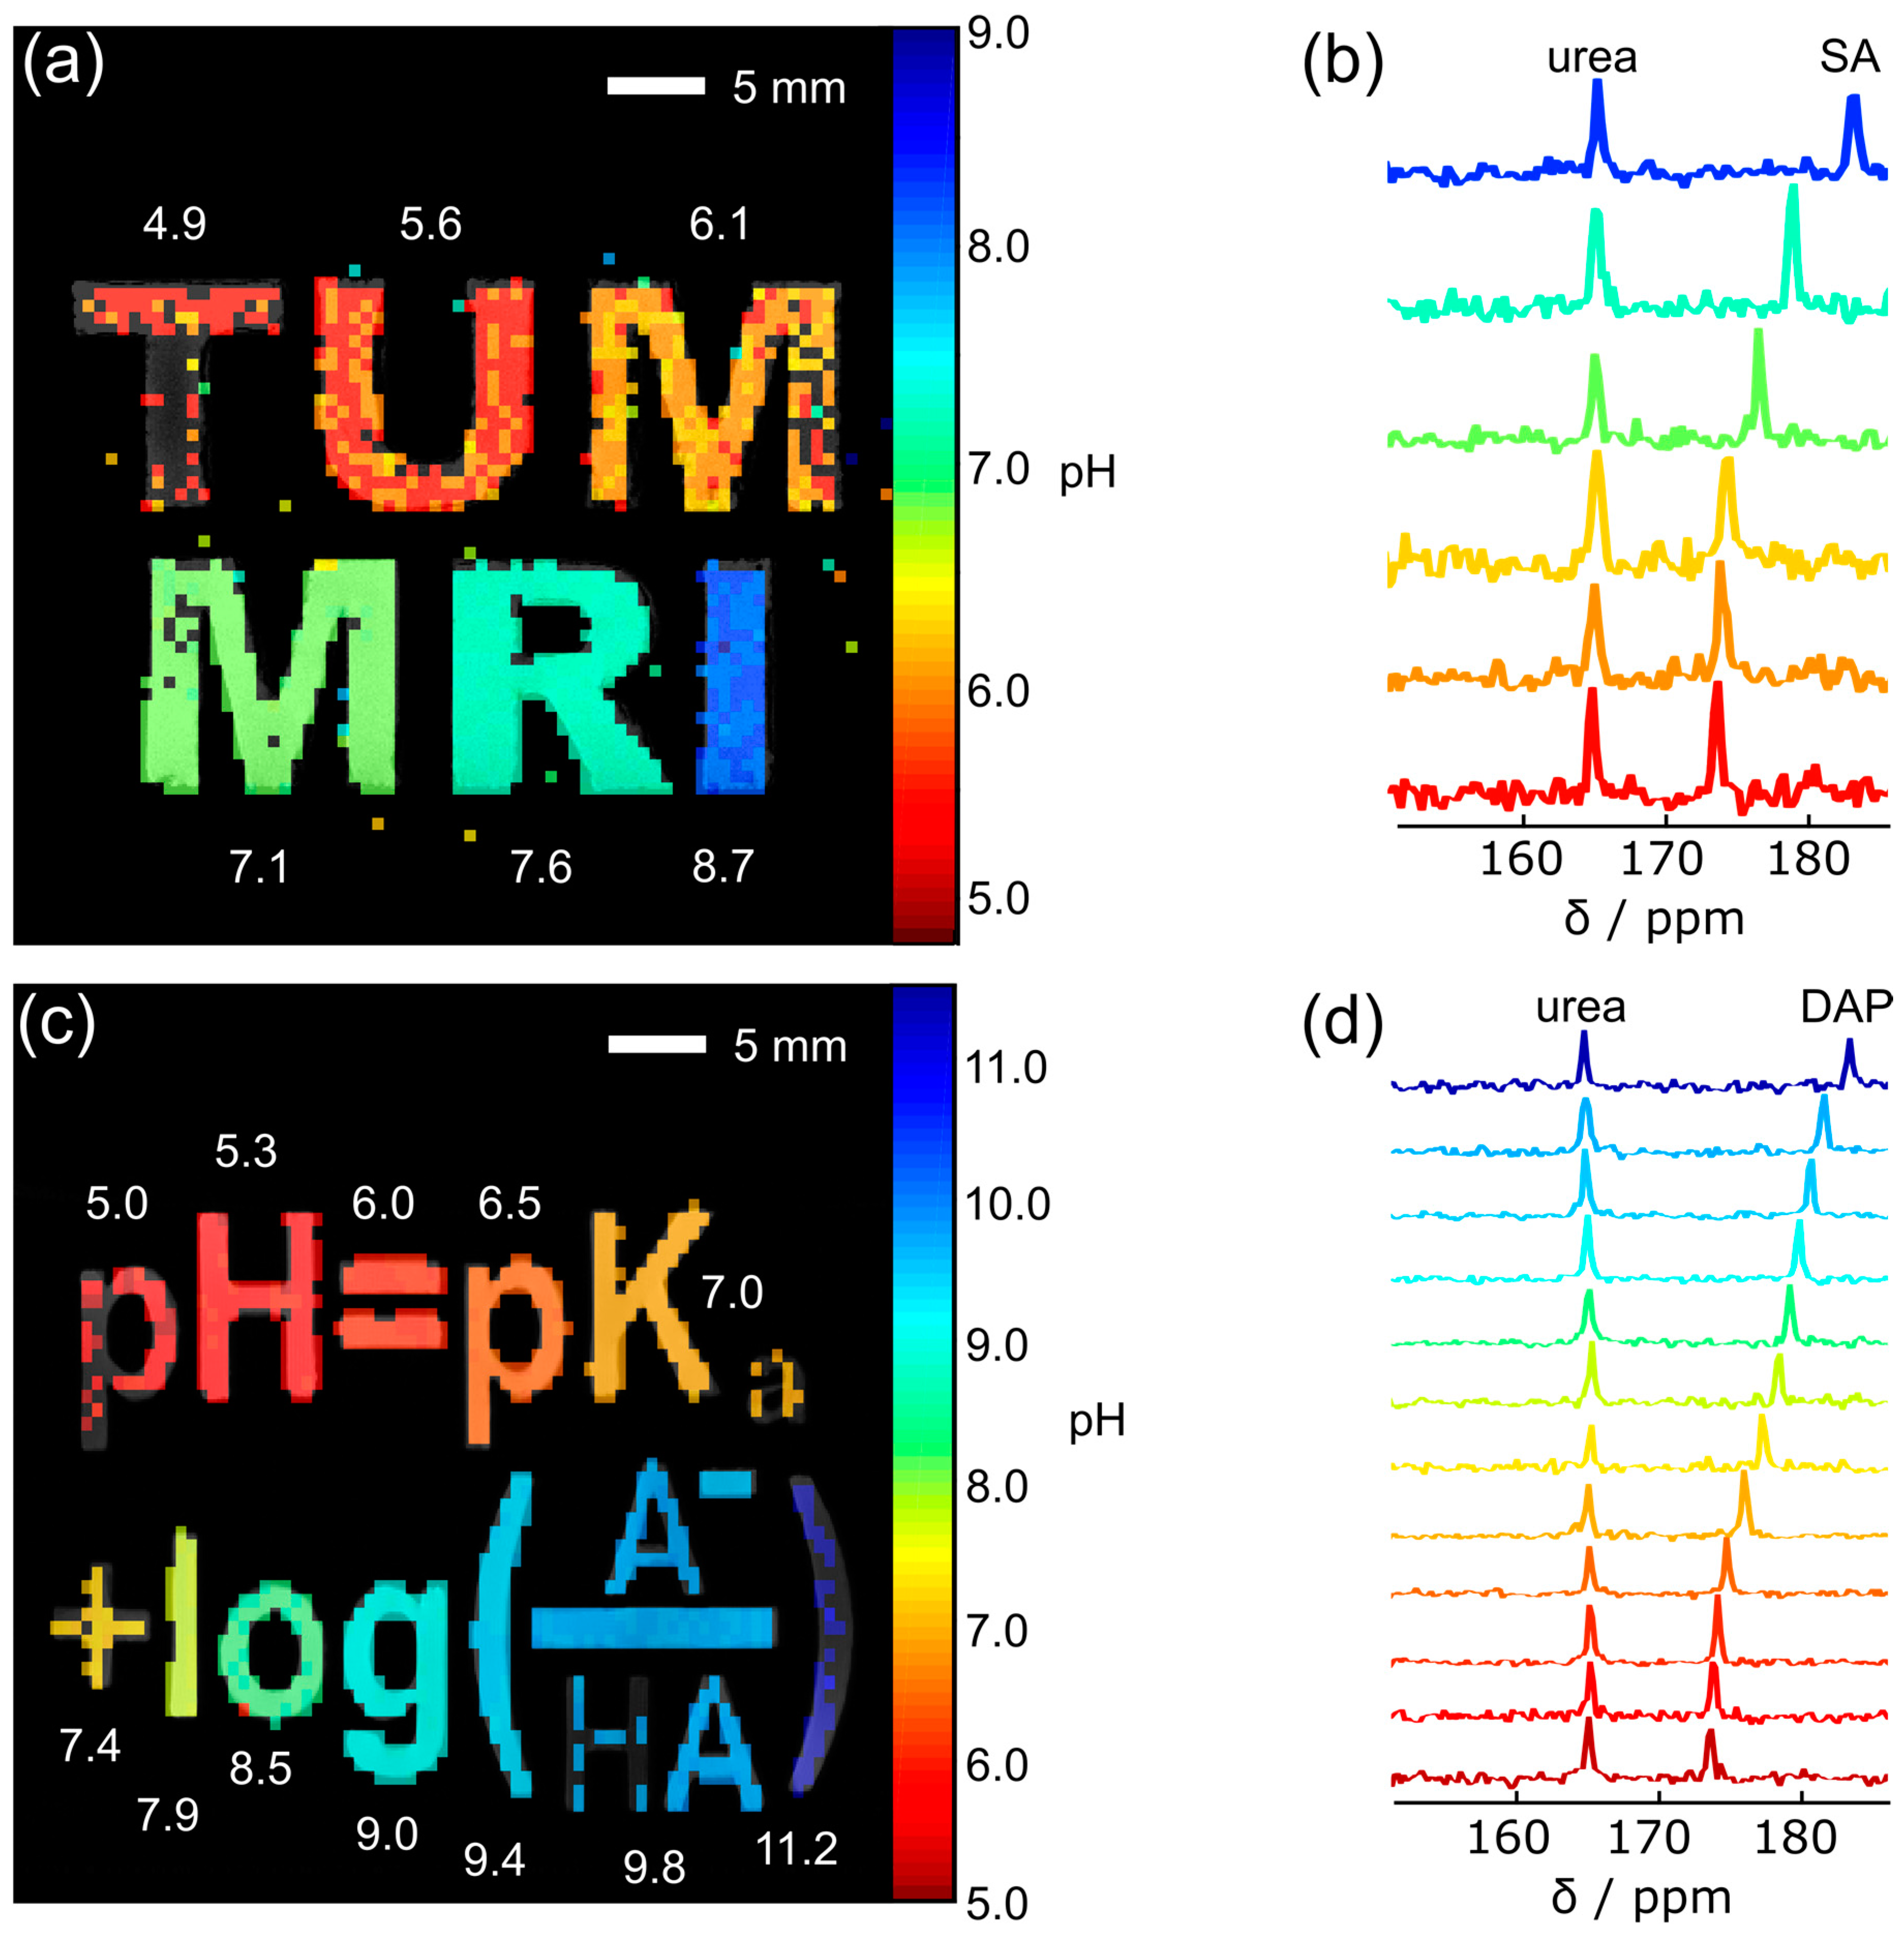
2.8. Thermal Phantom Imaging and Back-Calculation of pH Maps
3. Results
4. Discussion
5. Conclusions
Supplementary Materials
Acknowledgments
Author Contributions
Conflicts of Interest
References
- Gillies, R.J.; Raghunand, N.; Garcia-Martin, M.L.; Gatenby, R.A. pH Imaging. A Review of pH Measurement Methods and Applications in Cancers. IEEE Eng. Med. Biol. Mag. 2004, 23, 57–64. [Google Scholar] [CrossRef] [PubMed]
- Adrogue, H.J.; Madias, N.E. Management of Life-Threatening Acid-Base Disorders. First of Two Parts. N. Eng. J. Med. 1998, 338, 26–34. [Google Scholar] [CrossRef] [PubMed]
- Gallagher, F.A.; Kettunen, M.I.; Day, S.E.; Hu, D.E.; Ardenkjaer-Larsen, J.H.; Zandt, R.; Jensen, P.R.; Karlsson, M.; Golman, K.; Lerche, M.H.; et al. Magnetic Resonance Imaging of pH In Vivo Using Hyperpolarized 13C-Labelled Bicarbonate. Nature 2008, 453, 940–943. [Google Scholar] [CrossRef] [PubMed]
- Gillies, R.J.; Raghunand, N.; Karczmar, G.S.; Bhujwalla, Z.M. MRI of the Tumor Microenvironment. J. Magn. Reson. Imaging 2002, 16, 430–450. [Google Scholar] [CrossRef] [PubMed]
- Tannock, I.F.; Rotin, D. Acid pH in Tumors and its Potential for Therapeutic Exploitation. Cancer Res. 1989, 49, 4373–4384. [Google Scholar] [PubMed]
- Wike-Hooley, J.L.; Haveman, J.; Reinhold, H.S. The Relevance of Tumour pH to the Treatment of Malignant Disease. Radiother. Oncol. 1984, 2, 343–366. [Google Scholar] [CrossRef]
- Raghunand, N.; Mahoney, B.; van Sluis, R.; Baggett, B.; Gillies, R.J. Acute Metabolic Alkalosis Enhances Response of C3H Mouse Mammary Tumors to the Weak Base Mitoxantrone. Neoplasia 2001, 3, 227–235. [Google Scholar] [CrossRef] [PubMed]
- Collins, F.S.; Varmus, H. A New Initiative on Precision Medicine. N. Eng. J. Med. 2015, 372, 793–795. [Google Scholar] [CrossRef] [PubMed]
- Friedman, A.A.; Letai, A.; Fisher, D.E.; Flaherty, K.T. Precision Medicine for Cancer with Next-Generation Functional Diagnostics. Nat. Rev. Cancer 2015, 15, 747–756. [Google Scholar] [CrossRef] [PubMed]
- Wu, Y.; Zhang, W.; Li, J.; Zhang, Y. Optical Imaging of Tumor Microenvironment. Am. J. Nucl. Med. Mol. Imaging 2013, 3, 1–15. [Google Scholar] [PubMed]
- Pavuluri, K.; McMahon, M.T. pH Imaging Using Chemical Exchange Saturation Transfer (CEST) MRI. Isr. J. Chem. 2017, 57, 862–879. [Google Scholar] [CrossRef]
- Hundshammer, C.; Düwel, S.; Schilling, F. Imaging of Extracellular pH Using Hyperpolarized Molecules. Isr. J. Chem. 2017, 57, 788–799. [Google Scholar] [CrossRef]
- Hunjan, S.; Mason, R.P.; Mehta, V.D.; Kulkarni, P.V.; Aravind, S.; Arora, V.; Antich, P.P. Simultaneous Intracellular and Extracelular pH Measurement in the Heart by 19F NMR of 6-Fluoropyridoxol. Magn. Reson. Med. 1998, 39, 551–556. [Google Scholar] [CrossRef] [PubMed]
- Gillies, R.J.; Liu, Z.; Bhujwalla, Z. 31P-MRS Measurements of Extracellular pH of Tumors Using 3-Aminopropylphosphoppnate. Am. J. Physiol. Cell Physiol. 1994, 267, C195–C203. [Google Scholar] [CrossRef] [PubMed]
- Garcia-Martin, M.L.; Herigault, G.; Remy, C.; Farion, R.; Ballesteros, P.; Coles, J.A.; Cerdan, S.; Ziegler, A. Mapping Extracellular pH in Rat Brain Gliomas In Vivo by 1H Magnetic Resonance Spectroscopic Imaging: Comparison with Maps of Metabolites. Cancer Res. 2001, 61, 6524–6531. [Google Scholar] [PubMed]
- Van Sluis, R.; Bhujwalla, Z.M.; Raghunand, N.; Ballesteros, P.; Alvarez, J.; Cerdan, S.; Galons, J.P.; Gillies, R.J. In Vivo Imaging of Extracellular pH Using 1H MRSI. Magn. Reson. Med. 1999, 41, 743–750. [Google Scholar] [CrossRef]
- Provent, P.; Benito, M.; Hiba, B.; Farion, R.; Lopez-Larrubia, P.; Ballesteros, P.; Remy, C.; Segebarth, C.; Cerdan, S.; Coles, J.A.; et al. Serial In Vivo Spectroscopic Nuclear Magnetic Resonance Imaging of Lactate and Extracellular pH in Rat Gliomas Shows Redistribution of Protons Away from Sites of Glycolysis. Cancer Res. 2007, 67, 7638–7645. [Google Scholar] [CrossRef] [PubMed]
- Vermathen, P.; Capizzano, A.A.; Maudsley, A.A. Administration and 1H MRS Detection of Histidine in Human Brain: Application to In Vivo pH Measurement. Magn. Reson. Med. 2000, 43, 665–675. [Google Scholar] [CrossRef]
- Appelt, S.; Baranga, A.B.-A.; Erickson, C.J.; Romalis, M.V.; Young, A.R.; Happer, W. Theory of Spin-Exchange Optical Pumping of 3He and 129Xe. Phys. Rev. A 1998, 58, 1412–1439. [Google Scholar] [CrossRef]
- Adams, R.W.; Aguilar, J.A.; Atkinson, K.D.; Cowley, M.J.; Elliott, P.I.P.; Duckett, S.B.; Green, G.G.R.; Khazal, I.G.; López-Serrano, J.; Williamson, D.C. Reversible Interactions with Para-Hydrogen Enhance NMR Sensitivity by Polarization Transfer. Science 2009, 323, 1708–1711. [Google Scholar] [CrossRef] [PubMed] [Green Version]
- Eisenschmid, T.C.; Kirss, R.U.; Deutsch, P.P.; Hommeltoft, S.I.; Eisenberg, R.; Bargon, J.; Lawler, R.G.; Balch, A.L. Para-Hydrogen Induced Polarization in Hydrogenation Reactions. J. Am. Chem. Soc. 1987, 109, 8089–8091. [Google Scholar] [CrossRef]
- Kirss, R.U.; Eisenschmid, T.C.; Eisenberg, R. Para-Hydrogen Induced Polarization in Hydrogenation Reactions Catalyzed by Ruthenium Phosphine Complexes. J. Am. Chem. Soc. 1988, 110, 8564–8566. [Google Scholar] [CrossRef]
- Ardenkjaer-Larsen, J.H.; Fridlund, B.; Gram, A.; Hansson, G.; Hansson, L.; Lerche, M.H.; Servin, R.; Thaning, M.; Golman, K. Increase in Signal-to-Noise Ratio of > 10,000 Times in Liquid-State NMR. Proc. Natl. Acad. Sci. USA 2003, 100, 10158–10163. [Google Scholar] [CrossRef] [PubMed]
- Flavell, R.R.; von Morze, C.; Blecha, J.E.; Korenchan, D.E.; Van Criekinge, M.; Sriram, R.; Gordon, J.W.; Chen, H.Y.; Subramaniam, S.; Bok, R.A.; et al. Application of Good’s Buffers to pH Imaging Using Hyperpolarized 13C MRI. Chem. Commun. 2015, 51, 14119–14122. [Google Scholar] [CrossRef] [PubMed]
- Korenchan, D.E.; Taglang, C.; Von Morze, C.; Blecha, J.E.; Gordon, J.; Sriram, R.; Larson, P.E.Z.; Vigneron, D.; VanBrocklin, H.; Kurhanewicz, J.; et al. Dicarboxylic Acids as pH Sensors for Hyperpolarized 13C Magnetic Resonance Spectroscopic Imaging. Analyst 2017, 142, 1429–1433. [Google Scholar] [CrossRef] [PubMed]
- Korenchan, D.; Flavell, R.; Baligand, C.; Sriram, R.; Neumann, K.; Sukumar, S.; VanBrocklin, H.; Vigneron, D.; Wilson, D.; Kurhanewicz, J. Dynamic Nuclear Polarization of Biocompatible 13C-Enriched Carbonates for In Vivo pH Imaging. Chem. Commun. 2016, 52, 3030–3033. [Google Scholar] [CrossRef] [PubMed]
- Jiang, W.; Lumata, L.; Chen, W.; Zhang, S.; Kovacs, Z.; Sherry, A.D.; Khemtong, C. Hyperpolarized 15N-Pyridine Derivatives as pH-Sensitive MRI Agents. Sci. Rep. 2015, 5, 9104. [Google Scholar] [CrossRef] [PubMed]
- Shchepin, R.V.; Barskiy, D.A.; Coffey, A.M.; Theis, T.; Shi, F.; Warren, W.S.; Goodson, B.M.; Chekmenev, E.Y. 15N Hyperpolarization of Imidazole-15N2 for Magnetic Resonance pH Sensing via SABRE-SHEATH. ACS Sens. 2016, 1, 640–644. [Google Scholar] [CrossRef] [PubMed]
- Nardi-Schreiber, A.; Gamliel, A.; Harris, T.; Sapir, G.; Sosna, J.; Gomori, J.M.; Katz-Brull, R. Biochemical Phosphates Observed Using Hyperpolarized 31P in Physiological Aqueous Solutions. Nat. Commun. 2017, 8, 341. [Google Scholar] [CrossRef] [PubMed]
- Jindal, A.K.; Merritt, M.E.; Suh, E.H.; Malloy, C.R.; Sherry, A.D.; Kovács, Z. Hyperpolarized 89Y Complexes as pH Sensitive NMR Probes. J. Am. Chem. Soc. 2010, 132, 1784–1785. [Google Scholar] [CrossRef] [PubMed]
- Berthault, P.; Desvaux, H.; Wendlinger, T.; Gyejacquot, M.; Stopin, A.; Brotin, T.; Dutasta, J.-P.; Boulard, Y. Effect of pH and Counterions on the Encapsulation Properties of Xenon in Water-Soluble Cryptophanes. Chem. Eur. J. 2010, 16, 12941–12946. [Google Scholar] [CrossRef] [PubMed]
- Riggle, B.A.; Wang, Y.; Dmochowski, I.J. A “Smart” 129Xe NMR Biosensor for pH-Dependent Cell Labeling. J. Am. Chem. Soc. 2015, 137, 5542–5548. [Google Scholar] [CrossRef] [PubMed]
- Keshari, K.R.; Wilson, D.M. Chemistry and Biochemistry of 13C Hyperpolarized Magnetic Resonance Using Dynamic Nuclear Polarization. Chem. Soc. Rev. 2014, 43, 1627–1659. [Google Scholar] [CrossRef] [PubMed]
- Rao, S.L.N. Chemical Synthesis of Nβ-oxalyl-l-α,β-diaminopropionic Acid and Optical Specificity in its Neurotoxic Action. Biochemistry 1975, 14, 5218–5221. [Google Scholar] [CrossRef] [PubMed]
- Bastiaans, H.M.M.; van der Baan, J.L.; Ottenheijm, H.C.J. Flexible and Convergent Total Synthesis of Cyclotheonamide B. J. Org. Chem. 1997, 62, 3880–3889. [Google Scholar] [CrossRef]
- Tredwell, G.D.; Bundy, J.G.; De Iorio, M.; Ebbels, T.M.D. Modelling the Acid/Base 1H NMR Chemical Shift Limits of Metabolites in Human Urine. Metabolomics 2016, 12, 152. [Google Scholar] [CrossRef] [PubMed]
- Jensen, P.R.; Karlsson, M.; Meier, S.; Duus, J.Ø.; Lerche, M.H. Hyperpolarized Amino Acids for In Vivo Assays of Transaminase Activity. Chem. Eur. J. 2009, 15, 10010–10012. [Google Scholar] [CrossRef] [PubMed]
- Gloggler, S.; Muller, R.; Colell, J.; Emondts, M.; Dabrowski, M.; Blumich, B.; Appelt, S. Para-Hydrogen Induced Polarization of Amino Acids, Peptides and Deuterium-Hydrogen Gas. Phys. Chem. Chem. Phys. 2011, 13, 13759–13764. [Google Scholar] [CrossRef] [PubMed]
- Gloggler, S.; Wagner, S.; Bouchard, L.S. Hyperpolarization of Amino Acid Derivatives in Water for Biological Applications. Chem. Sci. 2015, 6, 4261–4266. [Google Scholar] [CrossRef] [PubMed]
- Düwel, S.; Hundshammer, C.; Gersch, M.; Feuerecker, B.; Steiger, K.; Buck, A.; Walch, A.; Haase, A.; Glaser, S.J.; Schwaiger, M.; Schilling, F. Imaging of pH In Vivo Using Hyperpolarized 13C-Labelled Zymonic Acid. Nat. Commun. 2017, 8, 15126. [Google Scholar] [CrossRef] [PubMed]
- Reineri, F.; Boi, T.; Aime, S. Para-Hydrogen Induced Polarization of 13C Carboxylate Resonance in Acetate and Pyruvate. Nat. Commun. 2015, 6, 5858. [Google Scholar] [CrossRef] [PubMed]
- Hundshammer, C.; Düwel, S.; Kocher, S.; Gersch, M.; Feuerecker, B.; Scheurer, C.; Haase, A.; Glaser, S.J.; Schwaiger, M.; Schilling, F. Deuteration of Hyperpolarized 13C-Labelled Zymonic Acid Enables Sensitivity-Enhanced Dynamic MRI of pH. Chemphyschem 2017, 18, 2422–2425. [Google Scholar] [CrossRef] [PubMed]
- Miéville, P.; Ahuja, P.; Sarkar, R.; Jannin, S.; Vasos, P.R.; Gerber-Lemaire, S.; Mishkovsky, M.; Comment, A.; Gruetter, R.; Ouari, O.; et al. Scavenging Free Radicals to Preserve Enhancement and Extend Relaxation Times in NMR using Dynamic Nuclear Polarization. Angew. Chem. Int. Ed. 2010, 49, 6182–6185. [Google Scholar] [CrossRef] [PubMed]
- Chiavazza, E.; Kubala, E.; Gringeri, C.V.; Düwel, S.; Durst, M.; Schulte, R.F.; Menzel, M.I. Earth’s Magnetic Field Enabled Scalar Coupling Relaxation of 13C Nuclei Bound to Fast-Relaxing Quadrupolar 14N in Amide Groups. J. Magn. Reson. 2013, 227, 35–38. [Google Scholar] [CrossRef] [PubMed]
- Milani, J.; Vuichoud, B.; Bornet, A.; Miéville, P.; Mottier, R.; Jannin, S.; Bodenhausen, G. A magnetic tunnel to shelter hyperpolarized fluids. Rev. Sci. Instrum. 2015, 86, 024101. [Google Scholar] [CrossRef] [PubMed]
- Shang, H.; Skloss, T.; von Morze, C.; Carvajal, L.; Criekinge, M.V.; Milshteyn, E.; Larson, P.E.Z.; Hurd, R.E.; Vigneron, D.B. Hand-held Electromagnet Carrier for Transfer of Hyperpolarized Carbon-13 Samples. Magn. Res. Med. 2016, 75, 917–922. [Google Scholar] [CrossRef] [PubMed]
- Chattergoon, N.; Martínez-Santiesteban, F.; Handler, W.B.; Ardenkjær-Larsen, J.H.; Scholl, T.J. Field Dependence of T1 for Hyperpolarized [1-13C]pyruvate. Contrast Media Mol. Imaging 2013, 8, 57–62. [Google Scholar] [CrossRef] [PubMed]
- Gajan, D.; Schwarzwälder, M.; Conley, M.P.; Grüning, W.R.; Rossini, A.J.; Zagdoun, A.; Lelli, M.; Yulikov, M.; Jeschke, G.; Sauvée, C.; et al. Solid-Phase Polarization Matrixes for Dynamic Nuclear Polarization from Homogeneously Distributed Radicals in Mesostructured Hybrid Silica Materials. J. Am. Chem. Soc. 2013, 135, 15459–15466. [Google Scholar] [CrossRef] [PubMed]
- Munoz-Gomez, J.L.; Monteagudo, E.; Lloveras, V.; Parella, T.; Veciana, J.; Vidal-Gancedo, J. A Benzyl Alcohol Derivative of the BDPA Radical for Fast Dissolution Dynamic Nuclear Polarization NMR Spectroscopy. Org. Biomol. Chem. 2015, 13, 2689–2693. [Google Scholar] [CrossRef] [PubMed]
- Gajan, D.; Bornet, A.; Vuichoud, B.; Milani, J.; Melzi, R.; van Kalkeren, H.A.; Veyre, L.; Thieuleux, C.; Conley, M.P.; Grüning, W.R.; et al. Hybrid Polarizing Solids for Pure Hyperpolarized Liquids Through Dissolution Dynamic Nuclear Polarization. Proc. Natl. Acad. Sci. USA 2014, 111, 14693–14697. [Google Scholar] [CrossRef] [PubMed]
- McCarney, E.R.; Han, S. Spin-Labeled Gel for the Production of Radical-Free Dynamic Nuclear Polarization Enhanced Molecules for NMR Spectroscopy and Imaging. J. Magn. Reson. 2008, 190, 307–315. [Google Scholar] [CrossRef] [PubMed]
- Harris, T.; Bretschneider, C.; Frydman, L. Dissolution DNP NMR with Solvent Mixtures: Substrate Concentration and Radical Extraction. J. Magn. Reson. 2011, 211, 96–100. [Google Scholar] [CrossRef] [PubMed]
- Eichhorn, T.R.; Takado, Y.; Salameh, N.; Capozzi, A.; Cheng, T.; Hyacinthe, J.-N.; Mishkovsky, M.; Roussel, C.; Comment, A. Hyperpolarization Without Persistent Radicals for In Vivo Real-Time Metabolic Imaging. Proc. Natl. Acad. Sci. USA 2013, 110, 18064–18069. [Google Scholar] [CrossRef] [PubMed]
- Carravetta, M.; Levitt, M.H. Theory of Long-Lived Nuclear Spin States in Solution Nuclear Magnetic Resonance. I. Singlet States in Low Magnetic Field. J. Chem. Phys. 2005, 122, 214505. [Google Scholar] [CrossRef] [PubMed]
- Chaumeil, M.M.; Najac, C.; Ronen, S.M. Studies of Metabolism Using 13C MRS of Hyperpolarized Probes. Methods Enzymol. 2015, 561, 1–71. [Google Scholar] [PubMed]
- Carravetta, M.; Levitt, M.H. Long-Lived Nuclear Spin States in High-Field Solution NMR. J. Am. Chem. Soc. 2004, 126, 6228–6229. [Google Scholar] [CrossRef] [PubMed]

| Compound | c (OX063)/mM | c (Dota)/mM | Solvent | cfinal/M | ν/GHz |
|---|---|---|---|---|---|
| SA | 24 | 3 | 60% 10 M NaOH, 40% H2O | 6 | 94.165 |
| DAP | 26 | 7 | 90% 10 M NaOH, 10% glyc | 7 | 94.155 |
| PA | 16 | 1 | self-glassing | 14 | 94.172 |
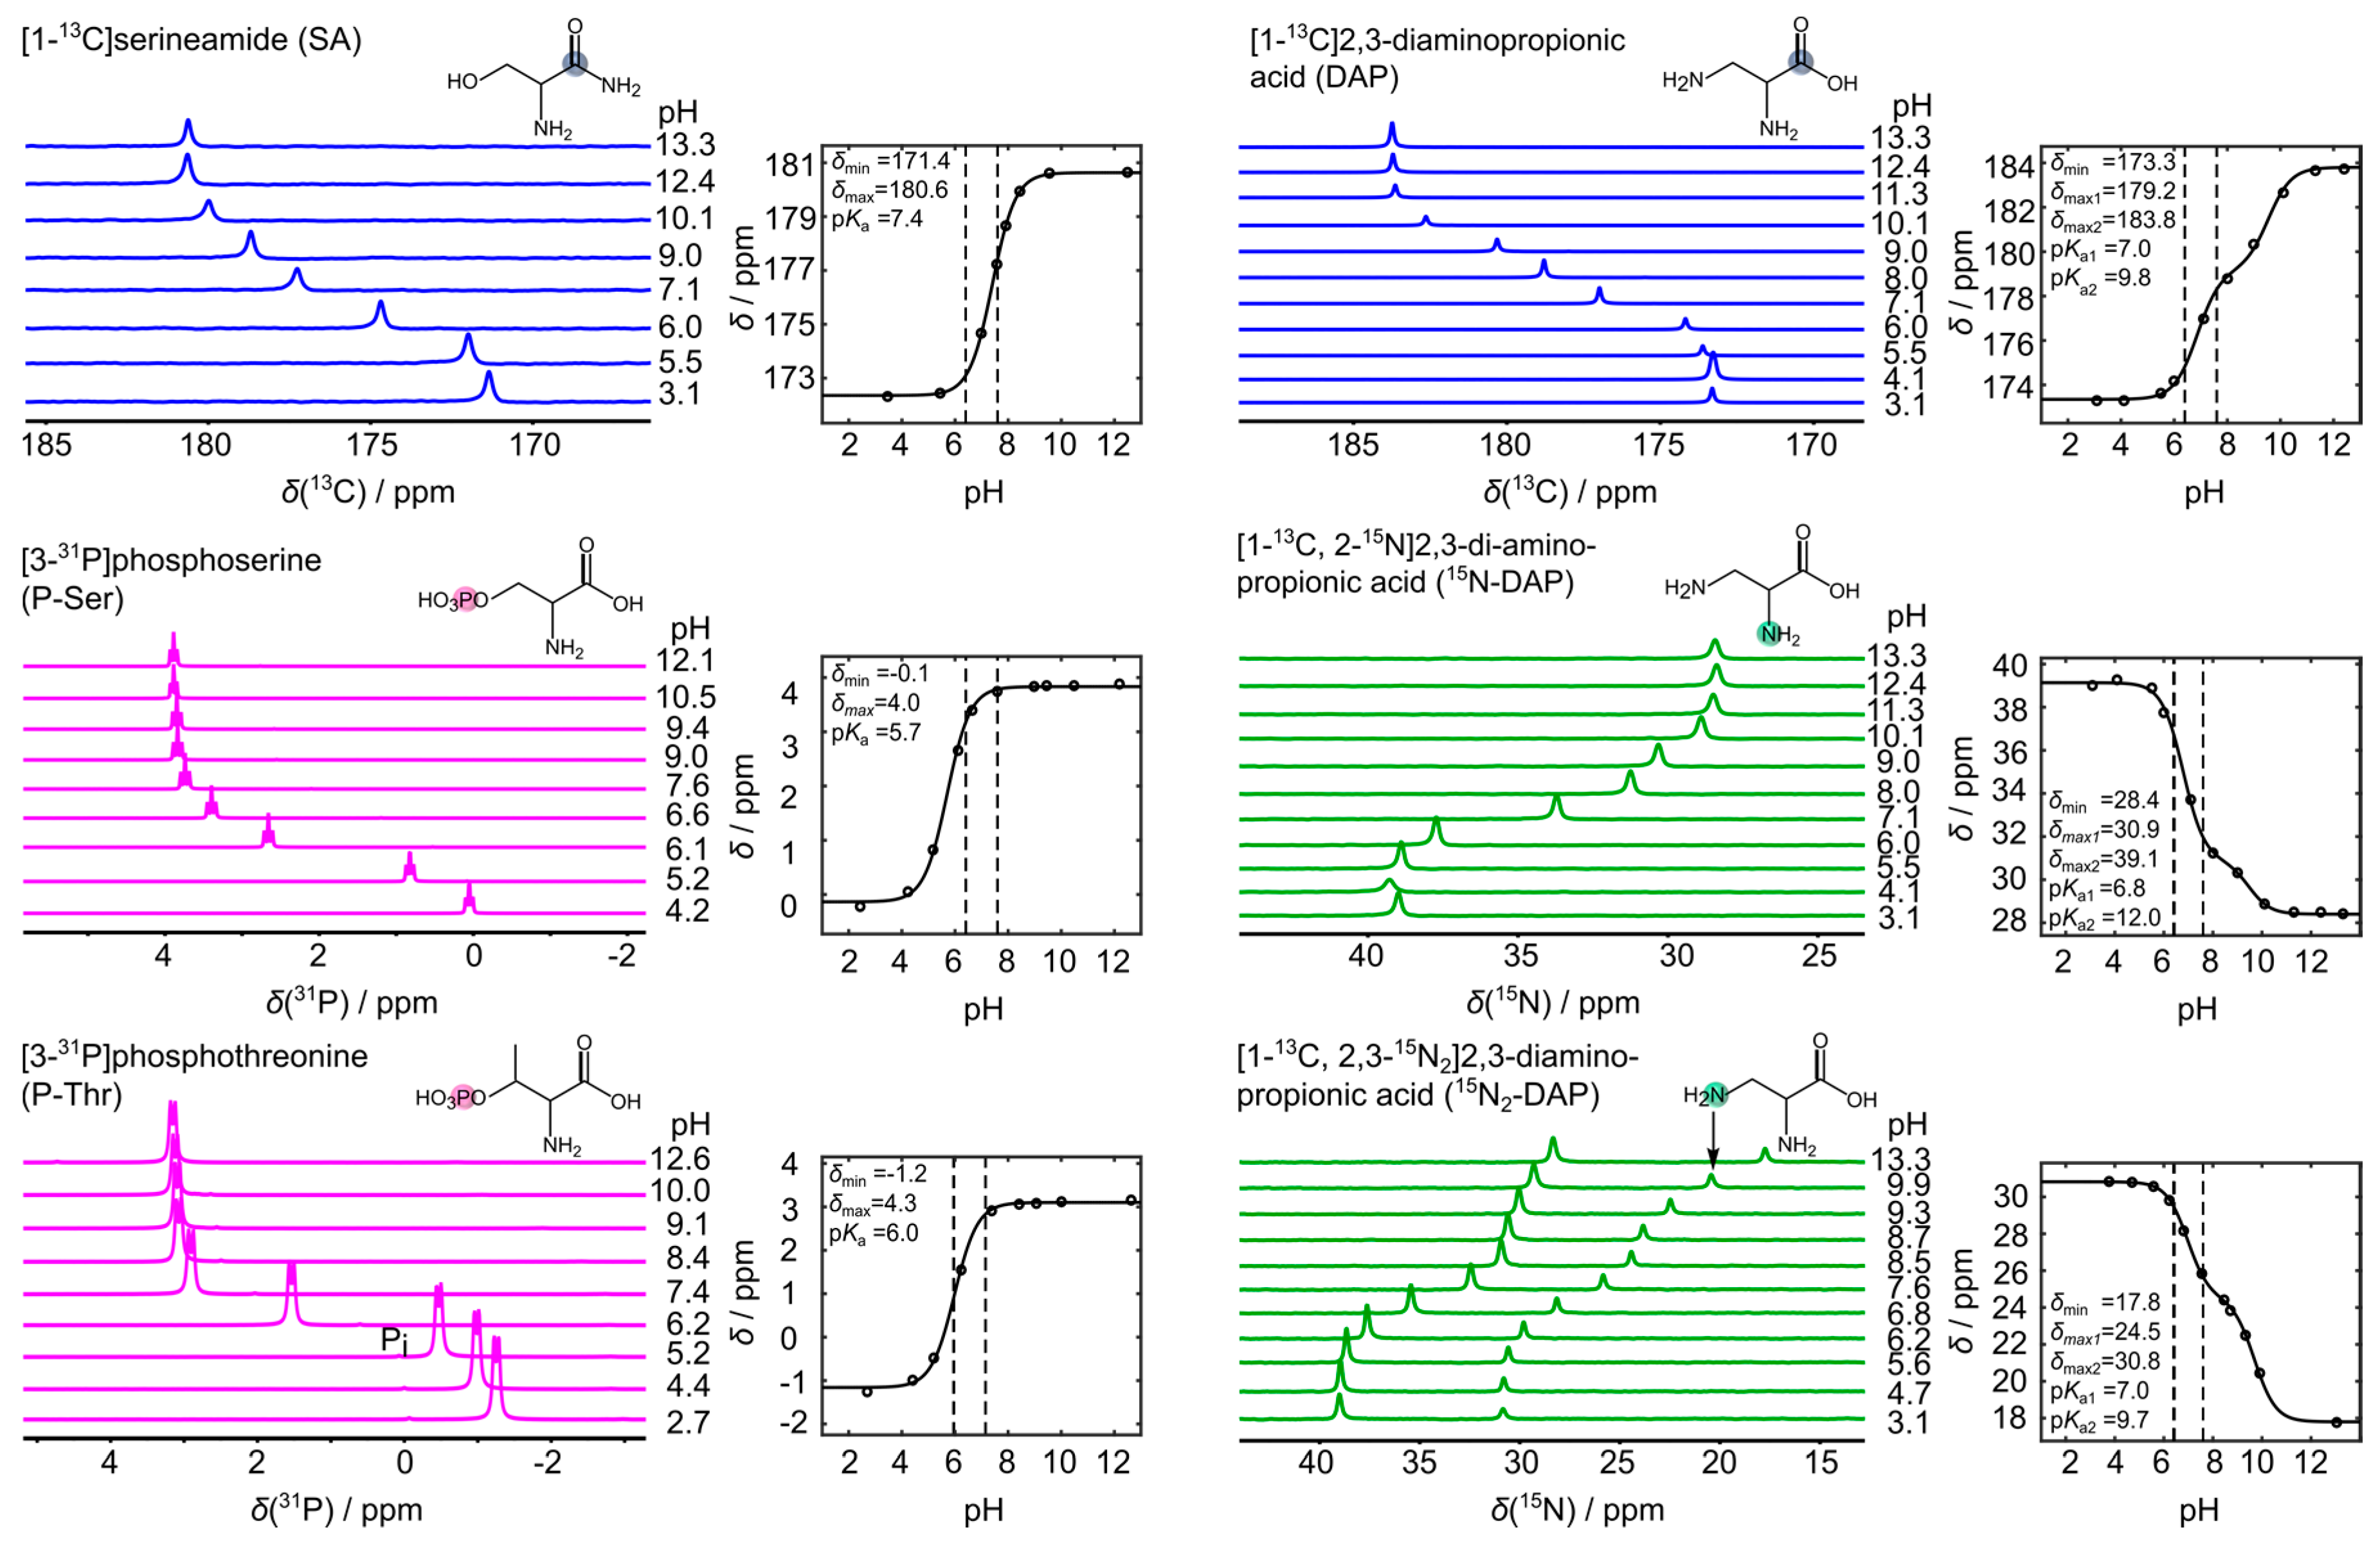
| Sensor | pKa1 | pKa2 | δmin | δmax1 | δmax2 |
|---|---|---|---|---|---|
| 13C-SA | 7.35 | - | 172.44 | 180.67 | - |
| 13C-DAP | 6.95 | 9.65 | 173.28 | 179.00 | 183.7 |
© 2018 by the authors. Licensee MDPI, Basel, Switzerland. This article is an open access article distributed under the terms and conditions of the Creative Commons Attribution (CC BY) license (http://creativecommons.org/licenses/by/4.0/).
Share and Cite
Hundshammer, C.; Düwel, S.; Ruseckas, D.; Topping, G.; Dzien, P.; Müller, C.; Feuerecker, B.; Hövener, J.B.; Haase, A.; Schwaiger, M.; et al. Hyperpolarized Amino Acid Derivatives as Multivalent Magnetic Resonance pH Sensor Molecules. Sensors 2018, 18, 600. https://doi.org/10.3390/s18020600
Hundshammer C, Düwel S, Ruseckas D, Topping G, Dzien P, Müller C, Feuerecker B, Hövener JB, Haase A, Schwaiger M, et al. Hyperpolarized Amino Acid Derivatives as Multivalent Magnetic Resonance pH Sensor Molecules. Sensors. 2018; 18(2):600. https://doi.org/10.3390/s18020600
Chicago/Turabian StyleHundshammer, Christian, Stephan Düwel, David Ruseckas, Geoffrey Topping, Piotr Dzien, Christoph Müller, Benedikt Feuerecker, Jan B. Hövener, Axel Haase, Markus Schwaiger, and et al. 2018. "Hyperpolarized Amino Acid Derivatives as Multivalent Magnetic Resonance pH Sensor Molecules" Sensors 18, no. 2: 600. https://doi.org/10.3390/s18020600