Monitoring Walker Assistive Devices: A Novel Approach Based on Load Cells and Optical Distance Measurements †


Abstract
:1. Introduction
2. Usage Metrics
2.1. Force Balance
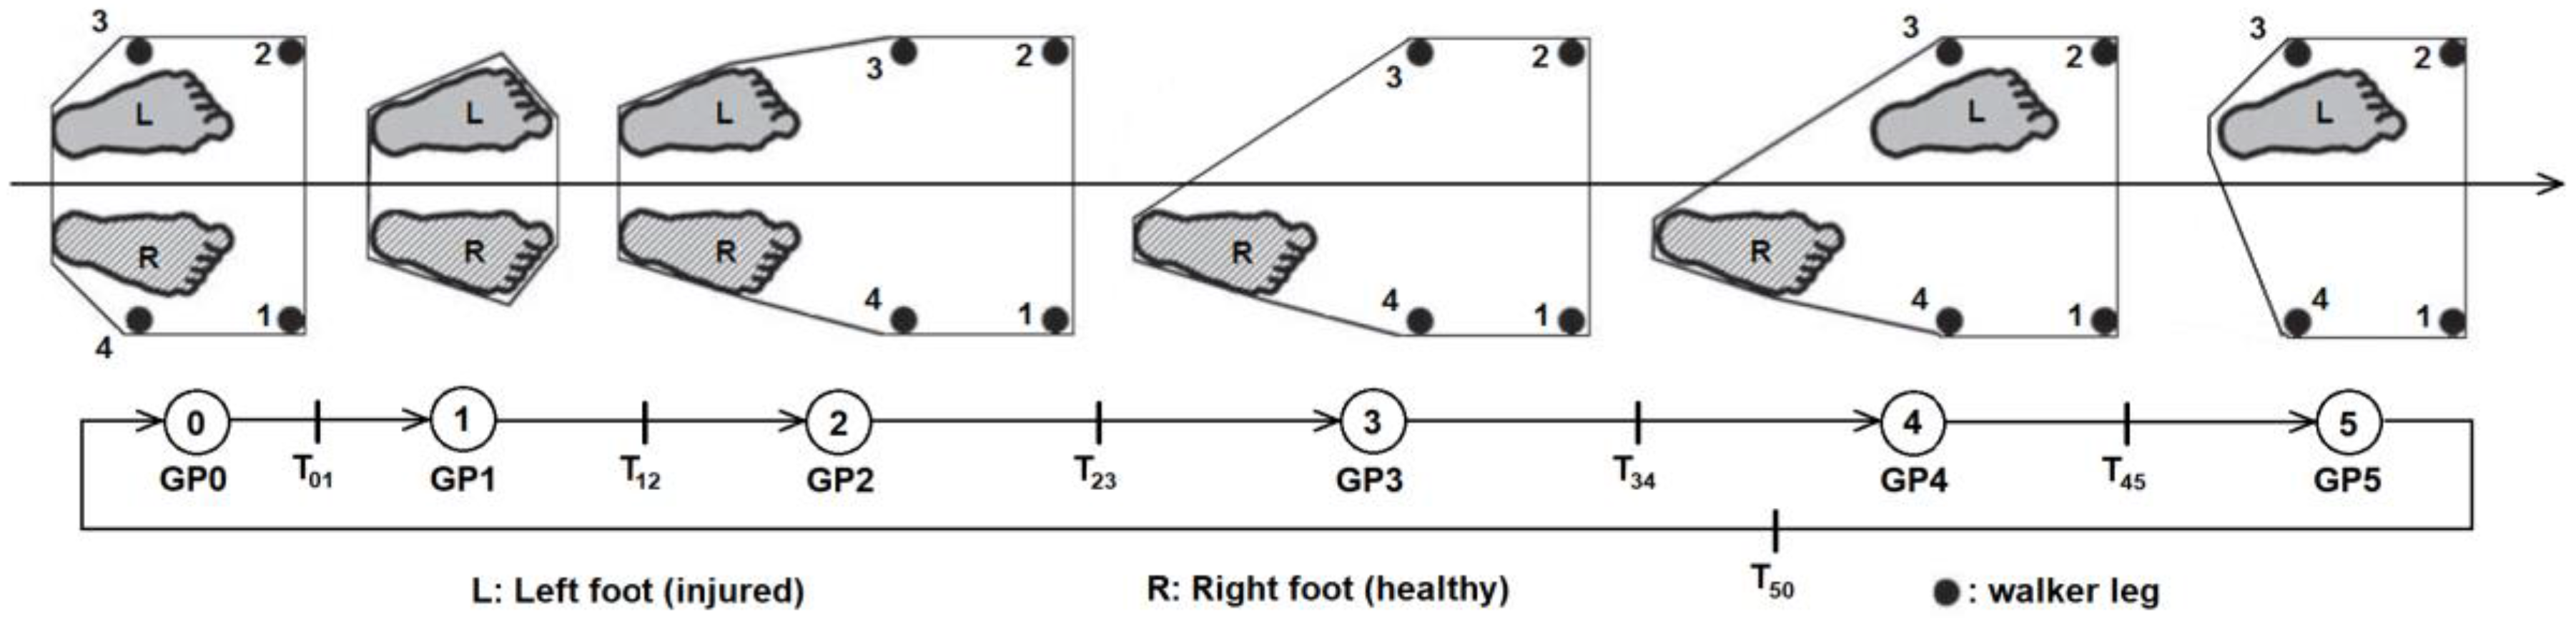
2.2. Motor Coordination
- T01 is enabled when F1 + F2 + F3 + F4 < WEIGHT_TH (threshold of minimum weight). This transition occurs when the total force measured by the load cells falls below the walker weight; in other words, when the walker is lifted in the air.
- T12 is enabled if F1 + F2 + F3 + F4 > WEIGHT_TH AND d > TRAVEL_TH (threshold of minimum distance travelled forward). This transaction occurs when the walker touches the floor after traveling a distance greater than the minimum.
- T23 is enabled if COFx > RIGHT_TH or COFx < LEFT_TH depending on which foot is injured (left or right, respectively). This transaction occurs when the user steps forward with the injured foot and applies maximum force on the opposite side. The injured foot shall always be the first one to move. The type of disability must be defined in advance because it determines the threshold value.
- T34 is enabled if COFx < RIGHT_TH or COFx > LEFT_TH depending on which foot is injured (left or right, respectively). This transaction occurs when the user alleviates the force previously applied to the walker; in other words, when COFx returns to zero.
- T45 is enabled if COFx < LEFT_TH or COFx > RIGHT_TH depending on which foot is injured (left or right, respectively). This transaction occurs when the user steps forward with the healthy foot and applies maximum force on the opposite side. The healthy foot shall always be the last one to move.
- T50 is enabled if COFx > LEFT_TH or COFx < RIGHT_TH depending on which foot is injured (left or right, respectively). This transaction occurs when the user alleviates the force previously applied to the walker; in other words, when COFx returns to zero.
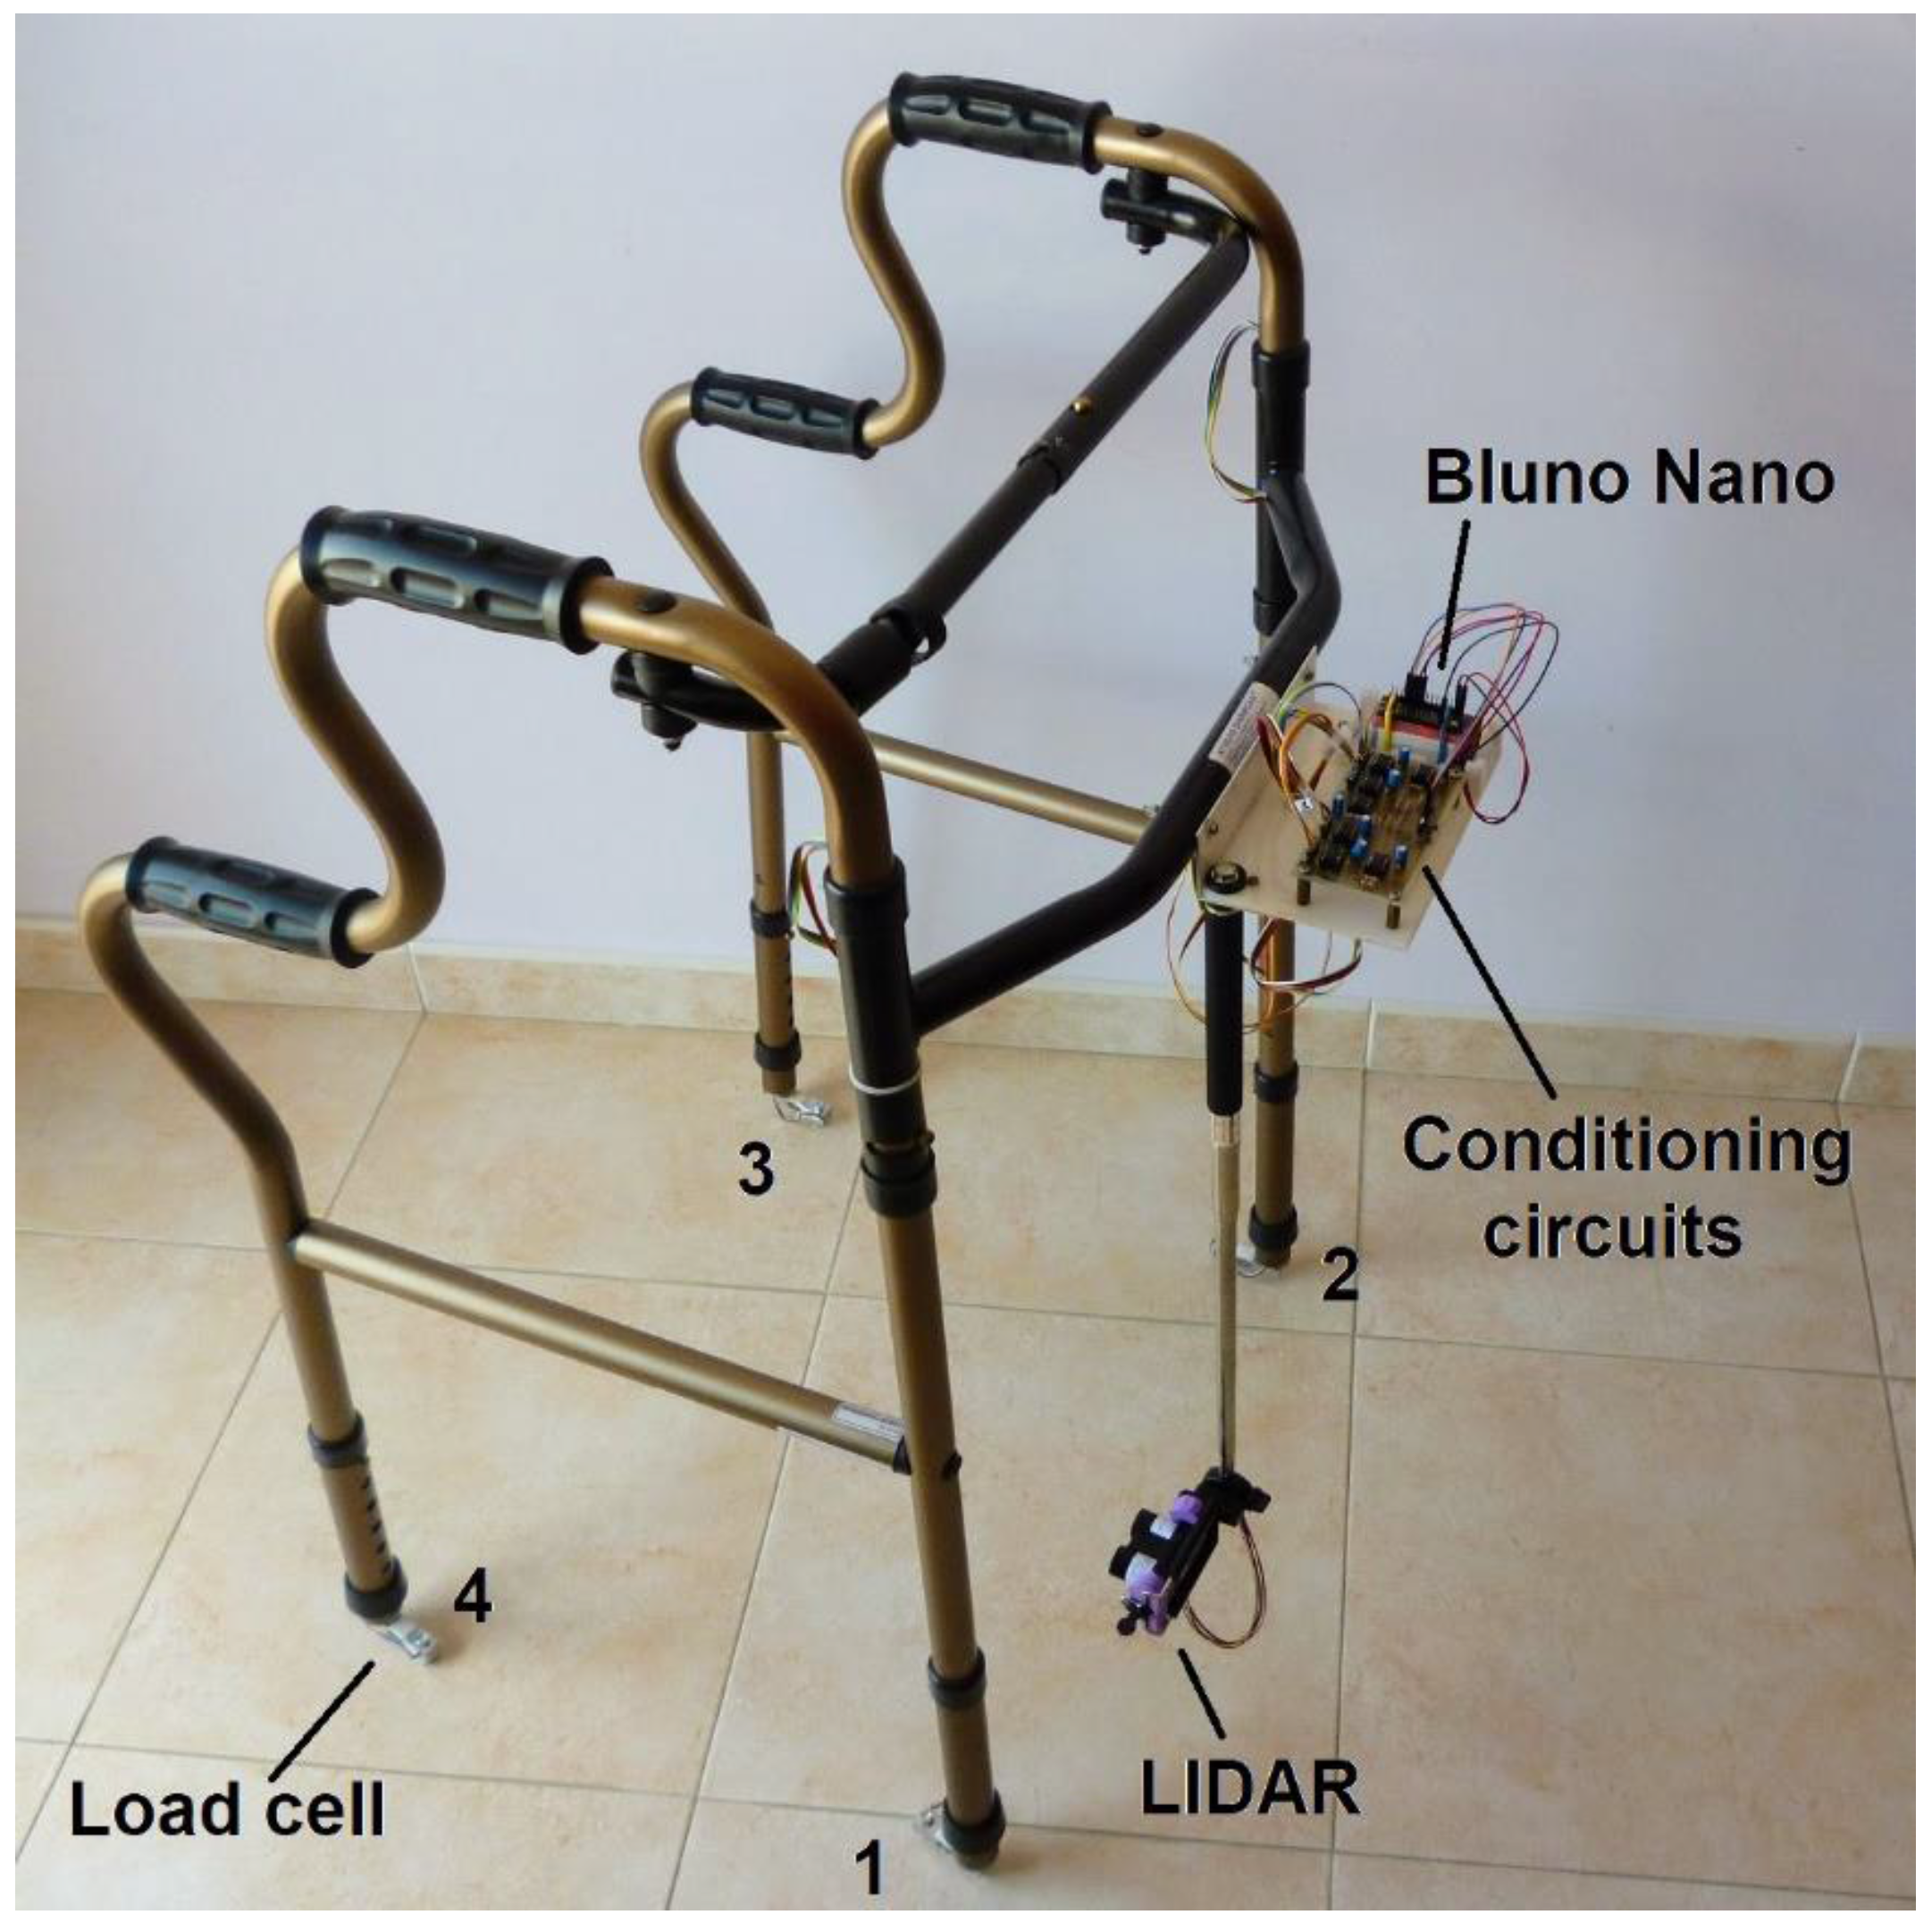
3. Measurement System
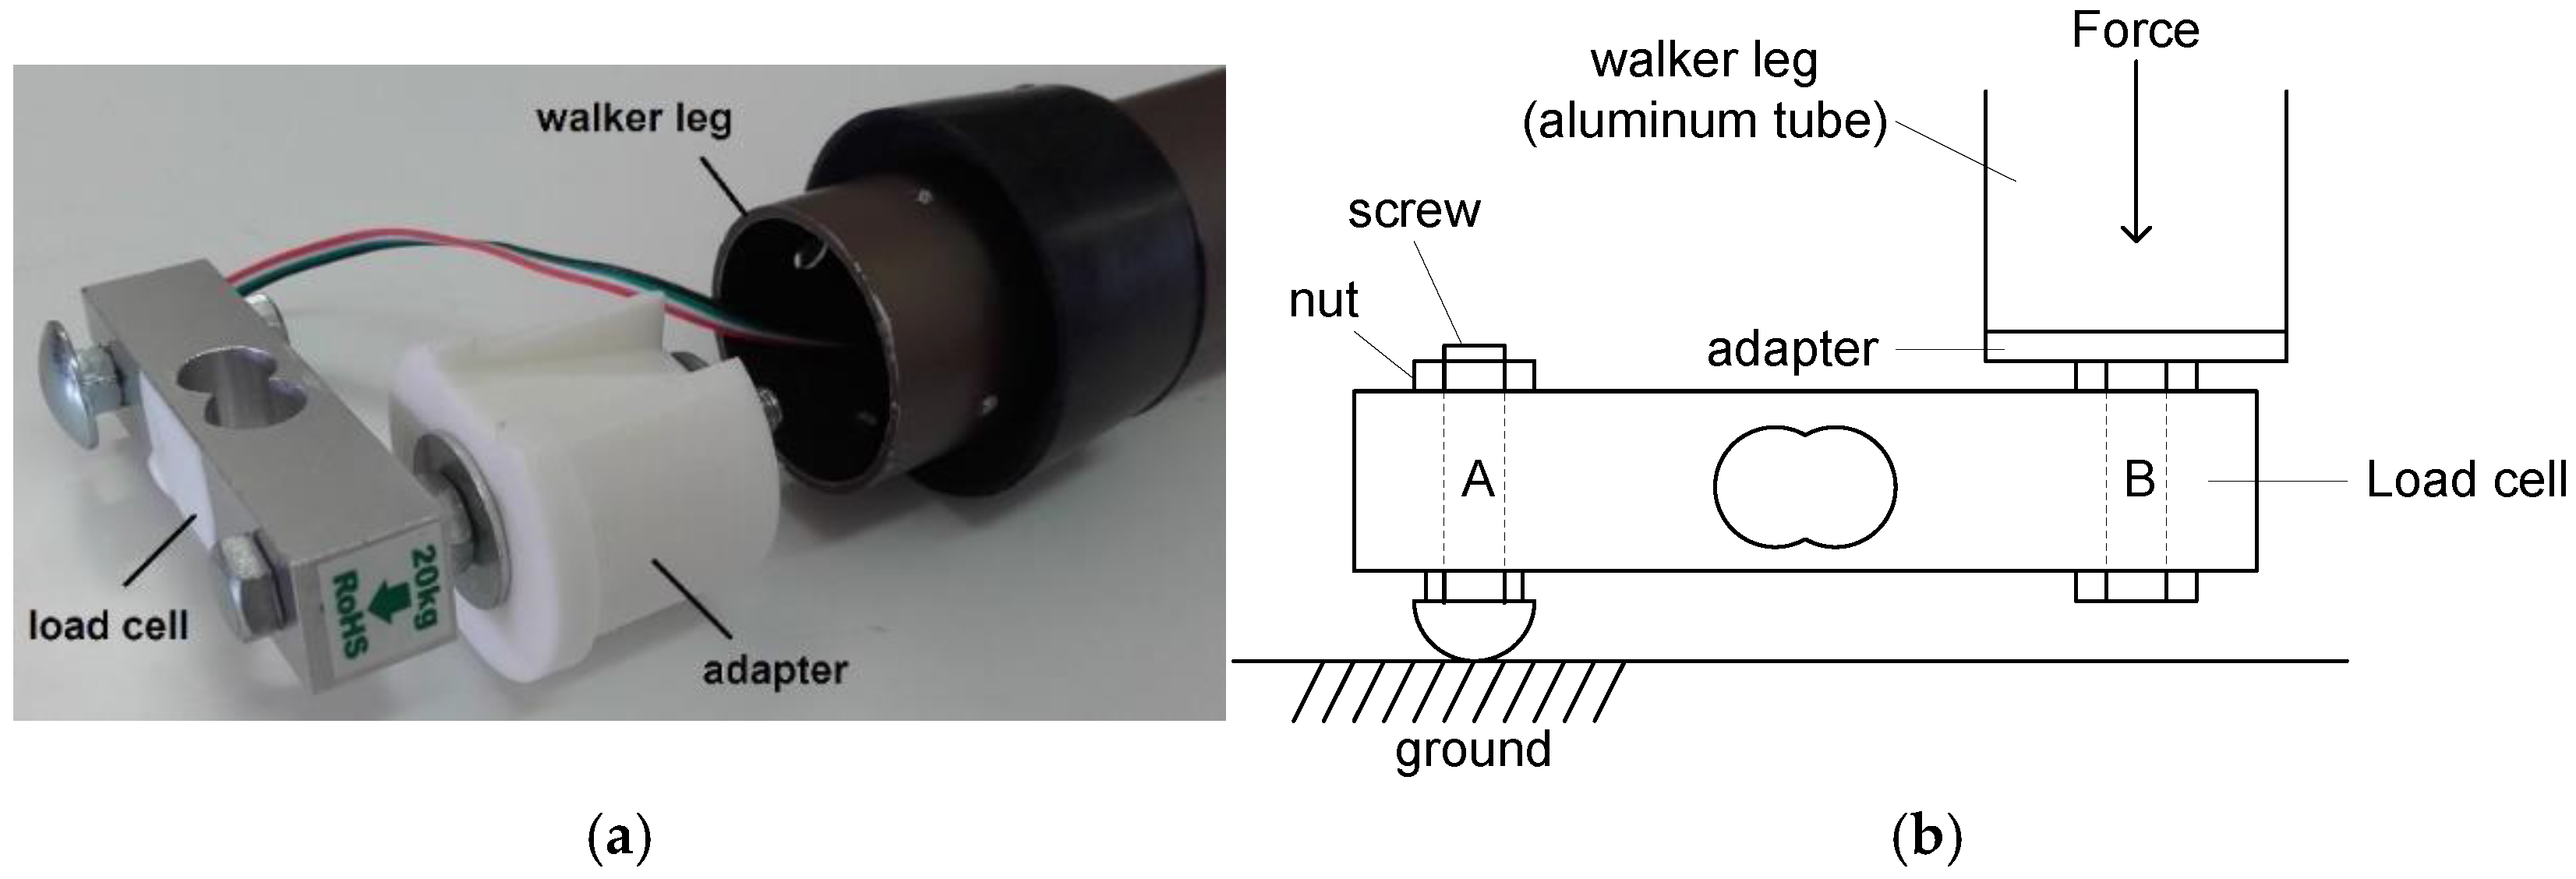
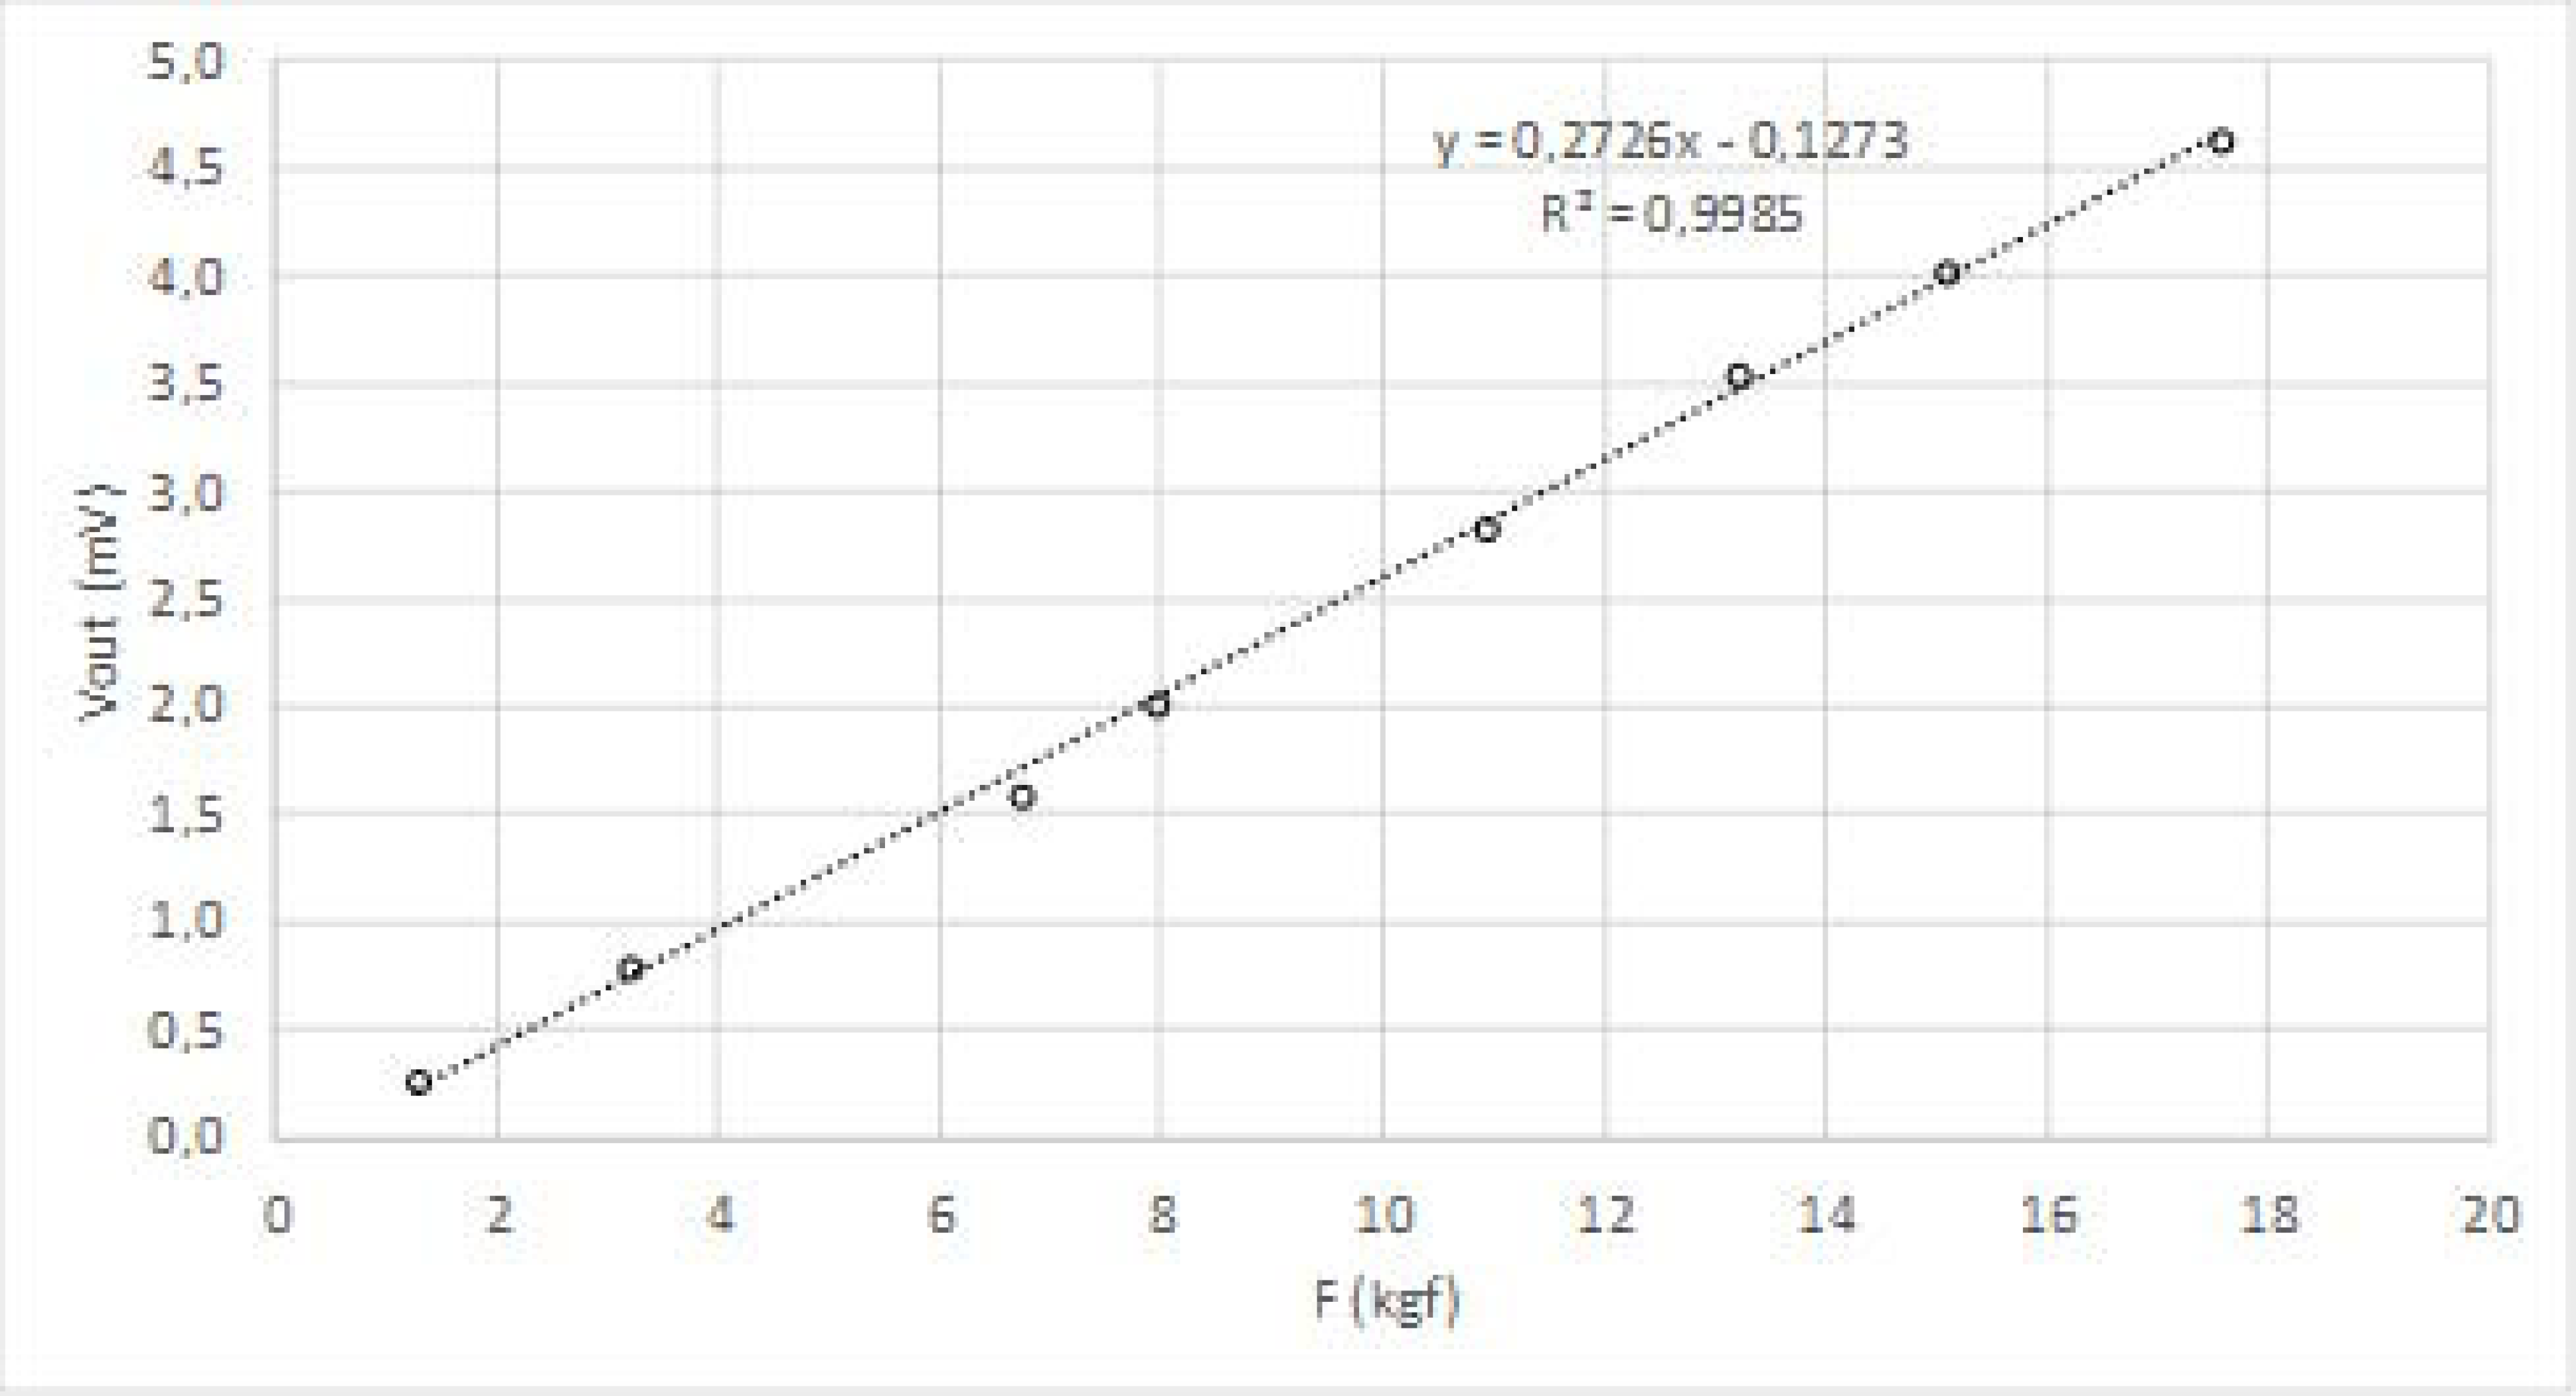
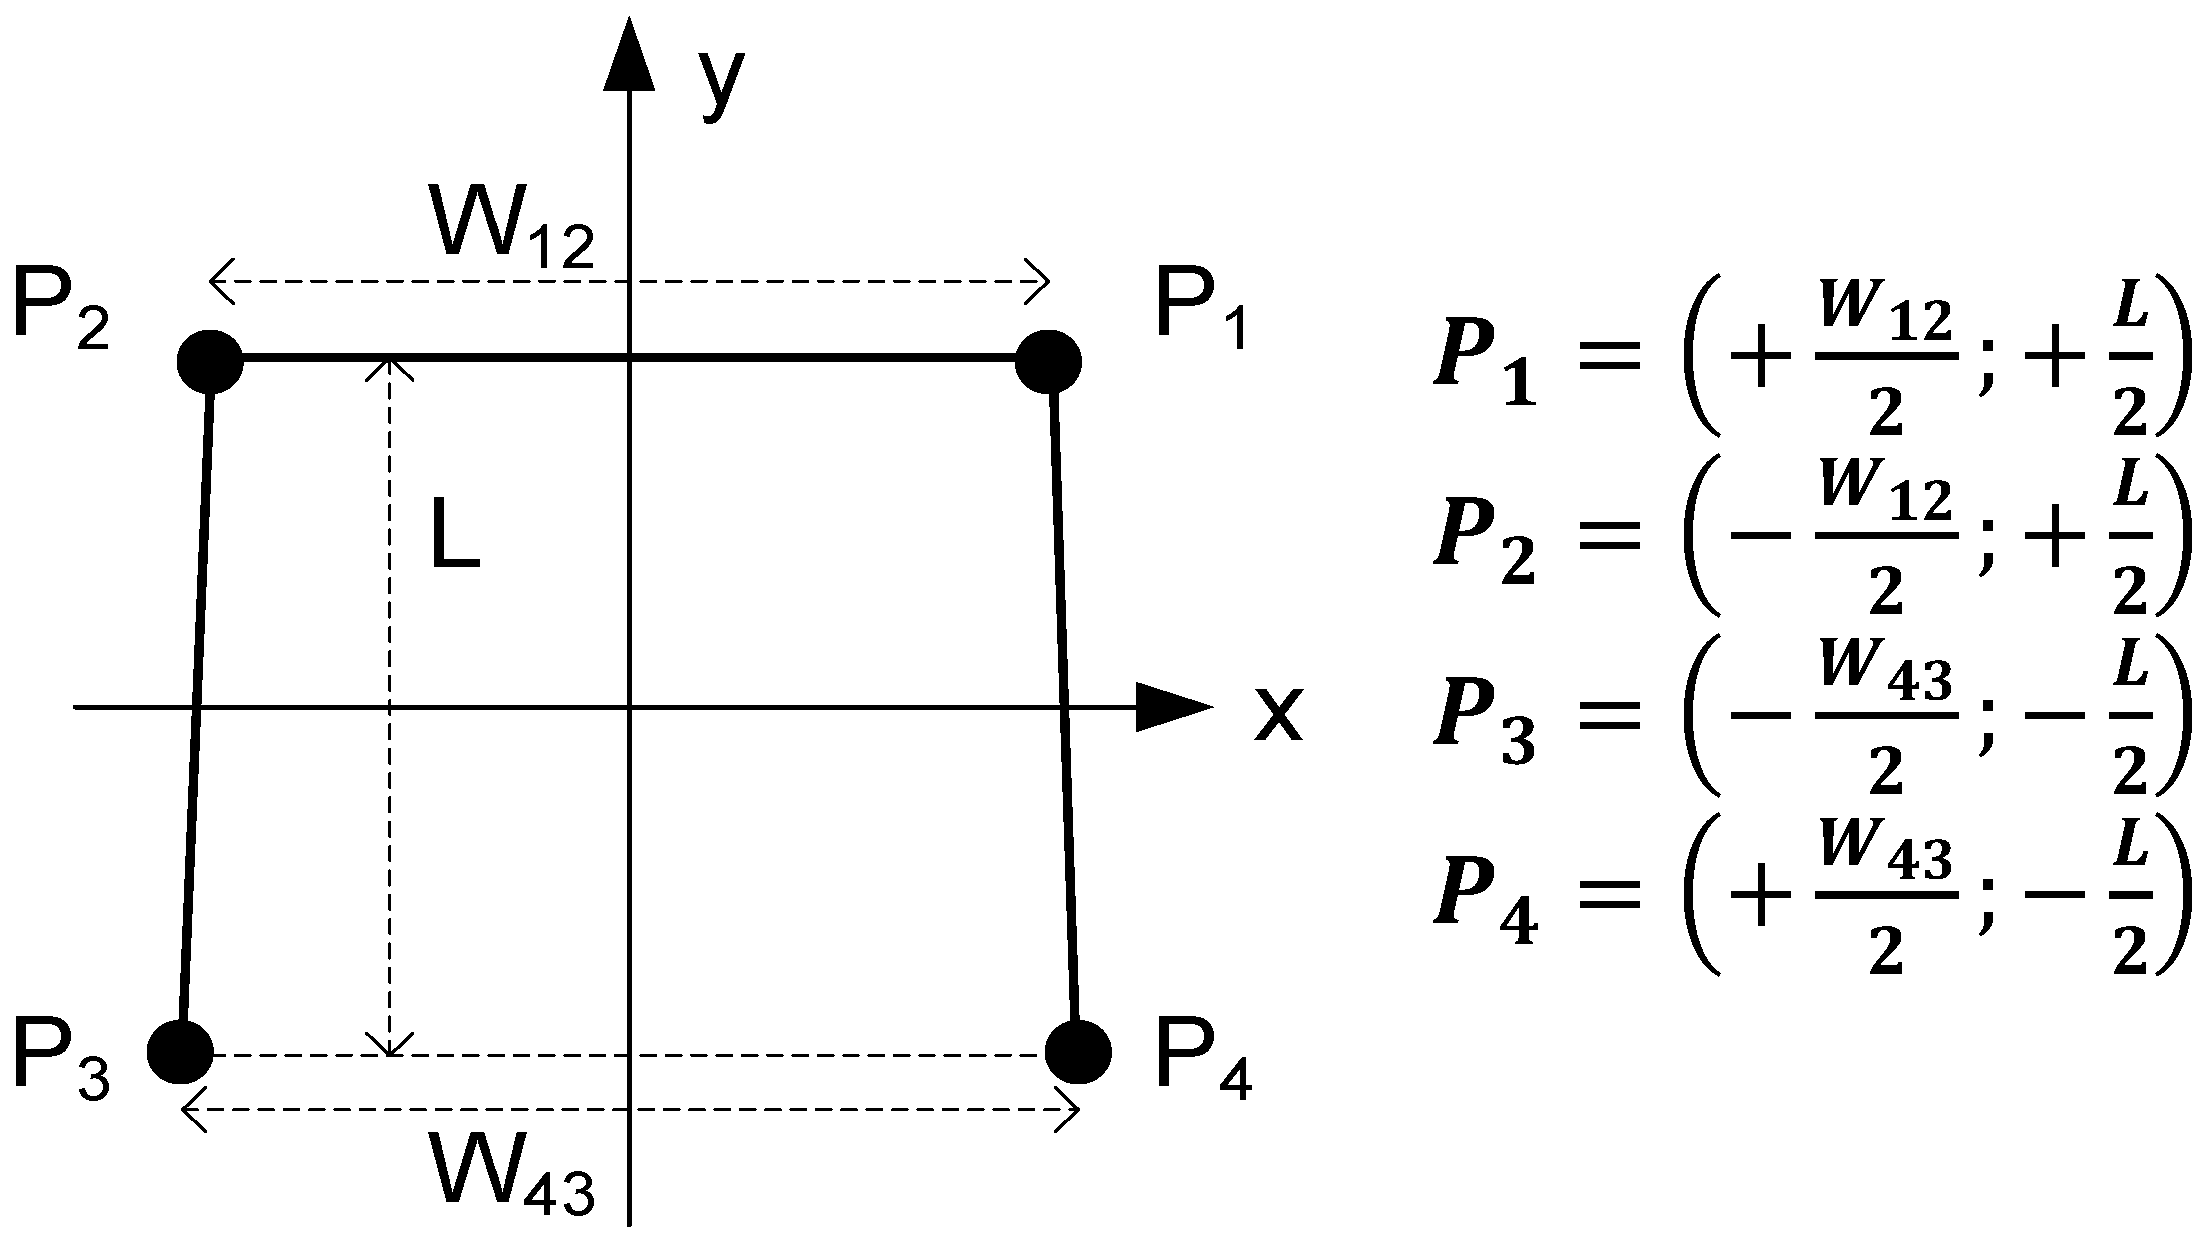
3.1. Force Sensors
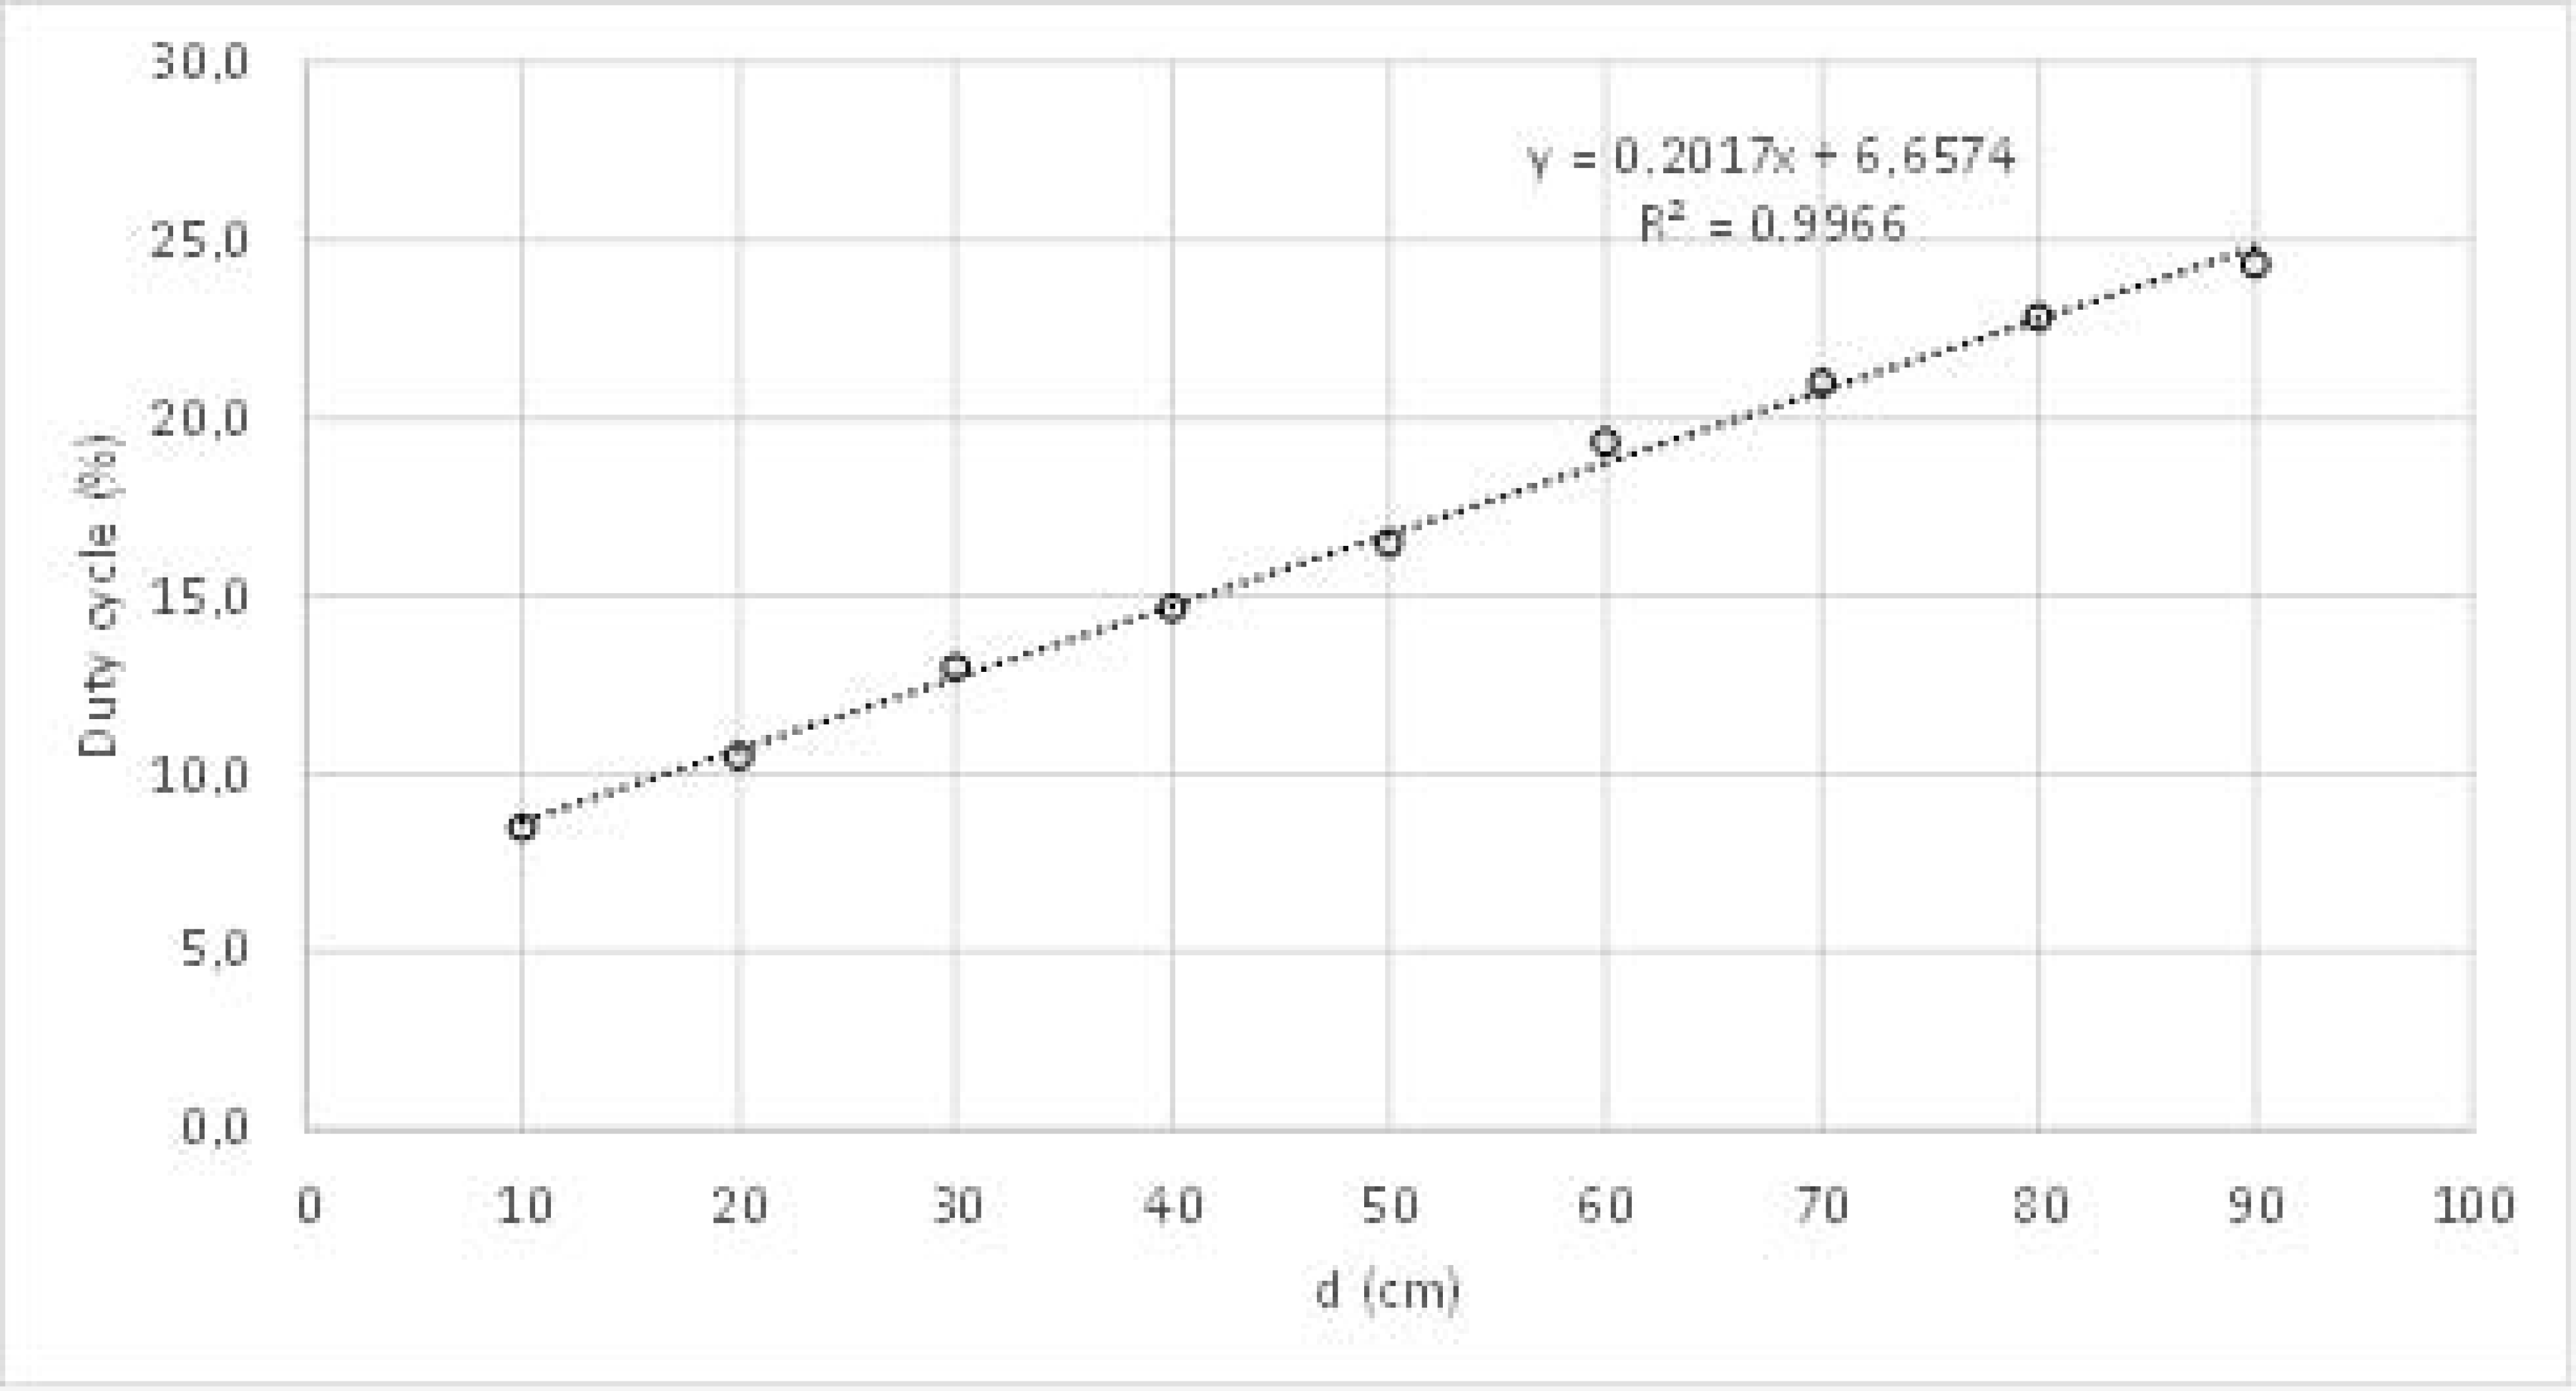
3.2. LIDAR
3.3. Signal Conditioning
3.4. Data Acquisition
3.5. Data Processing
- Computation of COFx and COFy by solving Equations (1) and (2).
- Computation of the first risk indicator (I1) by solving Equations (3) and (4).
- Detection of “bad” steps (B) by running the state machine represented in Figure 2.
- Computation of the second risk indicator (I2) by solving Equation (5).
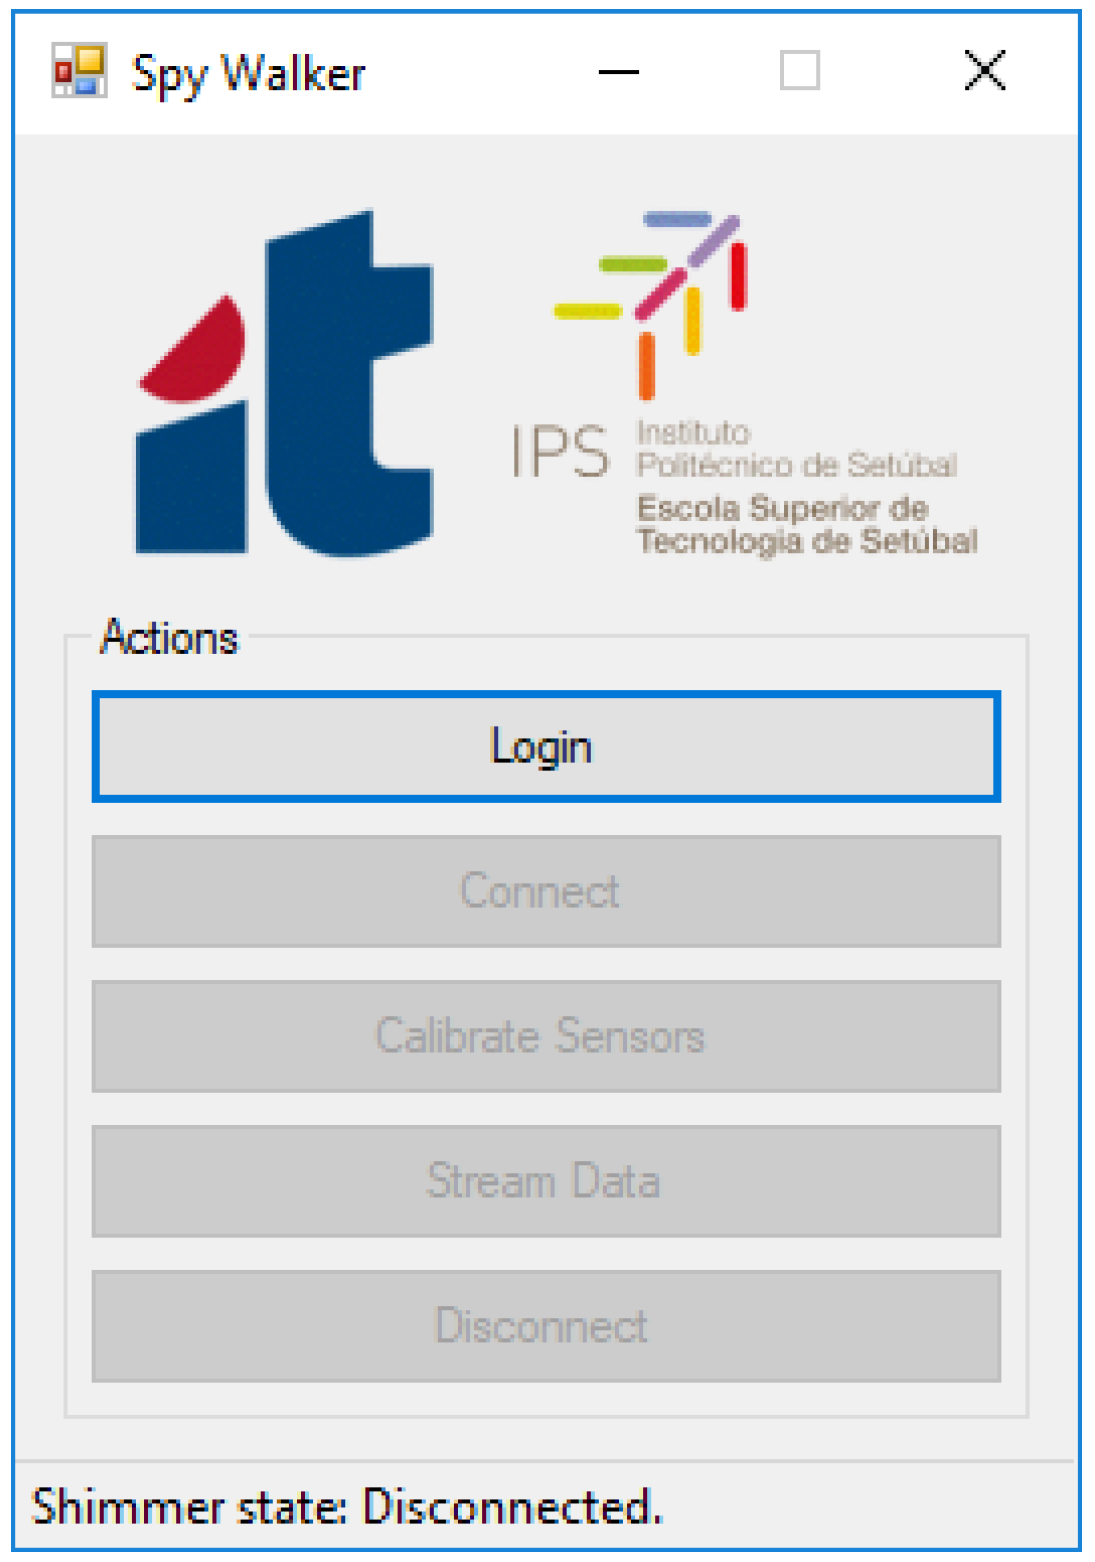
- Login: Ask for information about the user including its weight (needed to compute Equation (4)).
- Connect: Establish a Bluetooth link with the smart walker.
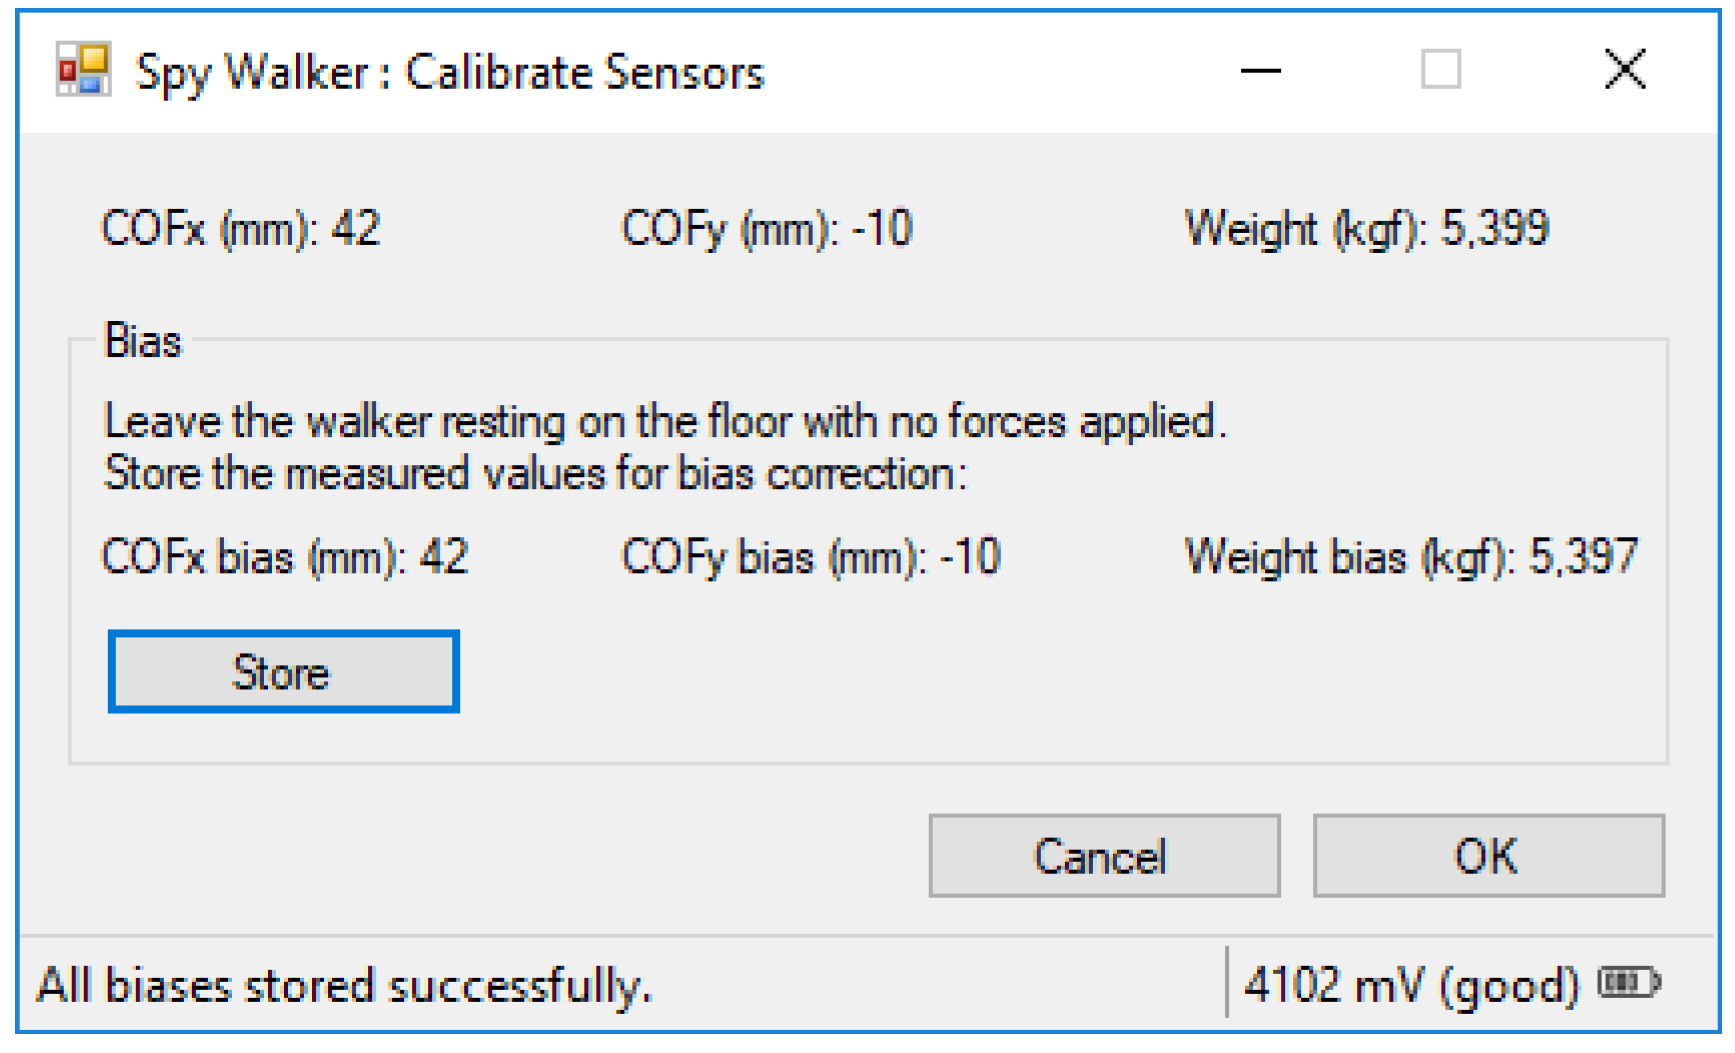
- Calibrate Sensors: Determine experimentally the offset error of the load cells and the walker weight (also needed for Equation (4)).
- Stream Data: Open a sub-window where the physiotherapist can monitor online the usage of the walker.
- Disconnect: Close the Bluetooth link with the smart walker.
3.5.1. Calibrate Sensors
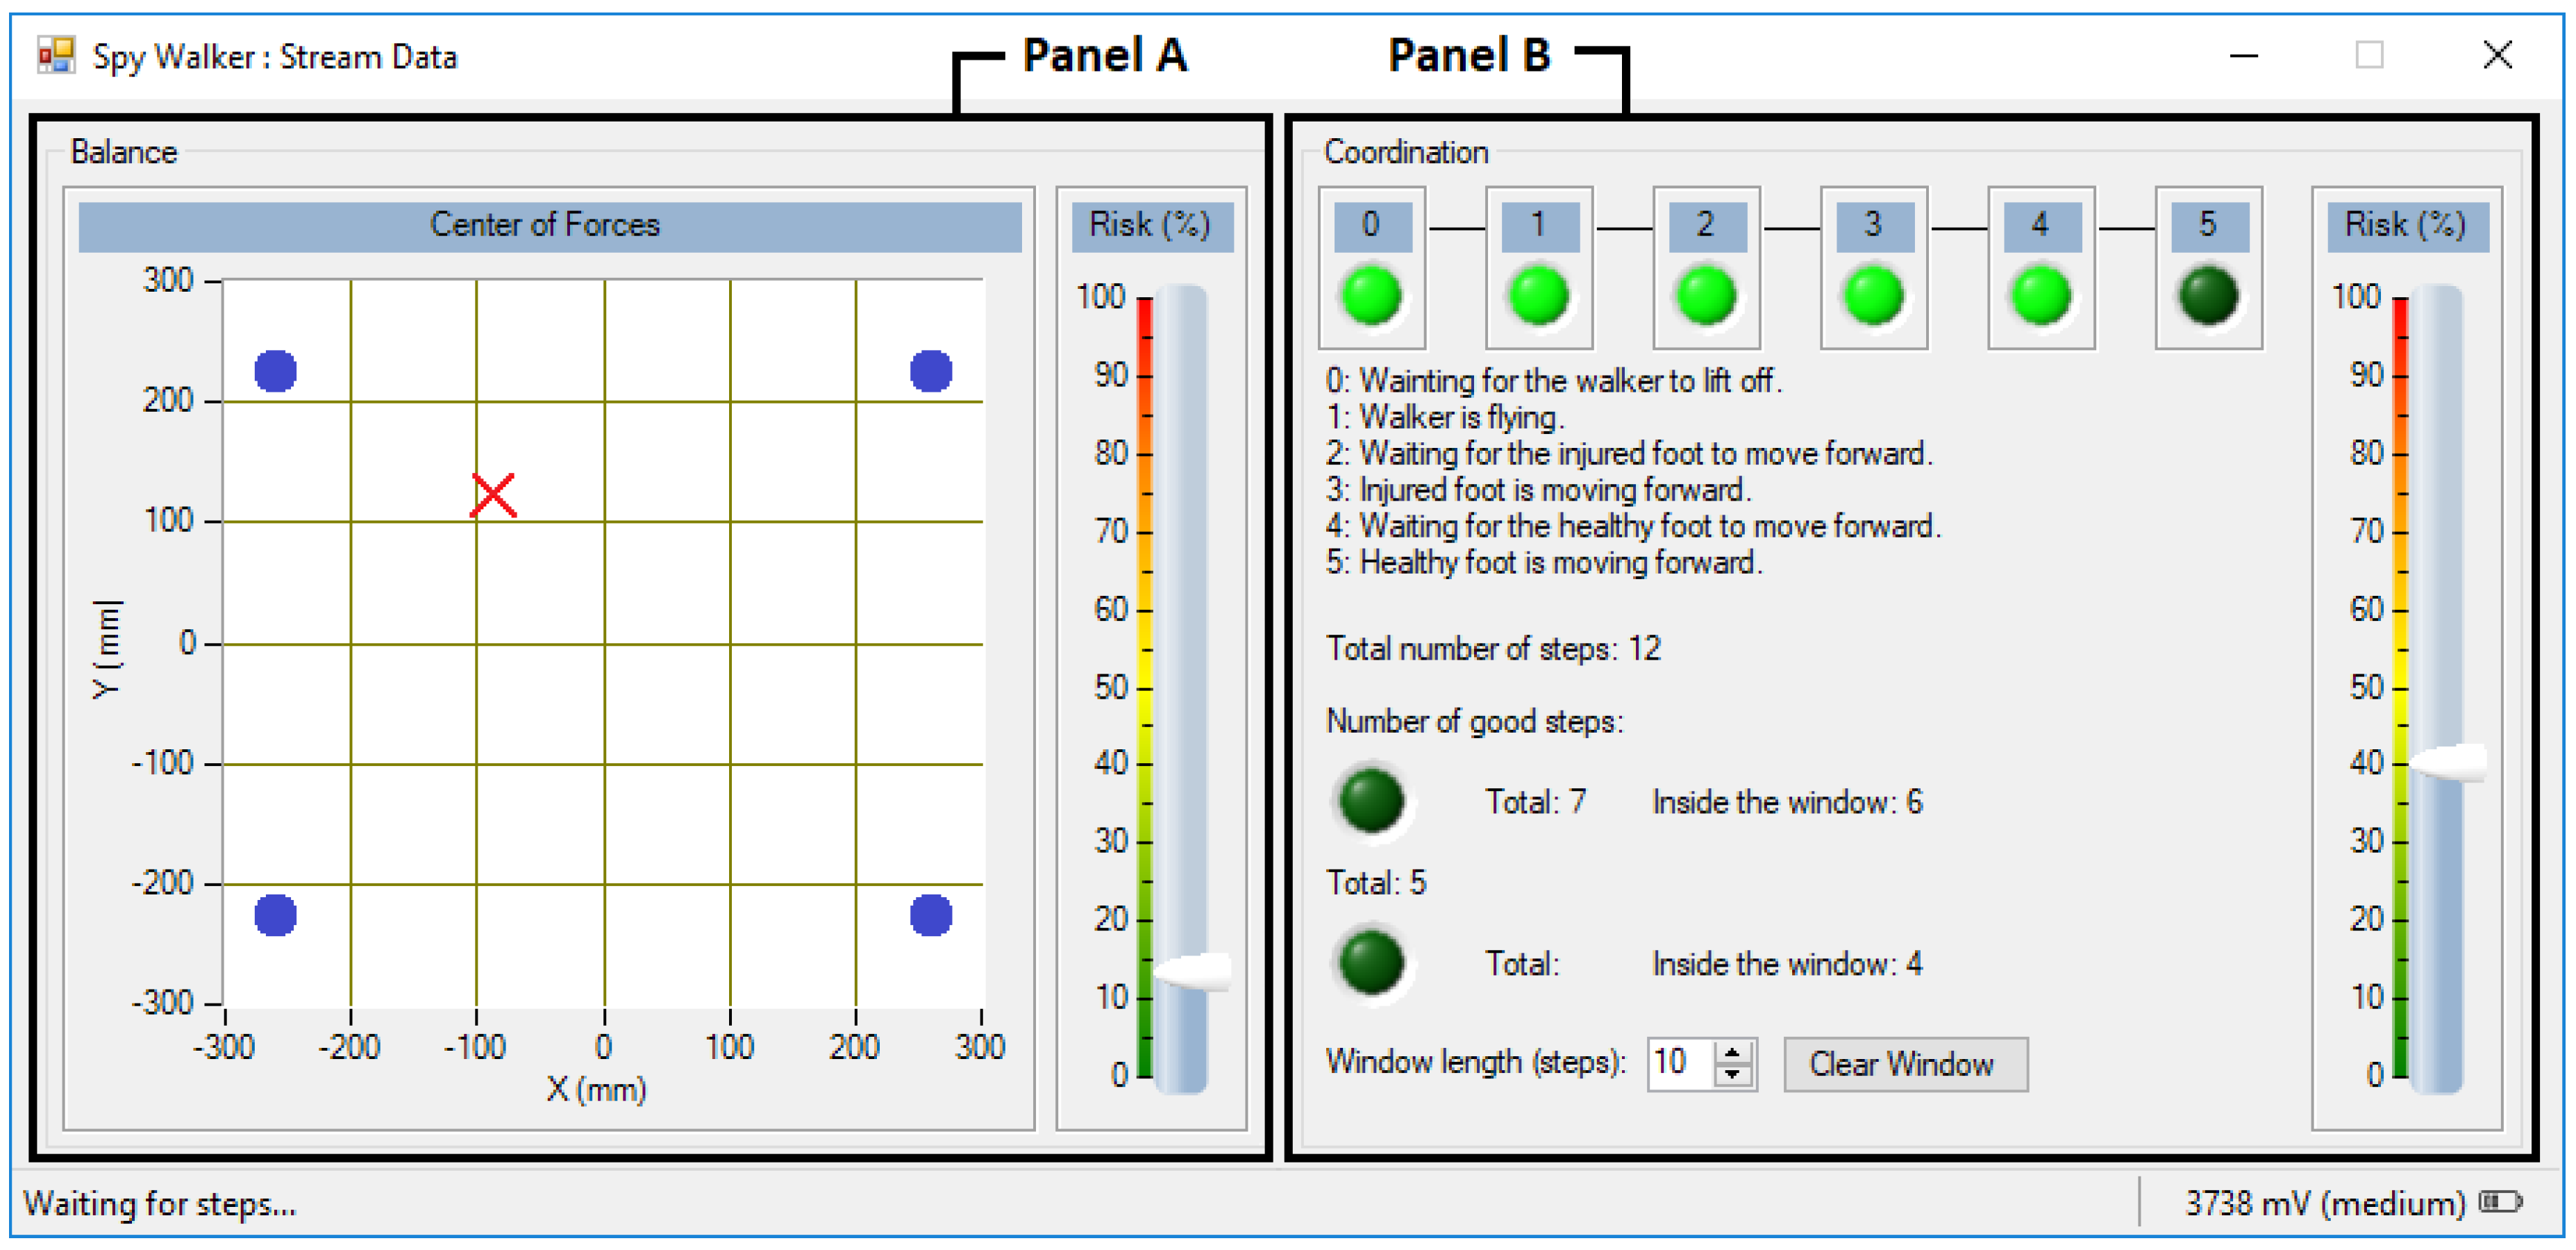
3.5.2. Stream Data
- Balance (panel A): The COF is computed and the result is presented as a cross moving over a XY graph. When the user loads his left side the cross moves toward negative values of X; when he loads his right side the cross moves toward positive values of X. The same applies for the front/back direction over the Y axis, much like a joystick. A vertical slider shows the instantaneous value of the I1 indicator.
- Coordination (panel B): The state machine is executed and the current gait phase is identified. A set of six LEDs are turned on sequentially as the state machine moves forward the next phase. If the user passes through all the phases successfully, all the LEDs end up lighted and the step is marked as “good”. If the user violates any phase, the machine is reset to the first stage (GP0) and the step is marked as “bad”. The number of “good” and “bad” steps is registered. A vertical slider shows the instantaneous value of the I2 indicator.
4. Experimental Results
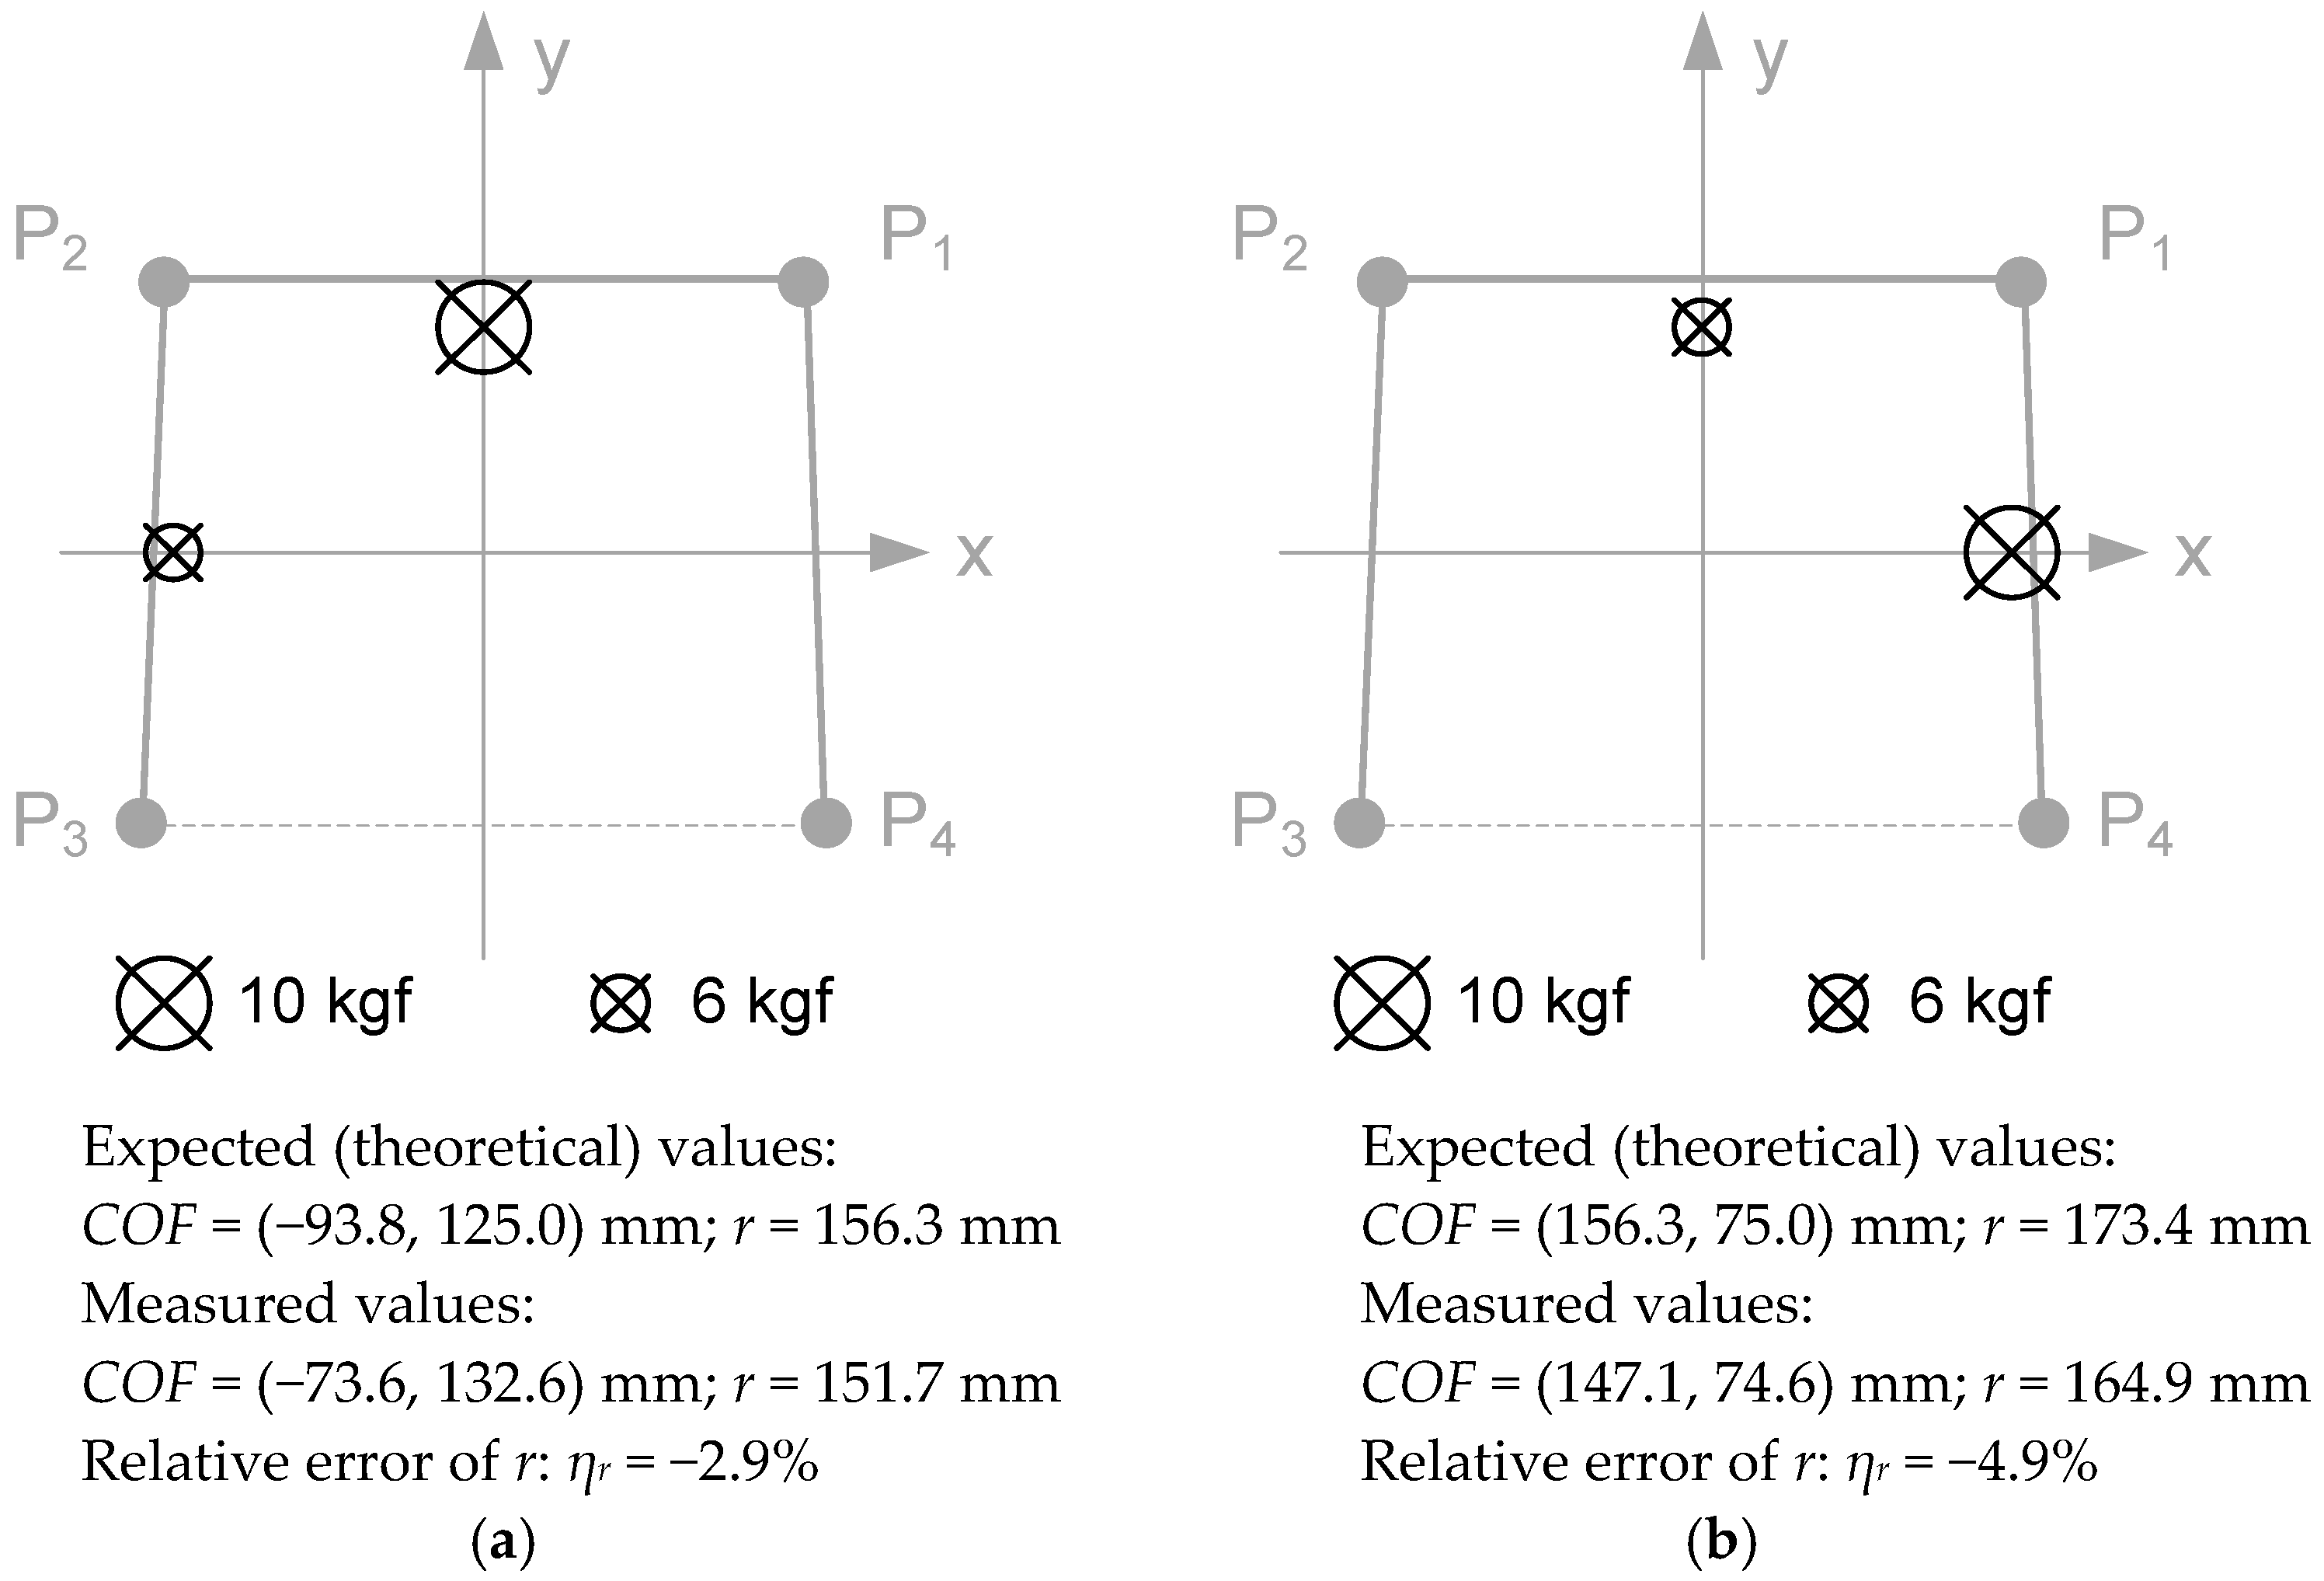
4.1. COF Location
4.2. Computation of I1 (Assessment of Unbalance)
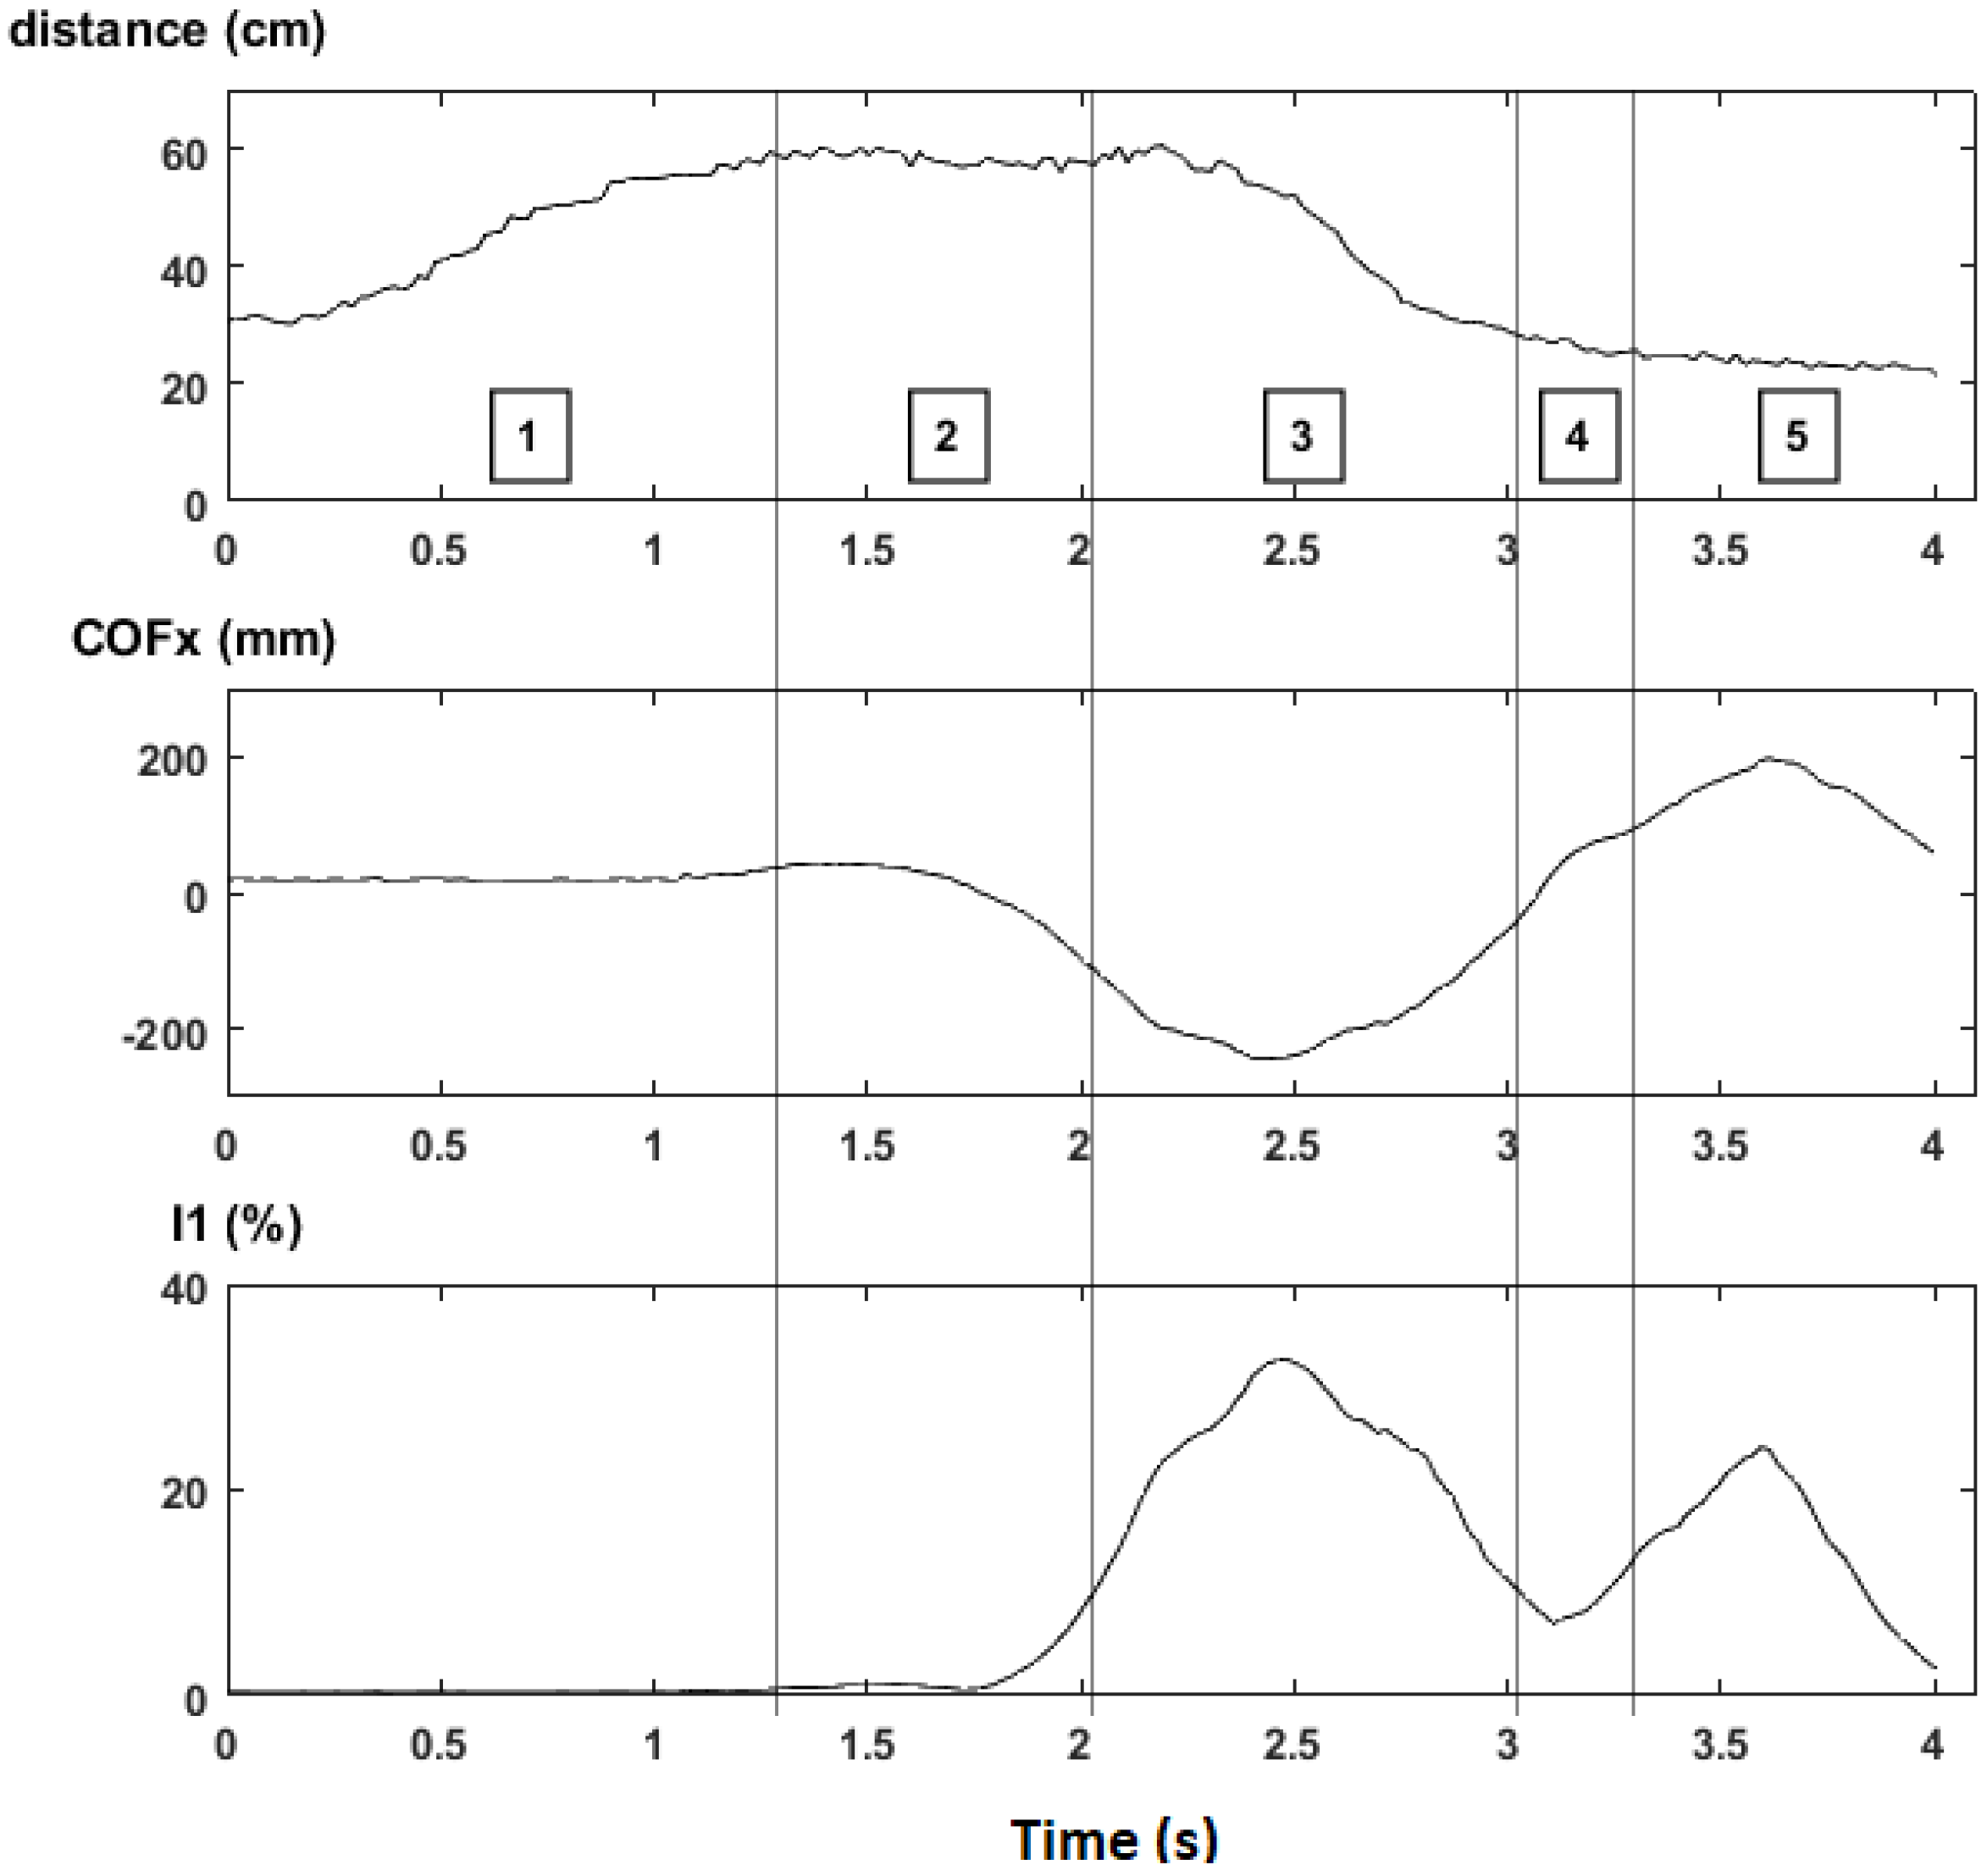
- Gait phase 0 was omitted because it is a waiting state.
- During gait phase 1 the walker is lifted in the air and travels about 30 cm (from d ≈ 30 cm to d ≈ 60 cm).
- Gait phase 2 is a waiting state that ends when the user starts moving the injured foot (making COFx cross LEFT_TH).
- During gait phase 3 the user transfers part of his weight to the left to compensate the lack of support on the injured foot [31]. While the injured foot moves forward, the distance returns to the base value (around 30 cm) and COFx returns to the origin, thus making the machine enter in stage 4.
- Gait phase 4 is another waiting state that ends when the user moves the healthy foot (making COFx cross RIGHT_TH).
- During gait phase 5 the user transfers part of his weight to the right. The load applied during phase 5 is lower than that applied on phase 3 because the healthy foot moves more easily than the injured foot. The step ends when both feet stay side-by-side, making COFx return to the origin and restart the state machine.
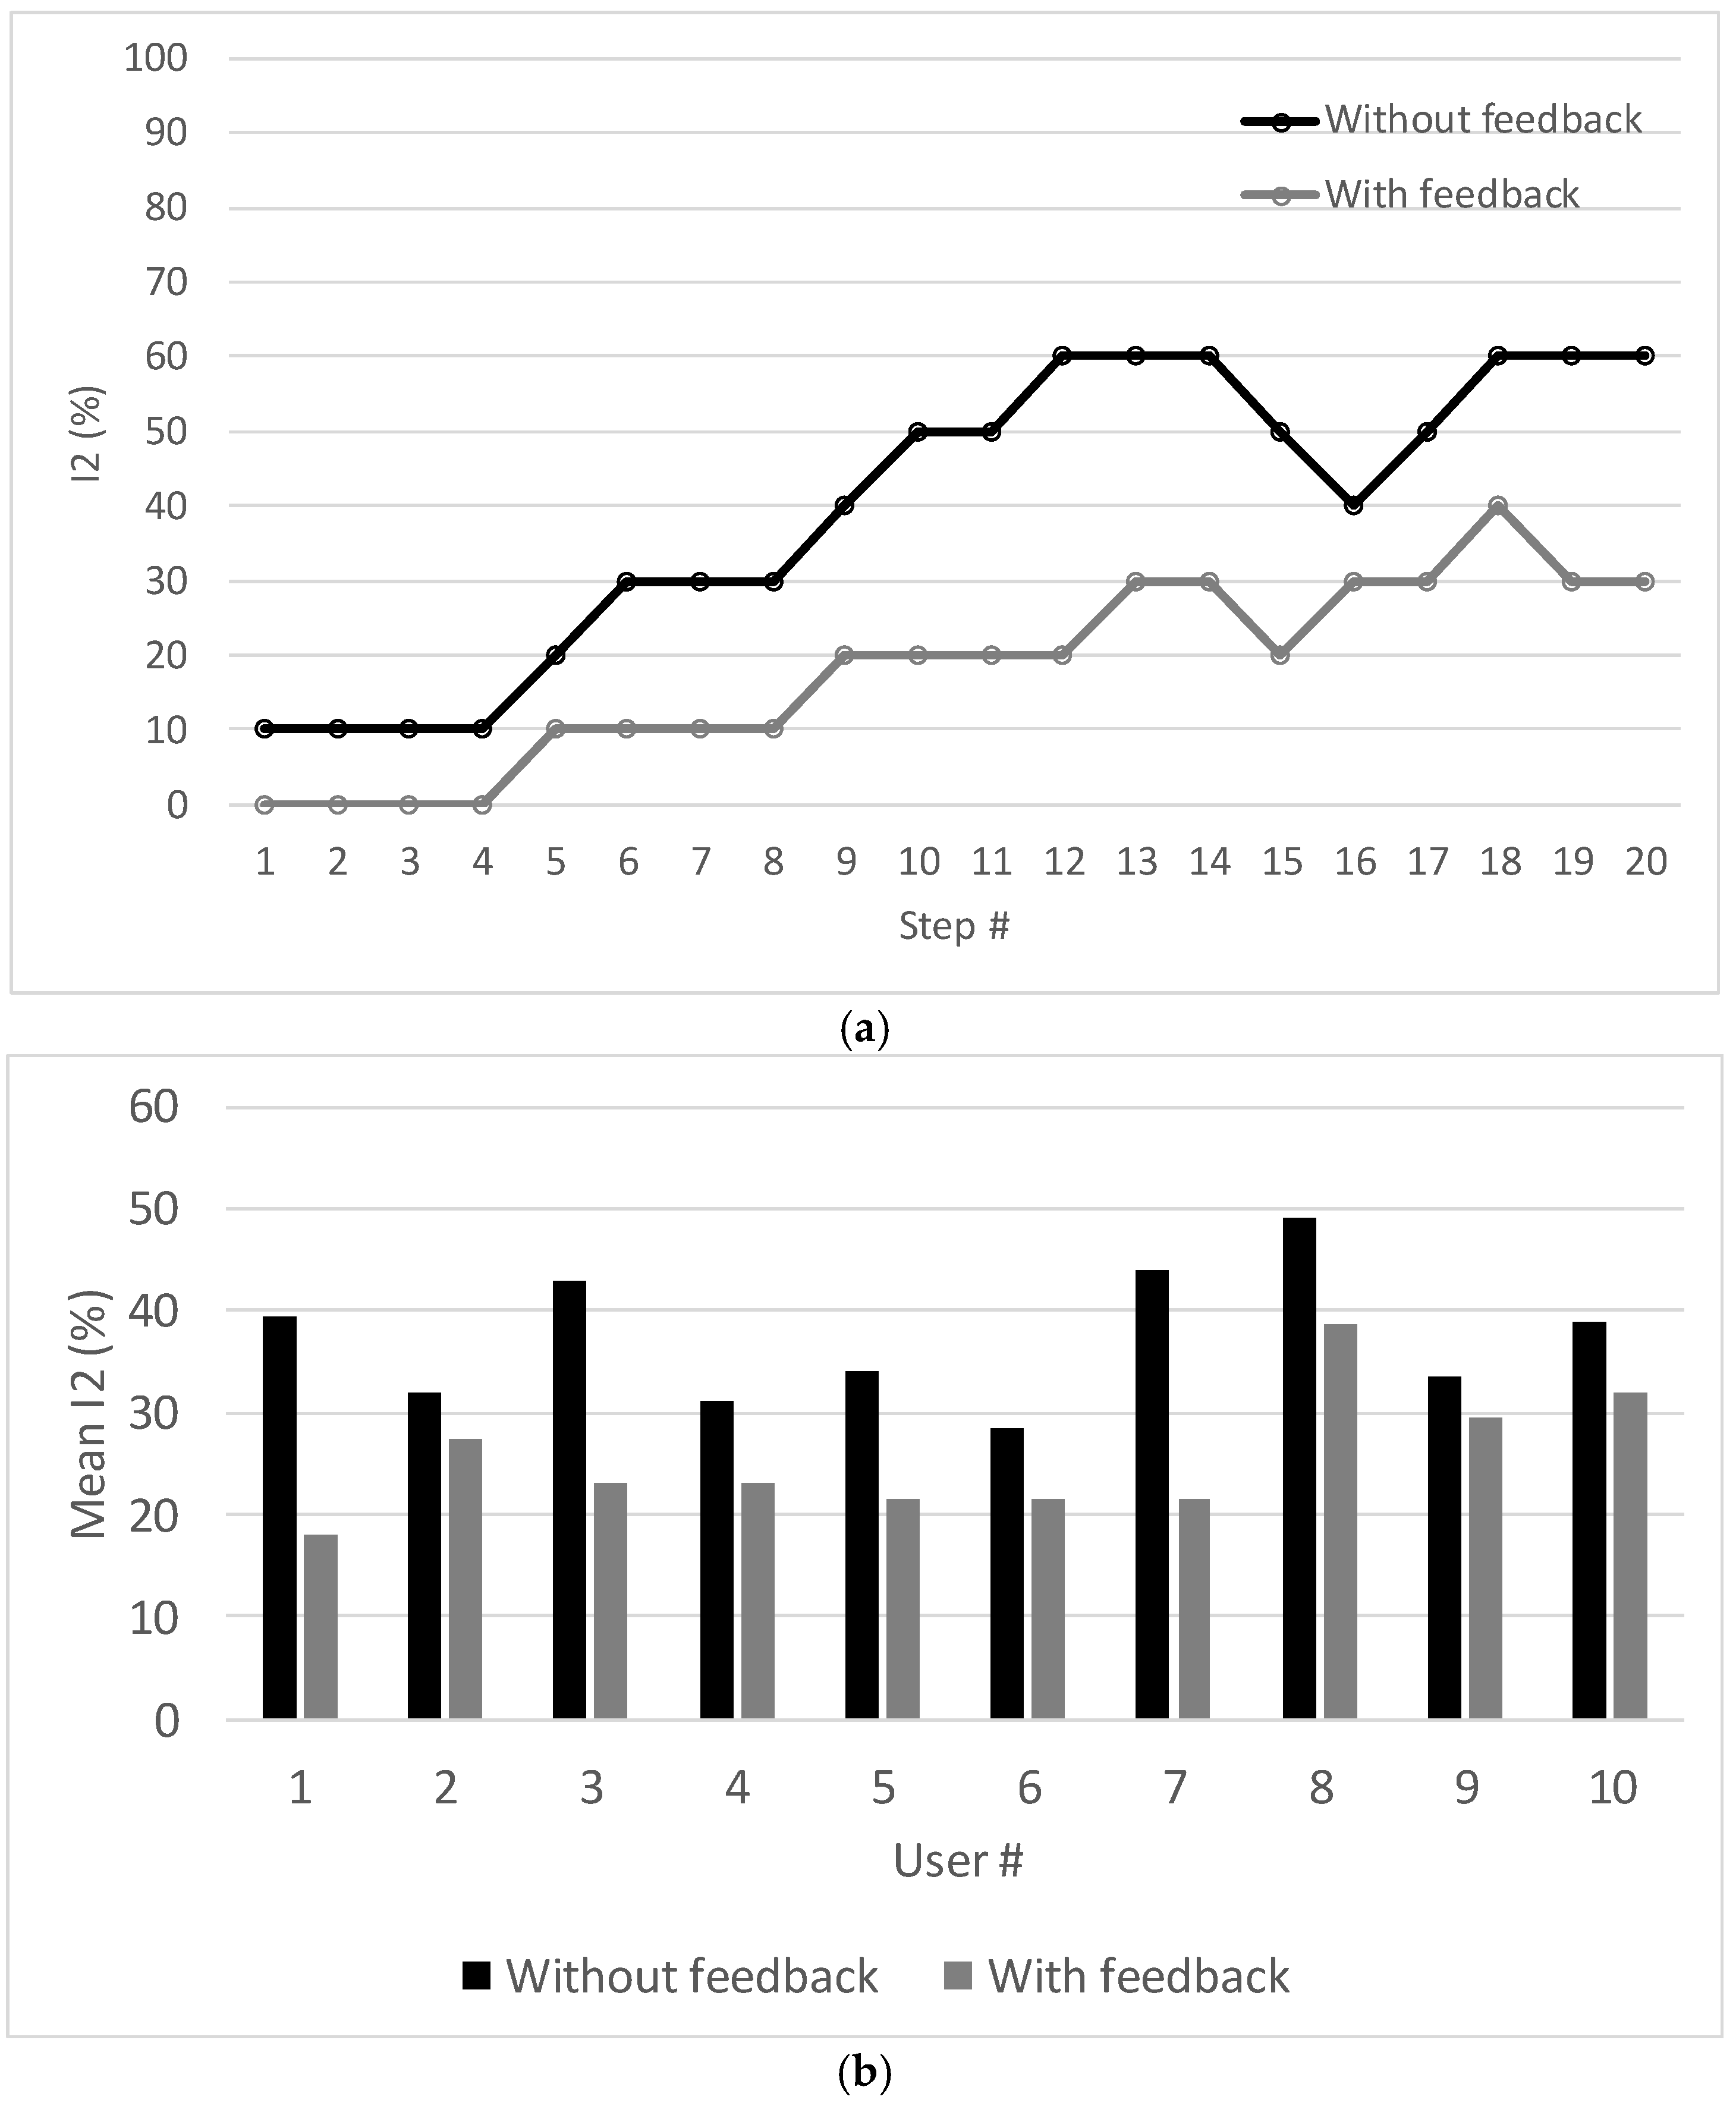
4.3. Computation of I2 (Assessment of Motor Incoordination)
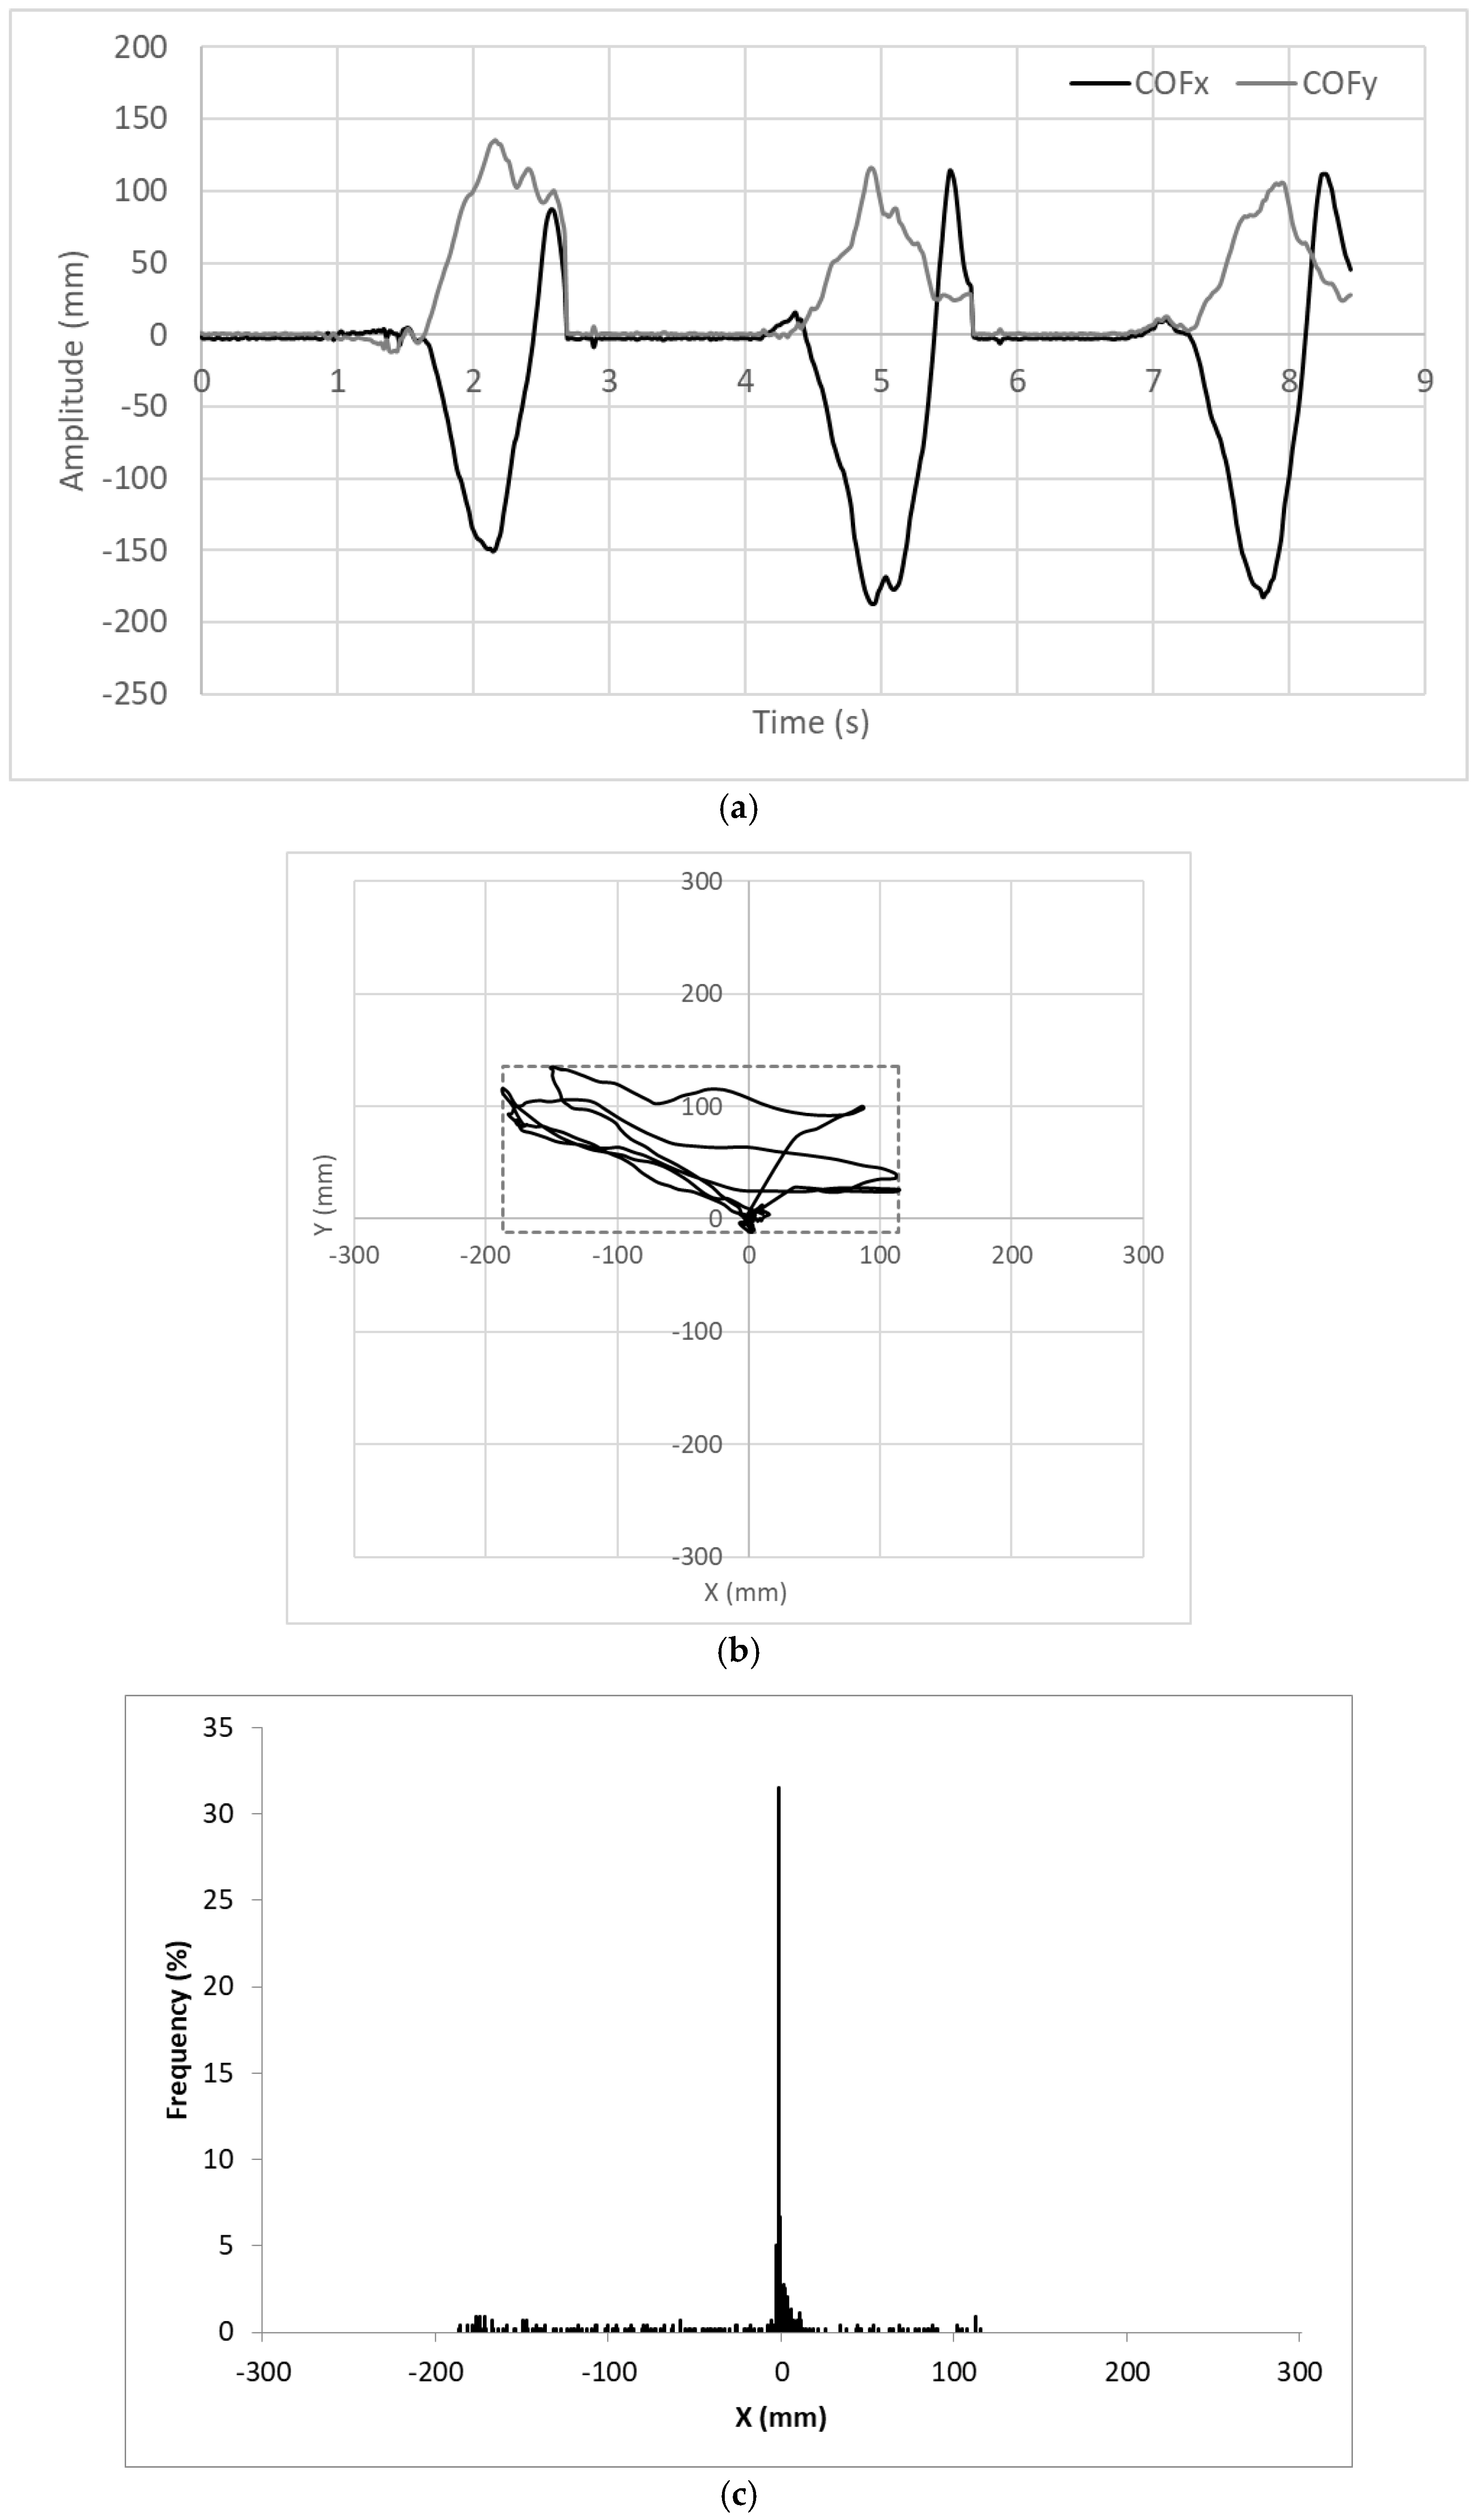
4.4. COF Trajectories
4.5. LIDAR Measurements
5. Conclusions
Acknowledgments
Author Contributions
Conflicts of Interest
References
- Werner, C.A. The Older Population: 2010. 2010 Census Briefs, U.S. Census Bureau. Available online: https://www.census.gov/prod/cen2010/briefs/c2010br-09.pdf (accessed on 1 November 2017).
- Taylor, A.W.; Michael, J.J. Physiology of Exercise and Healthy Aging; Human Kinetics: Champaign, IL, USA, 2008; ISBN 978-0-7360-5838-4. [Google Scholar]
- Older Americans 2008: Key Indicators of Well-Being. Federal Interagency Forum on Aging-Related Statistics. Available online: https://agingstats.gov/docs/PastReports/2008/OA2008.pdf (accessed on 1 November 2017).
- The Demographic Future of Europe—From Challenge to Opportunity. European Commission. Available online: http://europa.eu/legislation_summaries/employment_and_social_policy/situation_in_europe/c10160_en.htm (accessed on 1 November 2017).
- Faruqui, S.R.; Jaeblon, T. Ambulatory Assistive Devices in Orthopedics: Uses and Modifications. J. Am. Acad. Orthop. Surg. 2010, 18, 41–50. [Google Scholar] [CrossRef] [PubMed]
- NTT DATA. Americas White Paper: Trends in Telehealth; NTT DATA: Tokyo, Japan, 2013. [Google Scholar]
- Bateni, H.; Maki, B.E. Assistive Devices for Balance and Mobility: Benefits, Demands and Adverse Consequences. Arch. Phys. Med. Rehabilit. 2005, 86, 134–145. [Google Scholar] [CrossRef]
- Stevens, J.A.; Thomas, K.; Teh, L.; Greenspan, A.I. Unintentional fall injuries associated with walkers and canes in older adults treated in U.S. emergency departments. J. Am. Geriatr. Soc. 2009, 57, 1464–1469. [Google Scholar] [CrossRef] [PubMed]
- Gitlin, L.; Burgh, D. Issuing assistive devices to older patients in rehabilitation: An exploratory study. Am. J. Occup. Ther. 1995, 49, 994–1000. [Google Scholar] [CrossRef] [PubMed]
- Ely, D.D.; Smidt, G.L. Effect of cane on variables of gait for patients with hip disorders. Phys. Ther. 1977, 57, 507–512. [Google Scholar] [CrossRef] [PubMed]
- Alwan, M.; Ledoux, A.; Wasson, G.; Sheth, P.; Huang, C. Basic walker-assisted gait characteristics derived from forces and moments exerted on the walker’s handles: Results on normal subjects. Med. Eng. Phys. 2007, 29, 380–389. [Google Scholar] [CrossRef] [PubMed]
- Muro-de-la-Herran, A.; Garcia-Zapirain, B.; Mendez-Zorrilla, A. Gait analysis methods: An overview of wearable and non-wearable systems, highlighting clinical applications. Sensors 2014, 14, 3362–3394. [Google Scholar] [CrossRef] [PubMed]
- DeLisa, J.A. Gait Analysis in the Science of Rehabilitation; U.S. Department of Veteran Affairs: Washington, DC, USA, 1998.
- Sardini, E.; Serpelloni, M.; Lancini, M. Wireless instrumented crutches for force and movement measurements for gait monitoring. IEEE Trans. Instrum. Meas. 2015, 64, 3369–3379. [Google Scholar] [CrossRef]
- Keadle, S.K.; Shiroma, E.J.; Freedson, P.S.; Lee, I.M. Impact of accelerometer data processing decisions on the sample size, wear time and physical activity level of a large cohort study. BMC Public Health 2014, 14, 1210. [Google Scholar] [CrossRef] [PubMed] [Green Version]
- Lee, I.M.; Shiroma, E.J. Using accelerometers to measure physical activity in large-scale epidemiological studies: Issues and challenges. Br. J. Sports Med. 2014, 48, 197–201. [Google Scholar] [CrossRef] [PubMed]
- Mâsse, L.C.; Furmmeler, B.F.; Anderson, C.B.; Matthews, C.E.; Trost, S.G.; Catellier, D.J.; Treuth, M. Accelerometer data reduction: A comparison of four reduction algorithms on select outcome variables. Med. Sci. Sports Exerc. 2005, 37, S544–S554. [Google Scholar] [CrossRef] [PubMed]
- Postolache, O.; Girão, P.S.; Postolache, G.; Mendes, G. Cardio-respiratory and daily activity monitor based on FMCW Doppler radar embedded in a wheelchair. In Proceedings of the 33rd Annual International Conference of the IEEE Engineering in Medicine and Biology Society, Boston, MA, USA, 30 August–3 September 2011; pp. 1917–1920. [Google Scholar]
- Postolache, G.; Girão, P.S.; Postolache, O. Applying smartphone apps to drive greater patient engagement and personalized physiotherapy. In Proceedings of the IEEE International Symposium on Medical Measurements and Applications (MeMeA), Lisbon, Portugal, 11–12 June 2014; pp. 1–6. [Google Scholar]
- Ekimov, A.; Sabatier, J.M. Human motion analyses using footstep ultrasound and Doppler ultrasound. J. Acoust. Soc. Am. 2008, 123, 149–154. [Google Scholar] [CrossRef] [PubMed]
- Cai, X.; Han, G.; Song, X.; Wang, J. Single-camera-based method for step length symmetry measurement in unconstrained elderly home monitoring. IEEE Trans. Biomed. Eng. 2017, 64, 2618–2627. [Google Scholar] [CrossRef] [PubMed]
- Cai, X.; Han, G.; Wang, J. Assessment of gait parameters during unconstrained straight-line walking using single camera. In Proceedings of the IEEE 7th International Conference on Awareness Science and Technology (iCAST), Qinhuangdao, China, 22–24 September 2015. [Google Scholar]
- Pereira, J.M.D.; Viegas, V.; Postolache, O.; Girão, P.S. Combining distance and force measurements to monitor the usage of walker assistive devices. In Proceedings of the Instrumentation and Measurement Technology Conference (I2MTC), Torino, Italy, 22–25 May 2017; Volume 1, pp. 11–16. [Google Scholar]
- Pereira, J.M.D.; Postolache, O.; Viegas, V.; Girão, P.S. A low-cost measurement system to extract kinematic parameters from walker devices. In Proceedings of the Instrumentation and Measurement Technology Conference (I2MTC), Pisa, Italy, 11–14 May 2015; Volume 1, pp. 1991–1996. [Google Scholar]
- Winter, D.A. Biomechanics of normal and pathological gait: Implications for understanding human locomotor control. J. Motor Behav. 1989, 21, 337–355. [Google Scholar] [CrossRef]
- Winter, D.A. Kinematic and Kinetic patterns in human gait: Variability and compensating effects. J. Hum. Mov. Sci. 1984, 3, 51–76. [Google Scholar] [CrossRef]
- Caminador de incorporación. Available online: http://ayudasdinamicas.com/caminador-de-incorporacion (accessed on 1 November 2017).
- LIDAR-Lite v3. Available online: http://buy.garmin.com/en-US/US/p/557294 (accessed on 1 November 2017).
- Bluno Nano—An Arduino Nano with Bluetooth 4.0. Available online: http://dfrobot.com/product-1122.html (accessed on 1 November 2017).
- Spenko, M.; Yu, H.; Dubowsky, S. Robotic personal aids for mobility and monitoring for the elderly. IEEE Trans. Neural Syst. Rehabilit. Eng. 2003, 14, 344–351. [Google Scholar] [CrossRef] [PubMed]
- McQuade, K.J.; Finley, M.; Oliveira, A. Upper extremity joint stresses during walker-assisted ambulation in post-surgical patients. Revista Brasileira de Fisioterapia 2011, 15, 332–337. [Google Scholar] [CrossRef] [PubMed]


© 2018 by the authors. Licensee MDPI, Basel, Switzerland. This article is an open access article distributed under the terms and conditions of the Creative Commons Attribution (CC BY) license (http://creativecommons.org/licenses/by/4.0/).
Share and Cite
Viegas, V.; Dias Pereira, J.M.; Postolache, O.; Girão, P.S. Monitoring Walker Assistive Devices: A Novel Approach Based on Load Cells and Optical Distance Measurements. Sensors 2018, 18, 540. https://doi.org/10.3390/s18020540
Viegas V, Dias Pereira JM, Postolache O, Girão PS. Monitoring Walker Assistive Devices: A Novel Approach Based on Load Cells and Optical Distance Measurements. Sensors. 2018; 18(2):540. https://doi.org/10.3390/s18020540
Chicago/Turabian StyleViegas, Vítor, J. M. Dias Pereira, Octavian Postolache, and Pedro Silva Girão. 2018. "Monitoring Walker Assistive Devices: A Novel Approach Based on Load Cells and Optical Distance Measurements" Sensors 18, no. 2: 540. https://doi.org/10.3390/s18020540
APA StyleViegas, V., Dias Pereira, J. M., Postolache, O., & Girão, P. S. (2018). Monitoring Walker Assistive Devices: A Novel Approach Based on Load Cells and Optical Distance Measurements. Sensors, 18(2), 540. https://doi.org/10.3390/s18020540