An Improved Method for Magnetic Nanocarrier Drug Delivery across the Cell Membrane


Abstract
:1. Introduction
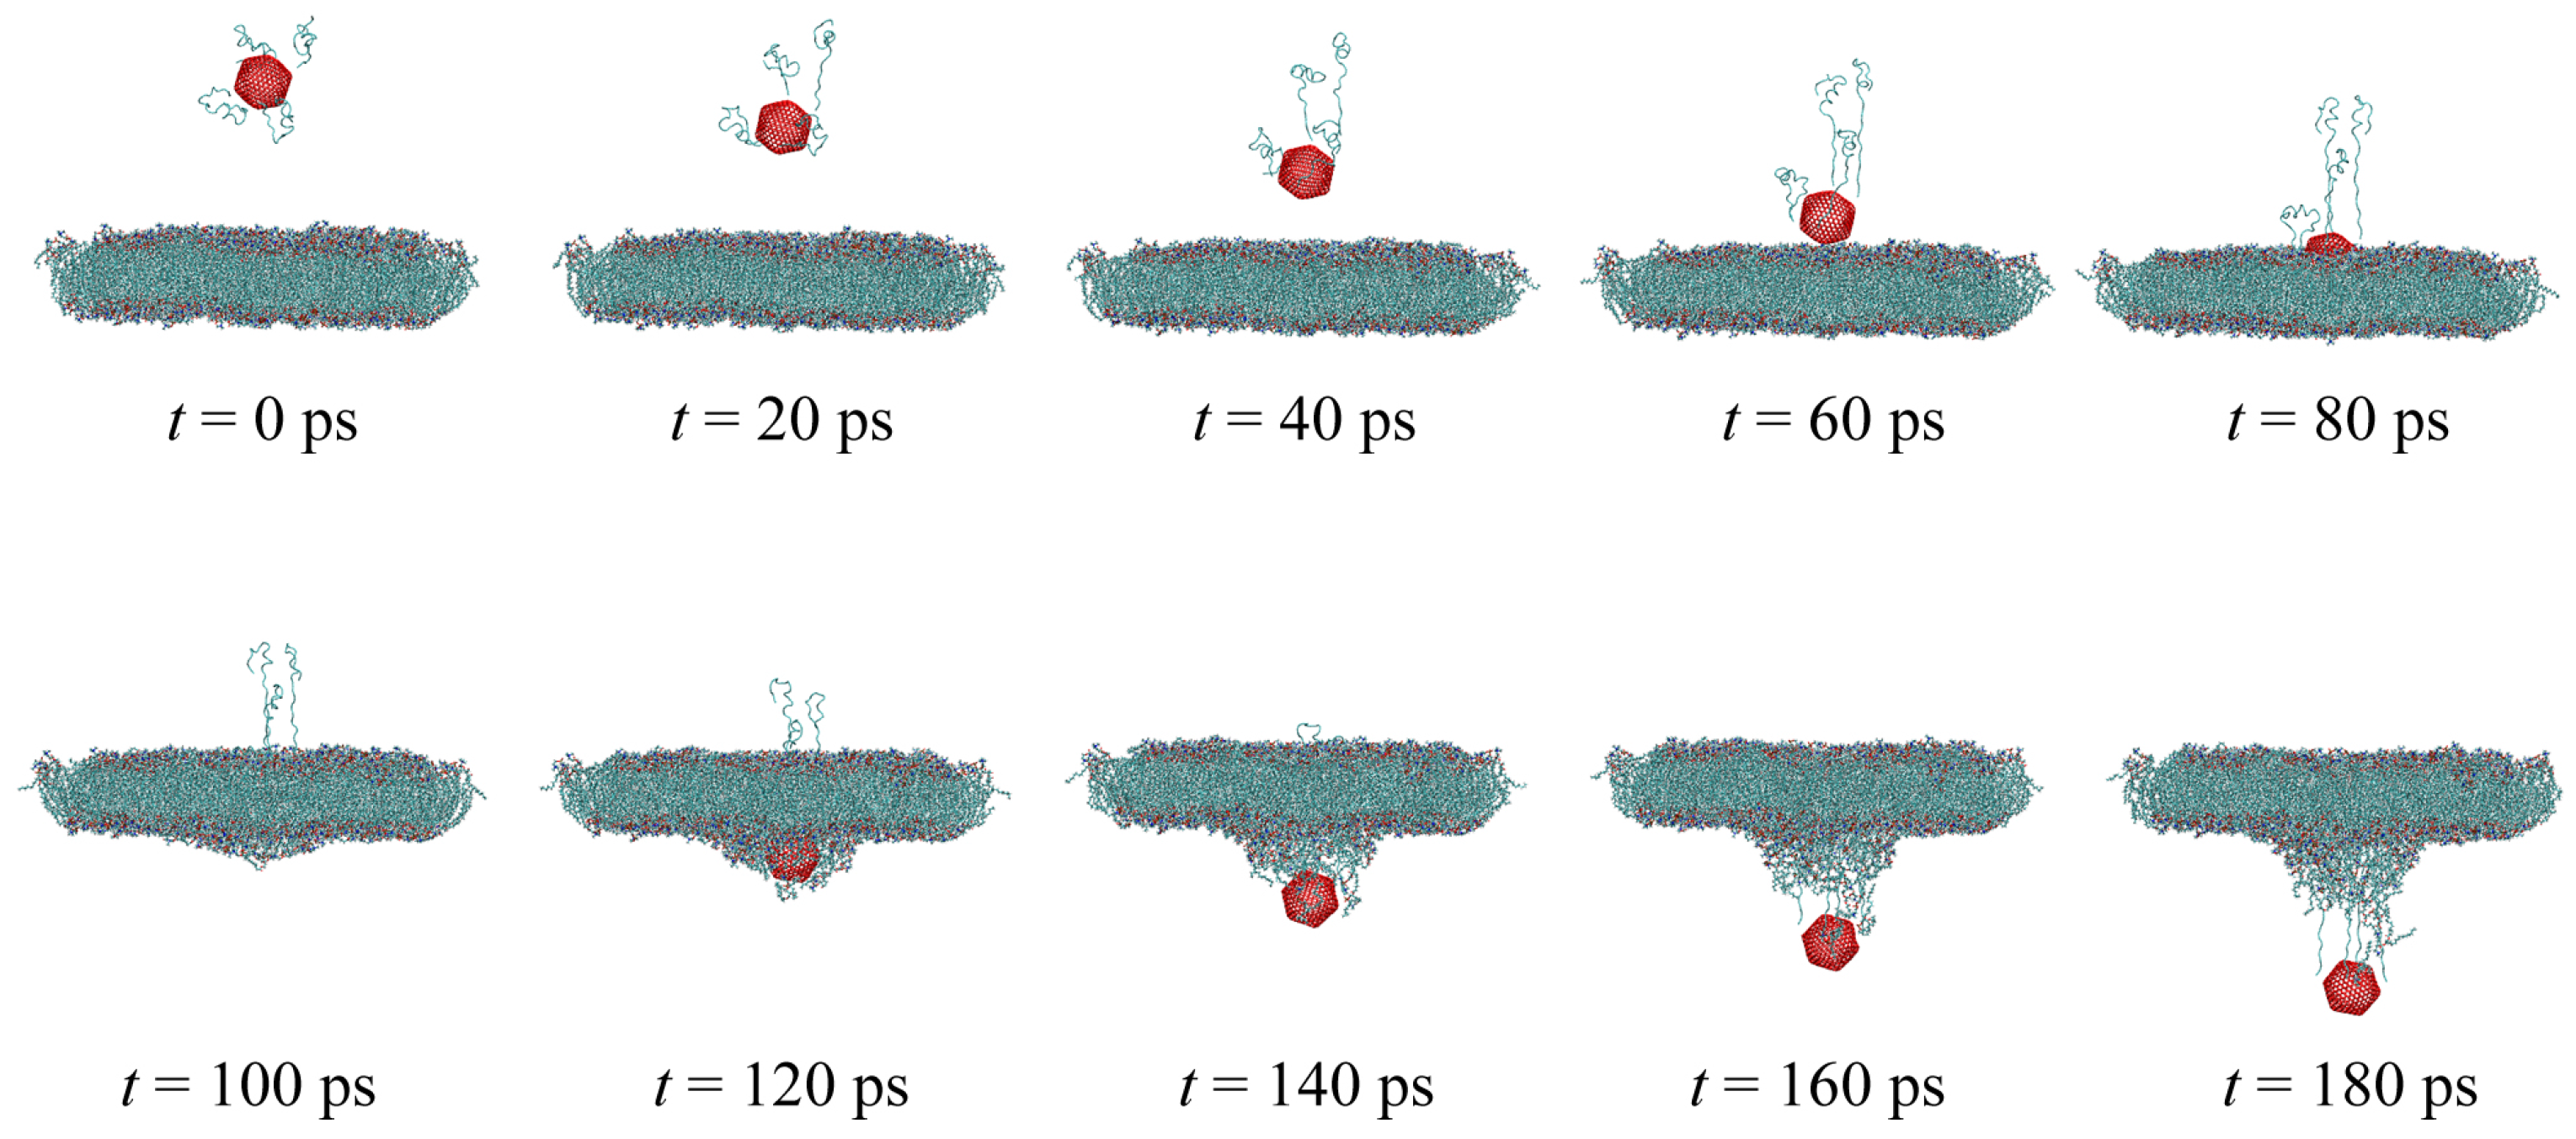
2. Methodology
3. Materials and Methods
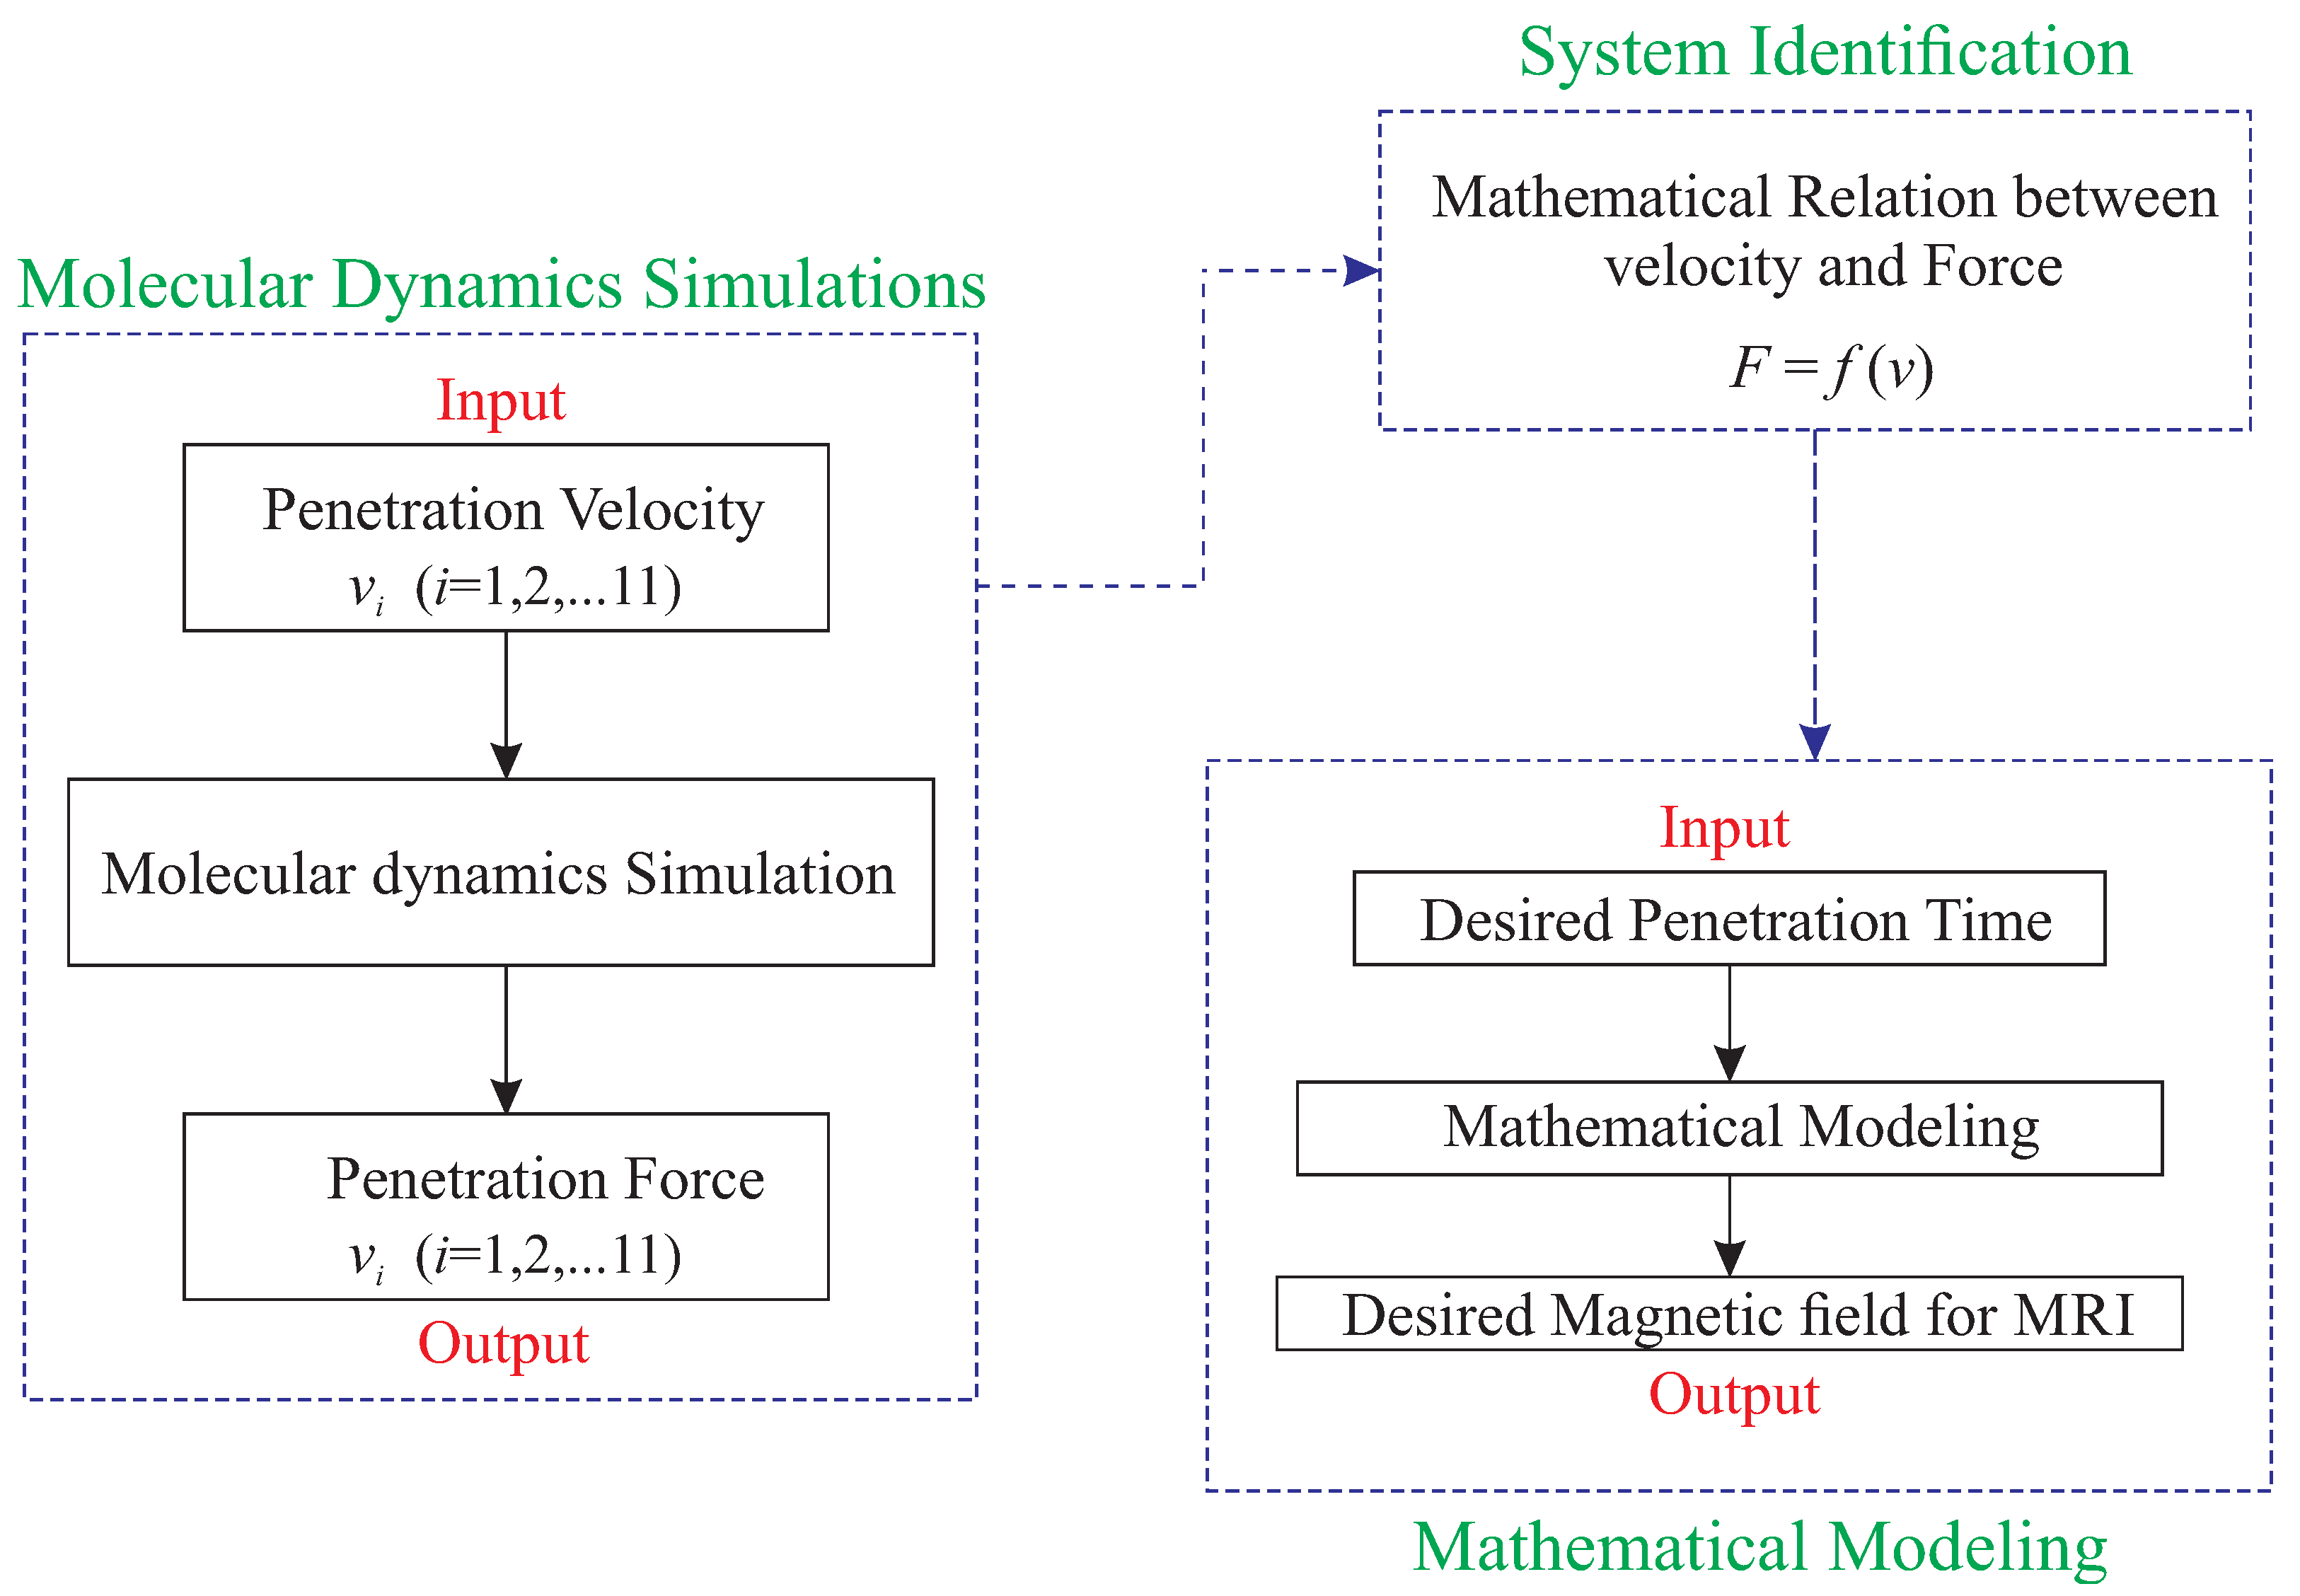
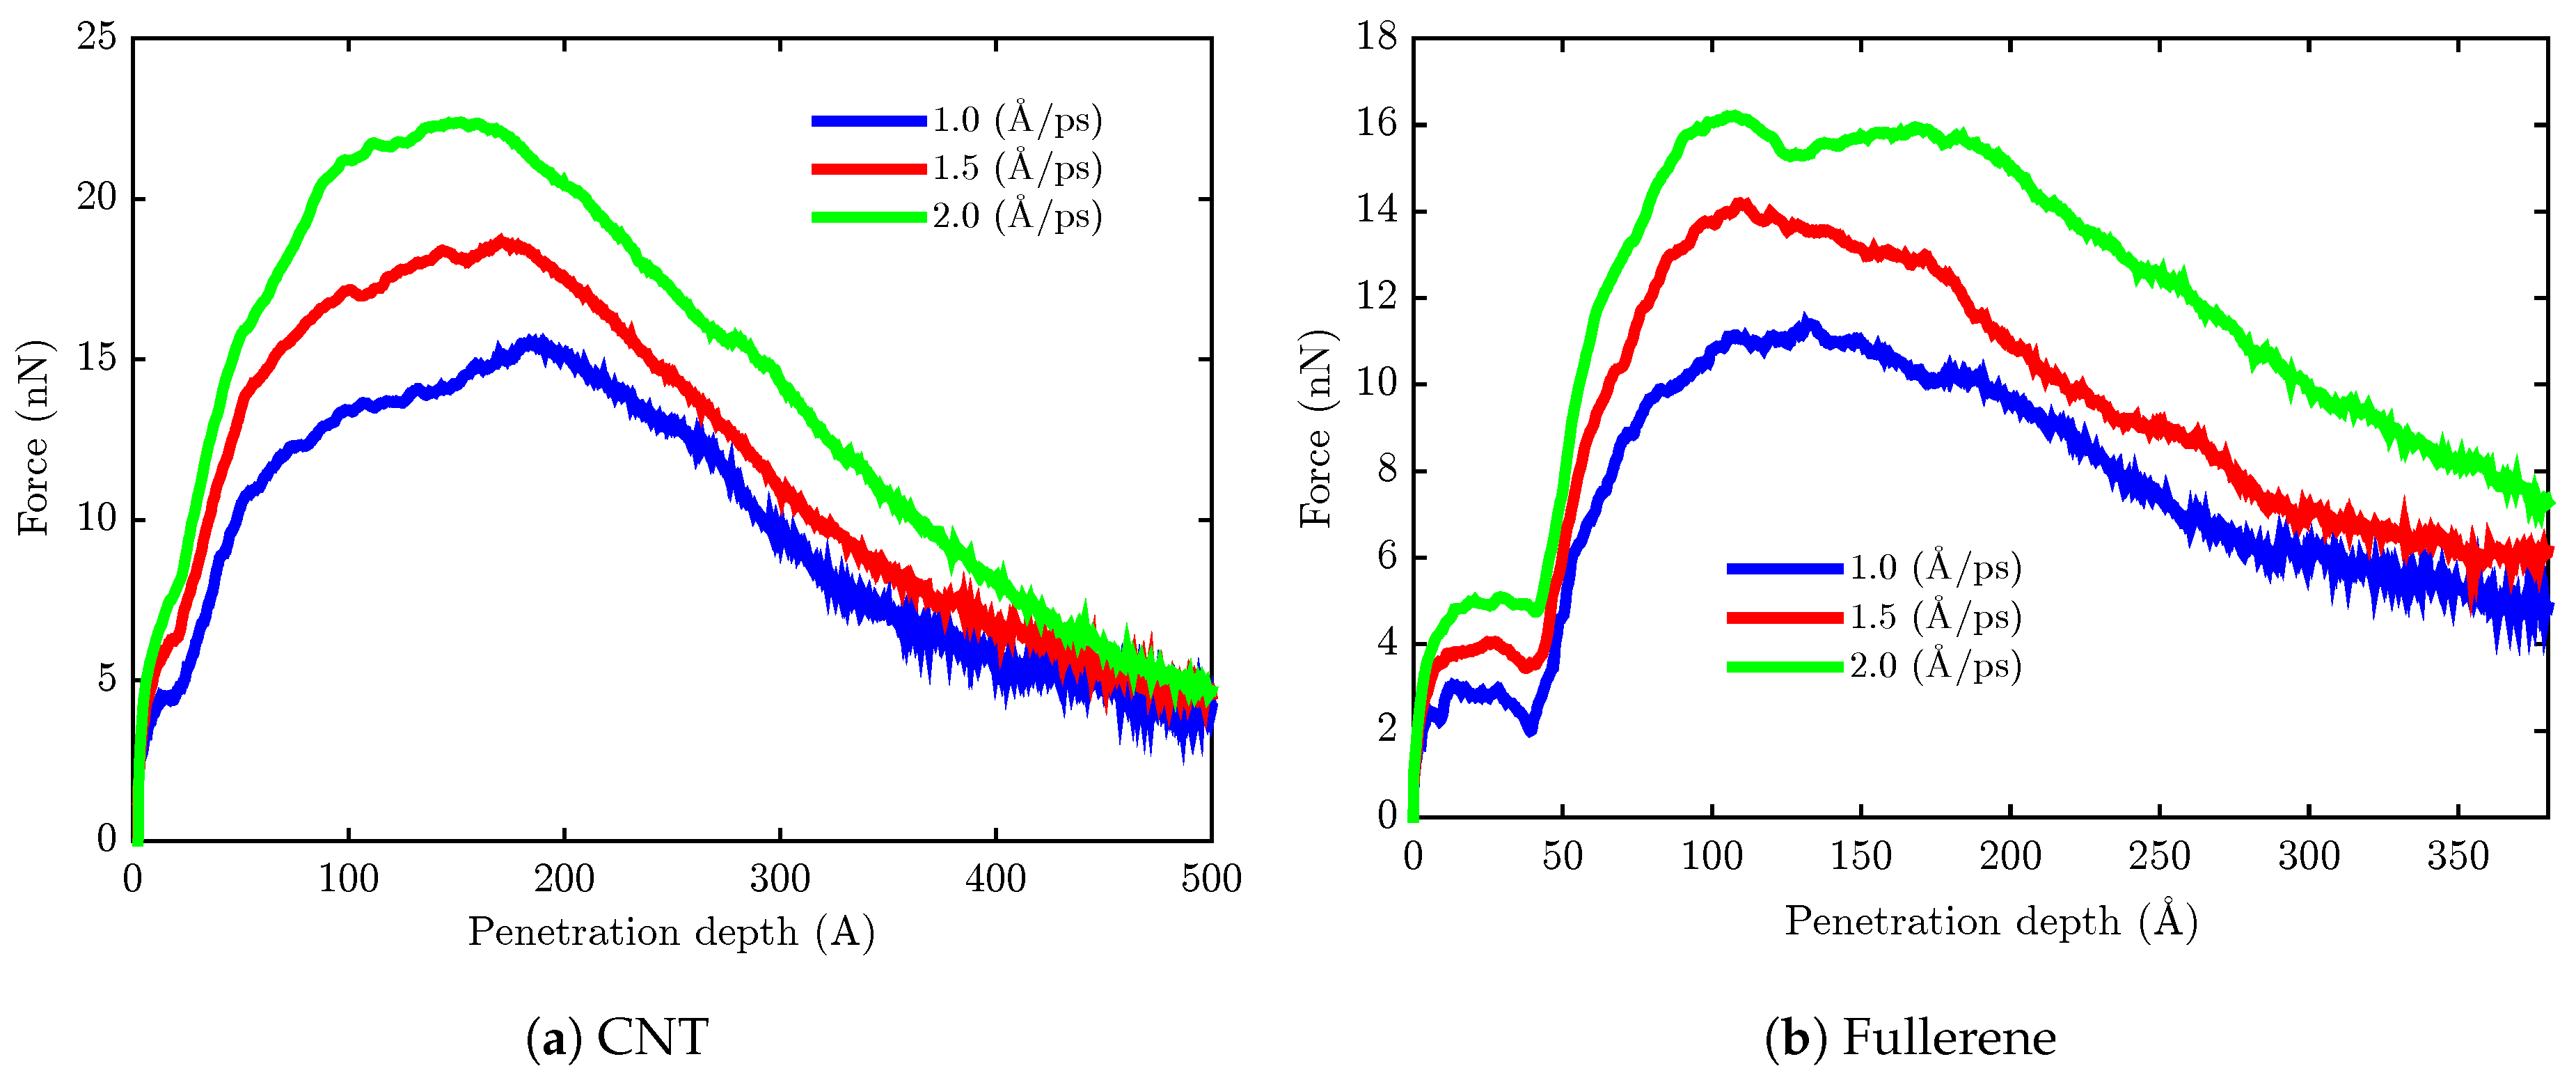
4. Mathematical Modeling and Identification of the System
4.1. Identification Methodology
- Initializing the parameters:In this section, the closest value to the parameters has to be selected according to an initial guess. Selecting the parameters could be based on physics behavior of the system.
- Updating the parameters:In this section, the parameters have to be changed to track the desired value over time in iterative steps.
4.2. Membrane System Identification
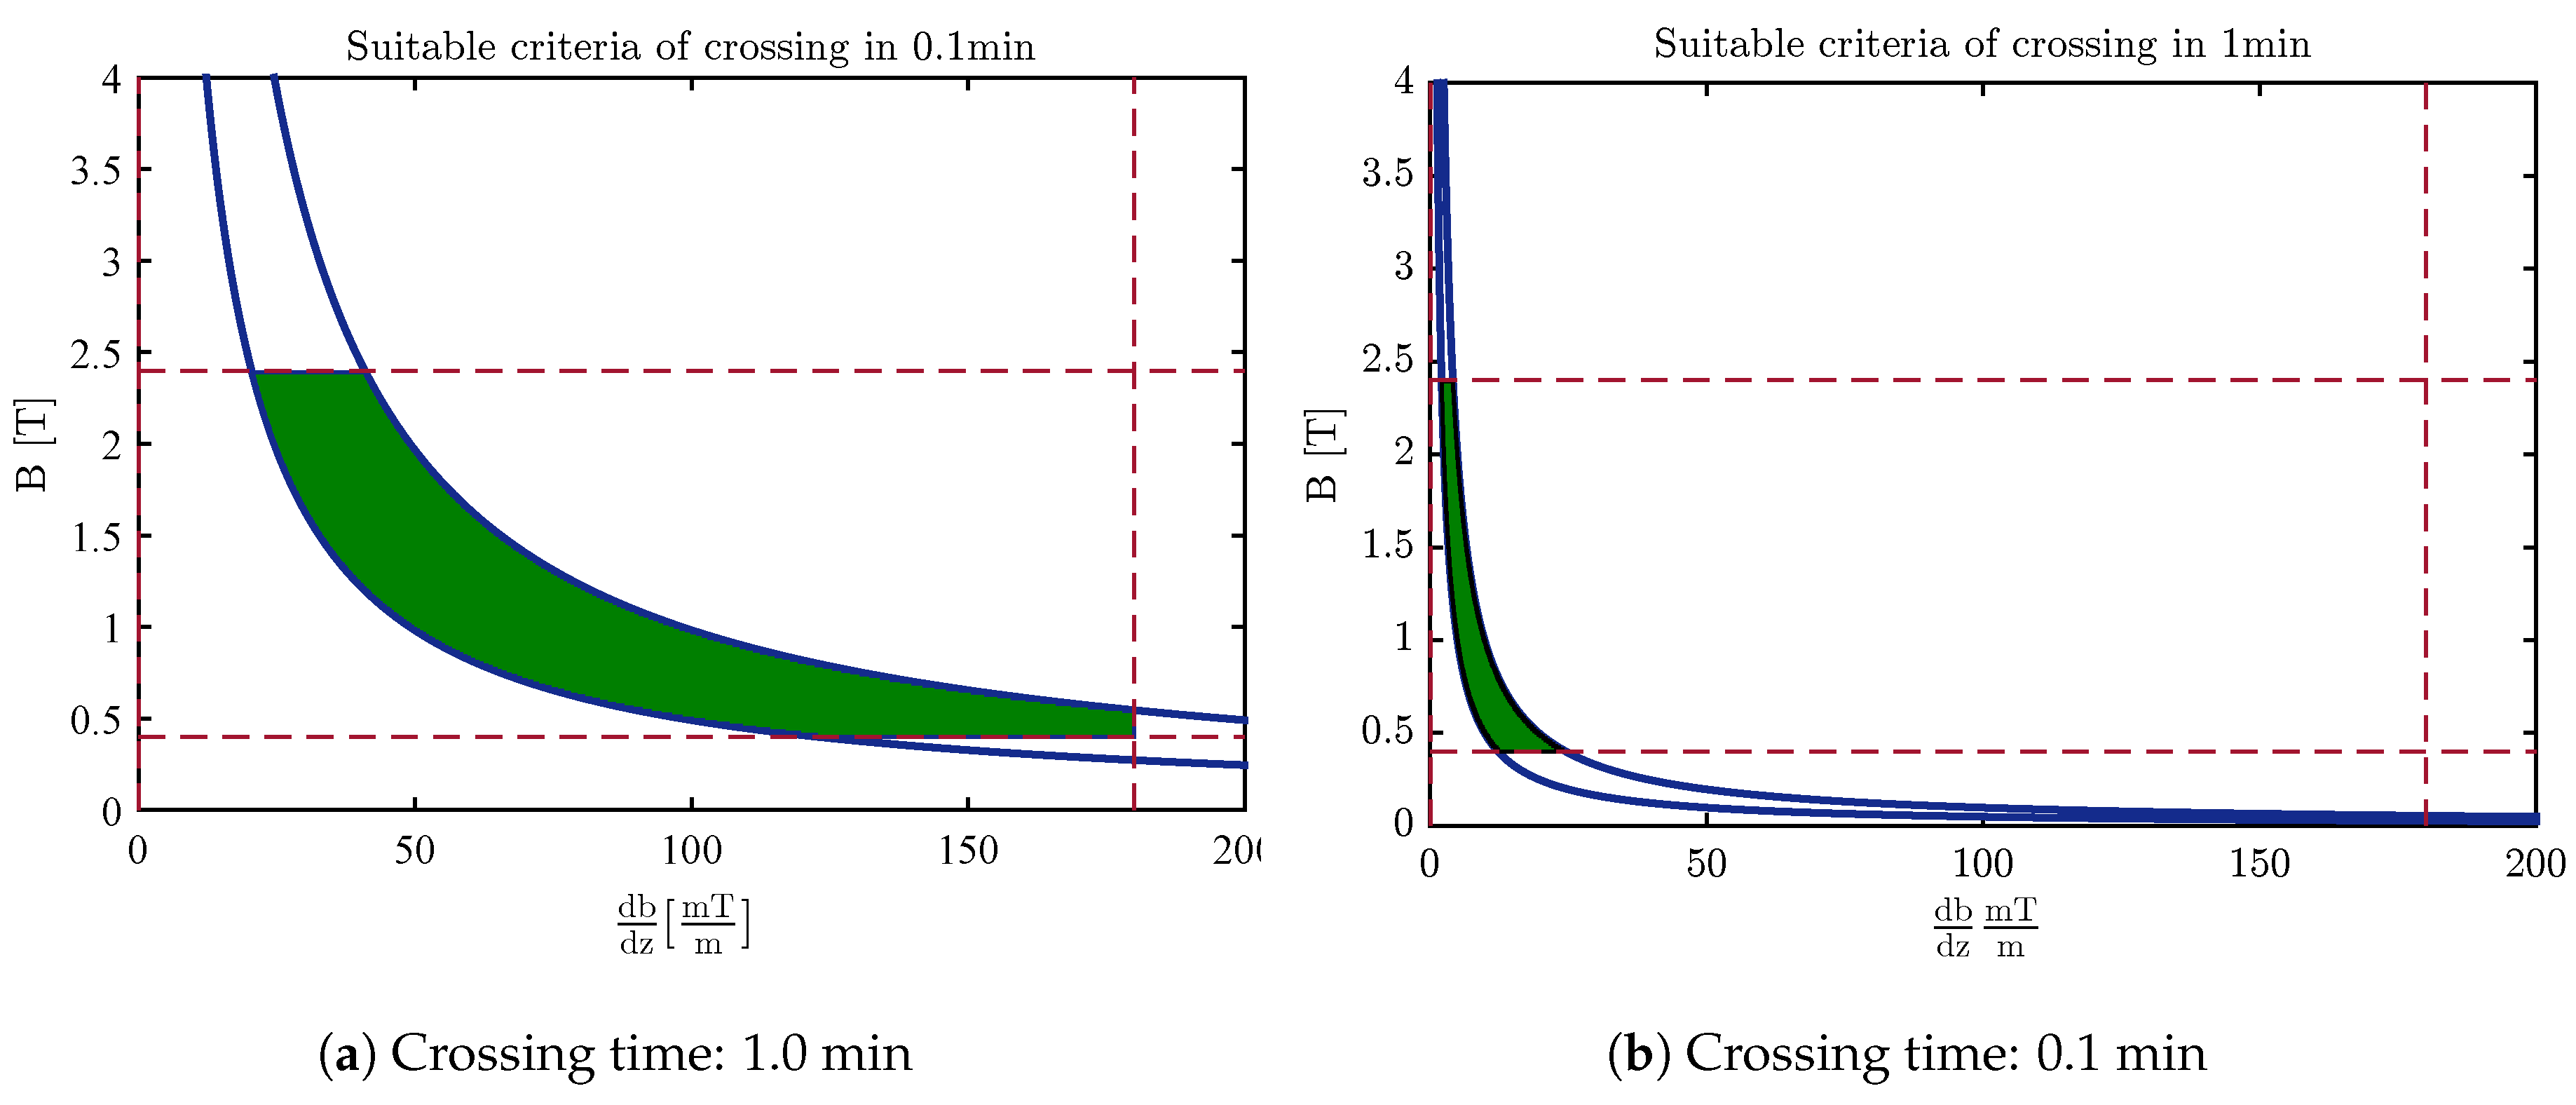
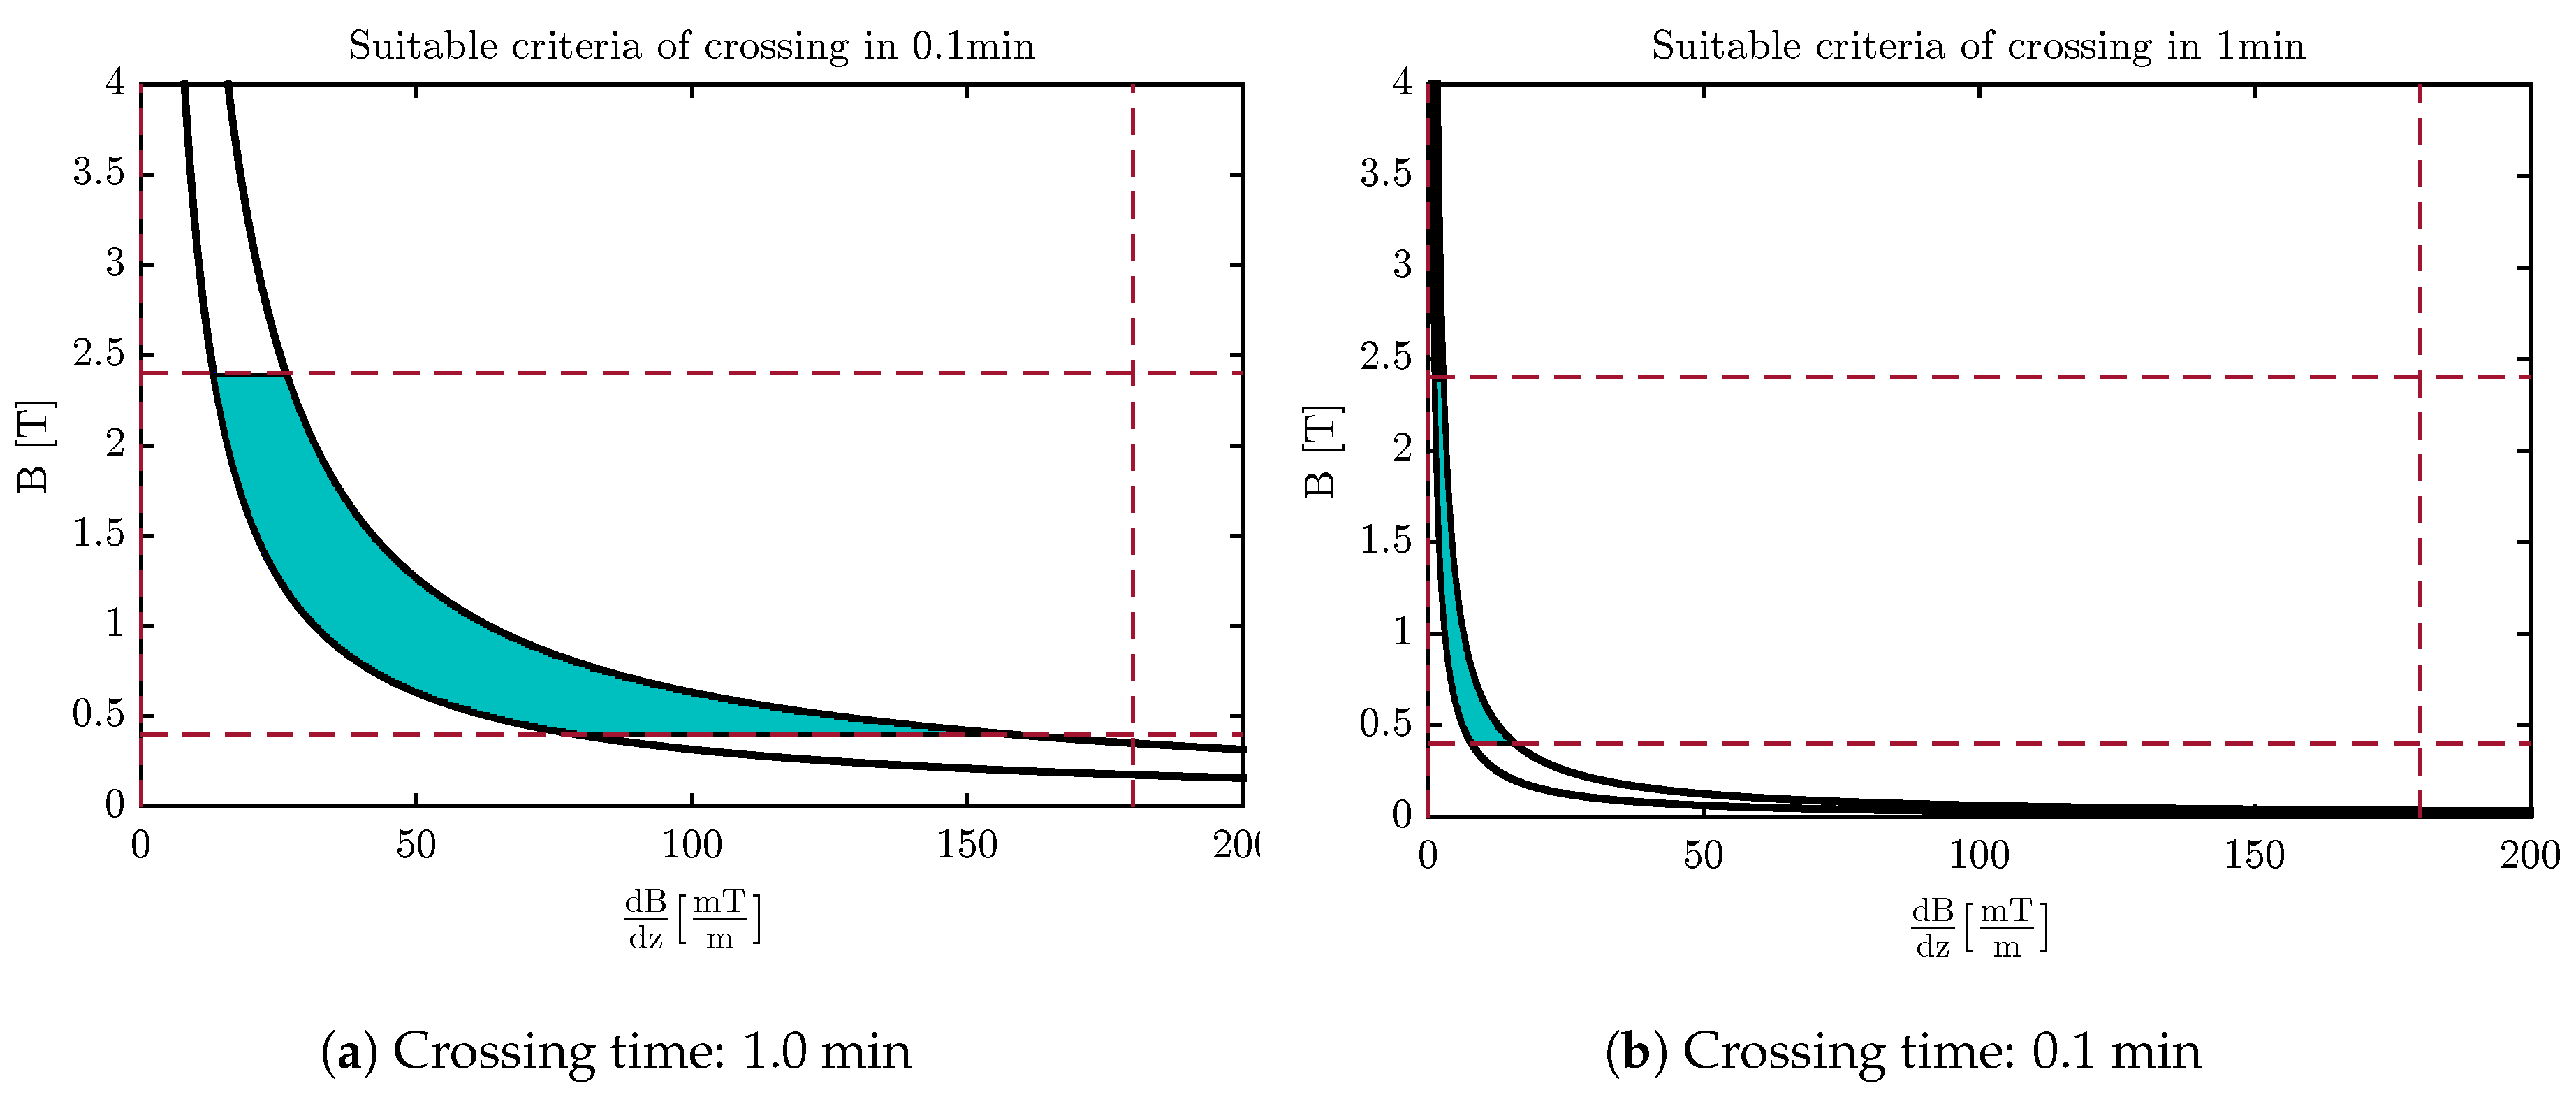
4.3. Design of the Optimal Magnetic Field for Crossing the Membrane
5. Conclusions
Author Contributions
Conflicts of Interest
References
- Yeagle, P.L. The Structure of Biological Membranes; CRC Press: Boca Raton, FL, USA, 2011. [Google Scholar]
- Strebhardt, K.; Ullrich, A. Paul Ehrlich’s magic bullet concept: 100 Years of progress. Nat. Rev. Cancer 2008, 8, 473–480. [Google Scholar] [CrossRef] [PubMed]
- Takeda, S.I.; Mishima, F.; Fujimoto, S.; Izumi, Y.; Nishijima, S. Development of magnetically targeted drug delivery system using superconducting magnet. J. Magn. Magn. Mater. 2007, 311, 367–371. [Google Scholar] [CrossRef]
- Thanh, N. Magnetic Nanoparticles: From Fabrication to Clinical Applications; Taylor & Francis: Abingdon, UK, 2012. [Google Scholar]
- Martel, S.; Mohammadi, M.; Felfoul, O.; Lu, Z.; Pouponneau, P. Flagellated magnetotactic bacteria as controlled MRI-trackable propulsion and steering systems for medical nanorobots operating in the human microvasculature. Int. J. Robot. Res. 2009, 28, 571–582. [Google Scholar] [CrossRef] [PubMed]
- Mathieu, J.B.; Martel, S. Magnetic microparticle steering within the constraints of an MRI system: Proof of concept of a novel targeting approach. Biomed. Microdevices 2007, 9, 801–808. [Google Scholar] [CrossRef] [PubMed]
- Nacev, A.; Beni, C.; Bruno, O.; Shapiro, B. Magnetic nanoparticle transport within flowing blood and into surrounding tissue. Nanomedicine 2010, 5, 1459–1466. [Google Scholar] [CrossRef] [PubMed]
- Nacev, A.; Beni, C.; Bruno, O.; Shapiro, B. The behaviors of ferromagnetic nanoparticles in and around blood vessels under applied magnetic fields. J. Magn. Magn. Mater. 2011, 323, 651–668. [Google Scholar] [CrossRef] [PubMed]
- Agiotis, L.; Theodorakos, I.; Samothrakitis, S.; Papazoglou, S.; Zergioti, I.; Raptis, Y. Magnetic manipulation of superparamagnetic nanoparticles in a microfluidic system for drug delivery applications. J. Magn. Magn. Mater. 2016, 401, 956–964. [Google Scholar] [CrossRef]
- Kılınç, E. γ-Fe2O3 magnetic nanoparticle functionalized with carboxylated multi walled carbon nanotube: Synthesis, characterization, analytical and biomedical application. J. Magn. Magn. Mater. 2016, 401, 949–955. [Google Scholar] [CrossRef]
- Pour, S.A.; Shaterian, H.R.; Afradi, M.; Yazdani-Elah-Abadi, A. Carboxymethyl Cellulose (CMC)-loaded Co-Cu Doped Manganese Ferrite Nanorods as a New Dual-Modal Simultaneous Contrast Agent for Magnetic Resonance Imaging and Nanocarrier for Drug Delivery System. J. Magn. Magn. Mater. 2017, 438, 85–94. [Google Scholar] [CrossRef]
- Mair, L.; Evans, B.; Nacev, A.; Stepanov, P.; Hilaman, R.; Chowdhury, S.; Jafari, S.; Wang, W.; Shapiro, B.; Weinberg, I. Magnetic microkayaks: Propulsion of microrods precessing near a surface by kilohertz frequency, rotating magnetic fields. Nanoscale 2017, 9, 3375–3381. [Google Scholar] [CrossRef] [PubMed]
- Katagiri, K.; Nakamura, M.; Koumoto, K. Magnetoresponsive smart capsules formed with polyelectrolytes, lipid bilayers and magnetic nanoparticles. ACS Appl. Mater. Interfaces 2010, 2, 768–773. [Google Scholar] [CrossRef] [PubMed]
- Nitin, N.; LaConte, L.; Zurkiya, O.; Hu, X.; Bao, G. Functionalization and peptide-based delivery of magnetic nanoparticles as an intracellular MRI contrast agent. JBIC J. Biol. Inorg. Chem. 2004, 9, 706–712. [Google Scholar] [CrossRef] [PubMed]
- Veiseh, O.; Sun, C.; Gunn, J.; Kohler, N.; Gabikian, P.; Lee, D.; Bhattarai, N.; Ellenbogen, R.; Sze, R.; Hallahan, A. Optical and MRI multifunctional nanoprobe for targeting gliomas. Nano Lett. 2005, 5, 1003–1008. [Google Scholar] [CrossRef] [PubMed]
- Mathieu, J.B.; Beaudoin, G.; Martel, S. Method of propulsion of a ferromagnetic core in the cardiovascular system through magnetic gradients generated by an MRI system. Biomed. Eng. IEEE Trans. 2006, 53, 292–299. [Google Scholar] [CrossRef] [PubMed]
- Nasongkla, N.; Bey, E.; Ren, J.; Ai, H.; Khemtong, C.; Guthi, J.S.; Chin, S.F.; Sherry, A.D.; Boothman, D.A.; Gao, J. Multifunctional polymeric micelles as cancer-targeted, MRI-ultrasensitive drug delivery systems. Nano Lett. 2006, 6, 2427–2430. [Google Scholar] [CrossRef] [PubMed]
- Nacev, A.; Weinberg, I.; Stepanov, P.; Kupfer, S.; Mair, L.; Urdaneta, M.; Shimoji, M.; Fricke, S.; Shapiro, B. Dynamic inversion enables external magnets to concentrate ferromagnetic rods to a central target. Nano Lett. 2014, 15, 359–364. [Google Scholar] [CrossRef] [PubMed]
- Makarucha, A.; Todorova, N.; Yarovsky, I. Nanomaterials in biological environment: A review of computer modelling studies. Eur. Biophys. J. 2011, 40, 103–115. [Google Scholar] [CrossRef] [PubMed]
- Bianco, A.; Kostarelos, K.; Prato, M. Applications of carbon nanotubes in drug delivery. Curr. Opin. Chem. Biol. 2005, 9, 674–679. [Google Scholar] [CrossRef] [PubMed]
- Lacerda, L.; Raffa, S.; Prato, M.; Bianco, A.; Kostarelos, K. Cell-penetrating CNTs for delivery of therapeutics. Nano Today 2007, 2, 38–43. [Google Scholar] [CrossRef]
- Vashist, S.K.; Zheng, D.; Pastorin, G.; Al-Rubeaan, K.; Luong, J.H.; Sheu, F.S. Delivery of drugs and biomolecules using carbon nanotubes. Carbon 2011, 49, 4077–4097. [Google Scholar] [CrossRef]
- Lelimousin, M.; Sansom, M.S. Membrane perturbation by carbon nanotube insertion: Pathways to internalization. Small 2013, 9, 3639–3646. [Google Scholar] [CrossRef] [PubMed]
- Mahboobi, S.H.; Taheri, A.; Pishkenari, H.N.; Meghdari, A.; Hemmat, M. Cellular Injection Using Carbon Nanotube: A Molecular Dynamics Study. Nano 2015, 10, 1550025. [Google Scholar] [CrossRef]
- Raczyński, P.; Górny, K.; Pabiszczak, M.; Gburski, Z. Nanoindentation of biomembrane by carbon nanotubes–MD simulation. Comput. Mater. Sci. 2013, 70, 13–18. [Google Scholar] [CrossRef]
- Mair, L.O.; Nacev, A.; Hilaman, R.; Stepanov, P.Y.; Chowdhury, S.; Jafari, S.; Hausfeld, J.; Karlsson, A.J.; Shirtliff, M.E.; Shapiro, B.; et al. Biofilm disruption with rotating microrods enhances antimicrobial efficacy. J. Magn. Magn. Mater. 2017, 427, 81–84. [Google Scholar] [CrossRef]
- Bedrov, D.; Smith, G.D.; Davande, H.; Li, L. Passive transport of C60 fullerenes through a lipid membrane: A molecular dynamics simulation study. J. Phys. Chem. B 2008, 112, 2078–2084. [Google Scholar] [CrossRef] [PubMed]
- Li, L.; Davande, H.; Bedrov, D.; Smith, G.D. A molecular dynamics simulation study of C60 fullerenes inside a dimyristoylphosphatidylcholine lipid bilayer. J. Phys. Chem. B 2007, 111, 4067–4072. [Google Scholar] [CrossRef] [PubMed]
- Qiao, R.; Roberts, A.P.; Mount, A.S.; Klaine, S.J.; Ke, P.C. Translocation of C60 and its derivatives across a lipid bilayer. Nano Lett. 2007, 7, 614–619. [Google Scholar] [CrossRef] [PubMed]
- Phillips, J.C.; Braun, R.; Wang, W.; Gumbart, J.; Tajkhorshid, E.; Villa, E.; Chipot, C.; Skeel, R.D.; Kale, L.; Schulten, K. Scalable molecular dynamics with NAMD. J. Comput. Chem. 2005, 26, 1781–1802. [Google Scholar] [CrossRef] [PubMed]
- Vanommeslaeghe, K.; Hatcher, E.; Acharya, C.; Kundu, S.; Zhong, S.; Shim, J.; Darian, E.; Guvench, O.; Lopes, P.; Vorobyov, I.; et al. CHARMM general force field: A force field for drug-like molecules compatible with the CHARMM all-atom additive biological force fields. J. Comput. Chem. 2010, 31, 671–690. [Google Scholar] [CrossRef] [PubMed]
- Humphrey, W.; Dalke, A.; Schulten, K. VMD: Visual molecular dynamics. J. Mol. Graph. 1996, 14, 33–38. [Google Scholar] [CrossRef]
- Al-Haik, M.S.; Hussaini, M.Y. Molecular dynamics simulation of magnetic field induced orientation of nanotube-polymer composite. Jpn. J. Appl. Phys. 2006, 45, 8984. [Google Scholar] [CrossRef]
- Ljung, L. System identification. In Signal Analysis and Prediction; Springer: New York, NY, USA, 1998; pp. 163–173. [Google Scholar]
- Pankhurst, Q.A.; Connolly, J.; Jones, S.; Dobson, J. Applications of magnetic nanoparticles in biomedicine. J. Phys. D Appl. Phys. 2003, 36, R167. [Google Scholar] [CrossRef]


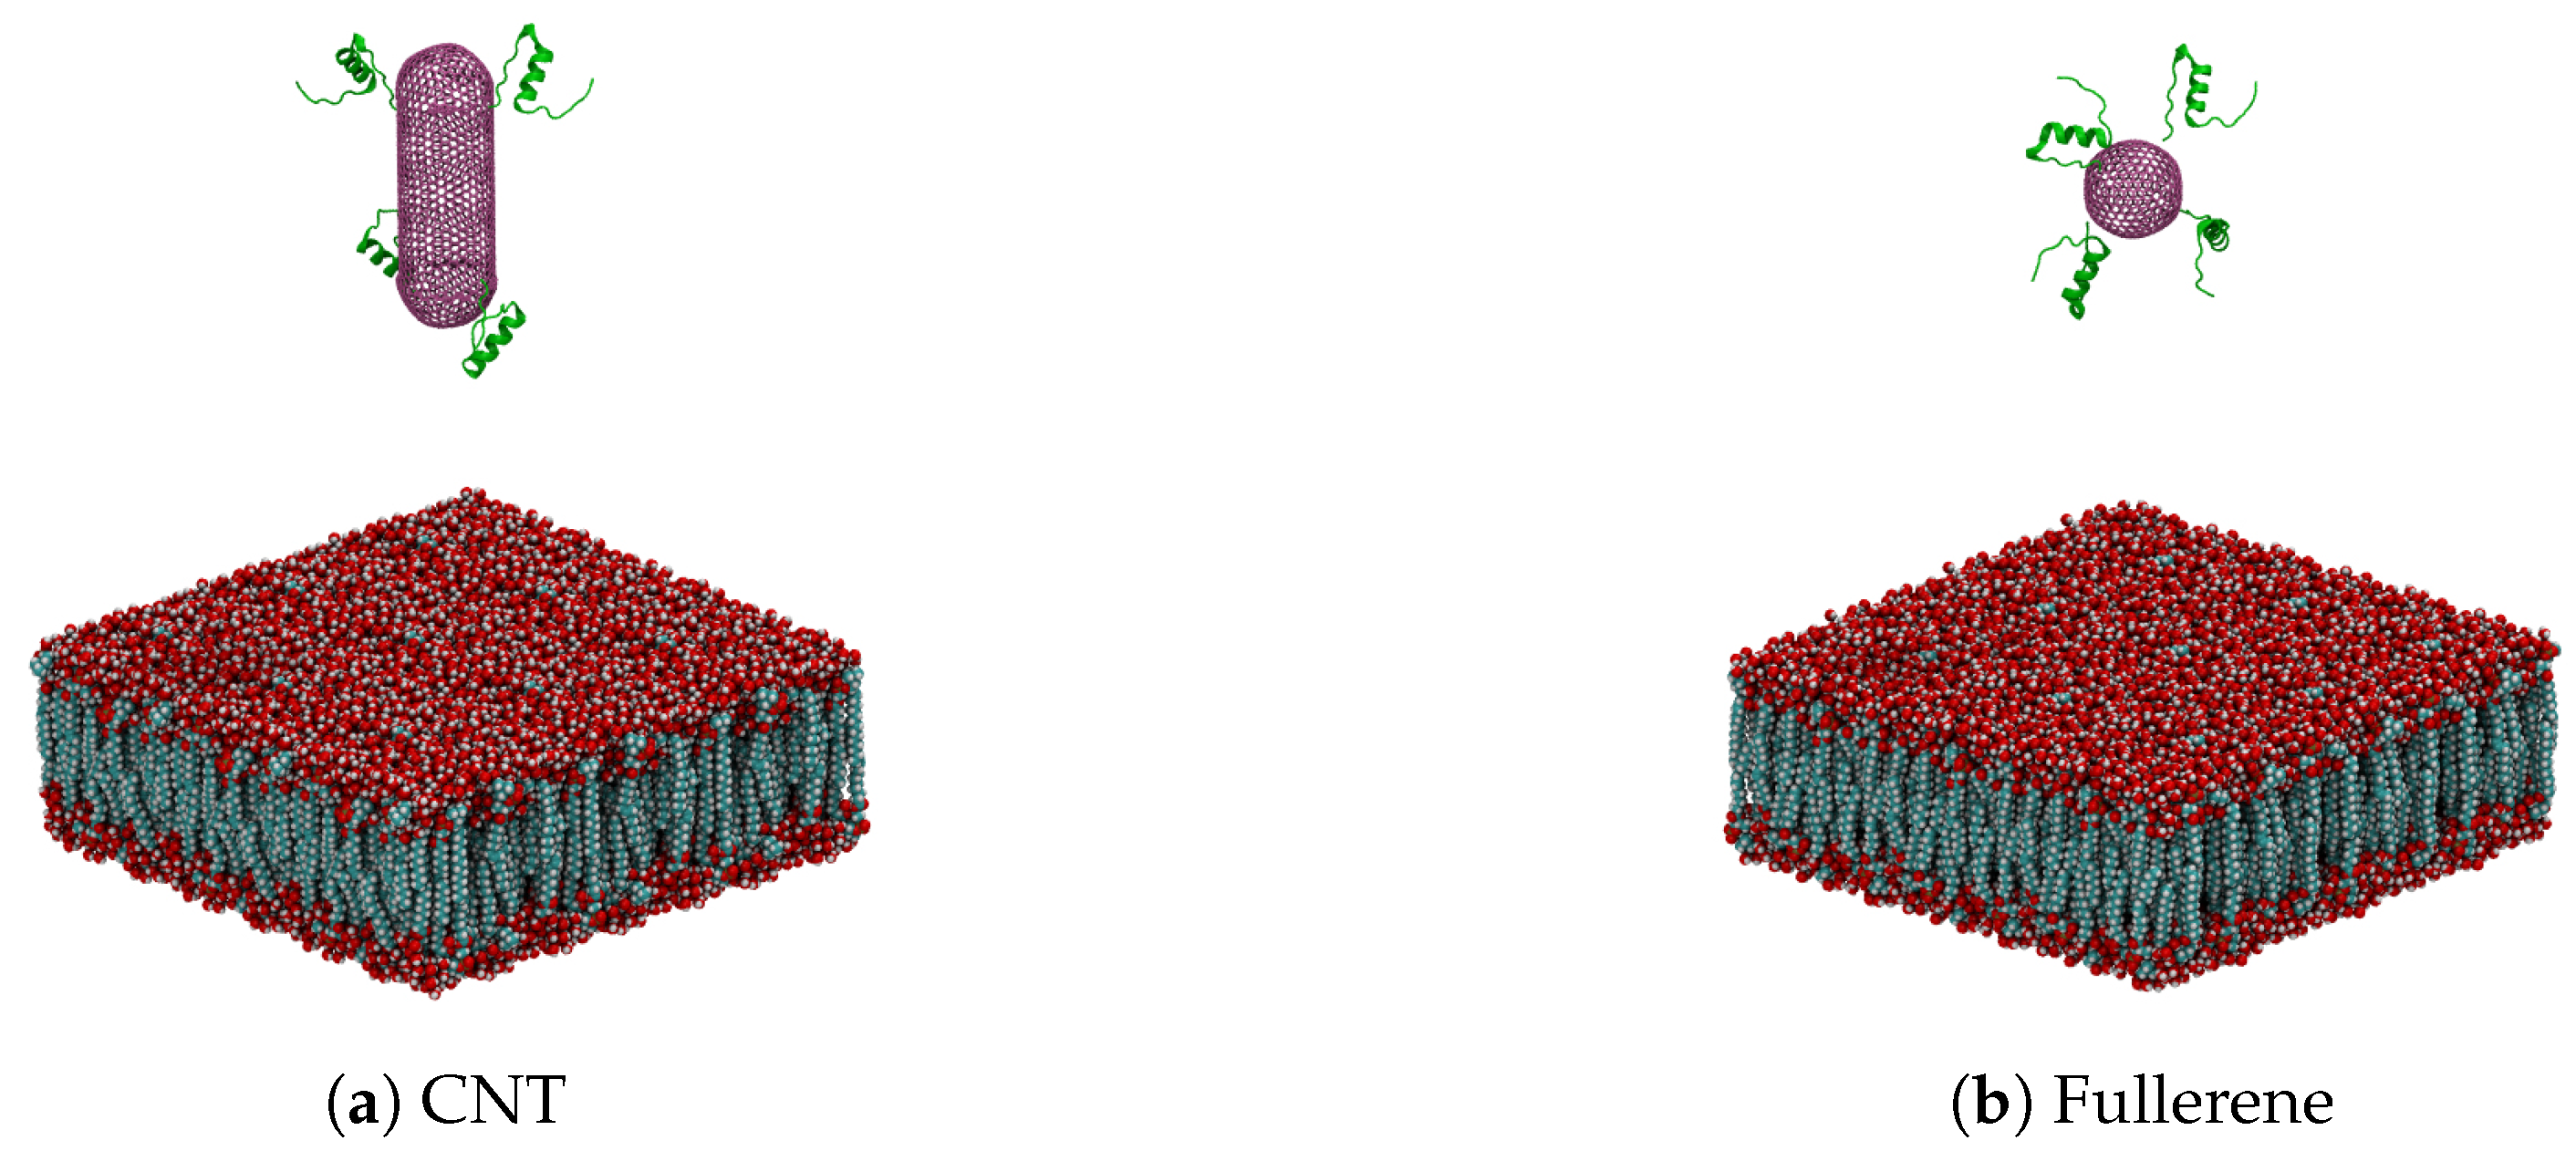
| Nanocarrier Property | Fullerene | End-Capped CNT |
|---|---|---|
| Size | R = 2.41 nm | R = 2.41 nm and l = 7.40 nm |
| Number of atoms | 720 | 2200 |
| Number of insulin chains | 4 | 4 |
| Number of total atoms | 88,328 | 121,488 |
| Lipid size |
| Parameter | End-Capped CNT | Fullerene |
|---|---|---|
| a | ||
| b | ||
| c | +1.67 | +1.80 |
| d | +0.95 | +1.05 |
| e | ||
| f | +0.97 | +1.06 |
| g | ||
| h | +0.99 | +0.99 |
| i | +1.69 | +1.73 |
| j | +0.98 | +0.97 |
| k | ||
| l | +0.99 | +0.97 |
| Parameter | Definition | Value |
|---|---|---|
| The permeability of free space | ||
| V | Particle volume | |
| Radius of the nanoparticle | 2 nm | |
| Magnetic susceptibility | 0.17 |
© 2018 by the authors. Licensee MDPI, Basel, Switzerland. This article is an open access article distributed under the terms and conditions of the Creative Commons Attribution (CC BY) license (http://creativecommons.org/licenses/by/4.0/).
Share and Cite
Mehrafrooz, B.; Pedram, M.Z.; Ghafar-Zadeh, E. An Improved Method for Magnetic Nanocarrier Drug Delivery across the Cell Membrane. Sensors 2018, 18, 381. https://doi.org/10.3390/s18020381
Mehrafrooz B, Pedram MZ, Ghafar-Zadeh E. An Improved Method for Magnetic Nanocarrier Drug Delivery across the Cell Membrane. Sensors. 2018; 18(2):381. https://doi.org/10.3390/s18020381
Chicago/Turabian StyleMehrafrooz, Behzad, Maysam Z. Pedram, and Ebrahim Ghafar-Zadeh. 2018. "An Improved Method for Magnetic Nanocarrier Drug Delivery across the Cell Membrane" Sensors 18, no. 2: 381. https://doi.org/10.3390/s18020381
APA StyleMehrafrooz, B., Pedram, M. Z., & Ghafar-Zadeh, E. (2018). An Improved Method for Magnetic Nanocarrier Drug Delivery across the Cell Membrane. Sensors, 18(2), 381. https://doi.org/10.3390/s18020381