Construction and Application of a Non-Enzyme Hydrogen Peroxide Electrochemical Sensor Based on Eucalyptus Porous Carbon


Hunan Provincial Key Laboratory of Environmental Catalysis & Waste Recycling, College of Chemistry and Chemical Engineering, Hunan Institute of Engineering, Xiangtan 411104, China
*
Authors to whom correspondence should be addressed.
Sensors 2018, 18(10), 3464; https://doi.org/10.3390/s18103464
Submission received: 21 August 2018
/
Revised: 26 September 2018
/
Accepted: 8 October 2018
/
Published: 15 October 2018
(This article belongs to the Section Biosensors)
Abstract
:Natural eucalyptus biomorphic porous carbon (EPC) materials with unidirectional ordered pores have been successfully prepared by carbonization in an inert atmosphere. X-ray diffraction (XRD), Fourier transform infrared spectroscopy (FT-IR) and scanning electron microscope (SEM) were employed to characterize the phase identification, microstructure and morphology analysis. The carbon materials were used to fabricate electrochemical sensors to detect hydrogen peroxide (H2O2) without any assistance of enzymes because of their satisfying electrocatalytic properties. It was immobilized on a glassy carbon electrode (GCE) with chitosan (CHIT) to fabricate a new kind of electrochemical sensor, EPC/CHIT/GCE, which showed excellent electrocatalytic activity in the reduction of H2O2. Meanwhile, EPC could also promote electron transfer with the help of hydroquinone. The simple and low-cost electrochemical sensor exhibited high sensitivity, and good operational and long-term stability.
1. Introduction
The accurate and sensitive detection of H2O2 content is of great significance in clinical diagnostics, food safety, environmental monitoring and other fields [1]. Therefore, more detection techniques such as titration analysis [2], spectrophotometry [3], chemiluminescence [4], and electrochemical methods [5] are used to analyze H2O2. Among these methods, electrochemical methods are widely used and are widely reported. It is generally believed that ampere-based electrochemical biosensors based on fixed horseradish peroxidase (HRP) are the most effective and commonly used methods for detecting H2O2. However, the denaturation and shedding of surface enzymes on the sensor electrode of immobilized enzymes and other bioprotein molecules has been a major obstacle to the application of enzyme sensors, especially commercial applications, because it directly affects the sensitivity, stability and repeatability of the sensor. It is still a key issue in enzyme sensors that has to be overcome so far. At present, the immobilization of an inorganic material with a direct electrocatalytic activity and a very stable nature to the surface of the electrode to construct a non-enzymatic sensor can effectively overcome the problems caused by the enzyme-based sensor, since the material with stable properties does not undergo any denaturation. Some non-enzymatic sensors for detecting H2O2 have been reported in the literature. For example, metals like silver platinum, gold or their combination [6,7,8,9,10,11]; WS2 [12] and electrogenerated ferrites or their combination with carbon nanomaterials [13,14] have been successfully used for the analytical determination of hydrogen peroxide.
Porous carbon materials (PC) are widely used in gas adsorption separation, water and air purification, catalyst carriers, chromatography, electrochemical double layer capacitors and fuel cells [15,16], due to their high specific surface area, pore volume, catalytic properties, good mechanical stability, etc. In addition, studies have found that natural forms of porous carbon play an important role in both electrocatalysis and electron transport processes. However, due to the limited research in this area, the electrocatalytic applications of these natural low-cost porous carbon materials are greatly limited. In this work, we prepared a non-enzymatic sensor of EPC/CHIT/GCE by using chitosan (CHIT) with good stability and excellent film forming properties as a film-forming agent to fix the eucalyptus biomorphic porous carbon material (EPC) to the surface of the glassy carbon electrode (GCE). The non-enzymatic sensors constructed by EPC are characterized by low cost, simplicity, ease of use, and long-term stability. To the best of our knowledge, the use of naturally occurring porous carbon as a catalyst for non-enzymatic sensors has been reported for the first time. It is believed that it will have a broader application in the field of analytical chemistry and electronic device research.
2. Materials and Methods
2.1. Reagents and Instruments
The original ecological eucalyptus was a carbonized material for the preparation of biomorphic porous carbon. Chitosan (CHIT, MW~ 1 × 10⁶, >85% deacetylated) and hydroquinone were purchased from Sigma (Shanghai, China). Hydrogen peroxide (H2O2, 30% V/V aqueous solution) was obtained from Shanghai Biochemical Reagent Company (Shanghai, China). Other analytical grade chemicals were purchased from Beijing Chemical Reagent Company (Beijing, China) and did not require further purification. Phosphate buffer solution (PBS, 0.067 M) was prepared by using K2HPO4 and NaH2PO4 standard solutions and adjusting the pH to 7.0. All solutions were prepared with deionized water.
The electrochemical experiment was carried out on a CHI660B electrochemical workstation (Shanghai Chenhua Instrument Co., Ltd., Shanghai, China) under normal temperature conditions, and a three-electrode system was used: A platinum electrode as a counter electrode; a KCl-saturated Ag/AgCl electrode as a reference electrode; and a 3 mm diameter glassy carbon electrode as the working electrode. A scanning electron microscope (SEM) image was obtained by JEM-6700F (JEOL, Tokyo, Japan). Fourier transform infrared spectroscopy (FT-IR) was obtained by using KBr as a compression background on a WQF-410 infrared spectrometer (Beijing Second Optical Instrument Co., Ltd., BeiJing, China). The XRD of EPC was characterized by the Siemens D5000 (München, Germany).
2.2. Preparation of EPC Materials
The processed eucalyptus block with a diameter of 5–10 mm was first dried at 120 °C for 48 h and then heated to 600 °C at a heating rate of 2 °C/min and maintained at 600 °C 3 h to completely decompose the polyaromatic complex into carbon; The temperature was raised to 1200 °C at a temperature rise rate of 5 °C/min, and the temperature was maintained for 4 h to produce crack-free carbon; finally, the eucalyptus porous carbon (EPC) material was obtained by naturally cooling to room temperature. It is to be noted that the entire process was carried out under inert gas protection conditions.
2.3. Preparation of EPC/CHIT/GCE Electrochemical Sensors
Prior to electrode modification, the glassy carbon electrode was subjected to a series of grinding processes on alumina powders of different particle sizes, ultrasonically washed with ethanol and water, and finally blown dry with nitrogen. After the electrode was processed, the EPC was first ultrasonically dispersed with water to obtain a uniform dispersion with a concentration of 1 mg/mL. After thoroughly mixing the 0.5%-wt CHIT solution with the EPC suspension, 5 μL of the above mixed droplets were taken out and added to the surface of the glassy carbon electrode, and naturally dried to obtain EPC/CHIT/GCE. The sensor was placed in PBS solution and stored at room temperature. As a control experiment, a bare glassy carbon electrode and a CHIT modified glassy carbon electrode (CHIT/GCE) were prepared by a method similar to that described above.
3. Results and Discussion
3.1. Characterization of EPC Materials
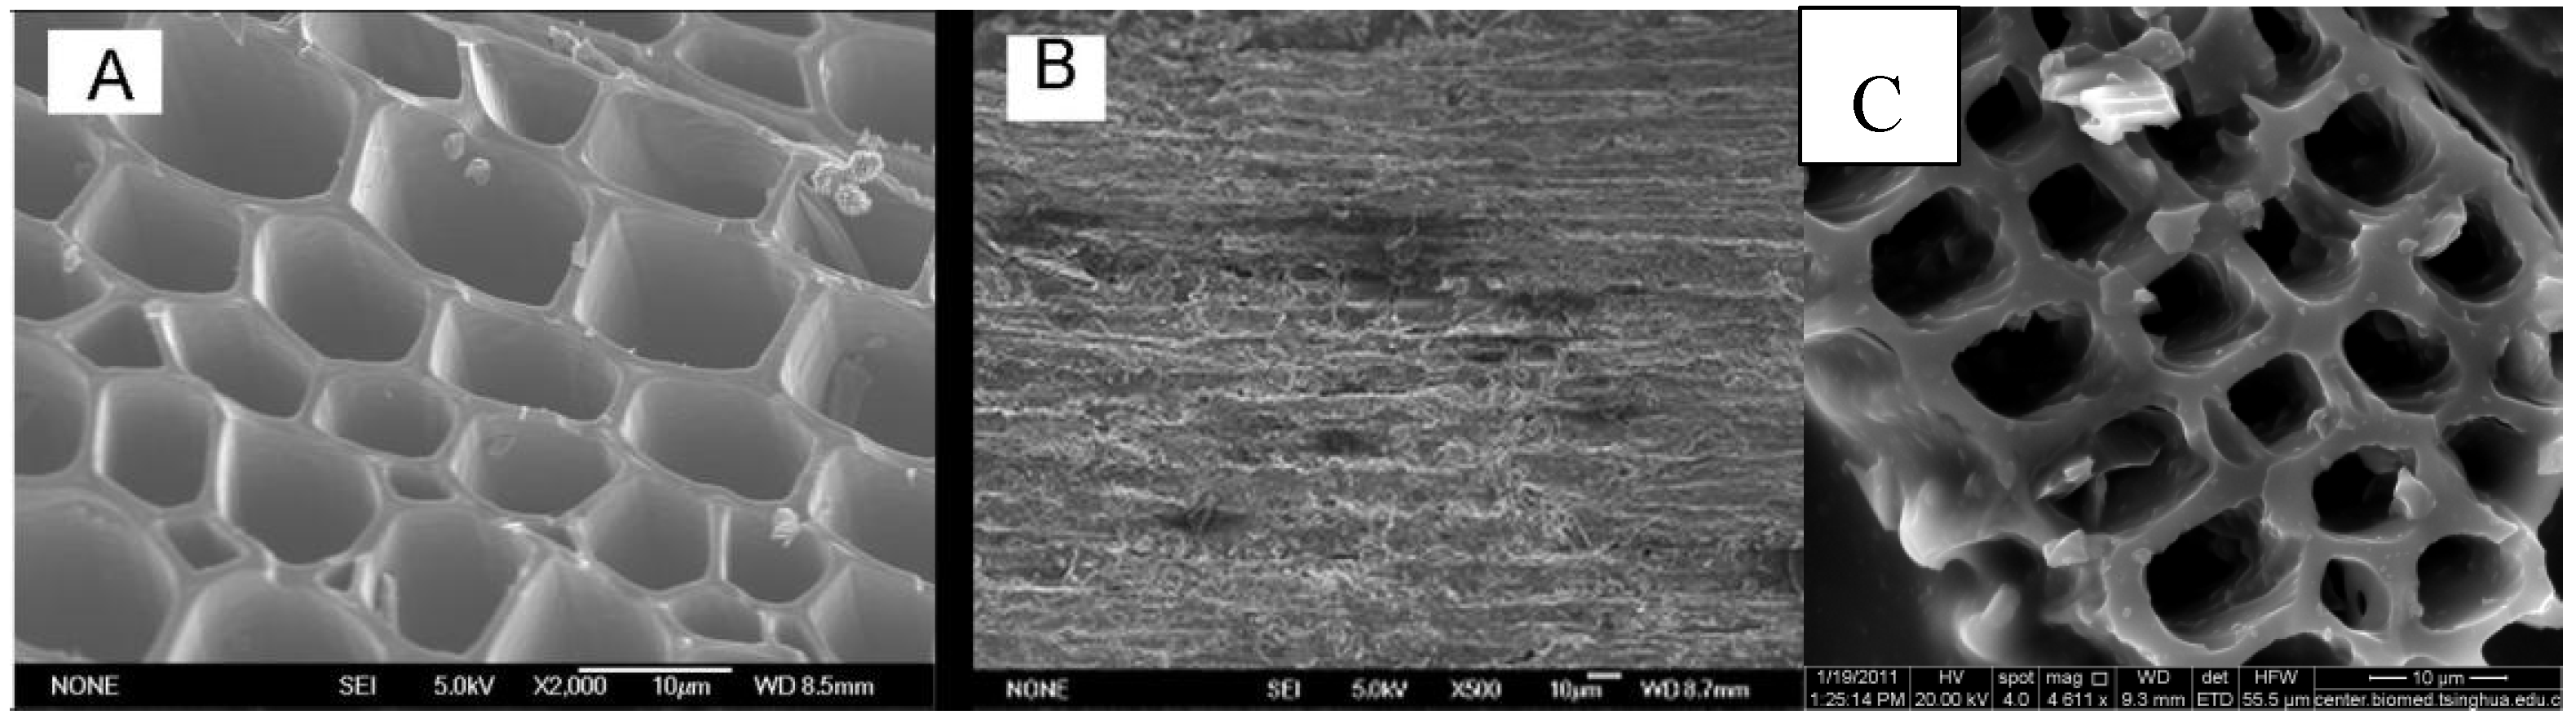
The eucalyptus was composed of dense cells with small pores, and the interstitial structure was uniform and dense. The carbonized EPC still maintained this regular and orderly structure. Figure 1 is a Scanning Electron Microscope (SEM) image of the EPC and EPC/CHIT/GCE. From Figure 1A we can see that the EPC has a honeycomb shape and is a hollow channel structure with different diameters. This structure is derived from the structure of the natural form of eucalyptus. The black part of the figure is the cell cavity of the eucalyptus, while the gray part is the cell wall of the eucalyptus. Most of the holes have an elliptical topography and are connected to each other through the wall of the hole. These cells are parallel to the axial direction of the elm texture structure (Figure 1B). The anisotropic microstructure of EPC is different from other natural porous materials (such as zeolite, diatomaceous earth, etc.), and this dense one-way natural pore structure greatly increases its specific surface area. The structural morphology of the EPC/CHIT/GCE on the electrode surface was clearly seen by scanning electron microscopy (Figure 1C). The material maintains its unique three-dimensional structure even on the electrode surface, which is porous. The array layout hardly changed.
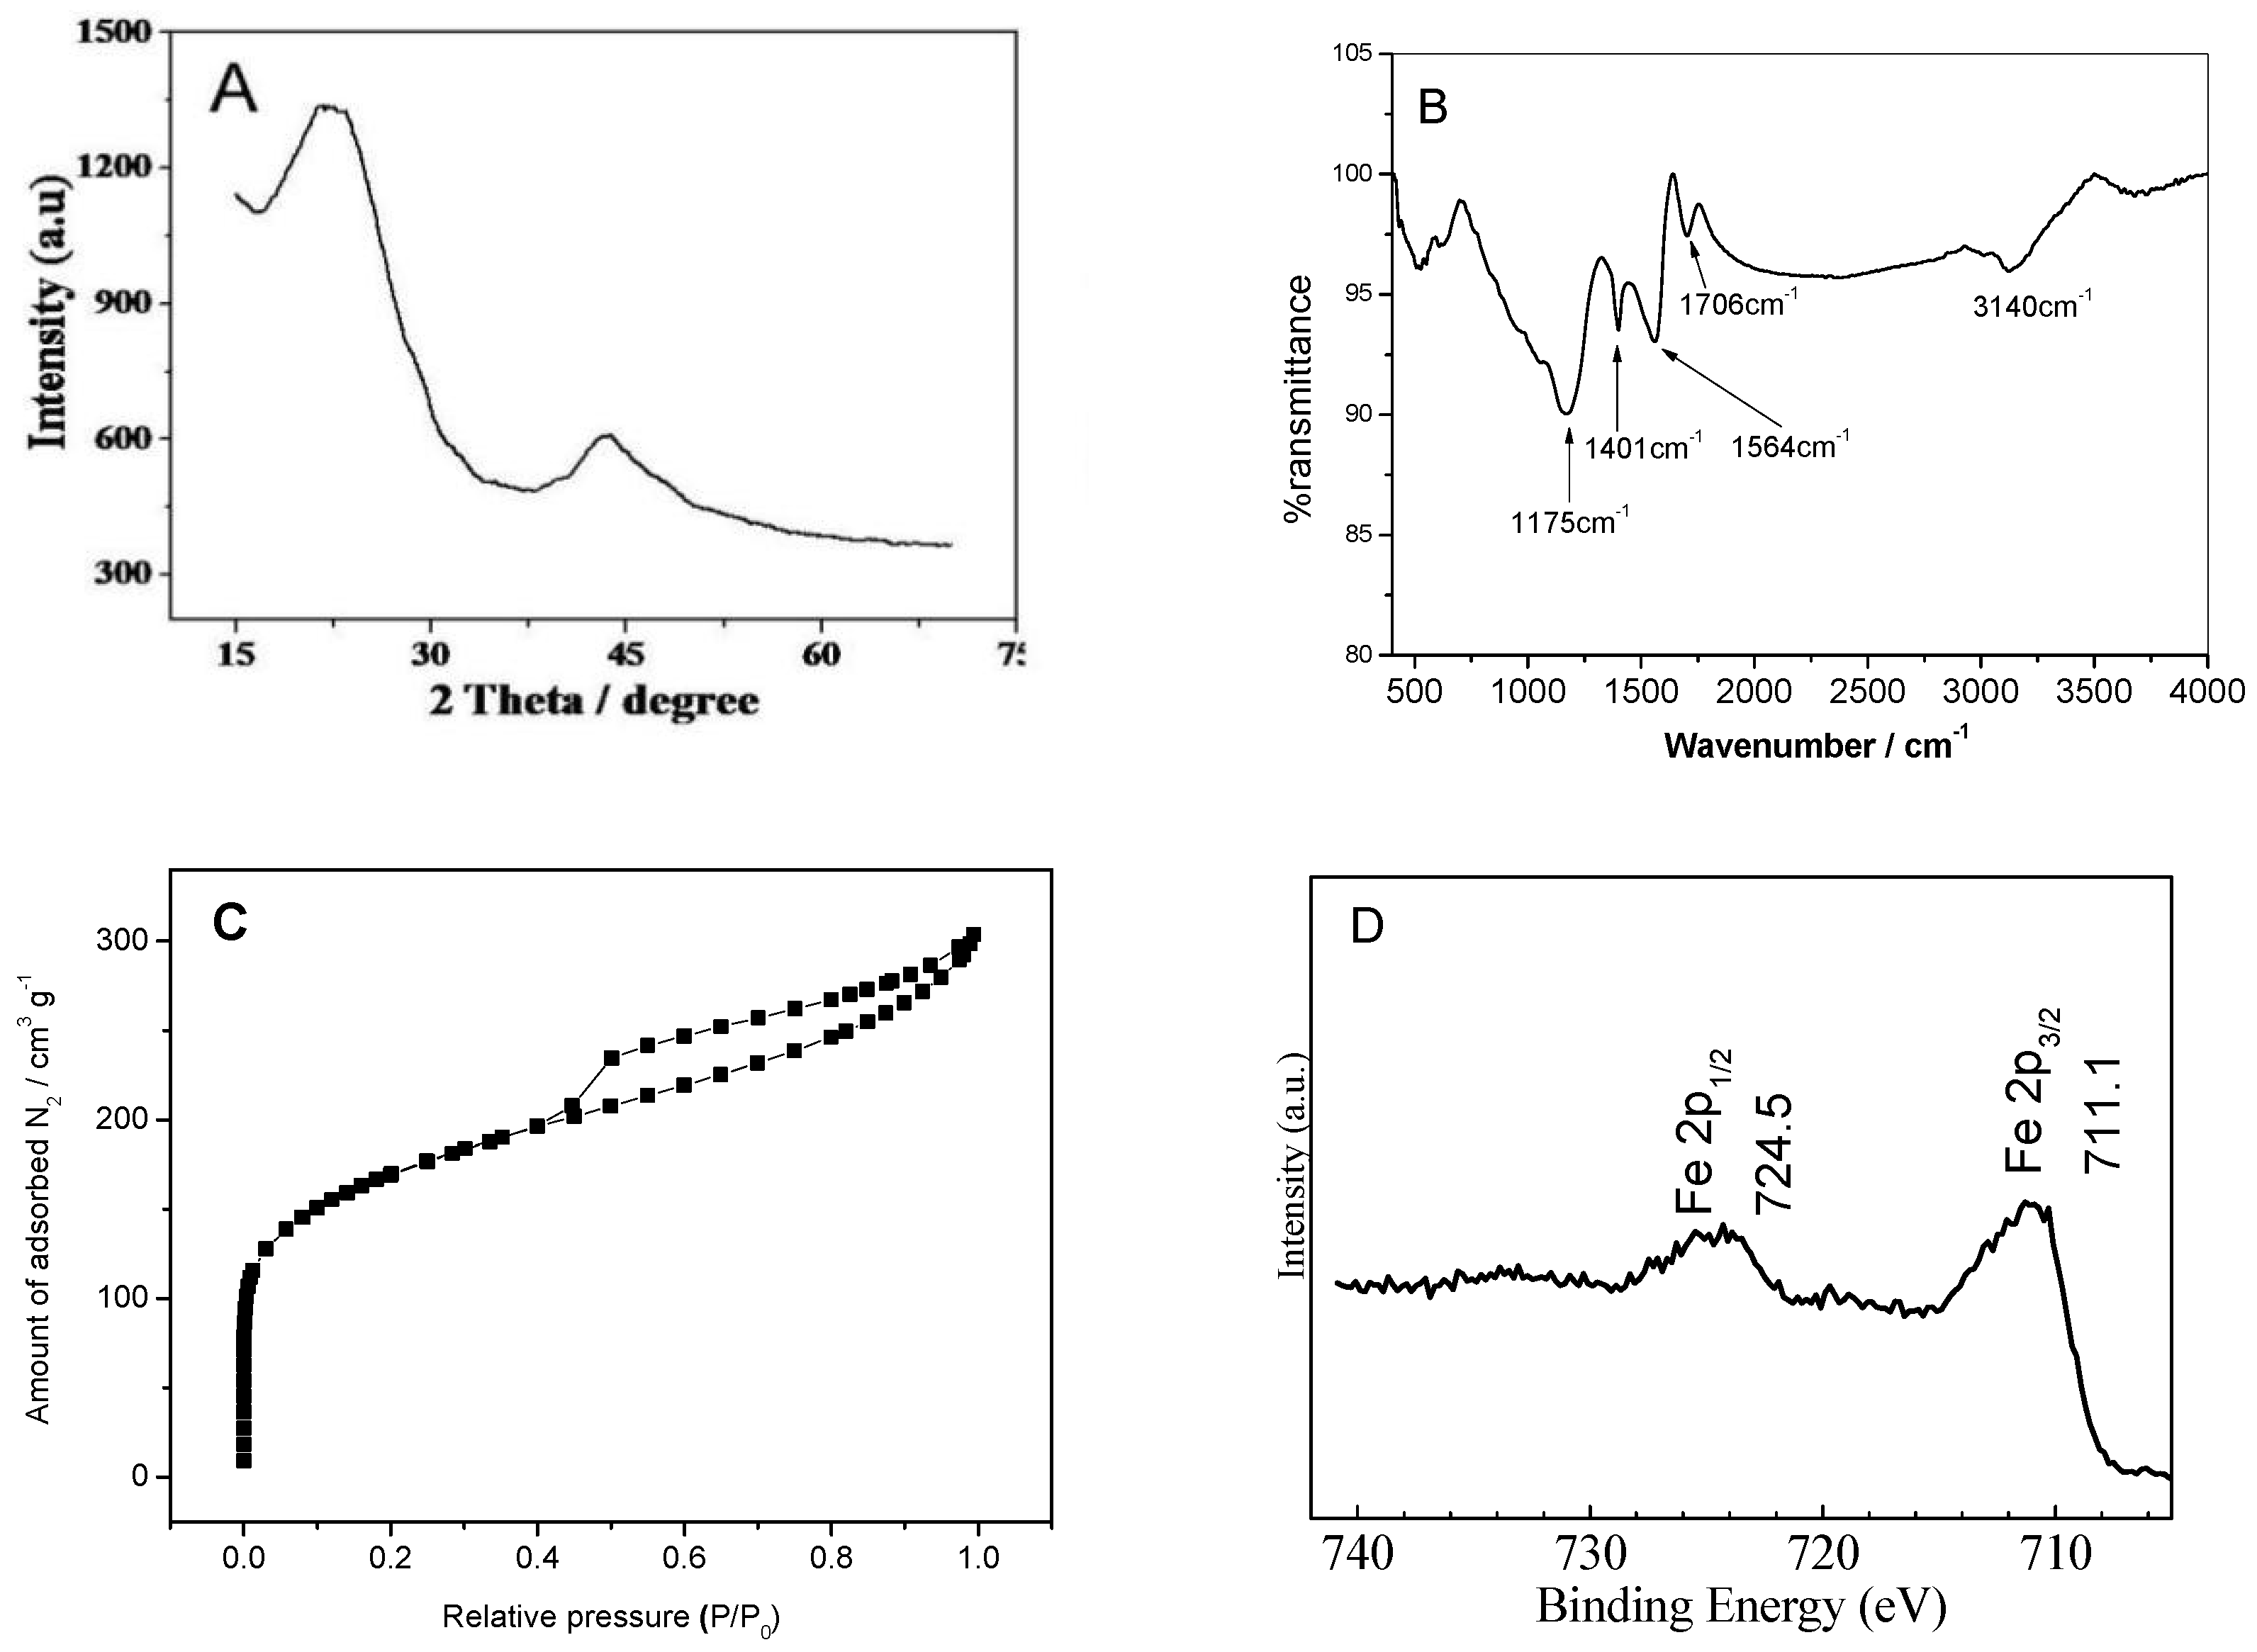
As can be seen from the XRD of the EPC (Figure 2A), there are two broad peaks appearing at 24° and 44°, respectively assigned to the (002) peak (101) peak of amorphous carbon. These two characteristic peaks indicate that the material after carbonization is amorphous carbon [17]. It was found by FT-IR absorption spectroscopy (Figure 2B) that the EPC contained more functional groups. The main absorption bands of the synthetic materials in the range of 400–4000 cm−1 were 3135, 1706, 1564 and 1175 cm−1, which are attributed to the stretching vibration of hydroxyl groups, the stretching vibration of carbonyl groups, C-O (hydroxyl, ester, or ether) stretching and O-H bending vibration, respectively [18]. The N2 adsorption-desorption isotherms and X-ray photoelectron spectroscopy of the EPC materials are shown in Figure 2C,D. The nitrogen adsorption-desorption isotherms show an obvious hysteresis loop, which indicates that the EPC material is porous. The surface area of the EPC materials was 598.1 m2·g−1, calculated using the Brunauer–Emmett–Teller (BET) equation. The X-ray photoelectron spectroscopy (XPS) showed that the EPC material contained a small amount of iron in addition to carbon and oxygen (Figure 2D).
3.2. Cyclic Voltammetry
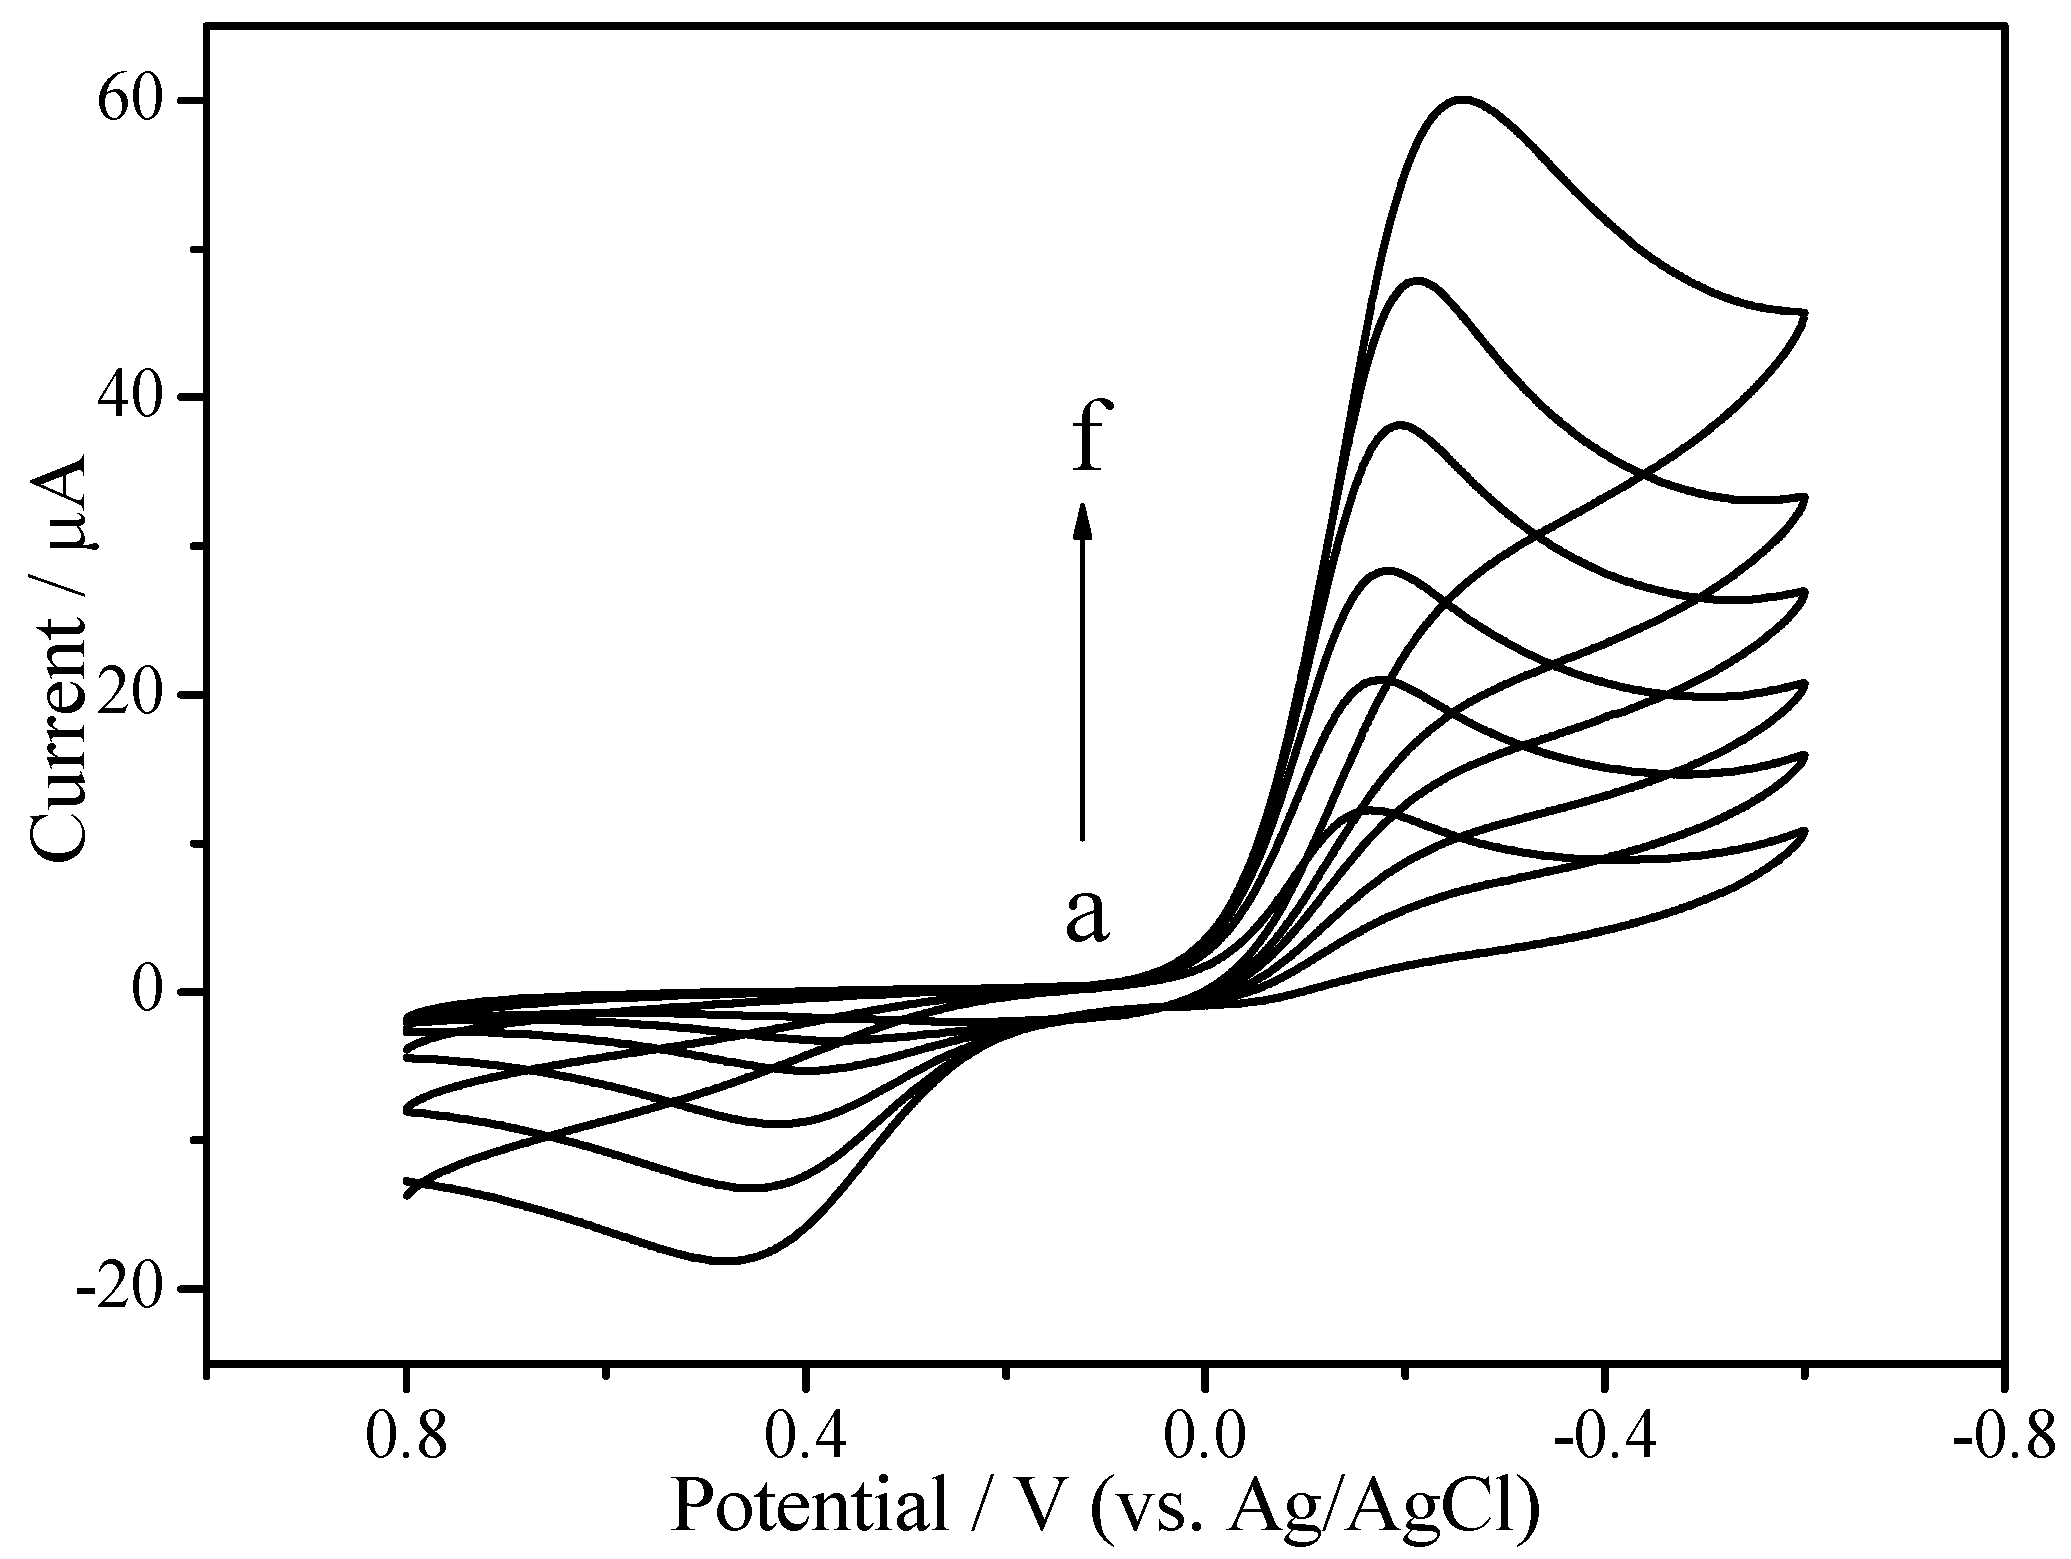
The properties of EPC that promoted electron transfer were first investigated in PBS containing 1 mM hydroquinone. Figure 3 summarizes the electron transfer characteristics of different modified electrodes. Under the condition of −0.2 V operating potential with Ag/AgCl and no hydrogen peroxide, a pair of hydroquinone redox peaks appeared in different modified electrodes. It is apparent from the figure that the redox peak of CHIT/GCE (curve a, Figure 3) was smaller than the bare GCE (curve b, Figure 3), which indicates that CHIT itself may hinder electron transport. However, EPC/CHIT/GCE had a pair of redox peaks with significantly larger current values and a smaller peak difference (curve c, Figure 3). The electrocatalytic activity of EPC/CHIT/GCE for H2O2 was further investigated by cyclic voltammetry. In the absence of hydrogen peroxide, a typical redox characteristic peak of hydroquinone (curve a, Figure 4) occurred when a certain concentration of hydrogen peroxide was added to the PBS at about −0.2 V (vs. Ag/AgCl) showed a significant increase in the reduction peak current, accompanied by a decrease in the oxidation peak current, and as the H2O2 concentration in the system increased, the reduction peak current also increased (curve b to f, Figure 4). The experimental results show that EPC can be used as an excellent non-enzymatic catalyst for the construction of non-enzyme electrochemical sensors for detecting H2O2. It was fully demonstrated that EPC can promote the transfer of electrons between the catalytically active center and the electrode surface. The catalytically active center may be present in the three-dimensional biomorphological structure of the pore structure or the surface of the material.
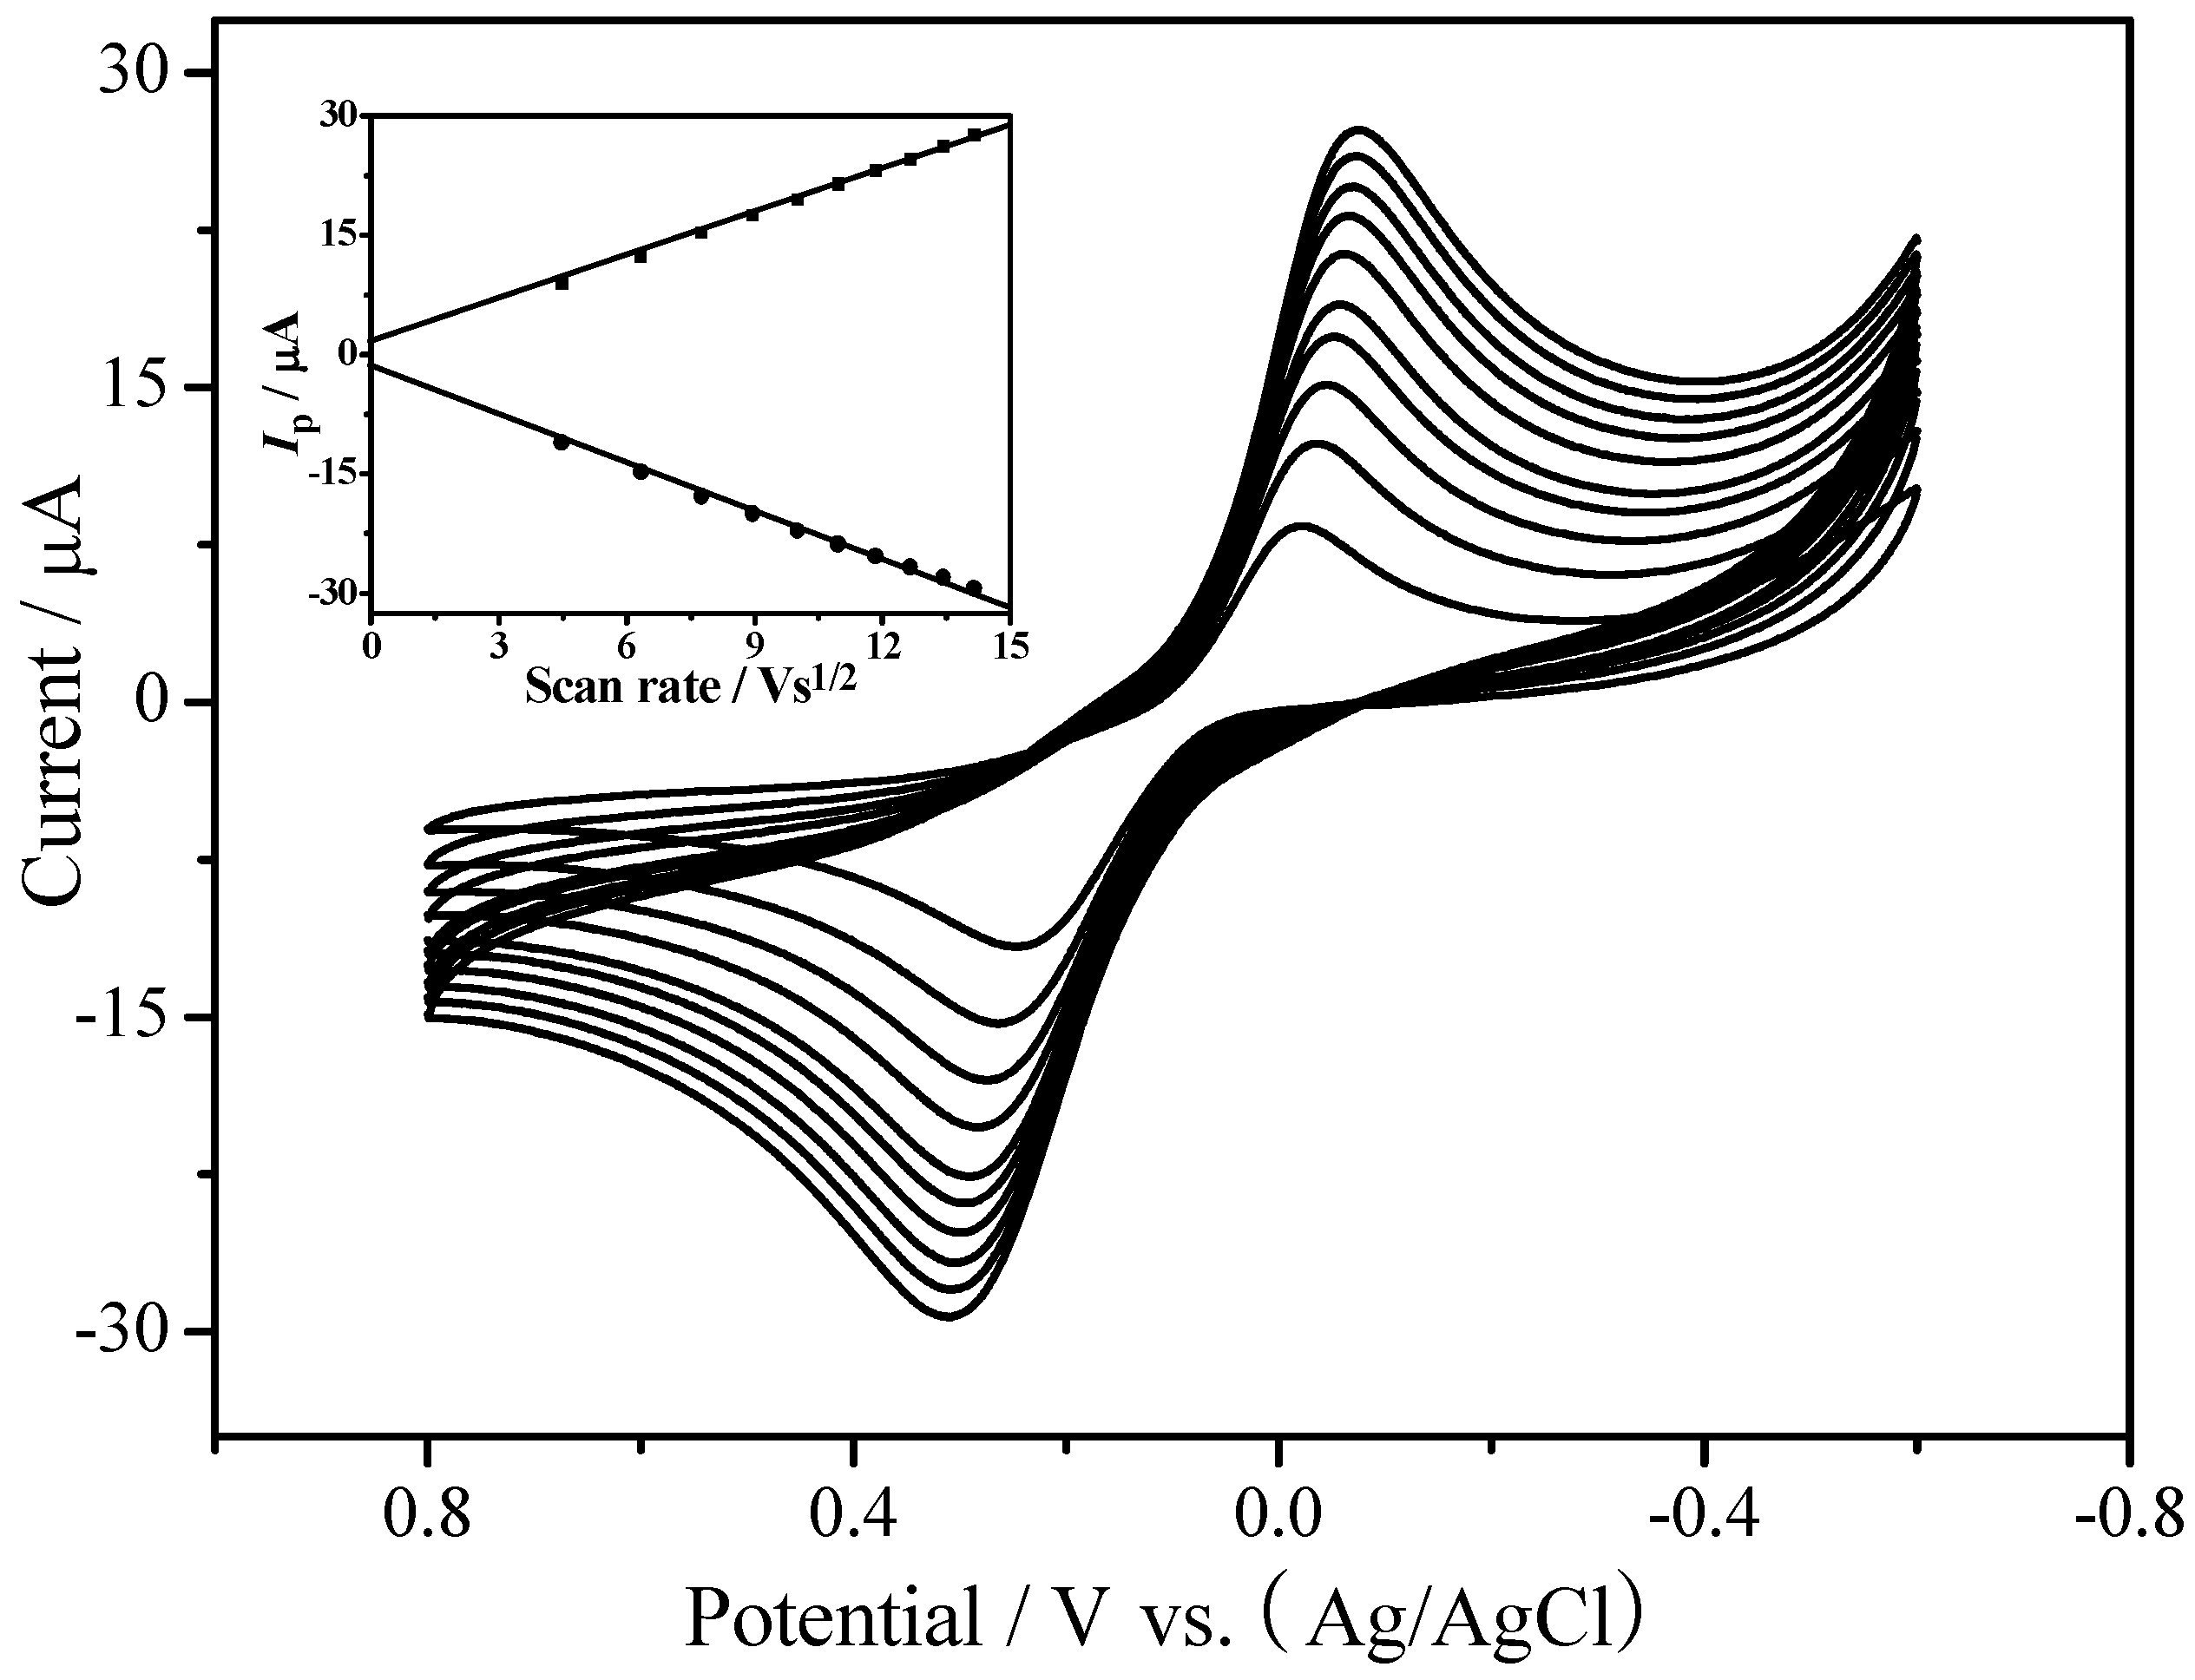
Figure 5 shows the electrochemical response of EPC/CHIT/GCE at different scan speeds. The sweep rate was changed from 20 mV·s−1 to 200 mV·s−1, and the redox peak current value was found to be proportional to the square root of the scan speed (Figure 5), indicating that the electrochemical process was controlled by diffusion. The peak-to-peak potential difference between the cyclic volt-ampere of the sweep speed from 40 mV·s−1 to 180 mV·s−1 showed that the average electron transfer rate parameter ks of EPC fixed in CHIT was 1.06 s−1. This value was calculated according to the Laviron model using the formula ks = mnFv/RT. In the formula, n represents the electron transfer number; F represents the Faraday constant; m is the peak-to-peak potential difference parameter; v is the scanning speed; R is the gas constant; and T is the temperature, respectively [19]. Here, T = 298 K, n = 1. The ks in this study were smaller than the reported biosensors using enzymes as catalysts [20,21], which further demonstrates that EPC can promote electron transfer.
3.3. Sensor Response Characterization
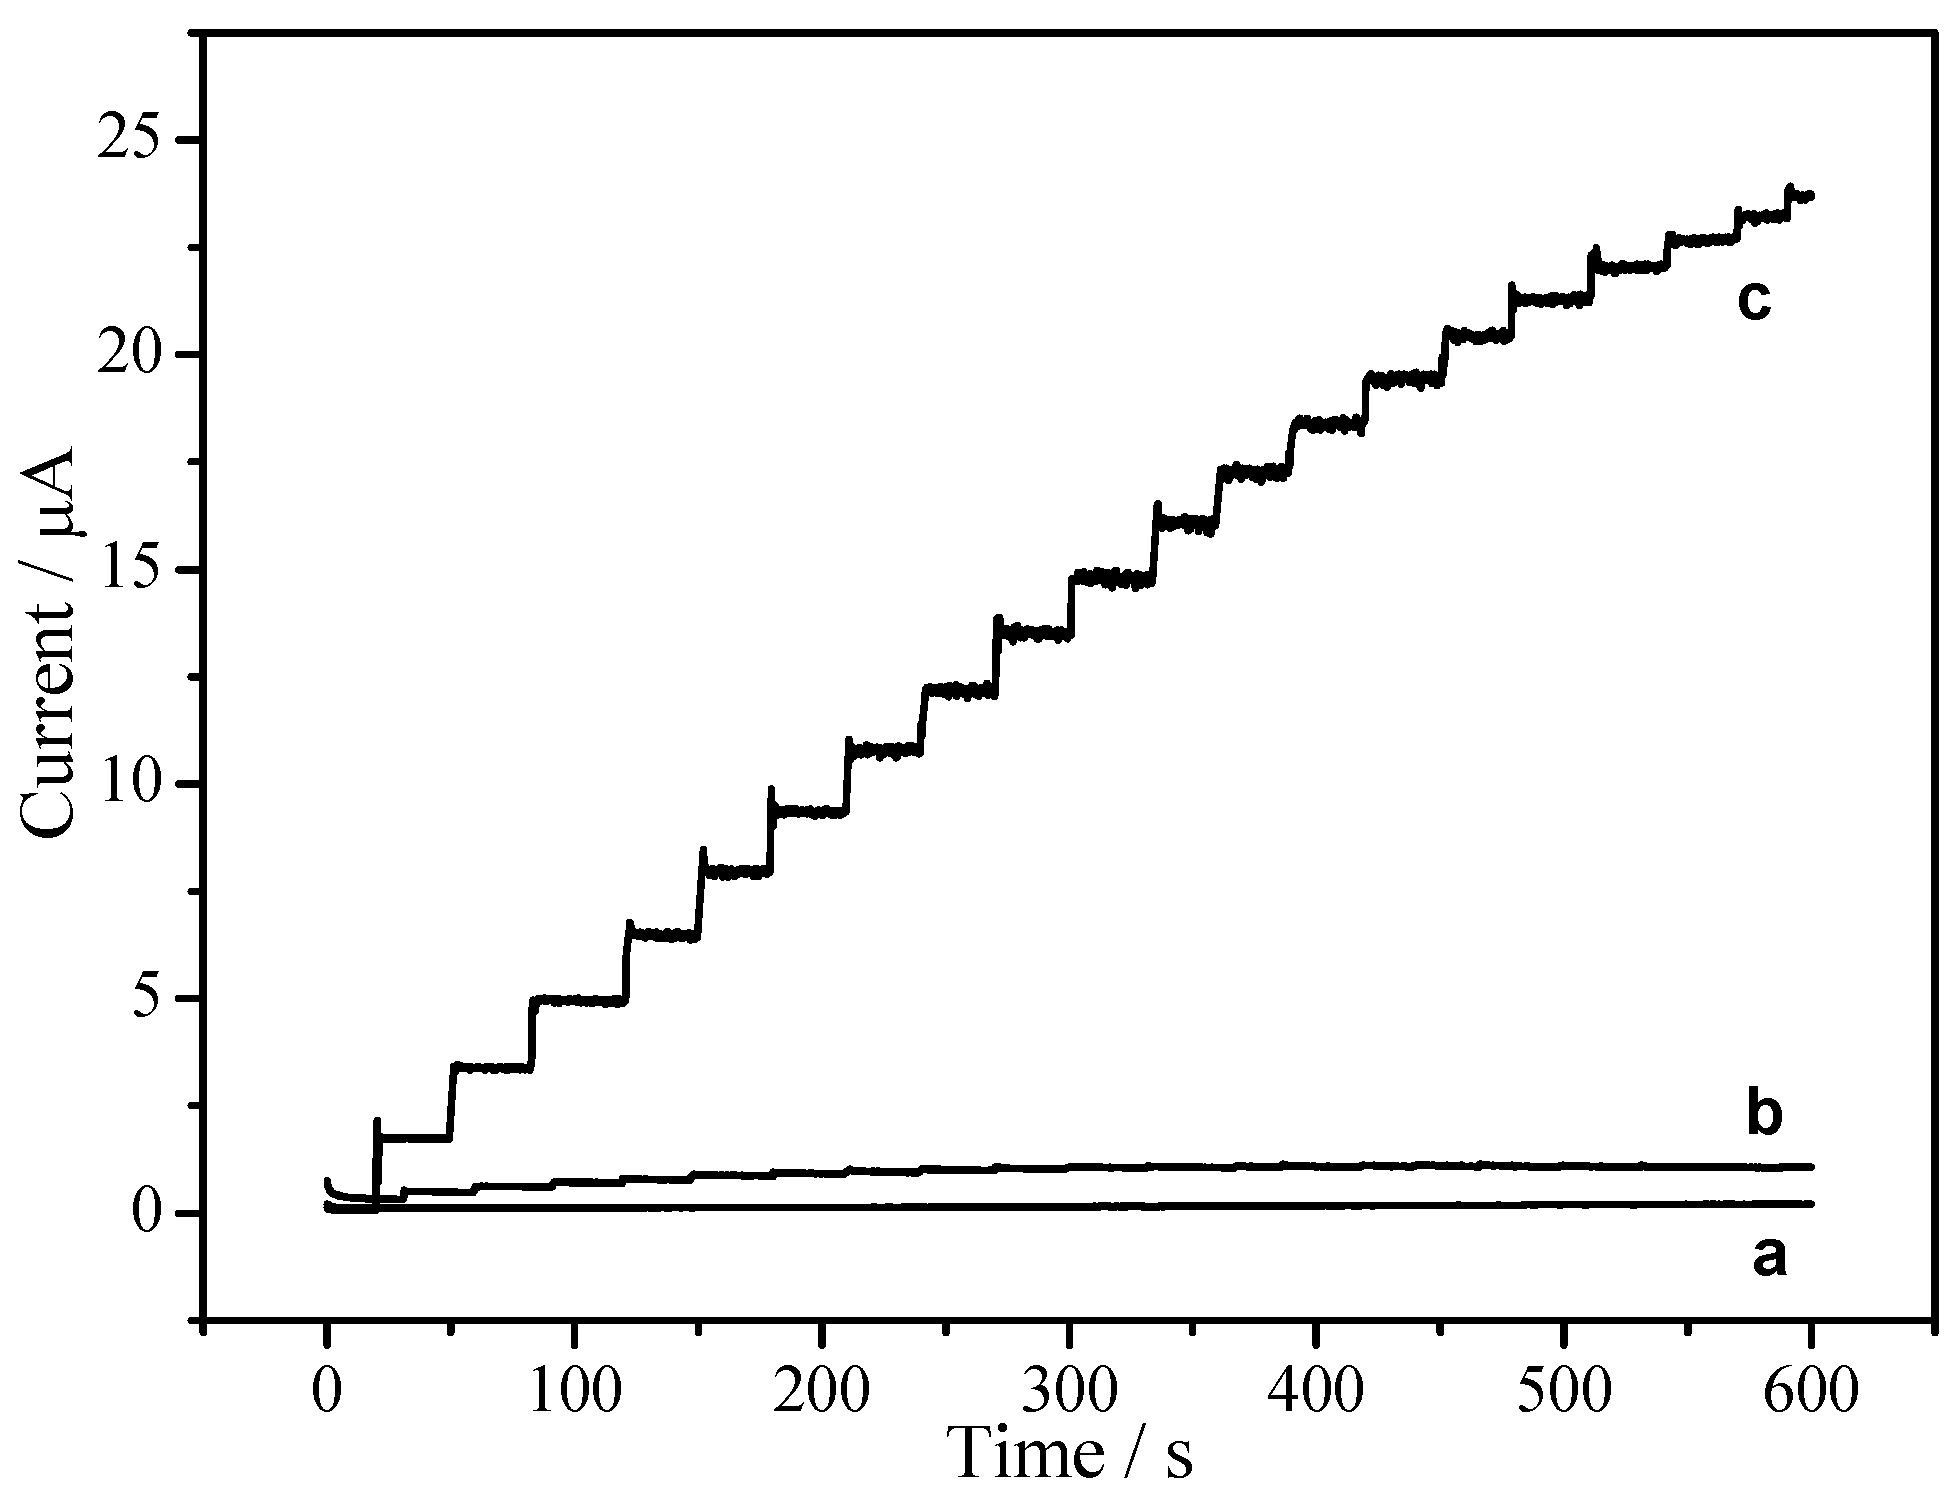
In order to compare the electrocatalytic properties of EPC/CHIT/GCE with CHIT/GCE and bare GCE, the catalytic performance of three modified electrodes were investigated by the electrocatalytic reduction of H2O2. Figure 6 is a current-time (it) curve for three modified electrodes. When adding 10 μL of 0.1 M H2O2 to 10 mL of PBS containing 1 mM hydroquinone, CHIT/GCE and bare GCE had almost no apparent catalytic response (see lines a and b in Figure 6), whereas EPC/CHIT/GCE (see line c in Figure 6) showed a significant catalytic response to different concentrations of H2O2 with a typical current-time response curve. Experiments show that the electrochemical sensor had a fast and sensitive response to H2O2.
With a signal-to-noise ratio of 3 and a correlation coefficient of 0.998 (n = 15), the linear detection range for H2O2 ranged from 15 μM to 1.6 mM with a minimum detection limit of 3.7 μM and sensitivity theory for EPC/CHIT/GCE. The calculated value was 204.5 μA·mM−1·cm−2. Table 1 summarizes the analytical parameters for the most relevant non-enzymatic hydrogen peroxide sensors based on the use of different metallic nanoparticles reported since 2013. The comparison allowed us to conclude that our sensor presented a comparable [22,23,24,25] linear range and sensitivity to most of the sensors. However, our sensor presented the great advantage of easy preparation and no precious metals.
The Michaelis constant (Km) is a kinetic parameter for studying the binding catalysis of an enzyme or catalyst to a substrate. In general, a smaller Km indicates a higher affinity of the enzyme or catalyst to the substrate. This value can be calculated using the Lineweaver-Burk equation (Equation (1)) [26].
In this equation, Iss is the steady state current value after substrate addition; Imax is the maximum current at substrate concentration saturation; and C is the substrate concentration. In this work, the calculated value was 3.67 mM (see insert diagram (bottom), Figure 7). This value was lower than the 8.01 mM based on the HRP-ZrO2 nanocomposite sensor [27] and much higher than the 41 mM based on the Nafion-Hb-CNT sensor [26]. Comparison of the surface results, especially with enzyme sensing, showed that EPC had higher enzymatic activity and had a good affinity for H2O2.
3.4. Sensor Selectivity, Reproducibility and Stability
Several possible interfering substances were selected to examine the selectivity of the sensor. The experiment was to compare the response current of the sensor to 0.1 mM H2O2 in the presence or absence of 1.0 mM interfering substances. The experimental results (Table 2) indicate that glucose, ethanol, oxalic acid, and uric acid do not substantially affect the sensor’s determination of H2O2.
To further determine the performance of this non-enzymatic sensor, we investigated its operational repeatability and long-term stability. The operational stability of the 2 mM H2O2 electrocatalyst for 7 h was investigated by the same EPC/CHIT/GCE, and the results showed no significant change or difference. The standard deviation of H2O2 at the same concentration for ten consecutive times was only 0.8%, indicating that the sensor has good repeatability. In order to evaluate the repeatability between the different modified electrodes, the standard deviation of the response of the five separately prepared electrodes to the same concentration of H2O2 under the same conditions was only 2.3%, indicating that the electrodes still had high repeatability, which further explains the sensor with high practicality. The long-term stability was also systematically studied, and the same sensor was used to detect the same concentration of H2O2 every few days. After one month of research, the data showed no significant change, which means that the sensor had high long-term stability. The most critical reason for achieving such high repeatability and stability is that the EPC does not undergo denaturation or reduced activity like other proteins or enzymes, and the physicochemical properties of the material are extremely stable.
3.5. Possible Response Mechanism
Based on the above experimental results, it is speculated that the possible mechanism of the non-enzymatic sensor’s response to hydrogen peroxide is as follows:
eucalyptus porous carbon (Fe2+) + H2O2 + H+ → eucalyptus porous carbon (Fe3+) + H2O
eucalyptus porous carbon (Fe3+) + H2Q → eucalyptus porous carbon (Fe2+) + Q + H+
Among them, H2Q and BQ represent the electron mediator hydroquinone and its oxidized form (p-benzoquinone), respectively. Under the action of hydroquinone, two electron transfers occurred first, H2O2 was reduced to water, and the divalent iron ions in the porous carbon of eucalyptus were oxidized to ferric ions, while ferric ions in the eucalyptus porous carbon were reduced to divalent iron ions by hydroquinone. Subsequently, the p-benzoquinone rapidly acquired two electrons from the electrode and was reduced to hydroquinone. The peak current in the system is therefore related to the concentration of H2O2 in the solution.
4. Conclusions
In this paper, a porous carbon material with biological morphology was prepared by a simple and effective carbonization technique. The prepared EPC had high electrocatalytic activity and affinity for H2O2 with the aid of hydroquinone. The non-enzyme electrochemical sensors prepared using the ordered porous material had high sensitivity, high accuracy, high repeatability and stability. In addition, EPC provides researchers with new examples of non-enzymatic electrochemical sensors using natural structural carbon materials. It is believed that this type of naturally-ordered porous carbon material will have potential research and application value in the field of catalysis and analysis.
Author Contributions
S.W. and B.Y. designed experiments; S.W., N.T. and D.L. carried out experiments; and analyzed experimental results. S.W., B.Y. and C.-T.A. wrote the manuscript.
Funding
This work was supported by the National Natural Science Foundation of China (21772035, 21401088), Scientific Research Foundation of Hunan Institute of Engineering (18RC009), and Hunan Province Key Laboratory of Environmental Catalysis and Waste Rechemistry (Hunan Institute of Engineering).
Conflicts of Interest
The authors declare no conflict of interest.
References
- Li, J.L.; Han, T.; Wei, N.N.; Du, J.; Zhao, X. Three-dimensionally ordered macroporous (3DOM) gold-nanoparticle-doped titanium dioxide (GTD) photonic crystals modified electrodes for hydrogen peroxide biosensor. Biosens. Bioelectron. 2009, 25, 773–777. [Google Scholar] [CrossRef] [PubMed]
- Santucci, R.; Laurenti, E.; Sinibaldi, F.; Ferrari, R.P. Effect of dimethyl sulfoxide on the structure and the functional properties of horseradish peroxidase as observed by spectroscopy and cyclic voltammetry. Biochim. Biophys. Acta Protein Struct. Mol. Enzymol. 2002, 1596, 225–233. [Google Scholar] [CrossRef]
- Rosenzweig, Z.; Kopelman, R. Analytical properties and sensor size effects of a micrometer-sized optical fiber glucose biosensor. Anal. Chem. 1996, 68, 1408–1413. [Google Scholar] [CrossRef] [PubMed]
- Duarte, A.J.; Rocha, C.; Silveira, F.; Aguilar, G.G.; Jorge, P.A.; Leitão, J.M.; Algarra, M.; Esteves da Silva, J.C. Luminol-doped nanostructured composite materials for chemiluminescent sensing of hydrogen peroxide. Anal. Lett. 2010, 43, 2762–2772. [Google Scholar] [CrossRef]
- Grieshaber, D.; MacKenzie, R.; Voros, J.; Reimhult, E. Electrochemical biosensors-sensor principles and architectures. Sensors 2008, 8, 1400–1458. [Google Scholar] [CrossRef] [PubMed]
- Guascito, M.R.; Filippo, E.; Malitesta, C.; Manno, D.; Serra, A.; Turco, A. A new amperometric nanostructured sensor for the analytical determination of hydrogen peroxide. Biosens. Bioelectron. 2008, 24, 1063–1069. [Google Scholar] [CrossRef] [PubMed]
- Li, Y.; Zhang, J.J.; Xuan, J.; Jiang, L.P.; Zhu, J.J. Fabrication of a novel nonenzymatic hydrogen peroxide sensor based on Se/Pt nanocomposites. Electrochem. Commun. 2010, 12, 777–780. [Google Scholar] [CrossRef]
- Boujakhrout, A.; Díez, P.; Martínez-Ruíz, P.; Sánchez, A.; Parrado, C.; Povedano, E.; Soto, P.; Pingarrón, J.M.; Villalonga, R. Gold nanoparticles/silver-bipyridine hybrid nanobelts with tuned peroxidase-like activity. RSC Adv. 2016, 6, 74957–74960. [Google Scholar] [CrossRef] [Green Version]
- Sánchez, A.; Díez, P.; Villalonga, R.; Martínez-Ruiz, P.; Eguílaz, M.; Fernández, I.; Pingarrón, J.M. Seed-mediated growth of jack-shaped gold nanoparticles from cyclodextrin-coated gold nanospheres. Dalton Trans. 2013, 42, 14309–14314. [Google Scholar] [CrossRef] [PubMed]
- Gutierrez, F.A.; Giordana, I.S.; Fuertes, V.C.; Montemerlo, A.E.; Sieben, J.M.; Alvarez, A.E.; Rubianes, M.D.; Rivas, G.A. Analytical applications of Cu@ PtPd/C nanoparticles for the quantification of hydrogen peroxide. Microchem. J. 2018, 141, 240–246. [Google Scholar] [CrossRef]
- Zhao, X.; Li, Z.; Deng, Y.; Zhao, Z.; Li, X.; Xia, Y. Facile Synthesis of Gold Nanoparticles with Alginate and Its Catalytic Activity for Reduction of 4-Nitrophenol and H2O2 Detection. Materials 2017, 10, 557. [Google Scholar] [CrossRef] [PubMed]
- Toh, R.J.; Mayorga-Martinez, C.C.; Han, J.; Sofer, Z.; Pumera, M. Group 6 layered transition-metal dichalcogenides in lab-on-a-chip devices: 1T-phase WS2 for microfluidics non-enzymatic detection of hydrogen peroxide. Anal. Chem. 2017, 89, 4978–4985. [Google Scholar] [CrossRef] [PubMed]
- Jaime-González, J.; Mazario, E.; Menendez, N.; Sanchez-Marcos, J.; Muñoz-Bonilla, A.; Herrasti, P. Comparison of ferrite nanoparticles obtained electrochemically for catalytical reduction of hydrogen peroxide. J. Solid State Electrochem. 2016, 20, 1191–1198. [Google Scholar] [CrossRef]
- Gutierrez, F.A.; Mazario, E.; Menéndez, N.; Herrasti, P.; Rubianes, M.D.; Zagal, J.H.; Yañez, C.; Rivas, G.A.; Bollo, S.; Recio, F.J. Electrocatalytic Activity of Nanohybrids Based on Carbon Nanomaterials and MFe2O4 (M = Co, Mn) Towards the Reduction of Hydrogen Peroxide. Electroanalysis 2018, 30, 1621–1626. [Google Scholar] [CrossRef]
- Ryoo, R.; Joo, S.H.; Kruk, M.; Jaroniec, M. Ordered mesoporous carbons. Adv. Mater. 2001, 13, 677–681. [Google Scholar] [CrossRef]
- Yang, H.F.; Zhao, D.Y. Synthesis of replica mesostructures by the nanocasting strategy. J. Mater. Chem. 2005, 15, 1217–1231. [Google Scholar] [CrossRef]
- Mariwala, R.K.; Acharya, M.; Foley, H.C. Adsorption of halocarbons on a carbon molecular sieve. Microporous Mesoporous Mater. 1998, 22, 281–288. [Google Scholar] [CrossRef]
- Yu, L.; Falco, C.; Weber, J.; White, R.J.; Howe, J.Y.; Titirici, M.M. Carbohydrate-derived hydrothermal carbons: A thorough characterization study. Langmuir 2012, 28, 12373–12383. [Google Scholar] [CrossRef] [PubMed]
- Wang, J.N.; Zhang, L.; Niu, J.J.; Yu, F.; Sheng, Z.M.; Zhao, Y.Z.; Chang, H.; Pak, C. Synthesis of high surface area, water-dispersible graphitic carbon nanocages by an in situ template approach. Chem. Mater. 2007, 19, 453–459. [Google Scholar] [CrossRef]
- Laviron, E. General expression of the linear potential sweep voltammogram in the case of diffusionless electrochemical systems. J. Electroanal. Chem. Interfacial Electrochem. 1979, 101, 19–28. [Google Scholar] [CrossRef]
- Ruzgas, T.; Gorton, L.; Emnéus, J.; Marko-Varga, G. Kinetic models of horseradish peroxidase action on a graphite electrode. J. Electroanal. Chem. 1995, 391, 41–49. [Google Scholar] [CrossRef]
- Liu, J.; Bo, X.; Zhao, Z.; Guo, L. Highly exposed Pt nanoparticles supported on porous graphene for electrochemical detection of hydrogen peroxide in living cells. Biosens. Bioelectron. 2015, 74, 71–77. [Google Scholar] [CrossRef] [PubMed]
- Zhang, H.; Bo, X.; Guo, L. Electrochemical preparation of Pt nanoparticles supported on porous graphene with ionic liquids: Electrocatalyst for both methanol oxidation and H2O2 reduction. Electrochim. Acta 2016, 201, 117–124. [Google Scholar] [CrossRef]
- Zhang, Y.; Li, Y.; Jiang, Y.; Li, Y.; Li, S. The synthesis of Au@ C@ Pt core-double shell nanocomposite and its application in enzyme-free hydrogen peroxide sensing. Appl. Surf. Sci. 2016, 378, 375–383. [Google Scholar] [CrossRef]
- Amanulla, B.; Palanisamy, S.; Chen, S.M.; Velusamy, V.; Chiu, T.W.; Chen, T.W.; Ramaraj, S.K. A non-enzymatic amperometric hydrogen peroxide sensor based on iron nanoparticles decorated reduced graphene oxide nanocomposite. J. Colloid Interface Sci. 2017, 487, 370–377. [Google Scholar] [CrossRef] [PubMed]
- Kamin, R.A.; Wilson, G.S. Rotating-ring-disk enzyme electrode for biocatalysis kinetic-studies and characterization of the immobilized enzyme layer. Anal. Chem. 1980, 52, 1198–1205. [Google Scholar] [CrossRef]
- Tong, Z.Q.; Yuan, R.; Chai, Y.Q.; Xie, Y.; Chen, S. A novel and simple biomolecules immobilization method: Electro-deposition ZrO2 doped with HRP for fabrication of hydrogen peroxide biosensor. J. Biotechnol. 2007, 128, 567–575. [Google Scholar] [CrossRef] [PubMed]
Figure 1.
SEM images of EPC and EPC/CHIT/GCE: (A,B) perpendicular and parallel to the axial direction of EPC; (C) EPC/CHIT/GCE.
Figure 1.
SEM images of EPC and EPC/CHIT/GCE: (A,B) perpendicular and parallel to the axial direction of EPC; (C) EPC/CHIT/GCE.

Figure 2.
Characterization of EPC materials: (A) XRD; (B) FT-IR; (C) BET and (D) XPS spectroscopy.

Figure 3.
Cyclic voltammetry curves for different modified electrodes: (a) CHIT/GCE; (b) bare glassy carbon electrode; (c) EPC/CHIT/GCE. The buffer solution was N2 saturated 0.067 M PBS (pH 7, containing 1 mM hydroquinone) at a scan rate of 100 mV·s−1.
Figure 3.
Cyclic voltammetry curves for different modified electrodes: (a) CHIT/GCE; (b) bare glassy carbon electrode; (c) EPC/CHIT/GCE. The buffer solution was N2 saturated 0.067 M PBS (pH 7, containing 1 mM hydroquinone) at a scan rate of 100 mV·s−1.

Figure 4.
Cyclic voltammetry curves of EPC/CHIT/GCE with different concentrations of H2O2: (a) 0 mM; (b) 1 mM; (c) 1.5 mM; (d) 2 mM; (e) 2.5 mM and (f) 5 mM. The buffer solution was N2 saturated 0.067 M PBS (pH 7, containing 1 mM hydroquinone) at a scan rate of 100 mV·s−1.
Figure 4.
Cyclic voltammetry curves of EPC/CHIT/GCE with different concentrations of H2O2: (a) 0 mM; (b) 1 mM; (c) 1.5 mM; (d) 2 mM; (e) 2.5 mM and (f) 5 mM. The buffer solution was N2 saturated 0.067 M PBS (pH 7, containing 1 mM hydroquinone) at a scan rate of 100 mV·s−1.

Figure 5.
Cyclic voltammetry curves of EPC/CHIT/GCE at different scan rates: from inside to outside at 20, 40, 60, 80, 100, 120, 140, 160, 180, 200 mV·s−1; the input is the anode and cathode peak current and the scan rate square root curve. The buffer solution was nitrogen-saturated 0.067 M PBS (pH 7, containing 1 mM hydroquinone).

Figure 6.
Time-current curve of continuous addition of 0.1 mM H2O2 to different modified electrodes: (a) CHIT/GCE; (b) bare GCE; (c) EPC/CHIT/GCE. The buffer solution was N2 saturated 0.067 M PBS (pH 7, containing 1 mM hydroquinone), and the operating potential was −0.2 V vs. Ag/AgCl (sat. KCl).
Figure 6.
Time-current curve of continuous addition of 0.1 mM H2O2 to different modified electrodes: (a) CHIT/GCE; (b) bare GCE; (c) EPC/CHIT/GCE. The buffer solution was N2 saturated 0.067 M PBS (pH 7, containing 1 mM hydroquinone), and the operating potential was −0.2 V vs. Ag/AgCl (sat. KCl).

Figure 7.
Current-concentration curve of EPC/CHIT/GCE response to H2O2: The upper inset is the current-concentration curve for low-concentration H2O2; the lower inset is the Lineweaver-Burk curve for the sensor.
Figure 7.
Current-concentration curve of EPC/CHIT/GCE response to H2O2: The upper inset is the current-concentration curve for low-concentration H2O2; the lower inset is the Lineweaver-Burk curve for the sensor.


Table 1.
Analytical characteristics of different non-enzymatic hydrogen peroxide sensors.
| Platform | Detection Limit (μM) | Sensitivity (μA·mM−1·cm−2) | Linear Range (μM) | Reference |
|---|---|---|---|---|
| Pt/PG/GCE | <0.50 | 341.14 | 1–1477 | [22] |
| Pt-IL-pGR-GCE | 0.42 | 942.15 | 10–4000 | [23] |
| Au@C@Pt/GCE | 0.13 | 144.7 | 9–1860 | [24] |
| rGO/FeNPs nanocomposite | 0.06 | 208.5 | 0.1–2150 | [25] |
| EPC/CHIT/GCE | 3.7 | 204.5 | 15–1600 | This work |
Table 2.
Interference experiments of EPC/CHIT/GCE electrodes.
| Interference | Ratio of Current Values a |
|---|---|
| glucose | 1.00 |
| ethanol | 1.00 |
| oxalic acid | 1.02 |
| uric acid | 0.98 |
a is the current value of 1 mM interference and 0.1 mM hydrogen peroxide and comparison with only 0.1 mM H2O2.
© 2018 by the authors. Licensee MDPI, Basel, Switzerland. This article is an open access article distributed under the terms and conditions of the Creative Commons Attribution (CC BY) license (http://creativecommons.org/licenses/by/4.0/).
Share and Cite
MDPI and ACS Style
Wu, S.; Tan, N.; Lan, D.; Au, C.-T.; Yi, B. Construction and Application of a Non-Enzyme Hydrogen Peroxide Electrochemical Sensor Based on Eucalyptus Porous Carbon. Sensors 2018, 18, 3464. https://doi.org/10.3390/s18103464
AMA Style
Wu S, Tan N, Lan D, Au C-T, Yi B. Construction and Application of a Non-Enzyme Hydrogen Peroxide Electrochemical Sensor Based on Eucalyptus Porous Carbon. Sensors. 2018; 18(10):3464. https://doi.org/10.3390/s18103464
Chicago/Turabian StyleWu, Shuisheng, Nianyuan Tan, Donghui Lan, Chak-Tong Au, and Bing Yi. 2018. "Construction and Application of a Non-Enzyme Hydrogen Peroxide Electrochemical Sensor Based on Eucalyptus Porous Carbon" Sensors 18, no. 10: 3464. https://doi.org/10.3390/s18103464
Note that from the first issue of 2016, this journal uses article numbers instead of page numbers. See further details here.