Article

Pulse Oximetry with Two Infrared Wavelengths without Calibration in Extracted Arterial Blood

1
Department of Physics/Electro-Optics Engineering, Jerusalem College of Technology, 21 Havaad Haleumi St., 91160 Jerusalem, Israel
2
Department of Electro-Optical Engineering, Ben-Gurion University of the Negev. 1 Ben-Gurion Blvd, 8410501 Beer Sheva, Israel
3
Department of Neonatology, Shaare Zedek Medical Center, Shmuel Bait St 12, 9103102 Jerusalem, Israel
4
Pediatric Intensive Care Unit, Shaare Zedek Medical Center, Shmuel Bait St 12, 9103102 Jerusalem, Israel
5
Department of Electrical and Electronics Engineering, Jerusalem College of Technology, 21 Havaad Haleumi St., 91160 Jerusalem, Israel
*
Author to whom correspondence should be addressed.
Sensors 2018, 18(10), 3457; https://doi.org/10.3390/s18103457
Submission received: 14 August 2018 / Revised: 18 September 2018 / Accepted: 8 October 2018 / Published: 15 October 2018
(This article belongs to the Special Issue Sensors for Biosignal Processing)

Abstract

:
Oxygen saturation in arterial blood (SaO2) provides information about the performance of the respiratory system. Non-invasive measurement of SaO2 by commercial pulse oximeters (SpO2) make use of photoplethysmographic pulses in the red and infrared regions and utilizes the different spectra of light absorption by oxygenated and de-oxygenated hemoglobin. Because light scattering and optical path-lengths differ between the two wavelengths, commercial pulse oximeters require empirical calibration which is based on SaO2 measurement in extracted arterial blood. They are still prone to error, because the path-lengths difference between the two wavelengths varies among different subjects. We have developed modified pulse oximetry, which makes use of two nearby infrared wavelengths that have relatively similar scattering constants and path-lengths and does not require an invasive calibration step. In measurements performed on adults during breath holding, the two-infrared pulse oximeter and a commercial pulse oximeter showed similar changes in SpO2. The two pulse oximeters showed similar accuracy when compared to SaO2 measurement in extracted arterial blood (the gold standard) performed in intensive care units on newborns and children with an arterial line. Errors in SpO2 because of variability in path-lengths difference between the two wavelengths are expected to be smaller in the two-infrared pulse oximeter.

1. Introduction

Measurement of Oxygen Saturation in Arterial Blood

The primary mechanism of oxygen transport from the lungs to the cells of the body is via hemoglobin molecules in red blood cells. The oxygenation level of hemoglobin in arterial blood is estimated by the oxygen saturation in arterial blood, SaO2, which is defined as the ratio of the concentration of oxygenated hemoglobin to the concentration of total hemoglobin in the blood. SaO2 provides information about the performance of the respiratory system, and normal values of SaO2 are 94–98% for healthy adults at sea level.
SaO2 can be assessed in extracted arterial blood by means of co-oximetry or by measurement of blood gases. SaO2 can also be obtained noninvasively in vivo by pulse oximetry, which utilizes the different light absorption spectra for oxygenated and deoxygenated hemoglobin. In order to isolate the contribution of the arterial blood to the light absorption, photoplethysmography (PPG)—the measurement of light absorption changes due to cardiac-induced arterial blood volume changes—is used. Light transmission through tissue decreases during systole because of the increase in the arterial blood volume during systole and increases during diastole (Figure 1): the PPG signal reflects light absorption changes due to arterial blood volume changes. Due to the discrepancy between the oxygen saturation values obtained by measurements in extracted blood and by in vivo pulse oximetry, the latter are denoted by SpO2.
Several studies have shown a potential error of 3–4% between SpO2 and direct SaO2 measurements in extracted blood in critically ill adult patients [1,2]. An even larger error is expected in neonates and children in intensive care units [3,4,5,6].
The theory of conventional pulse oximetry has been described in several publications [7,8,9,10], and some aspects of it, relevant to our study, will be presented here. A PPG-based parameter R—the ratio of ratios—is defined by
R = ( A C / D C ) 1 ( A C / D C ) 2  
where AC and DC are the peak-to-peak amplitude and the mean value of the PPG pulse, respectively (Figure 1), and the subscripts 1 and 2 refer to the two wavelengths. Utilizing the Beer–Lambert equation, the measured parameter R and the physiological parameter SaO2 are related through Equation (2) [7,8,9]:
S a O 2 = ε D 1 R ε D 2 R ( ε O 2 ε D 2 ) + ( ε D 1 ε O 1 )  
where ε O and ε D are the extinction coefficients for HbO2 and Hb, respectively. Equation (2) is valid if light attenuation in tissue is only due to absorption by hemoglobin and scattering effects can be neglected. In addition, the relationship between SaO2 and R, given in Equation (2), is valid when AC/DC<<1. Otherwise, R in Equation (2) should be replaced by R’, where R’ is defined as the ratio of l n ( I D / I S ) for the two wavelengths:
R’ = [ln(ID/IS)]1/[ln(ID/IS)]2
The accuracy of Equation (2) is also limited because of the limited precision with which the values of the extinction coefficients of HbO2 and Hb are known; different studies provided significantly different data [11]. Since light scattering also contributes to light attenuation by increasing the path-lengths of the photons, and since the scattering constant and consequently the path-lengths increase depends on the wavelength, a correction term needs to be added to Equation (2) [9]:
S p O 2 = ε D 1 R ( l 2 / l 1 ) ε D 2 R ( l 2 / l 1 ) ( ε O 2 ε D 2 ) + ( ε D 1 ε O 1 )  
where l 1 and l 2 are the path-lengths for the two wavelengths. The path-lengths ratio, l 2 / l 1 , for a given pair of wavelengths is not known when a specific examination is performed, and only a rough estimate of its mean value can be obtained from the literature (see [9]). Since l 2 / l 1 varies between different subjects and between different clinical situations, assessment of SpO2 from R through Equation (4) is subject to error due to l 2 / l 1 variability, which increases as the difference between l 2 and l 1 increases.
As a consequence of the insufficient accuracy in the published data of both the path-lengths ratio and the hemoglobin extinction coefficients, the relationship between the clinical parameter SaO2 and the measured parameter R in pulse oximetry was found empirically for each type of commercial pulse oximeter sensor by calibration [7,12]. The calibration includes measurements of R in several healthy volunteers simultaneously with in vitro SaO2 measurement in extracted arterial blood by means of a co-oximeter, for several values of SaO2, obtained by reducing the oxygen fraction in the inhaled air. Utilizing the acquired set of R/SaO2 pairs, an empirical calibration formula such as:
SpO 2 = k 1 k 2 R k 3 k 4 R  
can be created [7], where k 1 k 4 are constants, determined from the experimental R/SaO2 pairs, for each pair of wavelengths. Equation (5) is based on Equation (4). Different empirical calibration formulae have also been used, as well as lookup tables [10,13,14].
As explained above, the assumption that there are constant factors k 1 k 4 relating R and SaO2 for a given pair of wavelengths leads to an inevitable error since the use of k 1 k 4 values provides a single mean value for the path-lengths ratio, l 2 / l 1 , while the latter is subject to variability between persons and clinical situations. The effect of those fluctuations on the accuracy of SaO2 measurement increases as the path-lengths l 1 and l 2 differ from one another. For wavelengths in the red and infrared regions (such as 660 nm and 940 nm in some commercial pulse oximeters), the difference in scattering constant is significant—about 15% [15].
By using two nearby wavelengths in the infrared region, the difference between the corresponding scattering constants and path-lengths is reduced [9,16]. In this case, the natural variation in the path-lengths ratio between persons is expected to lead to errors that are small relative to those experienced when using pulse oximetry that uses two wavelengths, one of which is in the red and the other in the infrared region. In our study in 2014 [16], measurements on healthy persons by a pulse oximeter which was based on a pair of laser diodes with wavelengths of 780 nm and 808 nm exhibited SpO2 values between 95.3% and 100.5%. These results were similar to those of a commercial pulse oximeter: the maximal difference between them for each examinee was 2.5%.
The pulse oximeter in that study has two major limitations: the use of laser diodes and the use of two wavelengths that are very close. Laser diodes are expensive, inconvenient to use and require temperature stabilization. The difference between the two wavelengths used in that study was very small, rendering the values of the corresponding extinction coefficients very close. As a result, the calculation of SpO2 from Equation (2) or Equation (4) became very sensitive to small errors in the measurement of the PPG pulse amplitude, which is the basis for R measurement. In the current study, we measured SpO2 by a pulse oximeter with a dual light emitting diode (LED) with two infrared wavelengths and compared the results with SpO2 measured by a commercial pulse oximeter, with two wavelengths in the red and infrared regions.

2. Materials and Methods

Approval of the study was given by the Shaare Zedek Medical Center Institutional Review Board on 27 July 2014 (#32/14) and was extended on 17 August 2015 and 26 July 2017. Informed consent was obtained from each adult who was examined and from the parents of each examined child and newborn.

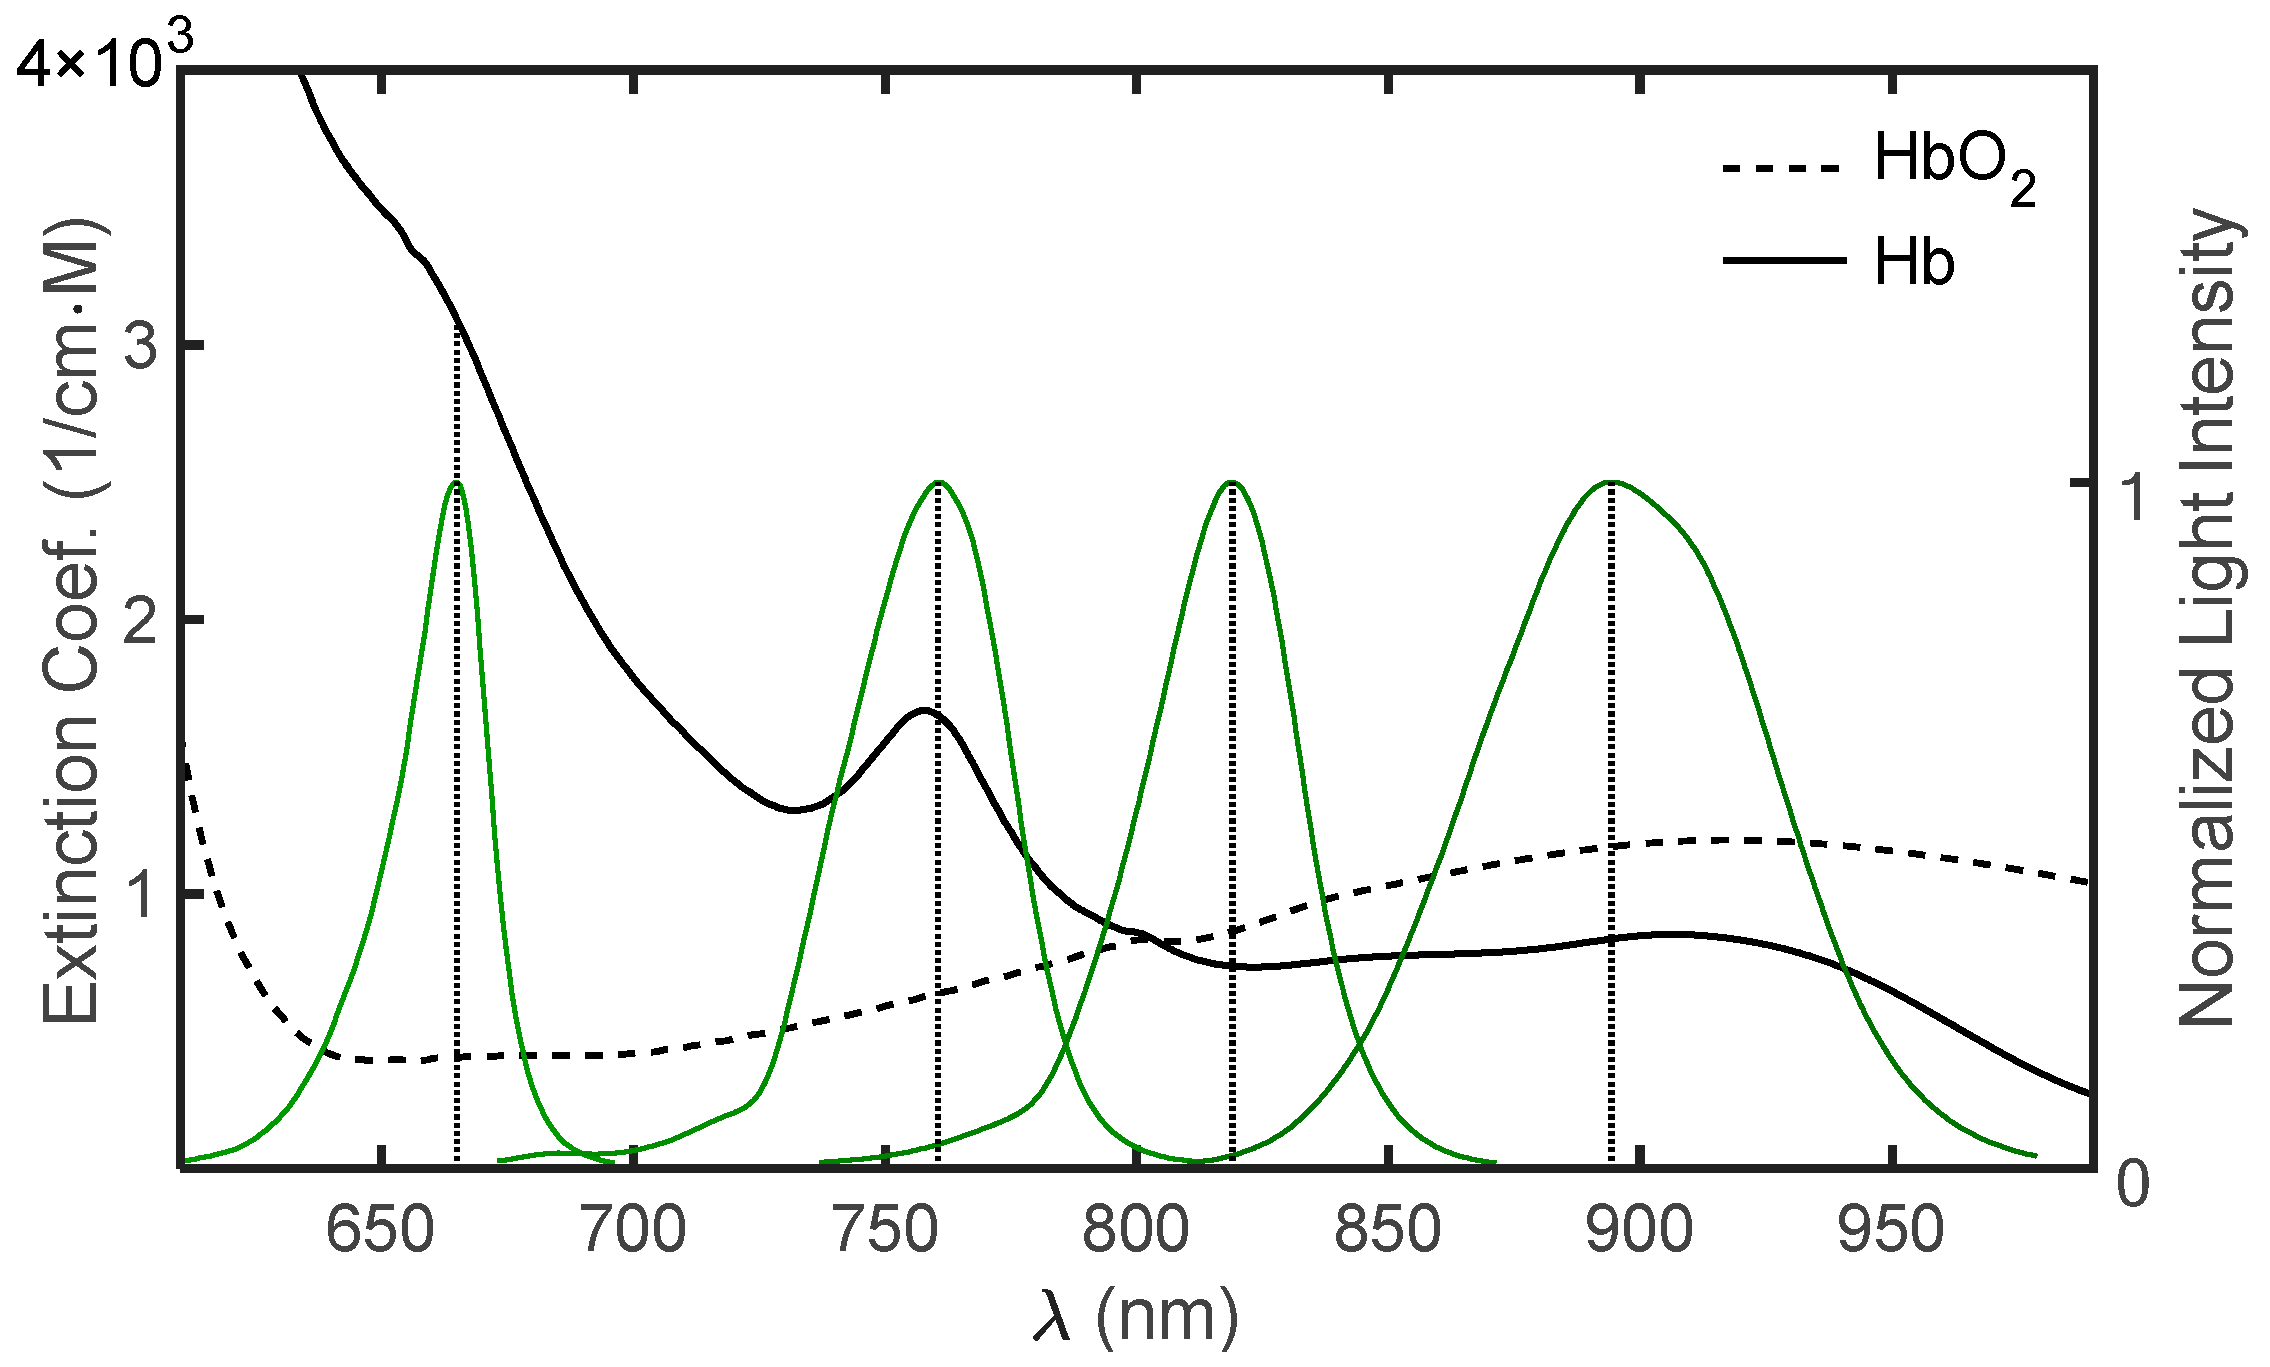
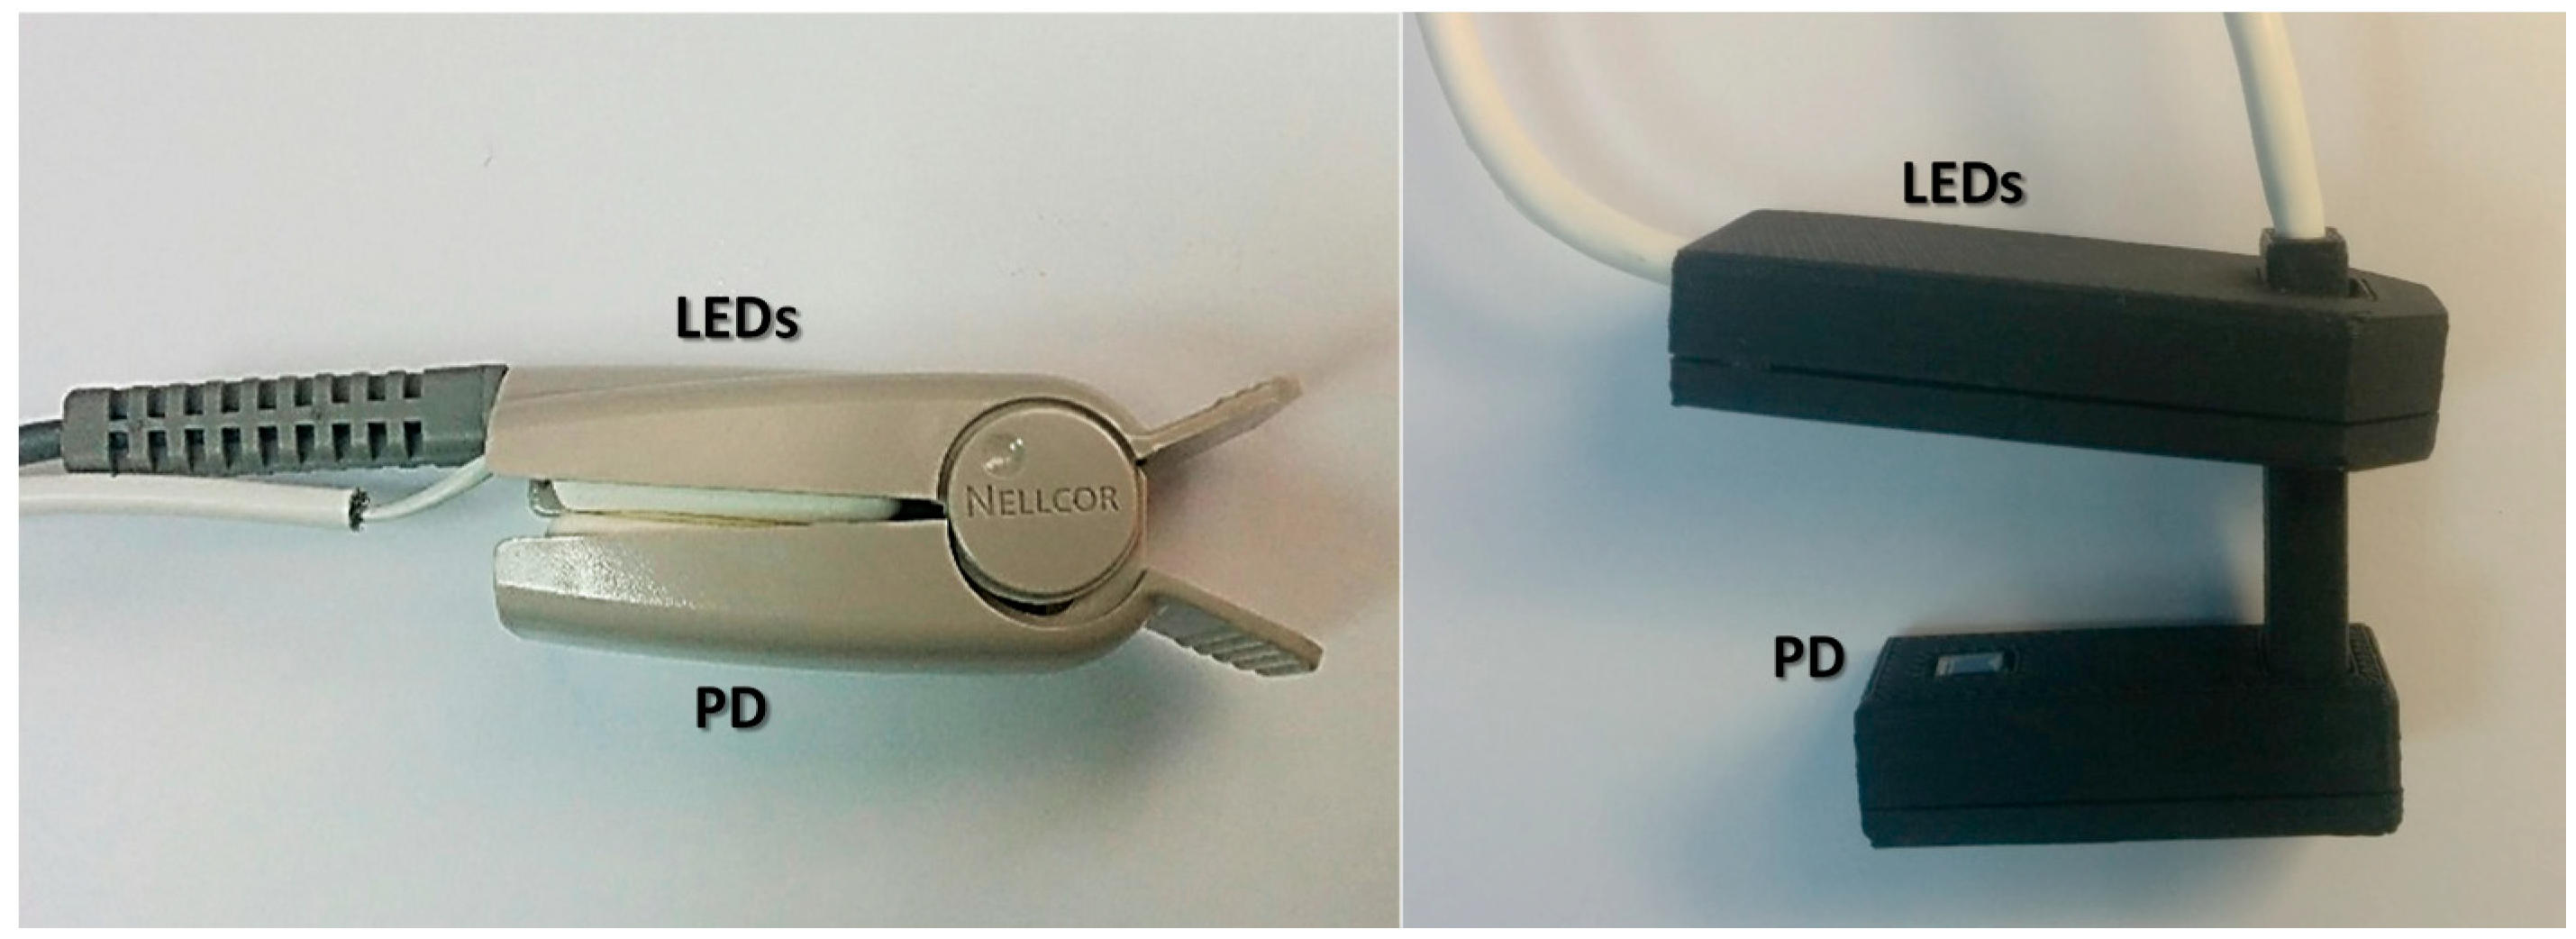
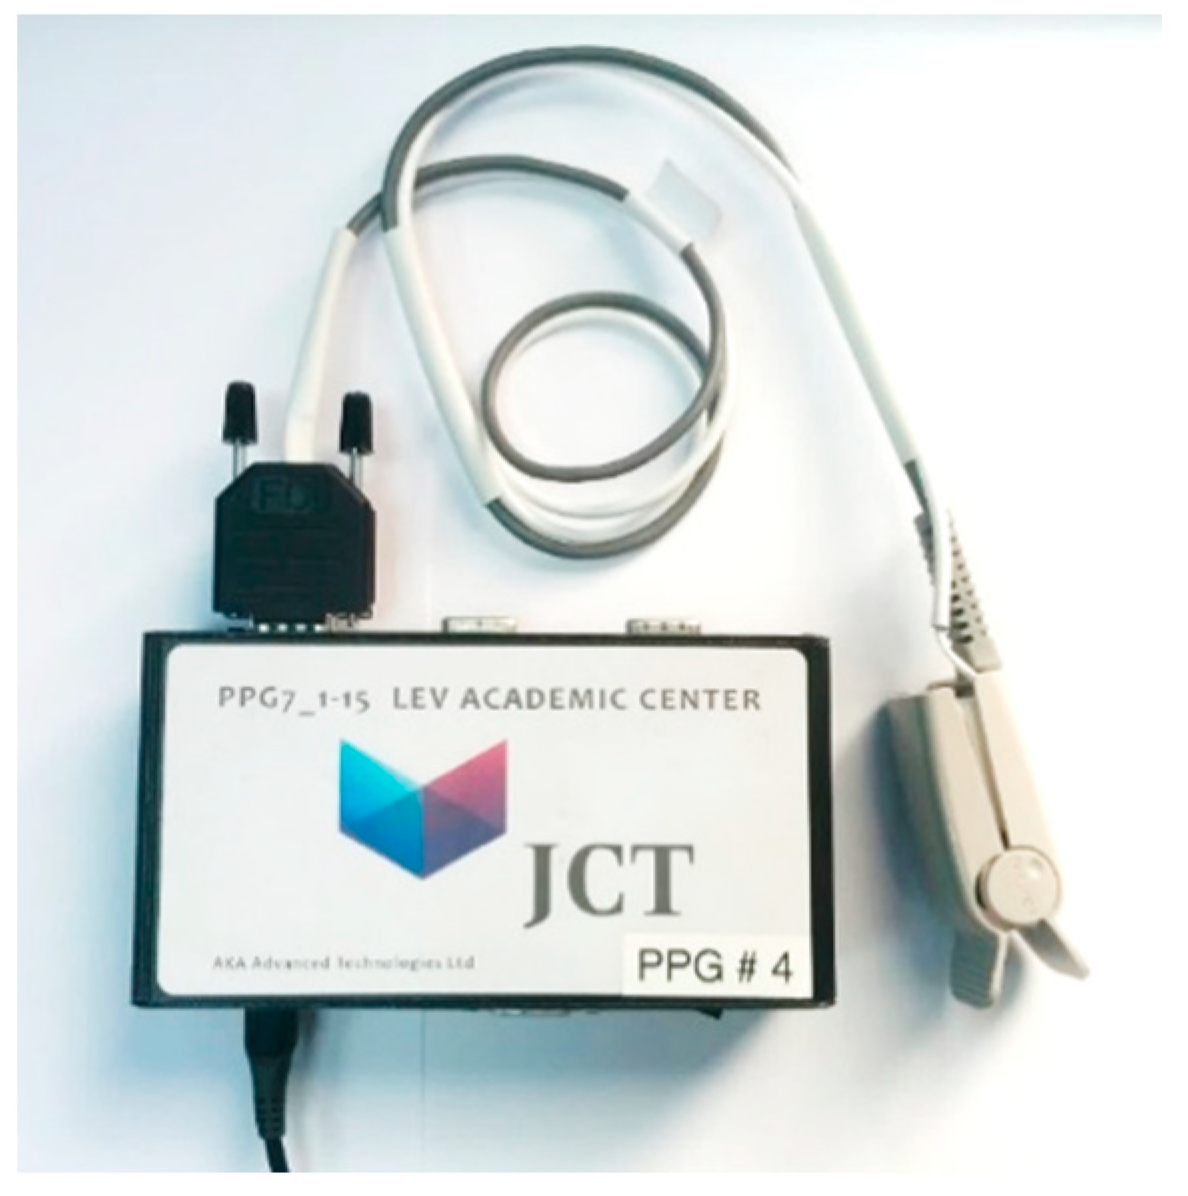
2.1. The Pulse Oximeter

The pulse oximeter with a dual LED with two infrared wavelengths (761 nm and 818 nm) was designed and constructed at the Jerusalem College of Technology (JCT). The JCT pulse oximeter was compared to commercial Nellcor pulse oximeters that make use of two wavelengths in the red and infrared regions (665 nm and 894 nm). The JCT pulse oximeter consisted of an optical probe, an electronic device and a laptop computer, for displaying the PPG signals and analyzing them.
The probe included a dual light emitting diode (LED), emitting light in two infrared wavelengths, and a photodetector. The emitted light spectra of the two infrared LEDs and the red and infrared LEDs of the Nellcor pulse oximeter probe (measured by a spectrometer, AvaSpec-2048, Avantes, The Netherlands) are presented in Figure 2, together with the extinction coefficient curves of Hb and HbO2, according to Zijlstra’s results [11,17].
The finger probe for adults used with the JCT pulse oximeter consisted of a Nellcor finger probe with a soft contact surface, in which the Nellcor dual LED which emitted light with wavelengths of 665 nm and 894 nm was replaced by a dual LED emitting light at two infrared wavelengths. The foot probe for newborns was composed of two facing rigid plastic elements, with a small variable angle between them (Figure 3). The probe was constructed by a three-dimensional (3D) printer at JCT.
The control unit of the JCT pulse oximeter (Figure 4) controlled the current to the LEDs in the probe and digitized the photodetector output. Light from the two LEDs was emitted sequentially, by time-sharing the current supplied to the LEDs. The transmitted light of each wavelength was detected correspondingly by the photodetector, in synchronization with the current time-sharing. The signal was digitized (at 8000 samples/s with a 16-bit analog to digital converter) and every group of eight samples were averaged. The resultant signal, sampled at 1000 samples/s, was conveyed to a laptop for offline analysis using MATLAB. The power to the PPG device was supplied by batteries.

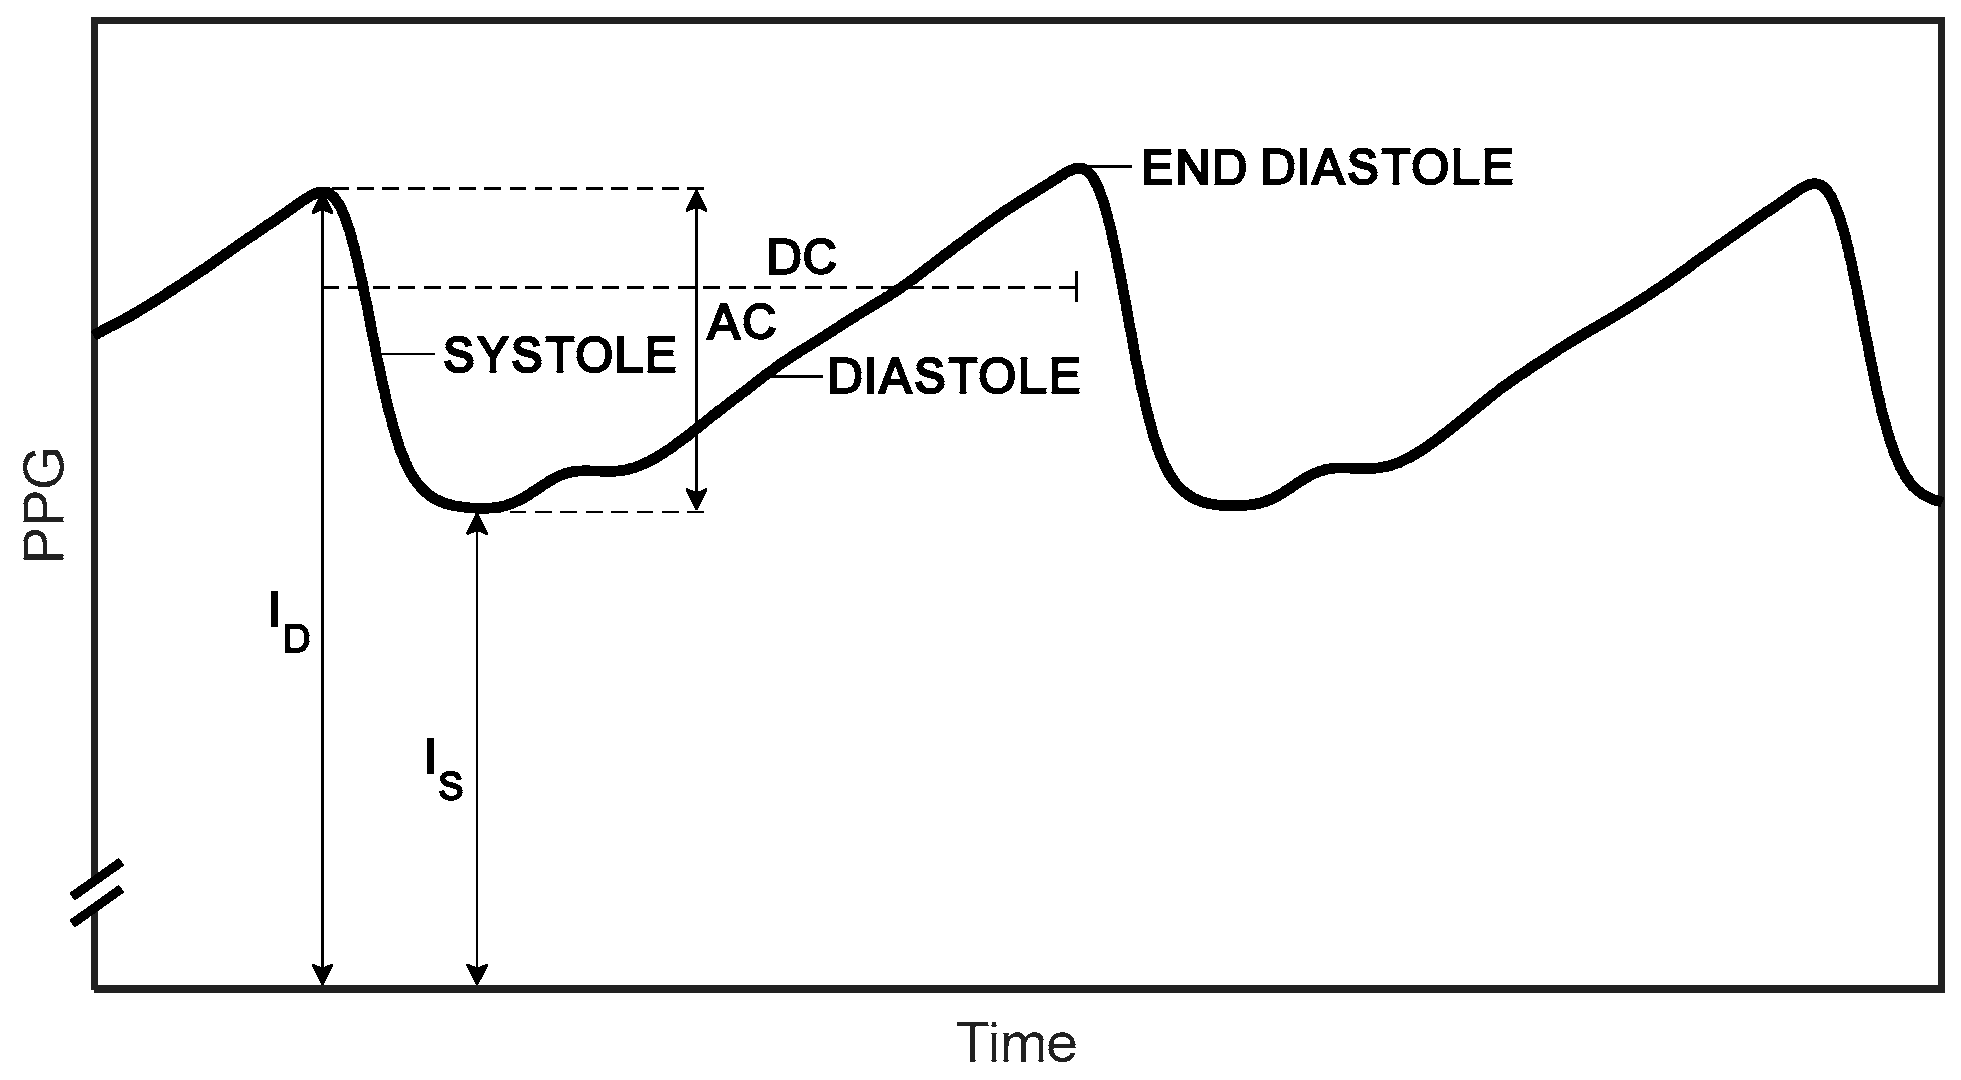
2.2. Determination of SpO2

SpO2 was determined by using a modified version of Equation (2):
S p O 2 = ε D 1 R ε D 2 R ( ε O 2 ε D 2 ) + ( ε D 1 ε O 1 )  
where R’ is as given in Equation (3). As explained above, Equation (2) (with R as defined in Equation (1)) is valid if I D I S is small relative to I S . We have found that when I D I S is more than 3% of I S , the difference between R and R’ cannot be neglected, and in this study, the ratio of ratios was calculated as the ratio of l n ( I D / I S ) for the two wavelengths.
As described in our article in 2014 [16], the peak intensity of the PPG pulse, I D , exhibits fluctuations of low and high frequencies, and the value of the PPG signal at the time of the pulse peak (end-diastole) might be different than what its value would have been at the time of the pulse minimum. The value of I D , used for a given pulse, was taken as the value of the point of the line connecting the two maxima of the pulse at the time of the pulse minimum (see Figure 7 in [16]).
In order to derive SpO2 from Equation (6), the values of ε O and ε D must be known at the relevant wavelengths. As explained in the Introduction, the absorption spectra for Hb and HbO2 were measured by several research groups and their reported values differed from group to group [11]. Since the results of our previous study [16] were in best agreement with the extinction coefficient data of Zijlstra, we used those data in the current study.
In our study described in [16], we used laser diodes, which had narrow spectra. In the current study, we used LEDs, which had relatively broad spectra (Figure 2)—they had spectral widths of several tens of nanometers, so that the values of ε O and ε D changed along the spectrum. The mean extinction coefficients of Hb and HbO2 for the LED lights were taken as the weighted mean extinction coefficients, ε O M and ε D M , defined by:
ε D M = i ε D ( λ i ) I ( λ i ) i I ( λ i ) , ε O M = i ε O ( λ i ) I ( λ i ) i I ( λ i )  
where ε D ( λ i ) and ε O ( λ i ) are the extinction coefficients at the wavelength λ i for Hb and HbO2, respectively, and I ( λ i ) is the light intensity of the LED at λ i . The variable i is an index that designates the wavelength in the LED spectrum. I ( λ i ) for each LED was measured using a spectrometer and the values of Zijlstra ε ( λ i ) were taken from the Kim and Liu articles [11,17]. For the wavelength range of 450–800 nm, Zijlstra’s data were given every two nanometers, and in the range of 800–1000 nm, data were only presented for nine wavelengths. The values of ε D ( λ i ) and ε O ( λ i ) were determined from Zijlstra’s data by using cubic spline interpolation.

2.3. Subjects and Methods

In the framework of the study, we compared SpO2 values obtained by the JCT pulse oximeter, which is based on two infrared wavelengths, with values obtained by a commercial pulse oximeter (Nellcor Bedside SpO₂, Covidien-Medtronic, Minneapolis, MI, USA), in measurements on 32 healthy male adults who were asked to hold their breath. After obtaining informed consent, the Nellcor probe, with one wavelength in the red and one in the infrared wavelengths, was attached to the examinee’s index finger and the JCT probe, with two infrared wavelengths, was attached to the examinee’s middle finger on the same hand. The examinee was asked to breathe according to a predetermined pattern that was displayed on a PC screen: regular breathings of 2.5 s inspiration and 2 s expiration for 30 s, then breath holding for 30 s, followed by regular breathings (the same as in the first stage) for 60 s. During the examination, the SpO2 values of the two pulse oximeters were recorded every 10 s, and the correlation between the SpO2 results of the two devices was calculated.
We also compared SpO2 measurements by the JCT pulse oximeter and a commercial pulse oximeter (Nellcor Bedside SpO2, Covidien-Medtronic, Minneapolis, MN, USA) with SaO2 measurement in extracted blood from an artery in a hospital setting. SaO2 measurement using extracted arterial blood and performed by a co-oximeter is the gold standard of SaO2 measurement. In the current study, non-invasive SpO2 was measured by the two pulse oximeters and was compared to in vitro SaO2 measurements in extracted blood from the umbilical artery in neonates or from an artery in the hand or foot in children. The examinations were performed in the neonatal intensive care unit (NICU) and in the pediatric intensive care unit (PICU), both at Shaare Zedek Medical Center, Jerusalem, Israel. The blood was extracted for medical purposes in order to monitor the patient’s blood gases. The SaO2 measurement in extracted blood was performed by means of a commercial co-oximeter (ABL90-Flex analyzer, Radiometer, Brønshøj, Copenhagen, Denmark). Informed consent was obtained from the parents of the children and the neonates.
The SpO2 measurements on the neonates were performed on the two feet of the examinee, using the JCT probe shown in Figure 3, which included a dual LED with two infrared wavelengths, 761 nm and 818 nm. The examinations on children were performed on the fingers using the same probe. The Nellcor probe consisted of a flexible band that was attached to the foot of the neonate in the NICU or to a finger of the child in the PICU.

3. Results

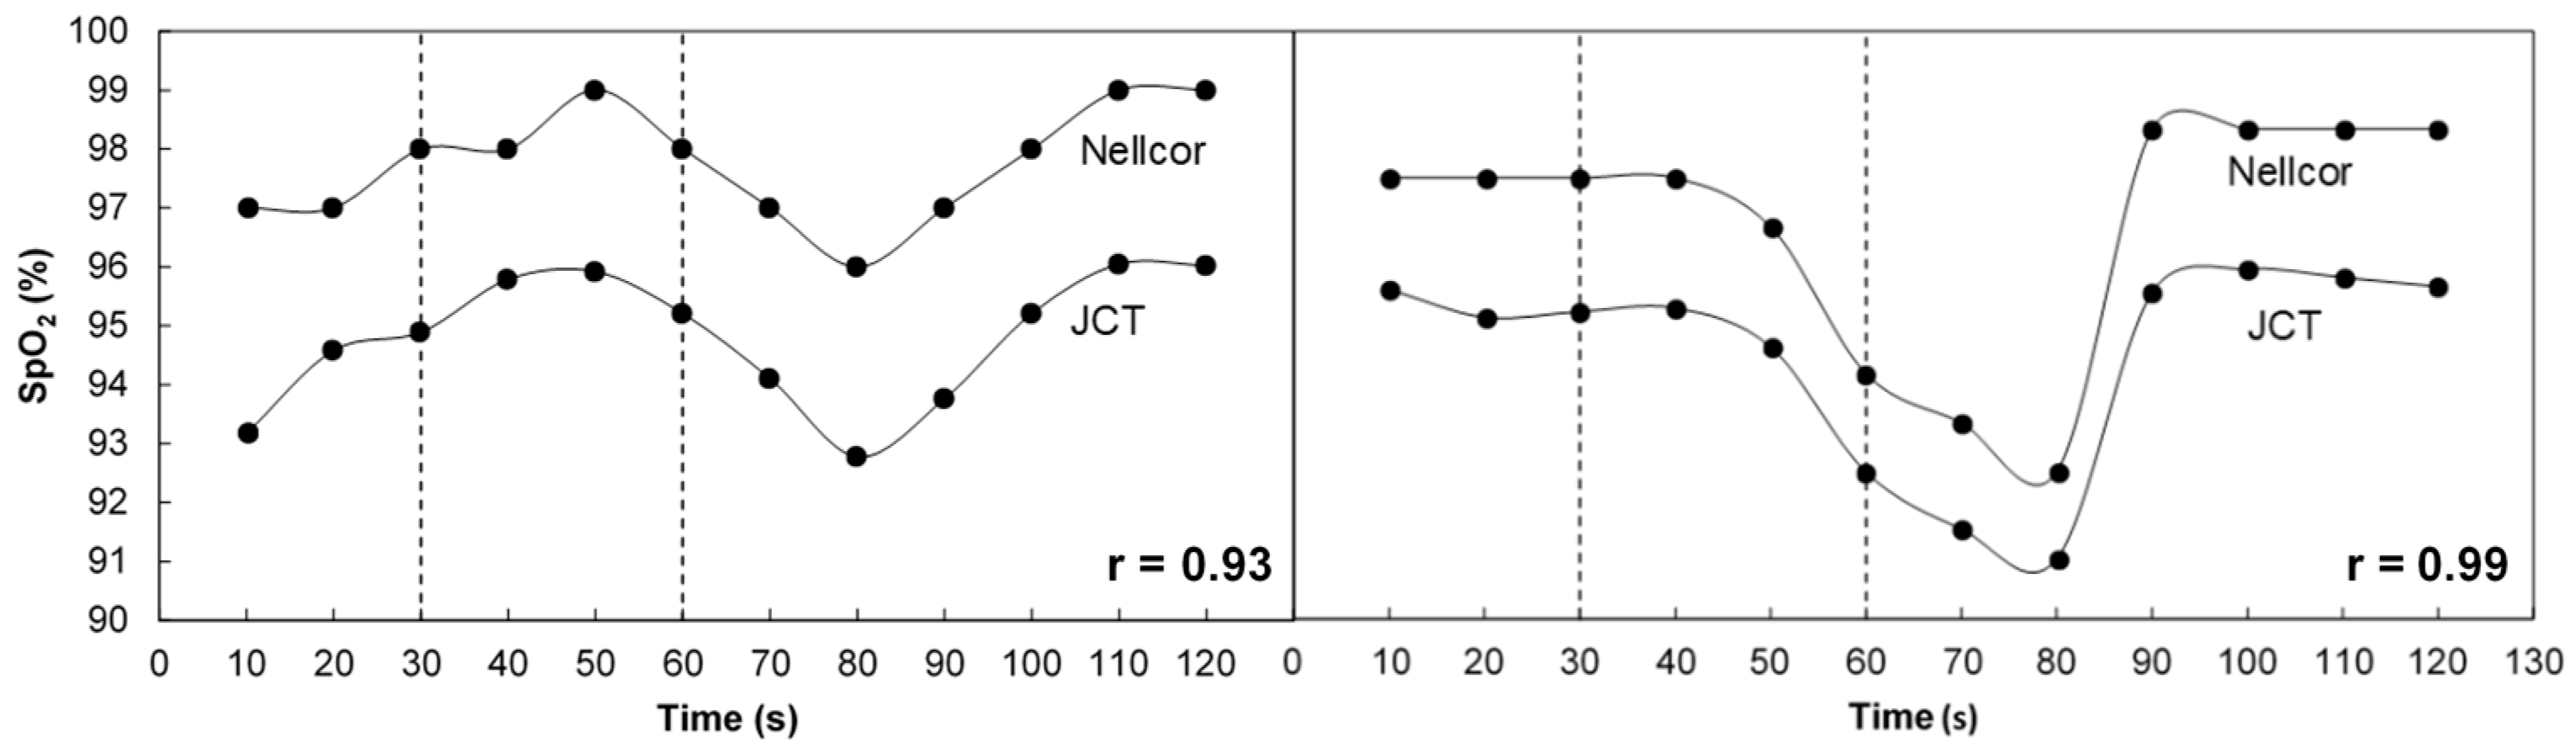
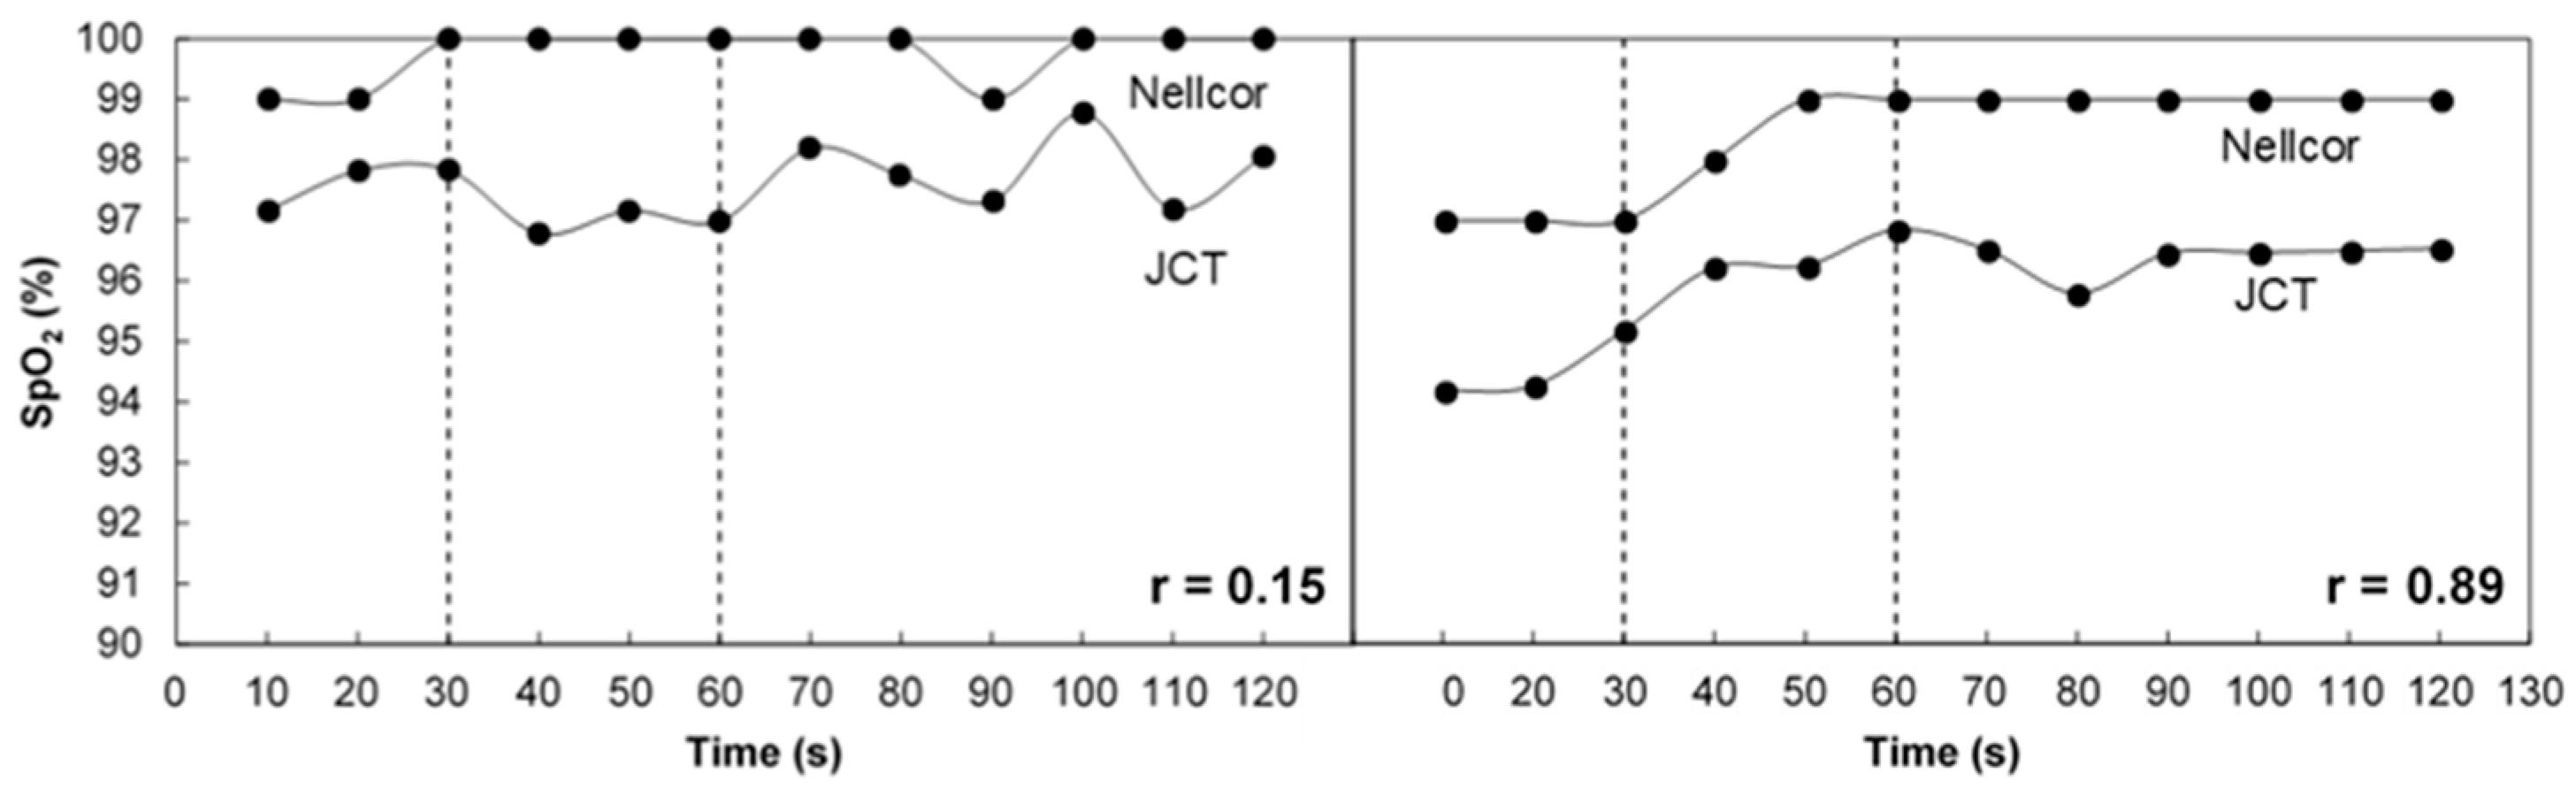
3.1. SpO2 Measurement in Breath Holding

In this study, SpO2 was measured on 32 healthy examinees who were asked to hold their breath for a period of 30 s (as described in the Materials and Methods Section). The SpO2 examinations were performed using a Nellcor pulse oximeter and the JCT pulse oximeter. The latter, which makes use of Equation (2), showed consistently lower SpO2 values than the former, probably due to the factor l 2 / l 1 that should multiply R in Equation (4). Taking λ 1 as the lower wavelength, l 1 is greater than l 2 since the scattering constant decreases with increasing wavelength, and l 2 / l 1 is smaller than one. When R in Equation (2) is replaced by R ( l 2 / l 1 ) , SpO2 increases [9].
Figure 5 presents the SpO2 values of two of the examinees during the desaturation and re-saturation periods, as measured by the two pulse oximeters. Note that the display of the Nellcor device shows the SpO2 results with a resolution of 1%, while the resolution of the JCT device was 0.1%. In the examination described in the left figure, SpO2 increased during the first 50 s of the examination, then decreased—effects that appeared in the majority of the examinations. In the other examination, SpO2 remained almost constant during the first 40 s of the examination, then decreased. In both examinations, SpO2 decreased until about 80 s due to the breath holding and then increased.
In general, the SpO2 vs. time curves for the different participants exhibited similar patterns. In the first 40–60 s of the examination, SpO2 either remained constant or increased by 1–4%. About 20–40 s after the subject started holding his breath, the majority of the participants showed a decrease in SpO2 of up to 5% for about 30 s, and then SpO2 increased. Note the delay in the decrease of SpO2 in the finger after the subject started holding his breath. Delays in the detection of hypoxemia when the pulse oximeter probe is placed on the finger have been reported [18,19].
The correlation between SpO2 measured by the two pulse oximeters in the individual examinations was high: in 30 out of 32 examinations, the correlation coefficient was higher than 0.50 (in two examinations the correlation coefficient was 0.155 and 0.45). The mean correlation coefficient for all the examinations was 0.86 and the median was 0.91, and in only eight examinations was the correlation coefficient lower than 0.85. In some examinations, the change in SpO2 due to breath holding was absent or small; in these examinations, even small discrepancies between the two pulse oximeters, such as those due to the rounding of the SpO2 values to whole digits in the commercial devices, could reduce the correlation between SpO2 values measured by the two pulse oximeters. Figure 6 presents two examinations with a relatively low correlation coefficient in which the change in SpO2 due to breath holding was absent or small. In the left figure, the SpO2 values obtained by the JCT pulse oximeter demonstrated various values between 96.3% and 98.3%, while the Nellcor SpO2 values only showed values of 99% and 100%.
For more reliable assessment of the correlation between the two devices, we only selected examinations in which SpO2 values decreased by 1.5% or more after breath holding. Such a criterion ensures that the Nellcor device, which only displays whole numbers, also shows the desaturation due to breath holding. Twenty-five examinations fulfilled this criterion, and the average correlation coefficient between SpO2 values obtained for this group by the two pulse oximeters was 0.91 ± 0.085. The correction factor for the JCT pulse oximeter due to the difference in path-lengths between the two wavelengths [9] was 1.035 for the whole group of examinations. The correction factor was taken as the ratio of the mean Nellcor–SpO2 and the mean JCT–SpO2 for the whole group of examinations.
Figure 7 presents the mean SpO2 value as a function of time for the two devices, obtained for the whole group of examinees. The mean value of SpO2 increased up to 20 s after the start of breath holding, then decreased for 30 s, then increased.
The increase of SpO2 by about 1% after the start of the examination happened for the majority of the examinees and may be attributed to the change in the respiration pattern, from spontaneous respiration to the guided breathings of 2.5 s inspiration and 2 s expiration at the beginning of the examination. The delay of about 20 s in the SpO2 decrease after the start of the breath holding and in the SpO2 increase after the end of the breath holding is probably due to the transit time of the blood to the fingers [19].

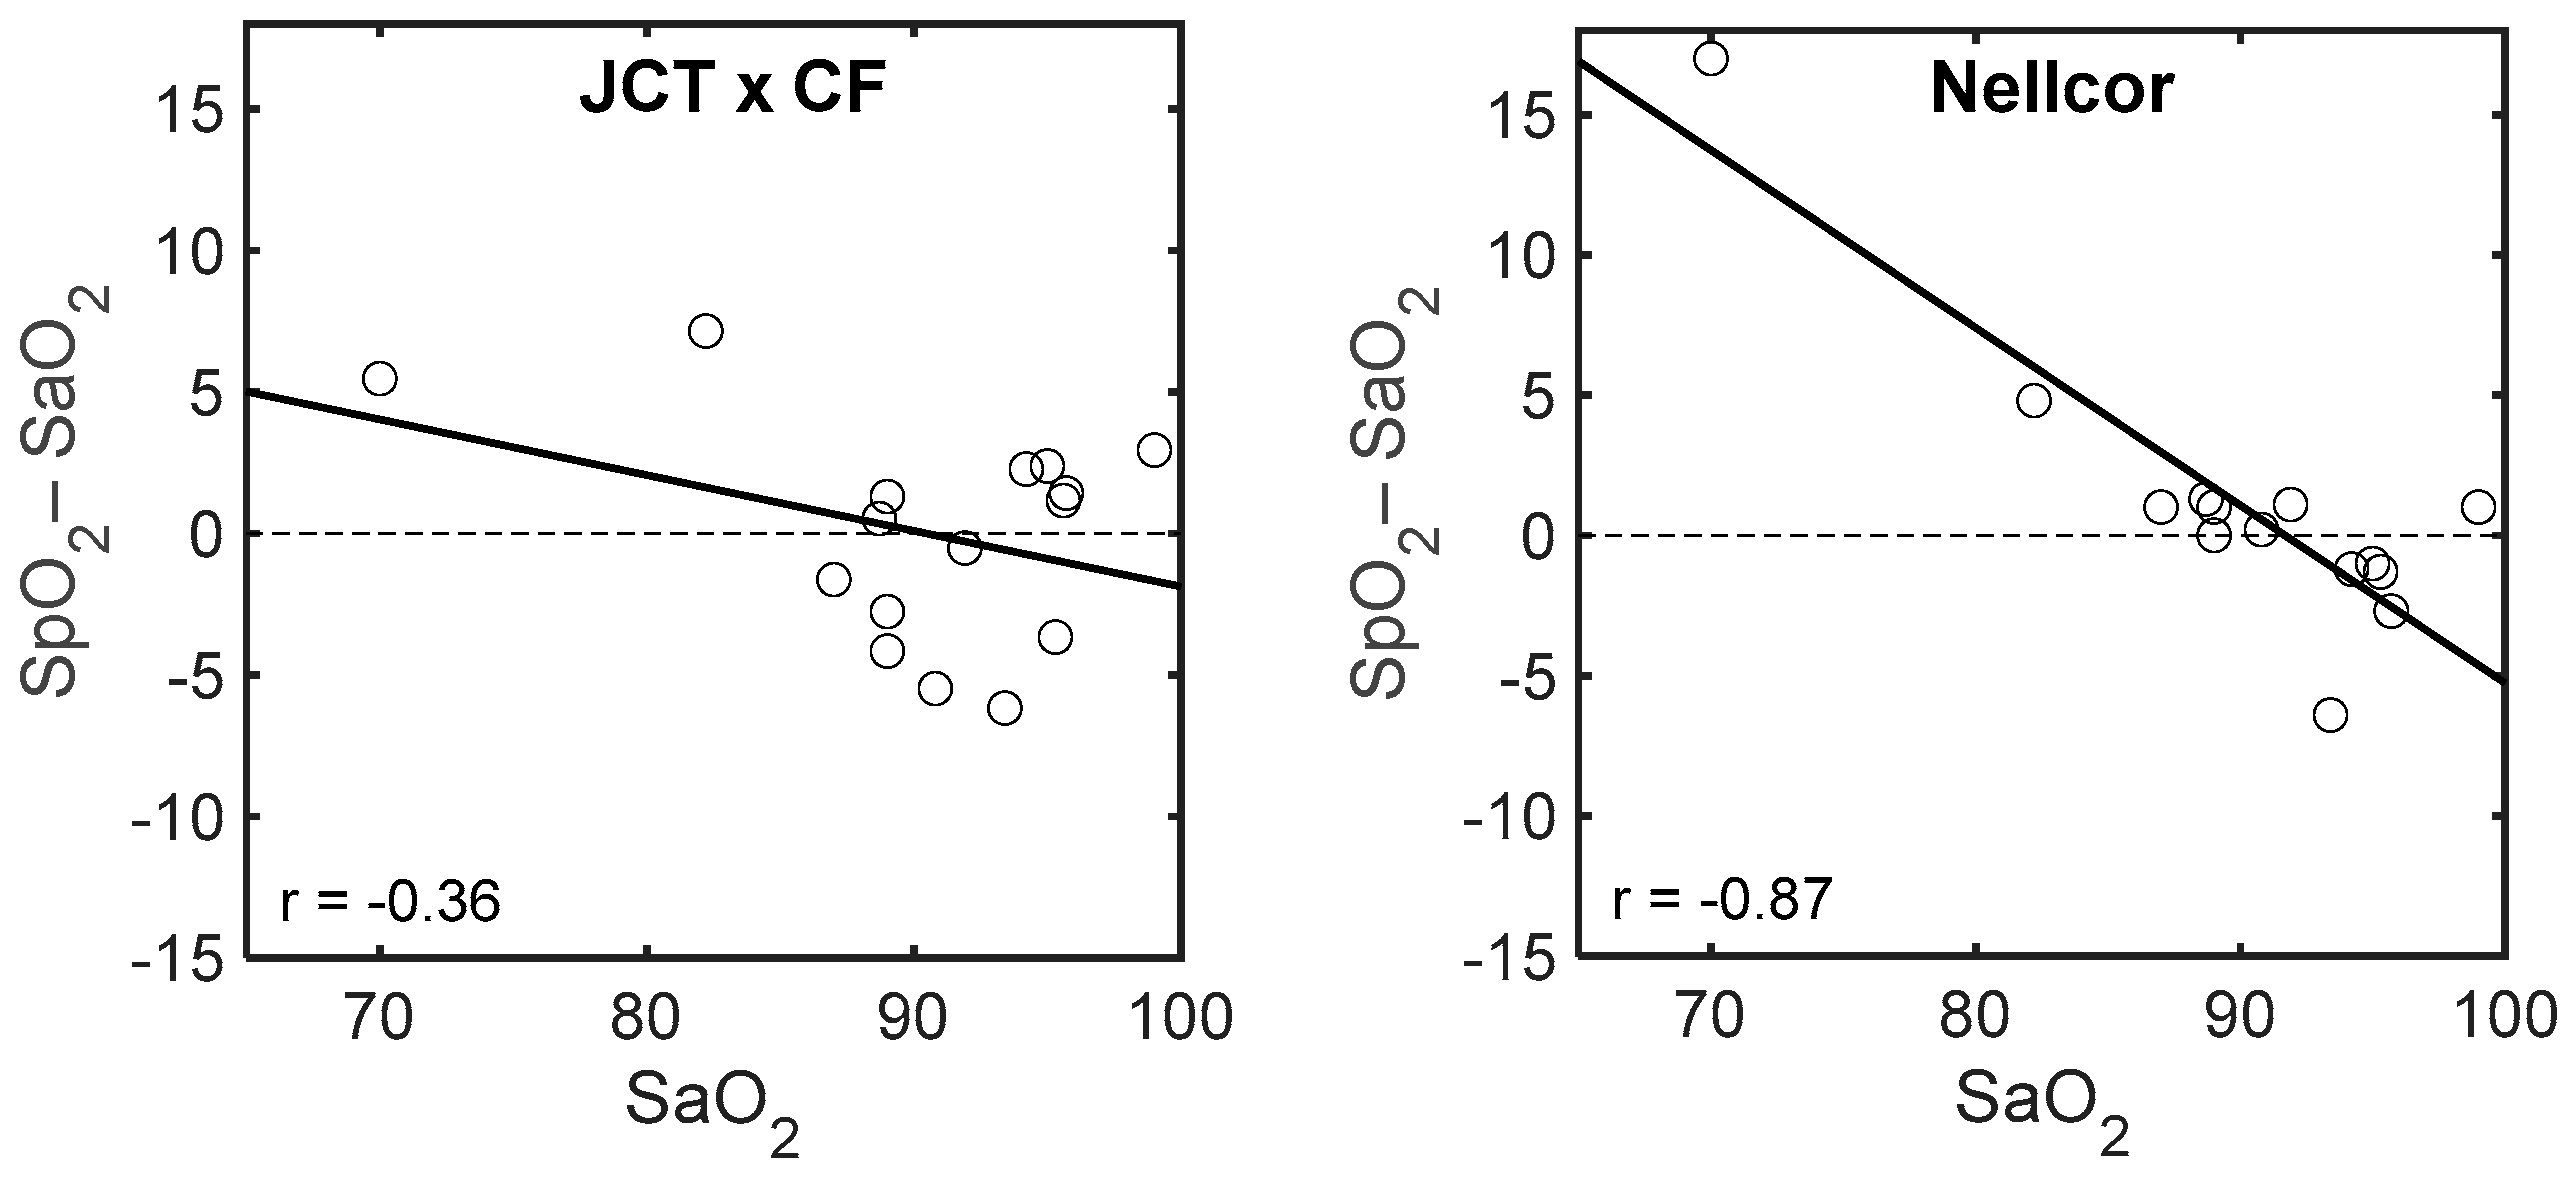
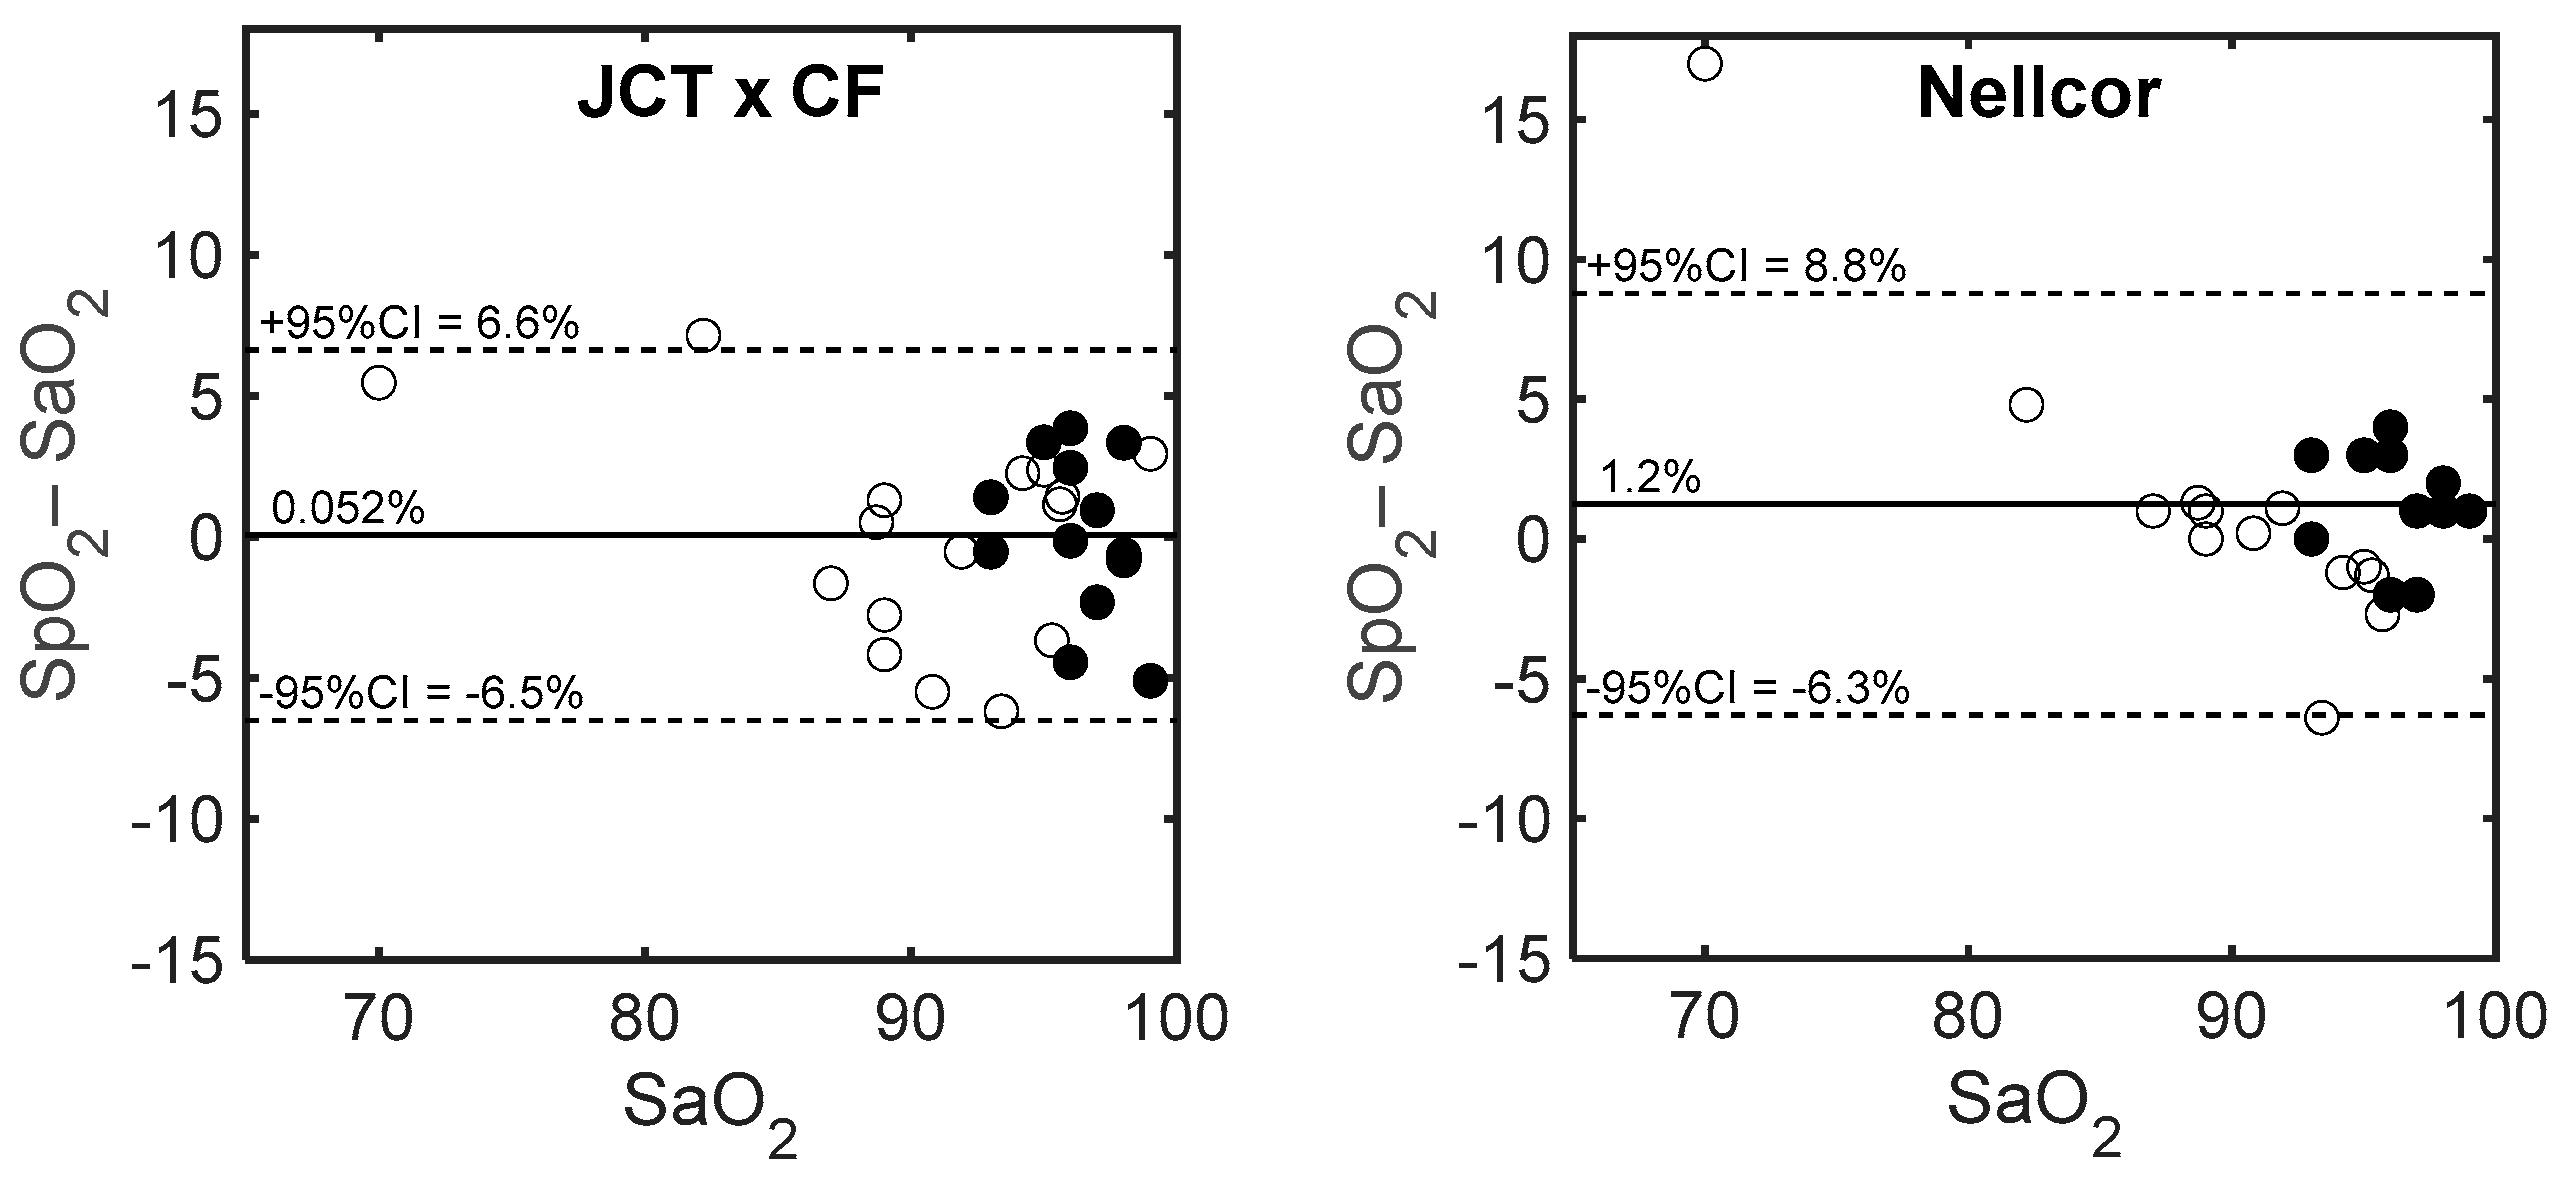
3.2. Comparison of SpO2 with Invasive Measurement of SaO2

In order to assess the accuracy of SpO2 measurement by the JCT pulse oximeter, SaO2 and SpO2 were measured on neonates and children in the NICU and PICU who had arterial lines. SpO2 was measured simultaneously by the JCT pulse oximeter and a Nellcor pulse oximeter shortly after an arterial blood sample was extracted from the examinee for clinical purposes. Direct measurement of SaO2 in extracted arterial blood is the gold standard for arterial oxygen saturation measurement.
Table 1 presents SpO2 and SaO2 values as obtained by the two pulse oximeters and the invasive technique in the NICU and PICU. The derivation of SpO2 by the technique that is based on two infrared wavelengths (JCT–SpO2) was done by using the mean extinction coefficient, calculated over the emission spectra of the LEDs, as described in Section 2. Table 1 also presents the ratio SaO2/JCT–SpO2 for each examination. The mean of SaO2/JCT–SpO2, 1.055, was taken as a correction factor for JCT–SpO2 in order to compensate for the difference in the path-lengths between the two infrared wavelengths. The two right columns present the difference between Nellcor–SpO2 and SaO2 and between the corrected value of JCT–SpO2 and SaO2.
The mean of the difference between Nellcor–SpO2 and SaO2 was 3.84% ± 1.24 and between the corrected JCT–SpO2 and SaO2 was practically zero (due to the correction factor) and had a standard deviation of 3.35%. In one of the neonates’ examinations, the discrepancy between Nellcor–SpO2 and SaO2 was 17%: SaO2 was 70% and Nellcor–SpO2 was 87%. It is known that SpO2 measurements made when SaO2 is below 80% are subject to larger errors than those in which measurements are made when SaO2 is above 80% [6,20], but this very large error seems to be exceptional. If we delete this outlier, the mean and standard deviation of the difference between Nellcor–SpO2 and SaO2 becomes 2.33% ± 0.66.
The correlation coefficient between Nellcor–SpO2 and SaO2 was 0.776, and after removing the measurement with a 17% discrepancy, the correlation coefficient increased to 0.857. The correlation coefficient between JCT–SpO2 and SaO2 was 0.845.
The positive value of the mean difference between Nellcor–SpO2 and SaO2 is in accordance with the discrepancy in SpO2 measurements in neonates found in Ross et al. [4]. The standard deviation of the two pulse oximeters was above 3%, similar to the standard deviation reported for the SpO2 deviation from SaO2 in neonates [4,5].
Bland–Altman plots of SpO2–SaO2 vs. SaO2 for the Nellcor and the JCT pulse oximeters are presented in Figure 8. (In order to compare the parameter-difference for the two devices, the same parameter, SaO2, was used in the abscissa). The range of the SaO2 data of the PICU children was small: 93–100%, and that of the neonates was larger: 70–99%. The difference between JCT–SpO2 and SaO2 for the neonates was uniform through the SaO2 range, while for the Nellcor–SpO2 measurements, SpO2–SaO2 was positive for SaO2 below 85% and negative above 90%. The regression lines of SpO2–SaO2 vs. SaO2 for the Nellcor and JCT pulse oximeters for the neonate data are shown in Figure 9. The regression line for the JCT pulse oximeter is not statistically different from zero, while that for the Nellcor pulse oximeter differs significantly from zero (r = 0.87, p < 0.001).

4. Discussion

In the current study, we have developed a pulse oximeter which uses two wavelengths in the near infrared region and the relationship between the measured parameter, R, and the physiological parameter, SaO2, is based on the Beer–Lambert equation (Equation (2)). The technique requires the use of a correction factor to the calculated SpO2 value to account for the different path-lengths between the two wavelengths (Equation (4)). The R/SpO2 relationship in the available commercial pulse oximeters is based on the use of an empirical calibration formula (such as Equation (5)), which is obtained by means of in vitro measurements made on extracted arterial blood. The commercial devices use a dual LED with wavelengths in the red and infrared regions as a light source, in order to utilize the large difference in the extinction coefficient values between oxygenated and de-oxygenated hemoglobin in the red wavelength region (600–700 nm, see Figure 2). The large difference between the two wavelengths leads to a large difference between the corresponding scattering coefficients and consequently to a large difference between the red and infrared path-lengths. The large path-lengths difference is necessarily accompanied by large inter-person variability in the l 2 / l 1 ratio, which might significantly affect the R/SpO2 relationship. The current JCT pulse oximeter used a dual LED that emits light at two relatively nearby infrared wavelengths. The effect of the small difference between the path-lengths of the two infrared wavelengths on the R/SpO2 relationship is small and can be compensated for by a correction factor that is not much different than unity. The reduced signal, caused by the smaller difference between the extinction coefficient values for Hb and HbO2, is compensated for by the reduction of the difference between the path-lengths for the two wavelengths, which are close to one another (i.e., reduced noise).
In a previous study [16], we used laser diodes, which have narrow bandwidth and distinct wavelengths, and showed that pulse oximetry with two nearby infrared wavelengths can provide oxygen saturation data without calibration which requires SaO2 measurements in extracted blood. In that study, the wavelengths of the laser diodes were very close to each other, 780 nm and 808 nm, so that the difference between the corresponding path-lengths was negligible, and no correction factor was needed. However, laser diodes are expensive, inconvenient to use and require temperature stabilization. Furthermore, the small distance between the two wavelengths is accompanied by a small difference between the extinction coefficients, which should lead to a small signal-to-noise ratio (see Equation (2)). In the current study, we used LEDs with broad emission spectra and wavelengths that were farther apart (761 nm and 818 nm). We showed that after applying a correction factor, the results were in good agreement with those of a Nellcor pulse oximeter.
The accuracy of the available commercial pulse oximeters is sufficient for many clinical applications, but not for all of them. In a study of critically ill patients [21], the authors concluded that changes in SpO2 do not reliably predict equivalent changes in SaO2 in critically ill patients. In two studies [1,2] on patients in intensive care units, a minimum SpO2 level of 94% or 96% has been proposed in order to ensure a minimal SaO2 value of 90%. Since excessive oxygen supplementation carries a risk of oxidative stress and oxygen toxicity [22,23], reduced error in SpO2 measurement has clinical significance. The limited ability of pulse oximetry to accurately detect excessive oxygenation is particularly important for preterm newborns receiving supplemental oxygen due to their vulnerability to retinopathy of prematurity when SaO2 levels are too high.
The greater sensitivity of preterm neonates to excessive oxygenation is particularly important because the error in SpO2 measurement in neonates and children in intensive care units is expected to be larger than that in adults [3,4,5,6]. One of the reasons for this larger error is limb movement by the neonates. While errors due to such movements can be reduced by signal processing algorithms, they cannot be totally eliminated. The movement error is not reduced by the JCT technique. Another source of error in newborns, particularly preterm neonates, is the presence of fetal hemoglobin. The relative differences in extinction coefficient values between adult hemoglobin and fetal hemoglobin for the wavelengths used in conventional pulse oximetry, 660 nm and 940 nm, are small [24], while in the 750–850 nm range, the relative differences seem to be more significant [24]. It should be noted that at sufficient time after birth or after infusion of blood with adult hemoglobin, the concentration of fetal hemoglobin is reduced and its effect on SpO2 measurement can be neglected. The calibration process, which is performed with extracted blood from healthy adults, is associated with another source of error. The relationship between SpO2 and R depends on the path-lengths ratio between the two wavelengths ( l 2 / l 1 in Equation (4)), and this ratio may be different in the fingers of adults, where the calibration is performed, and in the feet or hands of newborns, where the measurements are taken. As explained above, the variability of the path-lengths ratio between the two wavelengths should be larger when the difference between the two wavelengths is greater.
The inaccuracy in SpO2 measurement by the available commercial pulse oximeters is increased for SaO2 levels below 80% [6,20]. In the calibration process, the oxygen fraction in the inspired air is not generally reduced below the safe value of 80% for SaO2, hence the lower effectivity of the calibration for SaO2 below 80%. In our study in the NICU, an exceptional error of 17% was obtained in SpO2 measurement by the Nellcor pulse oximeter in an examination where SaO2 was 70%, while the difference between JCT–SpO2 and the invasive SaO2 measurement was 1.5%.

5. Conclusions

The inaccuracy in the measurement of oxygen saturation in arterial blood by pulse oximetry is 3–4% for adults and greater for neonates. In part, the inaccuracy originates from the significant difference in the optical path-lengths between the red and infrared wavelengths used in the available pulse oximeters. In the current study, a novel pulse oximeter which used a dual LED with two nearby infrared wavelengths was introduced and examined. SpO2 was obtained from the measured parameter R through an equation which is based on the modified Beer–Lambert law and the extinction coefficient values for oxygenated and de-oxygenated hemoglobin. The two-infrared pulse oximetry does not require empirical calibration, which is based on SaO2 measurement in extracted arterial blood, as is required by red and infrared pulse oximetry. Despite the greater technological challenge in utilizing two nearby wavelengths, the two-infrared pulse oximeter and a commercial pulse oximeter showed similar changes in SpO2 in measurements performed on adults during breath holding. The two pulse oximeters showed similar accuracy when compared to SaO2 measurement in extracted arterial blood (the gold standard) performed in intensive care units on newborns and children with an arterial line. The accuracy of SpO2 measurement by the two-infrared pulse oximeter is expected to be greater than that of the red and infrared pulse oximeter because of smaller inter-person variability of the optical path-lengths difference between the two wavelengths.

Author Contributions

Conceptualization, M.N.; Formal analysis, Y.Y., S.E. and M.N.; Funding acquisition, M.N.; Methodology, O.Y. and M.C.; Project administration, M.N.; Resources, O.Y. and M.C.; Software, O.Y. and M.C.; Validation, O.Y., M.C., I.N., Y.K. and S.S.; Analysis and interpretation, M.N., O.Y., M.C., S.E., and Y.Y.; Writing—original draft preparation, M.N., O.Y.; Writing—review and editing, S.E., Y.Y. and I.N.; Supervision, M.N., Y.Y.

Acknowledgments

The research was funded by the Israel Innovation Authority through the KAMIN incentive program.

Conflicts of Interest

The authors declare no conflict of interest. The founding sponsors had no role in the design of the study; in the collection, analyses, or interpretation of data; in the writing of the manuscript, and in the decision to publish the results.

References

  1. Seguin, P.; Le Rouzo, A.; Tanguy, M.; Guillou, Y.M.; Feuillu, A.; Mallédant, Y. Evidence for the need of bedside accuracy of pulse oximetry in an intensive care unit. Crit. Care Med. 2000, 28, 703–706. [Google Scholar] [CrossRef] [PubMed]
  2. Van de Louw, A.; Cracco, C.; Cerf, C.; Harf, A.; Duvaldestin, P.; Lemaire, F.; Brochard, L. Accuracy of pulse oximetry in the intensive care unit. Intensive Care Med. 2001, 27, 1606–1613. [Google Scholar] [CrossRef] [PubMed]
  3. Rosychuk, R.J.; Hudson-Mason, A.; Eklund, D.; Lacaze-Masmonteil, T. Discrepancies between arterial oxygen saturation and functional oxygen saturation measured with pulse oximetry in very preterm infants. Neonatology 2012, 101, 14–19. [Google Scholar] [CrossRef] [PubMed]
  4. Ross, P.A.; Newth, C.J.; Khemani, R.G. Accuracy of pulse oximetry in children. Pediatrics 2014, 133, 22–29. [Google Scholar] [CrossRef] [PubMed]
  5. Lakshminrusimha, S.; Manja, V.; Mathew, B.; Suresh, G.K. Oxygen targeting in preterm infants: A physiological interpretation. J. Perinatol. 2015, 35, 8–15. [Google Scholar] [CrossRef] [PubMed]
  6. Cummings, J.J.; Polin, R.A. Committee on fetus and newborn. Oxygen targeting in extremely low birth weight infants. Pediatrics 2016, 138, e20161576. [Google Scholar] [CrossRef] [PubMed]
  7. Wieben, O. Light absorbance in pulse oximetry. In Design of Pulse Oximeters; Webster, J.G., Ed.; Institute of Physics Publishing: Bristol, UK, 1997; pp. 40–55. ISBN 9780750304672. [Google Scholar]
  8. Mannheimer, P.D.; Casciani, J.R.; Fein, M.E.; Nierlich, S.L. Wavelength selection for low-saturation pulse oximetry. IEEE Trans. Biomed. Eng. 1997, 44, 148–158. [Google Scholar] [CrossRef] [PubMed]
  9. Nitzan, M.; Babchenko, A.; Khanokh, B.; Taitelbaum, H. The measurement of oxygen saturation in venous blood by dynamic near IR spectroscopy. J. Biomed. Opt. 2000, 5, 155–162. [Google Scholar] [CrossRef] [PubMed]
  10. Kyriacou, P.A. Pulse oximetry in the esophagus. Physiol. Meas. 2006, 27, R1–R35. [Google Scholar] [CrossRef] [PubMed]
  11. Kim, J.G.; Liu, H. Variation of haemoglobin extinction coefficients can cause errors in the determination of haemoglobin concentration measured by near-infrared spectroscopy. Phys. Med. Biol. 2007, 52, 6295–6322. [Google Scholar] [CrossRef] [PubMed]
  12. Mannheimer, P.D. The light–tissue interaction of pulse oximetry. Anesth. Analg. 2007, 105, S10–S17. [Google Scholar] [CrossRef] [PubMed]
  13. Moyle, J.T.B. Pulse Oximetry; BMJ Books: London, UK, 2002. [Google Scholar]
  14. Phillips, J.P.; Langford, R.M.; Chang, S.H.; Kyriacou, P.A.; Jones, D.P. Photoplethysmographic measurements from the esophagus using a new fiber-optic reflectance sensor. J. Biomed. Opt. 2011, 16, 077005. [Google Scholar] [CrossRef] [PubMed]
  15. Friebel, M.; Helfmann, J.; Netz, U.; Meinke, M. Influence of oxygen saturation on the optical scattering properties of human red blood cells in the spectral range 250 to 2000 nm. J. Biomed. Opt. 2009, 14, 034001. [Google Scholar] [CrossRef] [PubMed]
  16. Nitzan, M.; Noach, S.; Tobal, E.; Adar, Y.; Miller, Y.; Shalom, E.; Engelberg, S. Calibration-free pulse oximetry based on two wavelengths in the infrared—A preliminary study. Sensors (Basel) 2014, 14, 7420–7434. [Google Scholar] [CrossRef] [PubMed]
  17. Kim, J.G.; (Gwangju Institute of Science and Technology, Gwangju, South Korea); Liu, H.; (Joint Graduate Program in Biomedical Engineering, University of Texas at Arlington/University of Texas Southwestern Medical Center at Dallas). Personal Communication.
  18. Hamber, E.A.; Bailey, P.L.; James, S.W.; Wells, D.T.; Lu, J.K.; Pace, N.L. Delays in the detection of hypoxemia due to site of pulse oximetry probe placement. J. Clin. Anesth. 1999, 11, 113–118. [Google Scholar] [CrossRef]
  19. Lindholm, P.; Blogg, S.L.; Gennser, M. Pulse oximetry to detect hypoxemia during apnea: Comparison of finger and ear probes. Aviat. Space Environ. Med. 2007, 78, 770–773. [Google Scholar] [PubMed]
  20. Fouzas, S.; Priftis, K.N.; Anthrcopoulos, M.B. Pulse oximetry in pediatric practice. Pediatrics 2011, 128, 740–752. [Google Scholar] [CrossRef] [PubMed]
  21. Perkins, G.D.; McAuley, D.F.; Giles, S.; Routledge, H.; Gao, F. Do changes in pulse oximeter oxygen saturation predict equivalent changes in arterial oxygen saturation? Crit. Care 2003, 7, R67–R71. [Google Scholar] [CrossRef] [PubMed]
  22. Kleen, M.; Messmer, K. Toxicity of high PaO2. Minerva Anestesiol. 1999, 65, 393–396. [Google Scholar] [PubMed]
  23. Thomson, L.; Paton, J. Oxygen toxicity. Paediatr. Respir. Rev. 2014, 15, 120–123. [Google Scholar] [CrossRef] [PubMed]
  24. Zijlstra, W.G.; Buursma, A.; Meeuwsen-van der Roest, W.P. Absorption spectra of human fetal and adult oxyhemoglobin, de-oxyhemoglobin, carboxyhemoglobin, and methemoglobin. Clin. Chem. 1991, 37, 1633–1638. [Google Scholar] [PubMed]
Figure 1. The photoplethysmography (PPG) pulses. The transmitted light through the tissue decreases during systole and increases during diastole. AC is the difference between the maximal (ID) and minimal (IS) light transmission through the tissue; DC is the mean light transmission through the pulse.
Sensors 18 03457 g001
Figure 2. The normalized emitted light intensity spectra, obtained for light emitting diodes (LEDs) with peak wavelengths (λ) of 665 nm, 761 nm, 818 nm and 894 nm, and the extinction coefficient curves of Hb and HbO2, according to Zijlstra’s results.
Sensors 18 03457 g002
Figure 3. Photographs of the Jerusalem College of Technology (JCT) probes for use with an adult’s finger (left) and for use with a newborn’s foot or child’s finger (right). Light is emitted from one component of the probe and the light transmitted through finger/foot is collected by a detector that is placed on the other side of the finger/foot. PD—photodetector.
Sensors 18 03457 g003
Figure 4. The control unit of the JCT pulse oximeter device together with an adult finger probe.
Sensors 18 03457 g004
Figure 5. SpO2 values of two examinees as a function of time, as measured by the two pulse oximeters. The period of breath holding is demarcated by the two vertical lines.
Sensors 18 03457 g005
Figure 6. SpO2 values obtained by the Nellcor and JCT pulse oximeters in two examinations with a relatively low correlation coefficient.
Sensors 18 03457 g006
Figure 7. The mean SpO2 value (and standard deviation) as a function of time for the two devices, obtained for the whole group of examinees.
Sensors 18 03457 g007
Figure 8. Bland–Altman plots of SpO2–SaO2 vs. SaO2 for Nellcor and JCT pulse oximeters are presented for the PICU children (full circles) and neonates (empty circles). The solid lines represent the mean of SpO2–SaO2 and the dashed lines are the 95% confidence interval (CI).
Sensors 18 03457 g008
Figure 9. The regression lines of SpO2–SaO2 vs. SaO2 for Nellcor and JCT pulse oximeters for the neonate data.
Sensors 18 03457 g009
Table 1. SpO2 values as obtained by the Nellcor pulse oximeter and the JCT pulse oximeter and SaO2 measured by an invasive technique in the pediatric intensive care unit (PICU) (first 13 examinations) and the neonatal intensive care unit (NICU) (last 16 examinations). Also shown are SaO2/JCT–SpO2 and the difference (marked by Δ) between SaO2 and SpO2, as obtained by each pulse oximeter (with the correction, in the case of the JCT pulse oximeter). CF—correction factor.
NumberSaO2SpO2SaO2/SpO2 JCTSpO2 JCT × CFΔSpO2 JCT ΔSpO2 Nellcor
NellcorJCT
19810092.31.0697.4−0.632.00
2989992.11.0697.2−0.831.00
3969486.81.1191.5−4.45−2.00
4959893.21.0298.43.363.00
5979889.71.0894.7−2.321.00
6969994.61.0199.83.853.00
79610093.31.0398.52.454.00
8979592.81.0498.00.95−2.00
99810096.01.02101.33.342.00
10939687.71.0692.5−0.523.00
11939389.51.0494.41.400.00
129910089.01.1193.9−5.101.00
13969990.91.0695.9−0.133.00
1899080.41.1184.8−4.161.00
2969392.01.0497.11.12−3.00
3959492.31.0397.42.39−1.00
4828784.70.9789.37.355.00
5899081.71.0986.2−2.761.00
69910096.61.02101.92.941.00
7919180.91.1385.3−5.680.00
8938782.71.1287.2−5.78−6.00
996 91.71.0596.80.76
10708771.50.9875.55.4617.00
11949391.41.0396.52.47−1.00
12929386.61.0691.4−0.621.00
13899084.61.0589.20.221.00
14898985.61.0490.31.300.00
15959486.81.0991.6−3.36−1.00
16878880.91.0885.4−1.641.00
Mean93.094.288.21.05593.10.051.25
Std6.04.65.70.046.03.343.83

