Article

A Third Generation Glucose Biosensor Based on Cellobiose Dehydrogenase Immobilized on a Glassy Carbon Electrode Decorated with Electrodeposited Gold Nanoparticles: Characterization and Application in Human Saliva

1
Department of Chemistry and Drug Technologies, Sapienza University of Rome, P.le Aldo Moro, Rome 5 00185, Italy
2
Department of Analytical Chemistry/Biochemistry and Structural Biology, Lund University, P.O. Box 124, Lund SE-221 00, Sweden
3
Food Biotechnology Laboratory, Department of Food Science and Technology, BOKU—University of Natural Resources and Life Sciences, Muthgasse 18, Vienna A-1190, Austria
*
Author to whom correspondence should be addressed.
Sensors 2017, 17(8), 1912; https://doi.org/10.3390/s17081912
Submission received: 4 July 2017 / Revised: 10 August 2017 / Accepted: 16 August 2017 / Published: 18 August 2017
(This article belongs to the Special Issue Advanced Sensors Based on Carbon Electrodes)

Abstract

:
Efficient direct electron transfer (DET) between a cellobiose dehydrogenase mutant from Corynascus thermophilus (CtCDH C291Y) and a novel glassy carbon (GC)-modified electrode, obtained by direct electrodeposition of gold nanoparticles (AuNPs) was realized. The electrode was further modified with a mixed self-assembled monolayer of 4-aminothiophenol (4-APh) and 4-mercaptobenzoic acid (4-MBA), by using glutaraldehyde (GA) as cross-linking agent. The CtCDH C291Y/GA/4-APh,4-MBA/AuNPs/GC platform showed an apparent heterogeneous electron transfer rate constant (ks) of 19.4 ± 0.6 s−1, with an enhanced theoretical and real enzyme surface coverage (Γtheor and Γreal) of 5287 ± 152 pmol cm−2 and 27 ± 2 pmol cm−2, respectively. The modified electrode was successively used as glucose biosensor exhibiting a detection limit of 6.2 μM, an extended linear range from 0.02 to 30 mM, a sensitivity of 3.1 ± 0.1 μA mM−1 cm−2 (R2 = 0.995), excellent stability and good selectivity. These performances compared favourably with other glucose biosensors reported in the literature. Finally, the biosensor was tested to quantify the glucose content in human saliva samples with successful results in terms of both recovery and correlation with glucose blood levels, allowing further considerations on the development of non-invasive glucose monitoring devices.

1. Introduction

Glucose monitoring has attracted great attention in several fields, ranging from biomedical applications to ecological fields [1]. In particular, for clinical trials, glucose monitoring has been considered one of the key factor in early diagnosis of diabetes mellitus, which is a main cause of death or other diseases around the world. Diabetes is a metabolic disease generally related to non-/under-production of insulin in the pancreas and hyperglycemia, reflected by blood glucose concentrations higher or lower than the normal range of 80–120 mg dL−1 [2]. It is possible to distinguish between three types of diabetes: (i) type 1, which most affects young people, with non-production of insulin in the pancreas and involves about 10% of diabetic people [3]; (ii) type 2, which occurs in middle-age or old people, with low production of insulin or when the body does not use the insulin produced and involves about 90% of diabetic people [4]; (iii) gestational diabetes, which occurs during the pregnancy, with a connected risk of diabetes development for both mother and child [5].
In the last century, several approaches for early diagnosis of diabetes mellitus mainly focused on glucose monitoring have been developed such as capillary zone electrophoresis (CZE) [6], gas chromatography (GC) mainly coupled with mass spectrometry (MS) [7], high performance liquid chromatography/mass spectrometry (HPLC-MS) [8], enzymatic spectrophotometric assays [9], Fourier transform near-infrared spectroscopy (FT-NIR) [10] and proton NMR.
However, these methods require expensive equipment and complicated operations and therefore they cannot be applied to home-based care [11]. Most diabetic patients need to test their blood glucose levels periodically, even several times a day. Biosensors may represent a valid alternative as they allow time-saving, accurate, repeatable and cost-effective determination of glucose in blood [12]. Typically, a blood test for analysis is realized through a finger prick, which may cause physical and mental stress to patients, especially to young children and elderly people. Therefore, there is a great need for the developing of a point-of-care non-invasive glucose monitoring system [2]. A positive correlation between blood glucose (80–120 mg dL−1) and salivary glucose (0.6–1.8 mg dL−1) has been revealed in many studies [4].
Saliva shows great advantages compared to other biological fluids such as blood, tears, urine, etc. because its sampling is not invasive and it is recognized as the most sensitive one, containing also other disease biomarkers in a concentration larger than in blood. Moreover saliva sampling involves a simple collection method that allows easy storage and transport.
It is well known that electrochemical enzymatic glucose biosensors are divided into three classes depending on the electrochemical communication between the enzyme and the electrode: (i) first generation biosensors, where glucose is considered as co-substrate of glucose oxidase (GOx) with a subsequent generation of hydrogen peroxide (H2O2), which is oxidised at the electrode surface at quite high redox potential (e.g., 0.6 V vs. Ag|AgClsat for carbon modified electrodes, 0.4 V Ag|AgClsat for gold electrodes and 0.7 V vs. Ag|AgClsat for platinum electrode; (ii) second generation biosensors, where oxygen was replaced with a non-physiological electron acceptor (mediator) able to shuttle the electrons from the enzyme redox center to the surface of the electrode; (iii) third generation biosensors, where the mediator was eliminated to develop a reagentless glucose biosensor transferring the electrons from glucose to the electrode through the active site of the enzyme, with a low operating potential, close to that of the redox potential of the enzyme itself [13]. The electrode nanostructure plays a key role, particularly for third generation biosensors, thanks to the increased electroactive area and roughness factor [13]. Among the various nanostructured materials, carbon nanotubes, graphene [14] and metal nanoparticles (MNPs) showed very promising results [15], because of their high surface/volume ratio, thus allowing a better communication between the electrode and the prosthetic group of the enzyme [16]. Recently, several MNPs deposition approaches have been developed to modify the electrode surface, such as drop-casting [17,18], covalent linkage [19,20] or direct electrodeposition [21]. Among these methods, the electrodeposition allows a fast and easy MNPs synthesis with the possibility to monitor the MNPs geometry and size [22], especially by sweeping the potential [23] instead of applying a fixed potential [24]. Moreover, MNPs can grow directly onto the electrode surface without the need of further sample preparation, being surfactant-free and cost-effective and allowing to tune the nature of the nanoclusters by changing electrolyte composition and deposition parameters [24].
Unfortunately, despite the electrode nanostructure, only a few enzymes are able to directly transfer electrons from their active sites to the electrode [25,26]. Cellobiose dehydrogenase (CDH) has received great attention for biosensors [27] and biofuel cell development [28] because of its ability to show DET. CDH is a flavocytochrome oxidoreductase expressed by the dikaryotic phyla of Basidiomycota (Class I) and Ascomycota (Class II and Class III), consisting of two domains [29]. The first domain, called dehydrogenase domain (DHCDH), contains a flavin adenine dinucleotide (FAD) cofactor, connected through a flexible linker to a second subunit containing a heme-b cofactor, called cytochrome domain (CYTCDH) [30]. DHCDH domain is structurally similar to the FAD domain of most GMC-oxidoreductase enzymes and is fully reduced by di-/mono- saccharides, transferring the electrons through internal electron transfer (IET) to the CYTCDH, which finally shuttles the electrons to properly modified electrodes [31]. Among II class CDHs, Corynascus thermophilus CDH (CtCDH) was genetically mutated in its active site (CtCDH C291Y mutant) to enhance its sensitivity toward glucose and reduce the maltose cross-reactivity [32].
In this work, we report an improved DET efficiency between CtCDH C291Y and a novel GC modified electrode, obtained through direct electrodeposition of gold nanoparticles (AuNPs) on the GC electrode, further modified with a mixed self-assembled monolayer of 4-aminothiophenol (4-APh) and 4-mercaptobenzoic acid (4-MBA) using glutaraldehyde as cross-linking agent, as shown in Scheme 1. The proposed electrodeposition method allowed to monitor the nanoparticles surface coverage as well as the surface area available for the biomodification, which is directly related to the biosensor sensitivity. The so modified AuNPs/GC electrode was used to develop a third generation biosensor for glucose detection. The performances of the proposed biosensor were investigated in human saliva samples, demonstrating that the constructed AuNPs/GC biosensor has great potentials to realize electrochemical devices for non-invasive diabetes mellitus monitoring.

2. Experimental Section

2.1. Chemicals

Sulfuric acid (H2SO4), d-glucose, d-(+)-maltose monohydrate, ascorbic acid, calcium chloride (CaCl2), chloroauric acid (HAuCl4·3H2O), potassium ferricyanide (K3[Fe(CN)6]), potassium ferrocyanide (K4[Fe(CN)6]), sodium acetate (CH3COOH), 3-(N-morpholino)propanesulfonic acid (MOPS), tris(hydroxymethyl)aminomethane (TRIS), urea, cortisol, 4-aminothiophenol (4-APh), 4-mercaptobenzoic acid (4-MBA), glutaraldehyde (GA), potassium chloride (KCl) and Glucose (GO) Assay Kit were purchased from Sigma Aldrich (St. Louis, MO, USA).
CtCDH C291Y (E.C. 1.1.99.18) was purified from the culture supernatant of the ascomycete Corynascus thermophilus (CBS 405.69) obtained from the Centralbureau voor Schimmelcultures (Baarn, The Netherlands) (volumetric activity with cytochrome c at pH 7.5 = 54 U mL−1, protein concentration = 16 mg mL−1). All solutions were prepared using Milli-Q water (R = 18.2 MΩ cm at 25 °C; TOC < 10 μg L−1, Millipore, Molsheim, France).

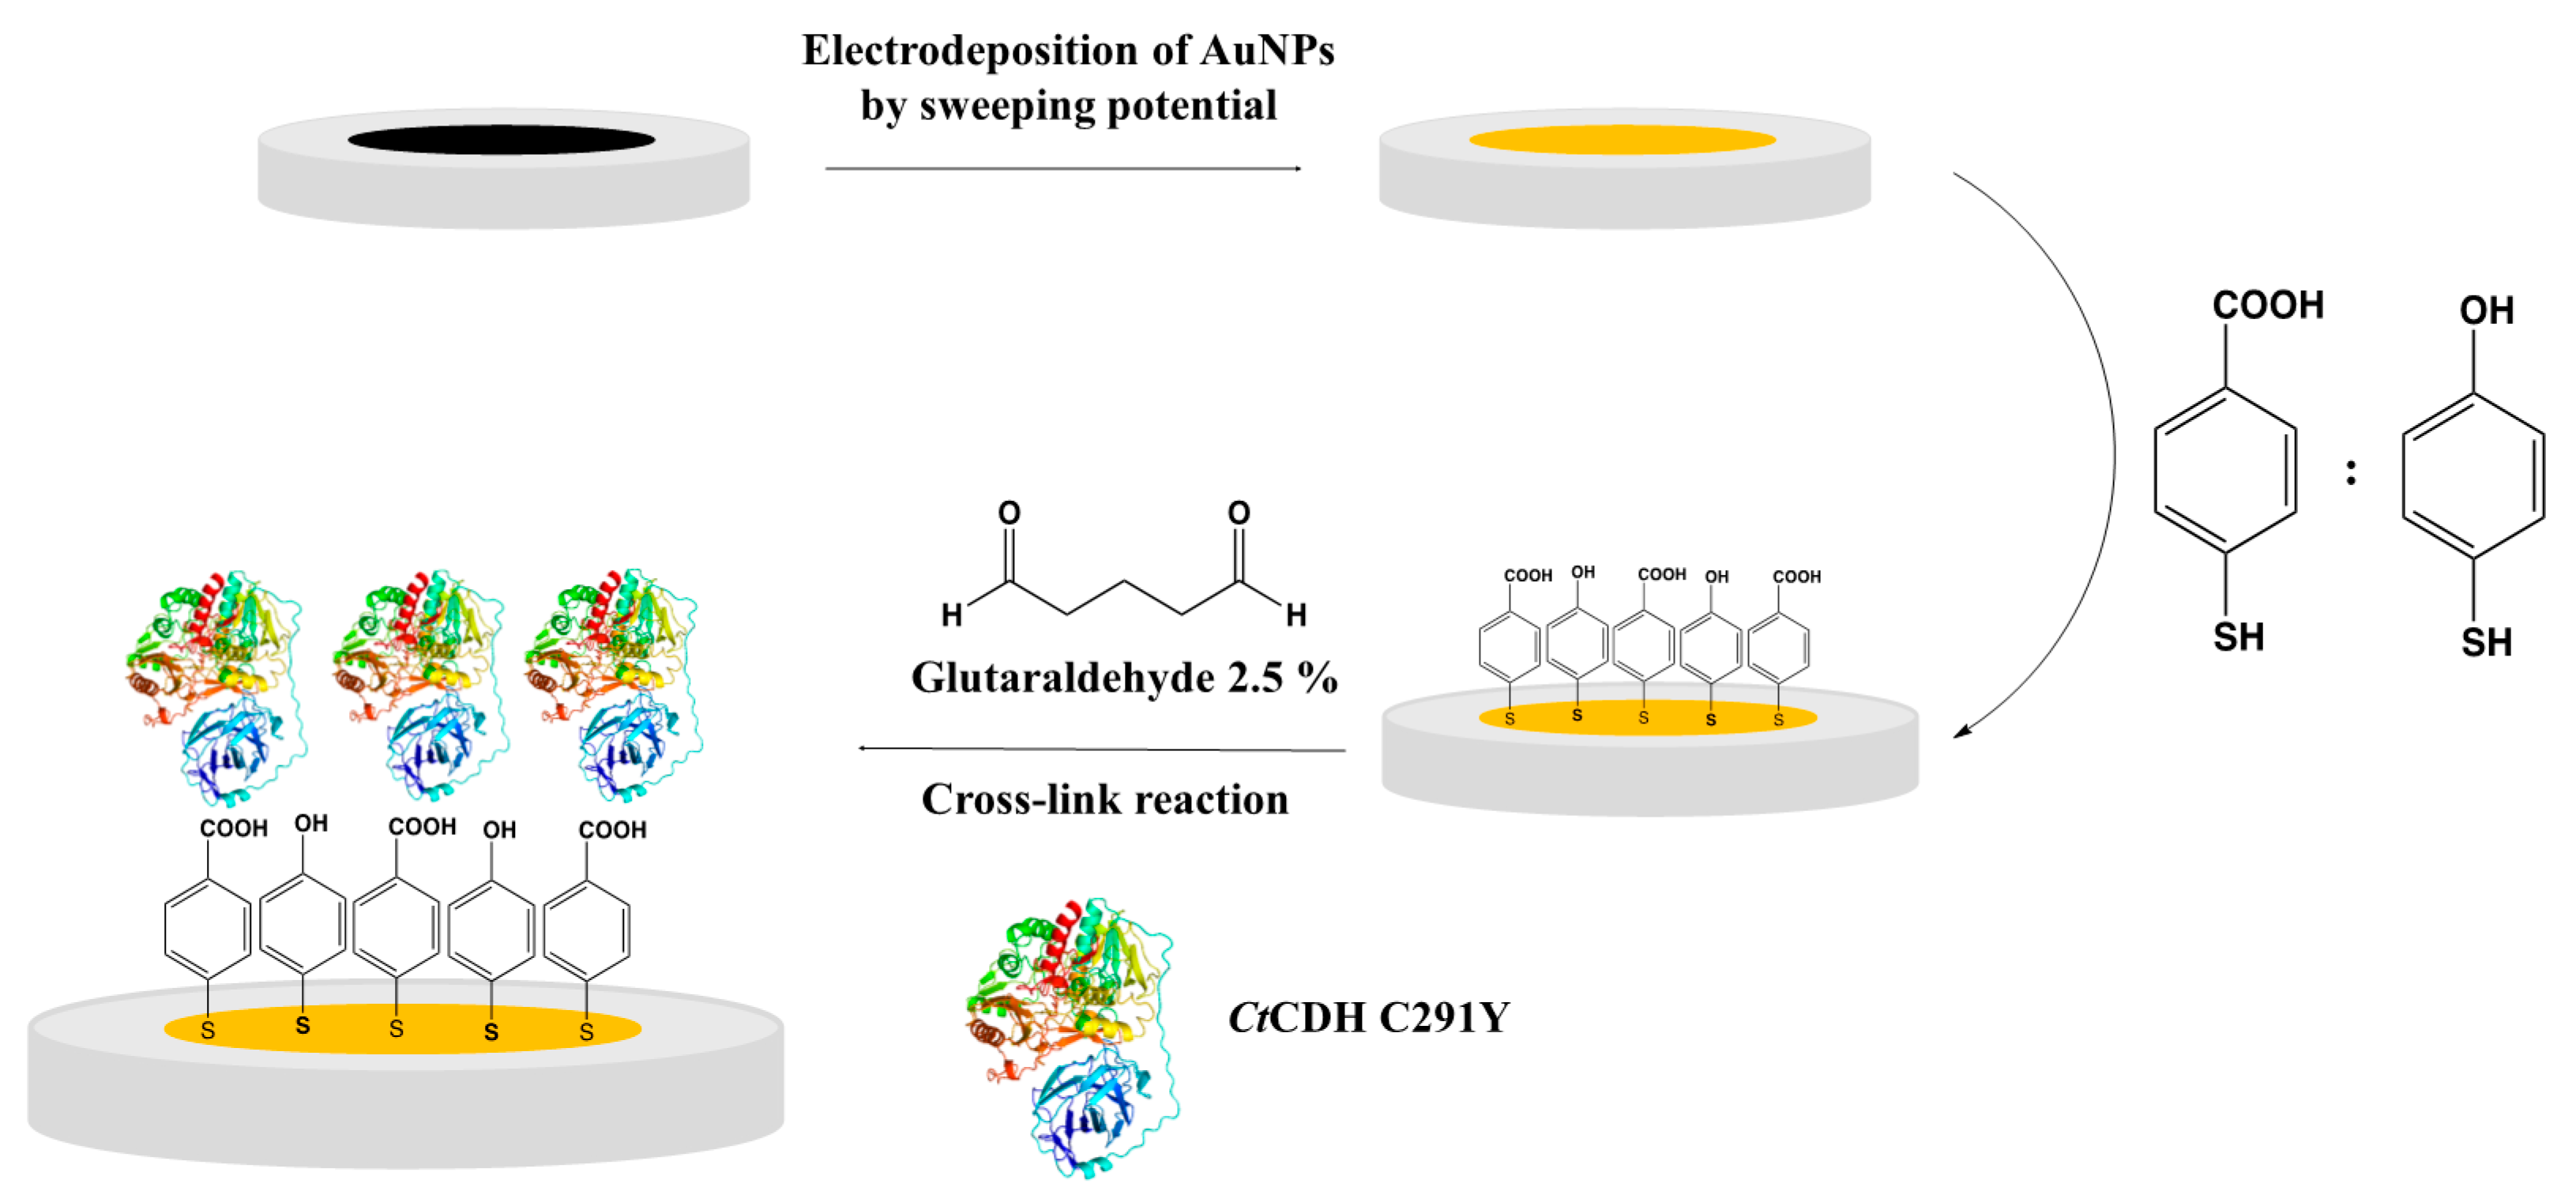
2.2. Electrode Preparation and Modification

GC electrodes (Bioanalytical Systems Inc., West Lafayette, IN, USA, d = 3 mm) were polished with alumina slurries (Al2O3, particle size of 1 and 0.1 μm) on cloth pads wet with Milli-Q water (Struers ApS, Ballerup, Denmark), thoroughly rinsed with Milli-Q water and further sonicated for 5 min between each polishing step. GC electrodes were successively modified by electrodeposition of gold nanoparticles (AuNPs) by sweeping the potential between 1.1 and −0.1 V vs. Ag|AgClsat for a given number of scans (5, 10, 15, 20, 25, 30, 35 scans) in 10 mM HAuCl4 [33]. Then, the modified electrodes were activated in 0.5 M H2SO4 by running 25 scans between 0 and +1.7 vs. Ag|AgClsat at a scan rate of 0.1 V s−1 until a well-defined cyclic voltammogram (CV) was obtained. The best modified electrode was selected on the basis of the electroactive and real surface area, heterogeneous electron transfer rate constant (k0, cm s−1) and roughness factor (ρ), calculated from CV measurements carried out in 10 mM Fe(CN)63−/4− (50 mM TRIS buffer pH 7.4). It was further dipped into a volumetric 1:1 mixture of 1 mM 4-APh/4-MBA ethanol solution. Then, the electrode was thoroughly rinsed with ethanol and dried under N2 stream. For the biomodification, 1 μL of GA solution (2.5% v/v in distilled water) and 3 μL of CtCDH C291Y solution (16 mg mL−1) were drop-cast, gently mixed on the top of thiol-modified AuNPs/GC electrode and allowed to react in a moisturised atmosphere for 2 h to avoid evaporation of the reactants. Finally, the so modified electrode was gently rinsed with 50 mM TRIS buffer (pH 7.4) in order to remove any possible unbounded enzyme molecule [34].

2.3. Whole Saliva and Blood Samples Collection and Analysis

Saliva samples collection was performed at 8.30 a.m. from three healthy male and female patients refrained from eating, drinking and oral hygiene procedures (at least for 1 h before). The patients were given drinking bottled water and asked to rinse well their mouths. After 5 min, the patients were asked to spit whole saliva (WS) into a 50 mL sterile Falcon® tube, once a minute for up to 10 min until sampling 5 mL of WS [35]. At the same time the patients were punched on their fingers to collect a drop of blood sufficient to measure glucose with the commercial GlucoContour XT (Bayer, Leverkusen, Germany) used by diabetic patients for self-monitoring and with the glucose oxidase-peroxidase method [36,37] by using the Glucose (GO) Assay Kit, which is the standard reference method for WS samples [38].

2.4. SEM Experiments

Scanned electron microscopy (SEM) measurements were performed with a JSM-7600F Schottky Field Emission Scanning Electron Microscope (JEOL Nordic AB, Sollentuna, Sweden). All samples were prepared according to the electrodeposition protocol, reported in Section 2.2, using glassy carbon plates (25 × 25 × 1 mm, ALS Co. Ltd., Tokyo, Japan) instead of GC electrodes. The samples were paced on a clip SEM sample holder (JEOL Nordic AB).

2.5. Electrochemical Measurements and Electrochemical Apparatus

Cyclic voltammograms (CVs) were recorded by using a PGSTAT 30 potentiostat (equipped with GPES 4.9, Autolab, Utrecht, The Netherlands). CVs were performed in a three-electrode electrochemical cell containing a standard silver chloride electrode (Ag|AgCl, sat. KCl), a platinum wire counter electrode and a modified glassy carbon (GC) electrode as working electrode. The temperature controlled experiments were carried out by using a cryostatic bath (T ± 0.01 °C, LAUDA RM6, Delran, NJ, USA). Flow injection analysis (FIA) data have been collected by using an analogic potentiostat (Zäta Elektronik, Höör, Sweden) connected with a strip chart recorder (Kipp & Zonen, Utrecht, The Netherlands). The modified GC electrode, an Ag|AgCl (0.1 M KCl) reference electrode and a platinum wire counter electrode were fitted into a wall-jet cell. The electrochemical system was equipped with a flow system consisting of a peristaltic pump (Gilson, Villier-le-Bel, France) and a six-port valve electrical injector (Rheodyne, Cotati, CA, USA).

3. Results and Discussion

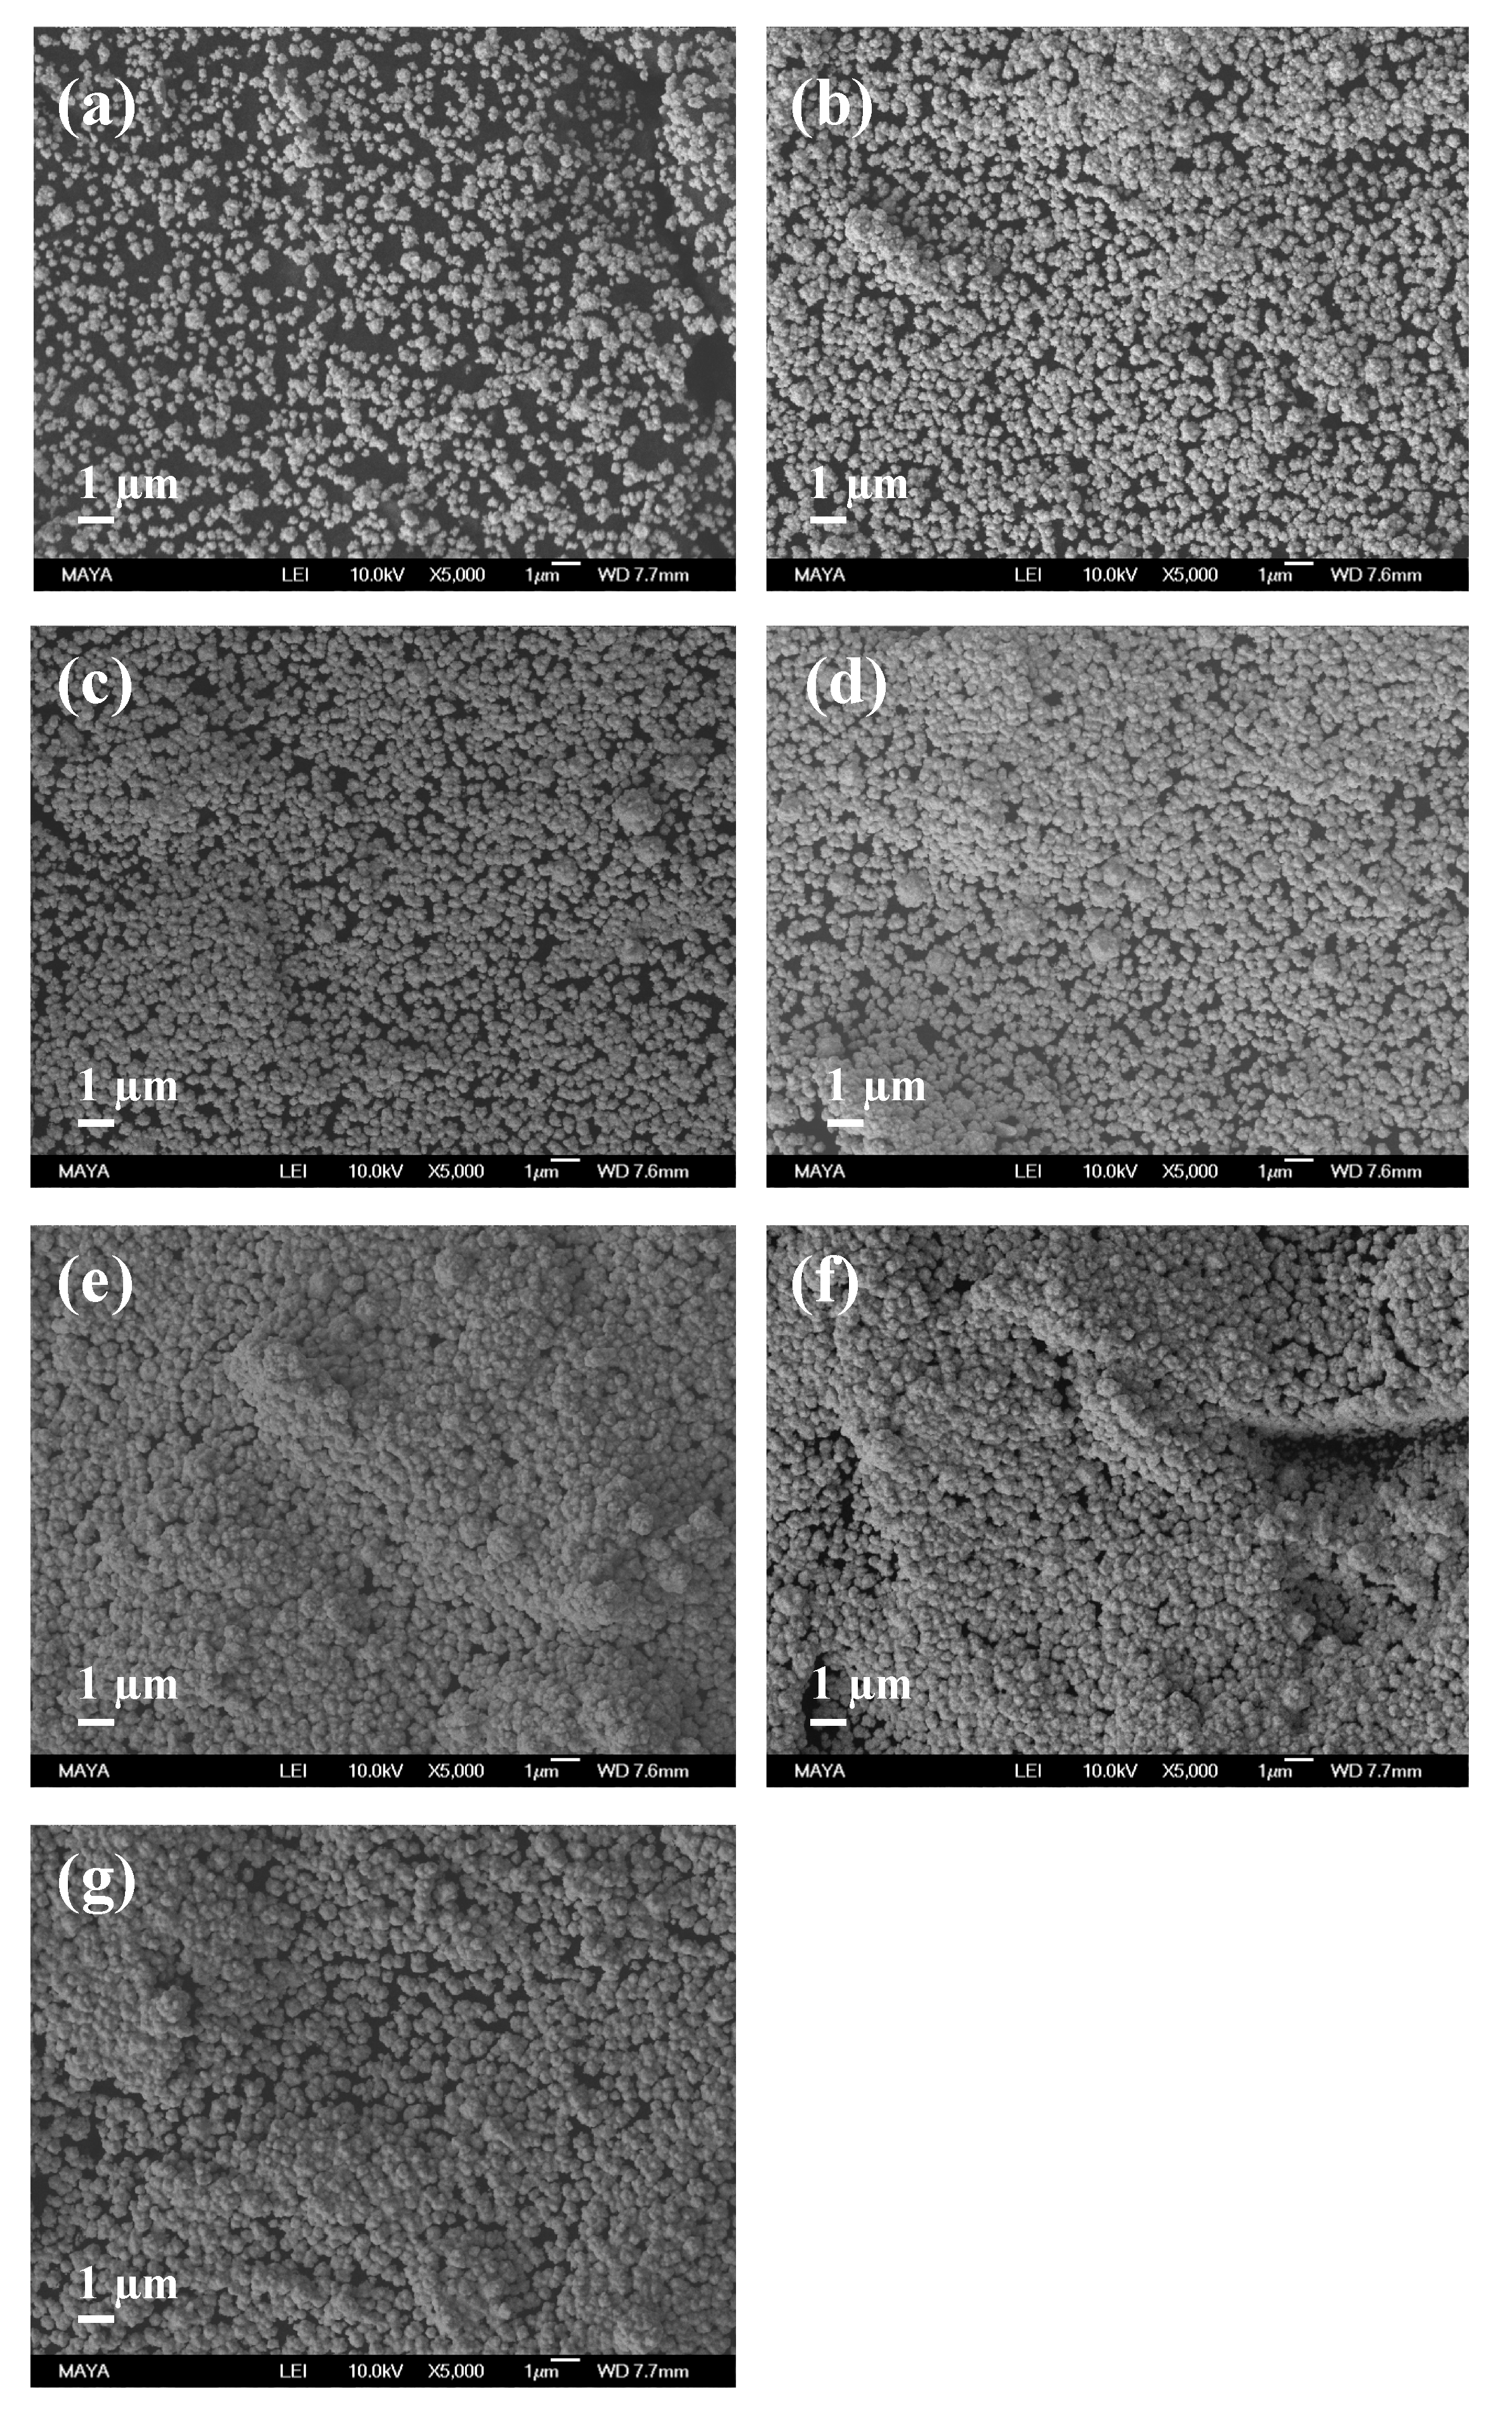
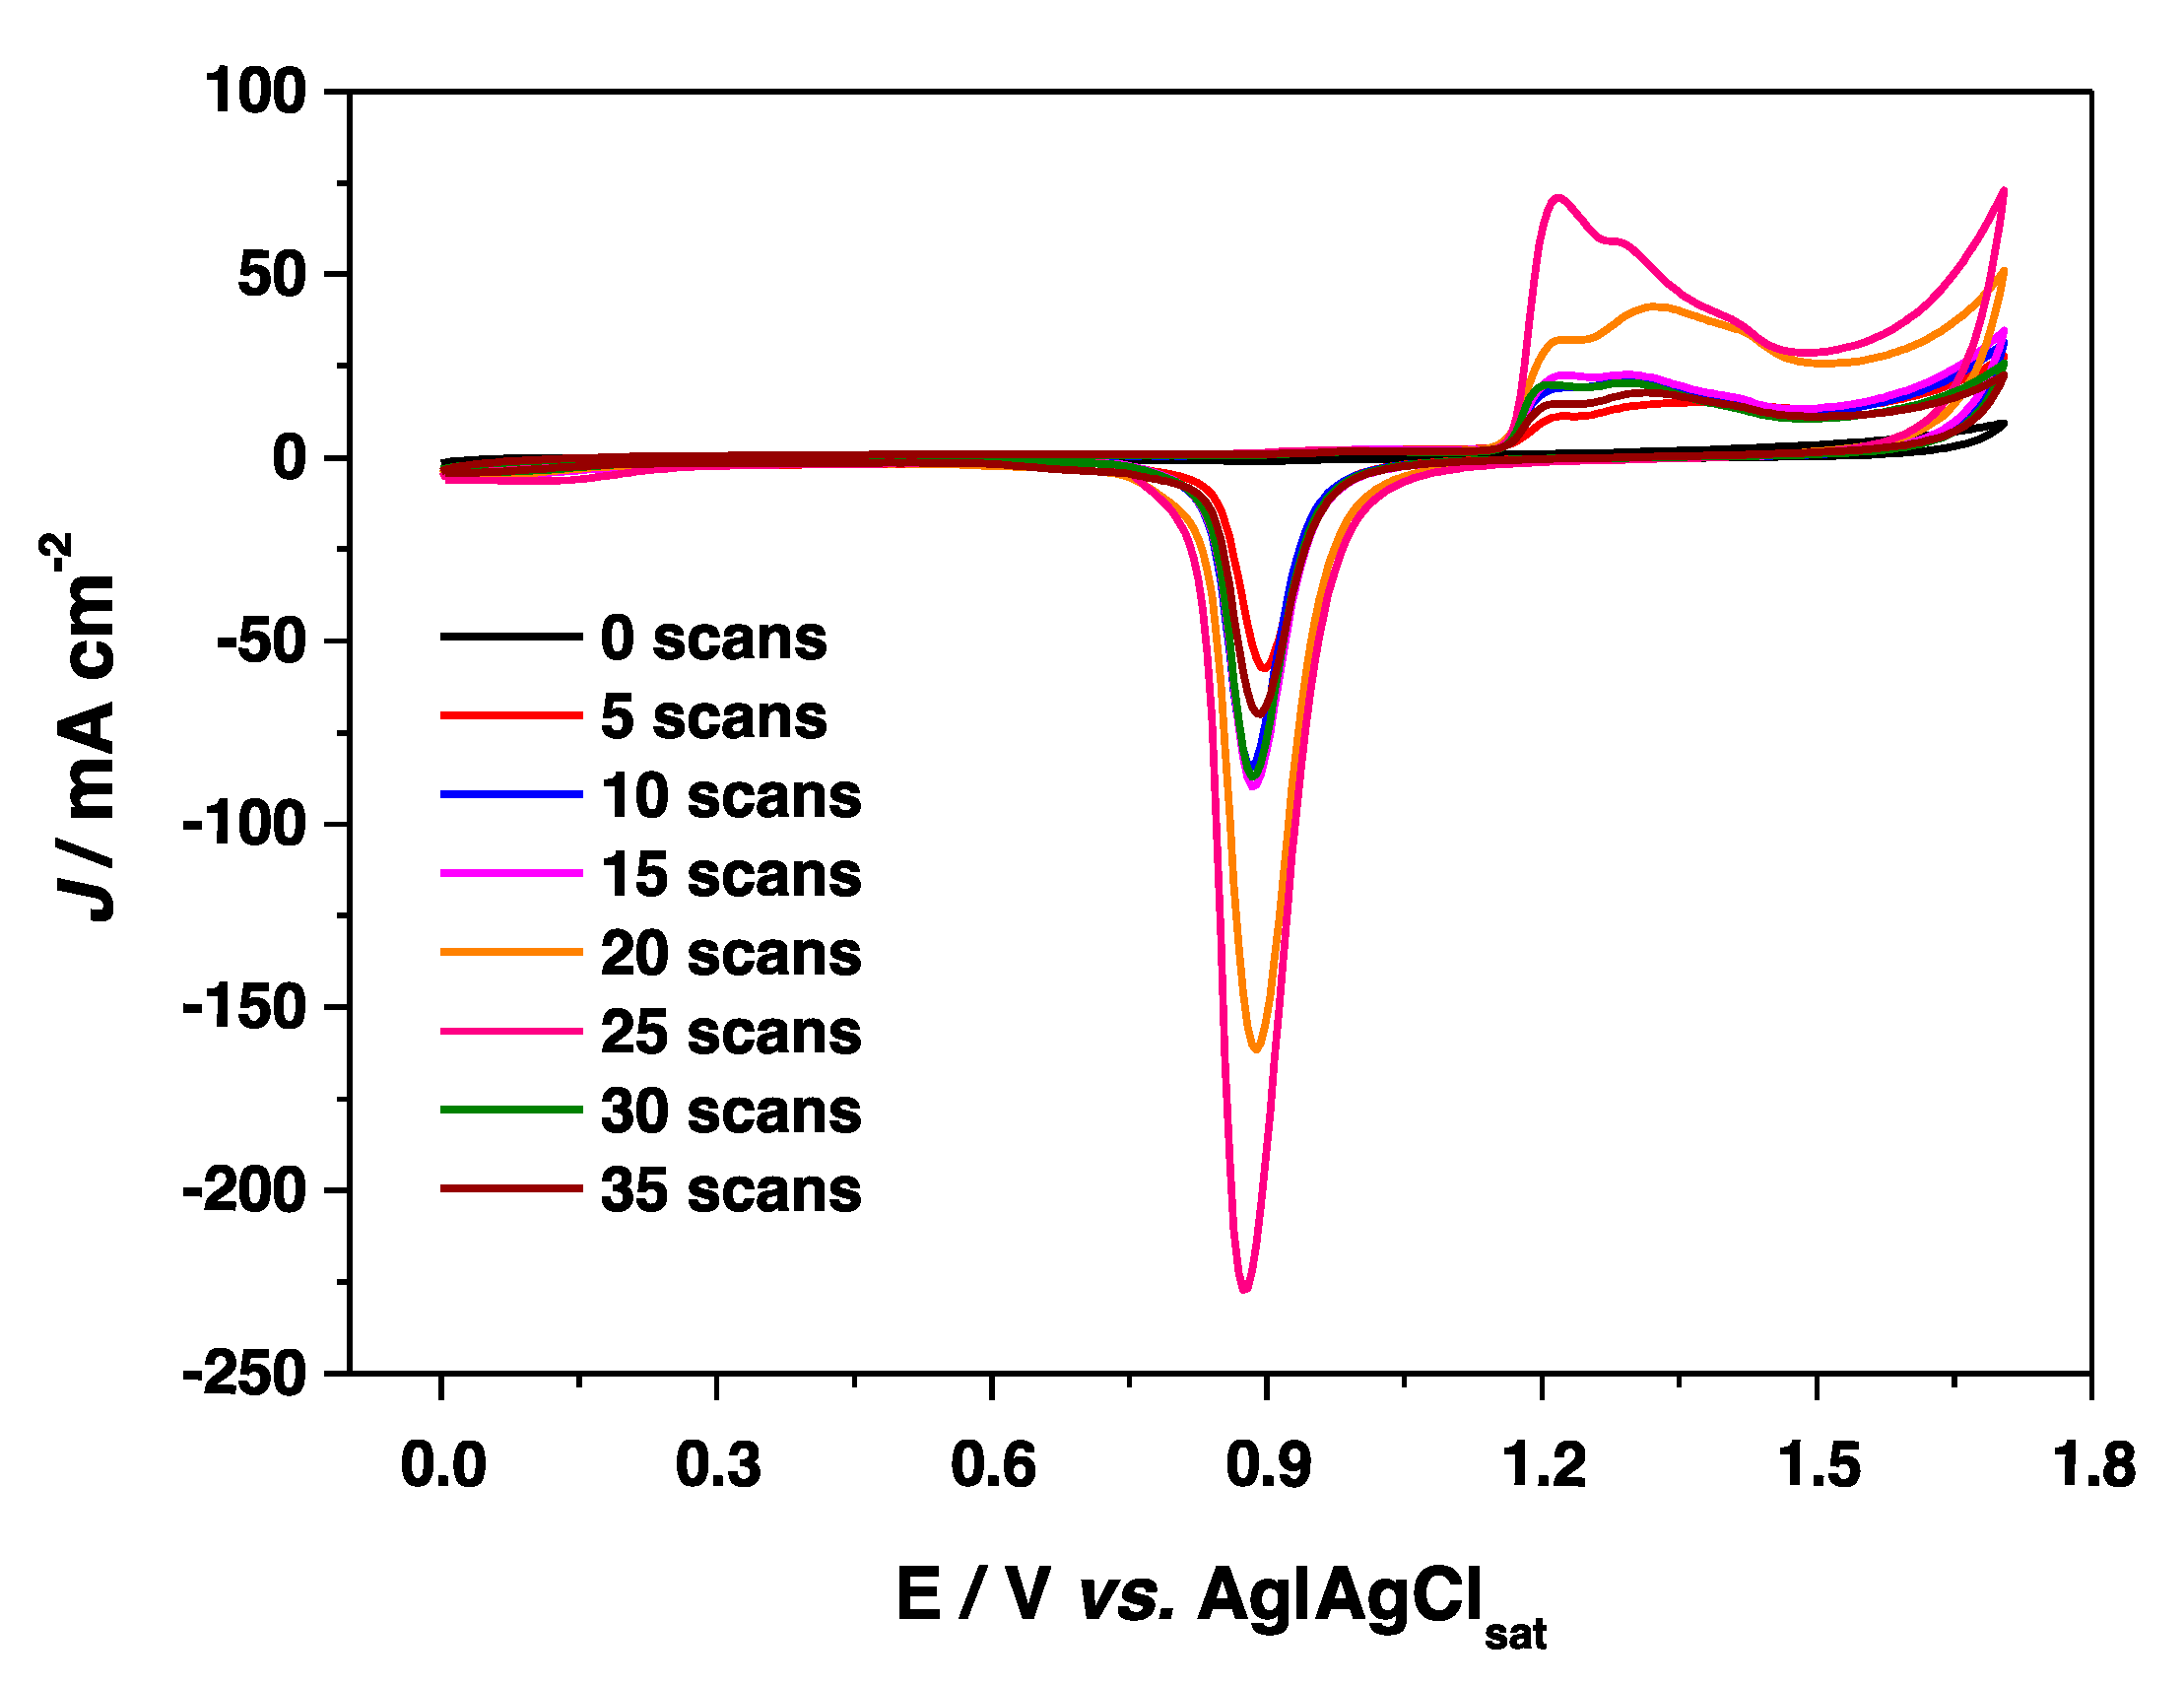
3.1. SEM and Electrochemical Characterization of AuNPs Modified GC Electrodes

SEMs were used to evaluate the physical appearance and surface characteristics of the AuNPs on the electrode surfaces for a given number of scans. Figure 1a–g show the SEM images relative to increasing number of scans. It is clearly visible that the surface coverage of the AuNPs increases with increasing number of scans until 25 scans, when the electrode surface is completely covered by a single layer of AuNPs. For electrodes prepared with 30 and 35 scans (Figure 1f,g), it is possible to observe multiple layers of AuNPs with possible formation of AuNPs agglomerates.
All AuNP-modified electrodes were successively characterized by cyclic voltammetry (CV) experiments in a solution of Fe(CN)63−/4− (data not shown) in order to calculate the electroactive area (AEA, cm2), the heterogeneous electron transfer rate constant (k0, cm s−1) and the roughness factor (electroactive/geometrical area ratio, ρ) and in 0.5 M H2SO4 (Figure 2) in order to calculate the real surface area (Areal). All data are shown in Table 1. The AEA has been evaluated using the Randles-Sevcik equation by the slope of the peak current vs. square root of scan rate ( υ 1 / 2 ) [39], whereas the real surface area (Areal) was calculated by integration of the peak current related to the gold oxide reduction process occurring by running CVs in 0.5 M H2SO4 [40,41]. The theoretical charge density considered for gold oxide reduction is 390 ± 10 μC cm−2 [42]. k0 was calculated using the extended method which merges the Klingler-Kochi and Nicholson-Shain methods for totally irreversible and reversible systems, respectively [43,44]. It is possible to observe in Table 1 that all the electrochemical parameters are highly influenced by the number of scans, showing the best results after 25 scans with an AEA of 12.96 ± 0.18 cm2 and a roughness factor of 183.6 ± 1.2, probably related to the increase in AuNPs surface coverage with the scan number. With electrodes prepared with 30 and 35 scans the decrease in the electrochemical parameters reported in Table 1 might be due to the presence of multiple layers and possible AuNPs agglomeration (Figure 1f,g).

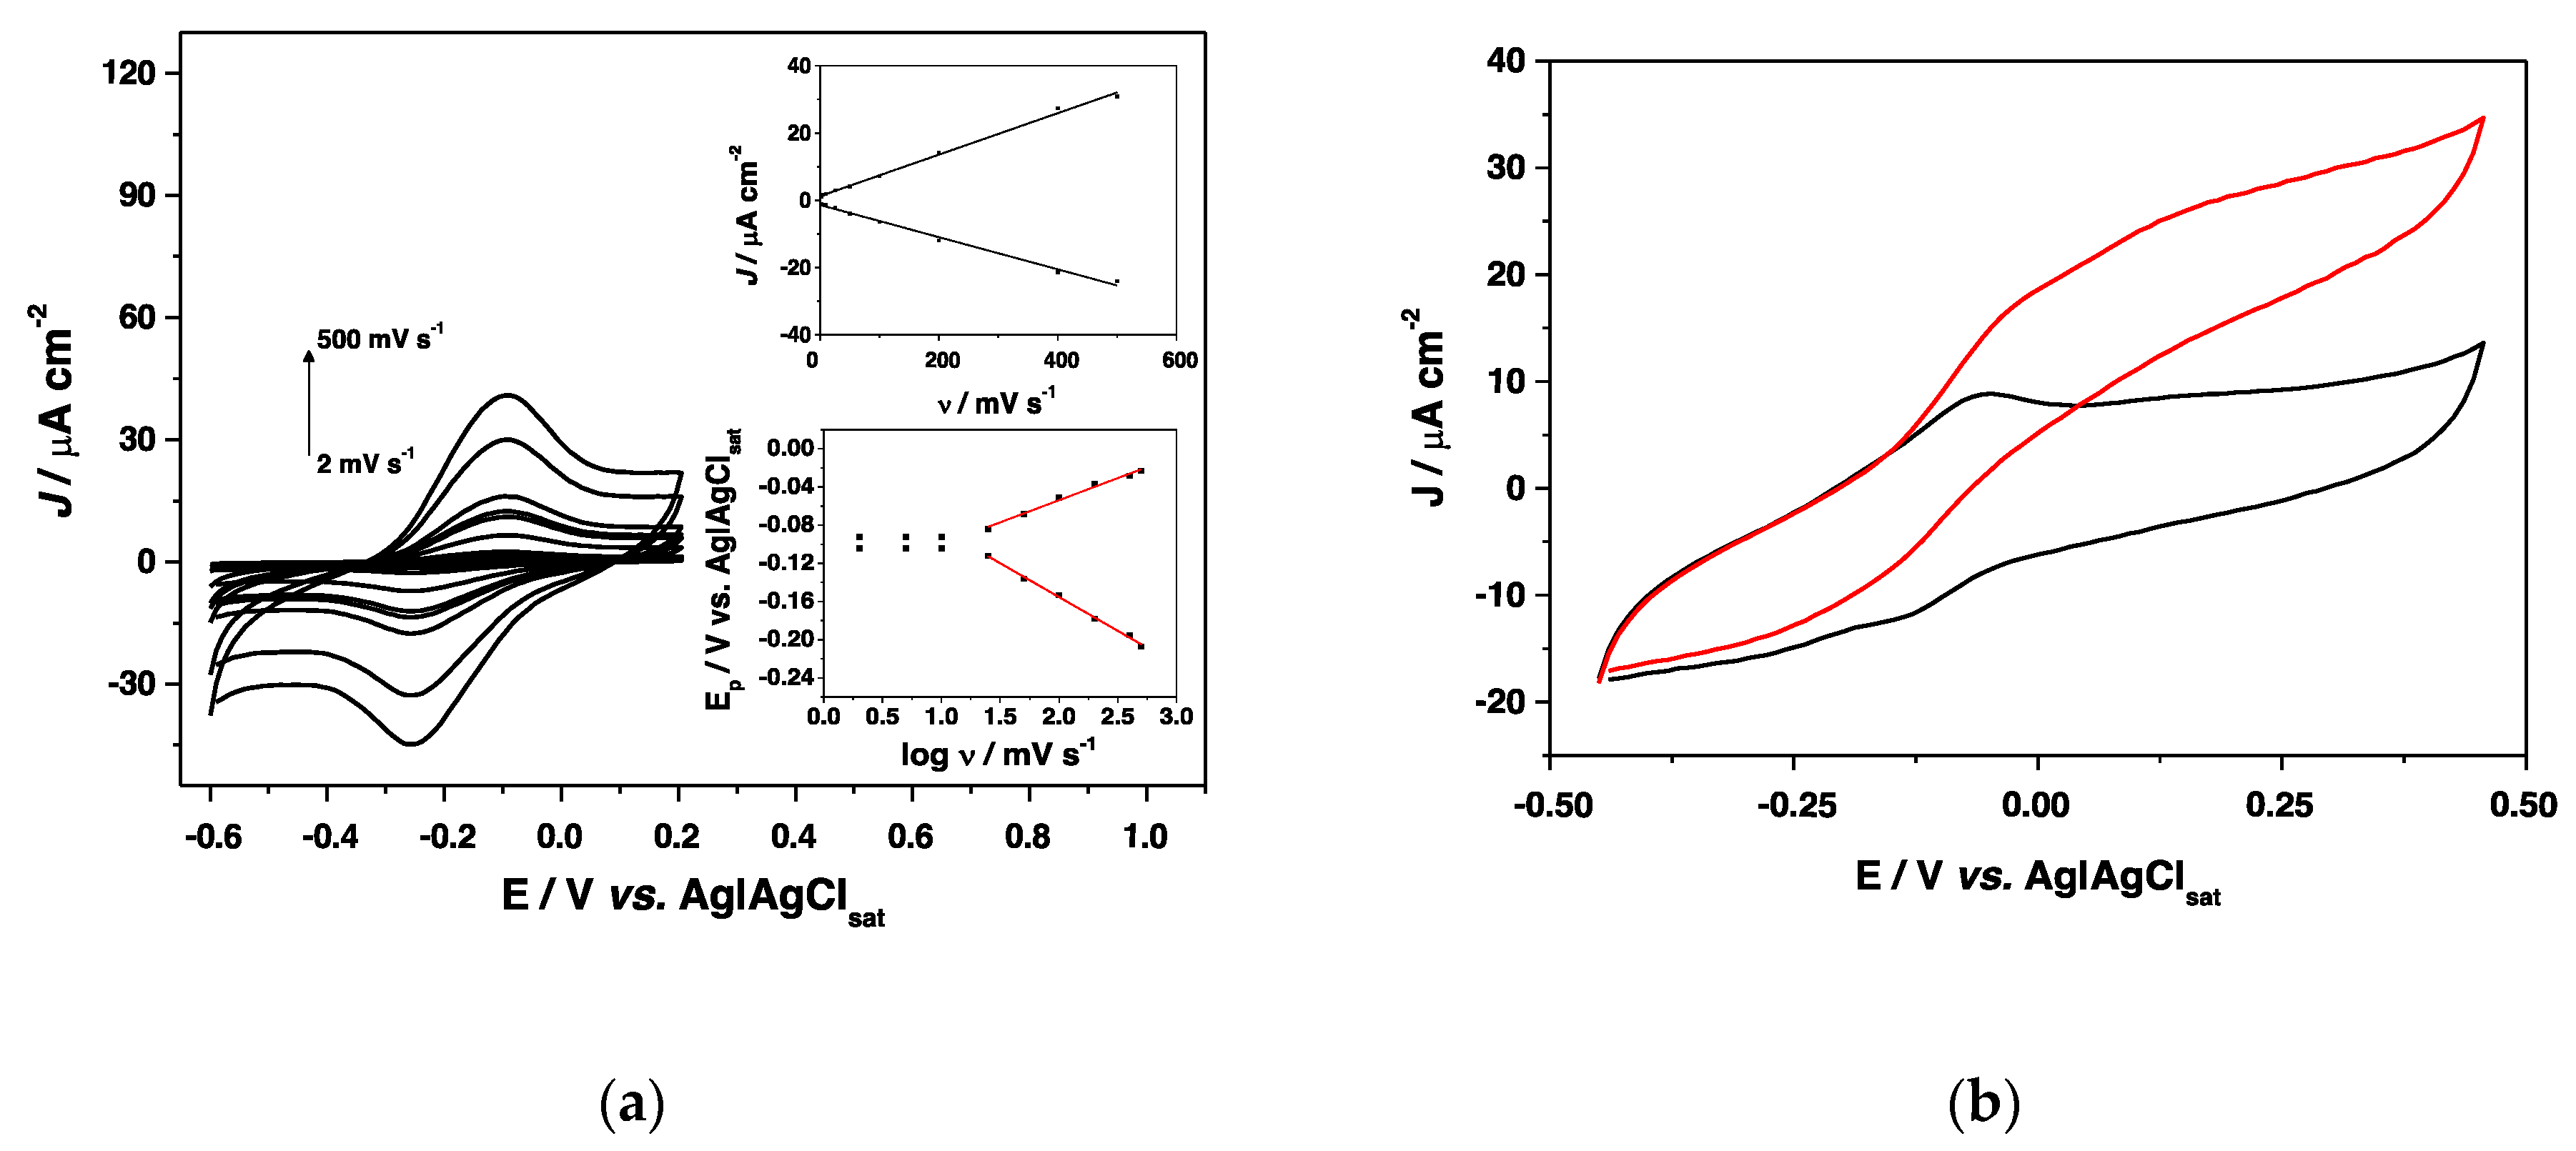
3.2. Electrochemistry of CtCDH C291Y on Modified GA/4-APh,4-MBA/AuNPs/GC Electrode

After preliminary characterization, the modified AuNPs/GC electrode obtained after 25 scans of electrodeposition was further modified with CtCDH C291Y covalently linked through GA with a mixed SAM consisting of 4-APh and 4-MBA. Figure 3a depicts the typical CVs of the enzyme electrode at different scan rates, showing an increased peak-to-peak separation (ΔEp) between the anodic and cathodic peak potentials. The modified electrode exhibited a clear linear dependence of both anodic and cathodic peak current densities versus the scan rate over the range 2–500 mV s−1, as shown in the inset of Figure 3a. The presented results fitted with thin-layer electrochemical behaviour, as generally reported for immobilized systems.
It is possible to observe in Figure 3b (black curve) a couple of peaks related to DET of CDH through the CYTCDH subunit containing the heme b, which displayed a midpoint potential (E0) of −98 mV vs. Ag|AgClsat, close to the values reported in the literature for Ascomycota CDHs immobilized on gold electrodes [19]. The apparent heterogeneous electron transfer rate constant (ks) was calculated by considering an electron transfer coefficient of 0.53, obtained by fitting the linear part of the trumpet plot, as shown in the inset of Figure 3a. Therefore, the ks value was estimated to be 19.4 ± 0.6 s−1, according to Laviron’s equation [45] reported below:
log k s =   α log ( 1 α ) + ( 1 α ) log ( R T / n F υ ) α ( 1 α ) n F Δ E p / 2.3 R T
where α is the electron transfer coefficient, n the number of electrons, ΔEp the separation of the redox peak potentials and ν the scan rate (F = 96.495 C mol−1, T = 298 K, R = 8.31 J mol−1 K−1).
By integration of the redox peaks relative to the DET of CYTCDH it was possible to evaluate the enzyme surface coverage using the Faraday’s law below reported in Equation (2):
Γ T = Q n F A
where ΓT is the total surface concentration of electroactive protein (mol cm−2), A the electrode area (cm2), F the Faraday’s constant (96 495 C mol−1 of electrons), Q the charge underlying the redox wave and n the number of electrons [46]. The theoretical surface coverage (Γtheor) was estimated to be 5287 ± 152 pmol cm−2 (Ageom = 0.073 cm2), while the real surface coverage (Γreal) resulted to be 27 ± 2 pmol cm−2 (Areal = 13.83 ± 0.04 cm2, as shown in Table 1). Afterwards, the electrocatalytic behaviour of the CtCDH C291Y/GA/4-APh,4-MBA/AuNPs/GC electrode was studied by performing CVs in the presence of 5 mM glucose as substrate (Figure 3b, red curve), showing excellent performances with a current density of about 30 μA cm−2, probably due to the high nanostructuration of the electrode surface and the covalent immobilization of the enzyme.

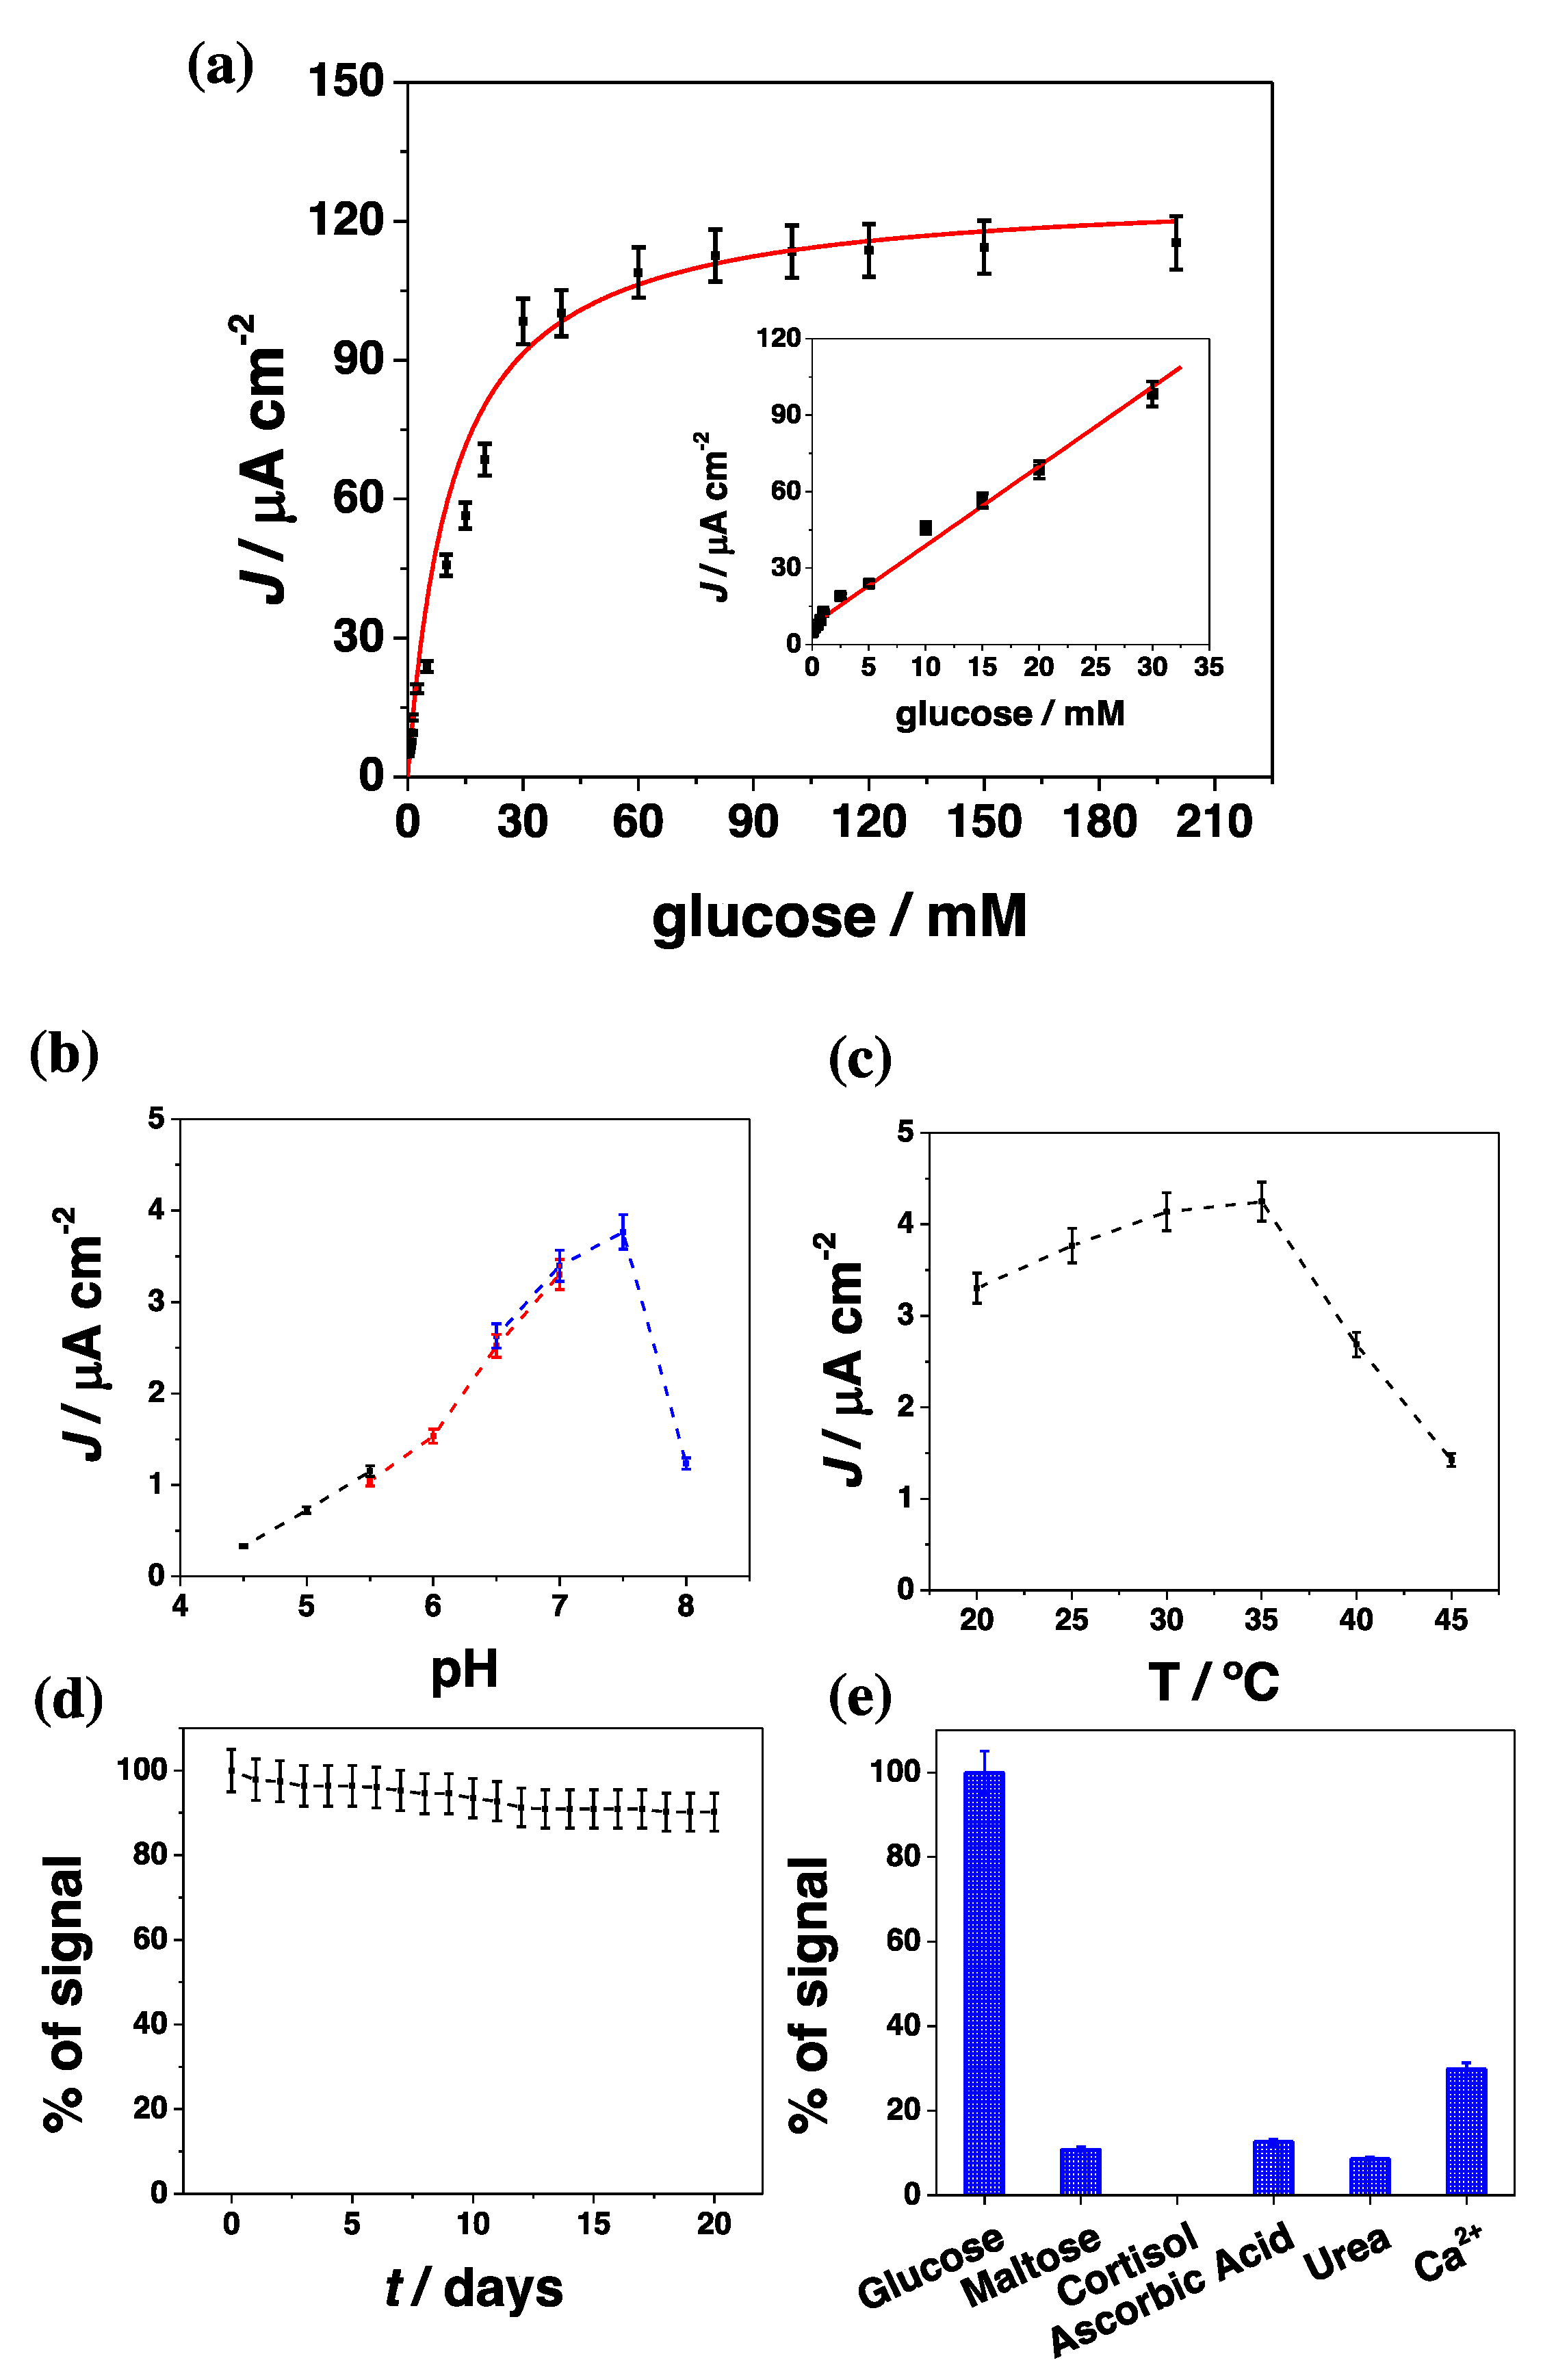
3.3. Glucose Biosensor Development

The amperometric response to glucose was studied by injecting glucose solutions at different concentrations by using the flow injection analysis (FIA) system, in order to investigate the electroanalytical and kinetic parameters of the modified CtCDH C291Y/GA/4-APh,4-MBA/AuNPs/GC electrode. The biosensor showed a fast peak response (5 s), probably due to the enlarged surface area related to the electrodeposition of the AuNPs and the cross-linking of the enzyme, which ensure high number of immobilized enzyme molecules and stable enzyme layer.
The calibration curve displayed a linear response range between 0.02 and 30 mM (R2 = 0.995, n = 5) with a sensitivity of 3.1 ± 0.1 μA mM−1 cm−2, as shown in the inset of Figure 4a. At higher concentrations the amperometric response is no longer linear due to the saturation of the enzyme active site. The detection limit for CtCDH C291Y/GA/4-APh,4-MBA/AuNPs/GC biosensor was found to be 6.2 μM, calculated using the relation 3σ/S, where σ is the absolute standard deviation of the intercept and S is the slope of the calibration curve [47]. The analytical performances of the glucose biosensor and the kinetic parameters are listed in Table 2. The apparent kinetic parameters (Imax, KMapp) are in good agreement with the values reported in the literature for nanostructured electrodes [48]. It is interesting to underline that today very few third generation glucose biosensors based on Ascomycota CDHs have been reported in the literature while most other glucose biosensors are based on first and second generation electron transfer mechanism of other GMC oxidoreductase enzymes (e.g., GOx).
The proposed CtCDH C291Y/GA/4-APh,4-MBA/AuNPs/GC biosensor shows a clear increase in terms of sensitivity, selectivity, stability, extended linear range and lower detection limit compared to other second and third generation glucose biosensors reported in the literature, as shown in Table 3.
Nevertheless, it exhibits a lower sensitivity compared to the first generation glucose biosensors, probably because of some issues related to the DET [49,50,51,52,53,54,55]. On the other hand, first and second generation biosensors have known drawbacks, such as their instability and the toxicity of the mediator layer.

3.4. Effect of pH and Temperature, Interferences and Stability Studies

The effects of pH and temperature on the proposed glucose biosensor were evaluated and the results are reported in Figure 4b. The optimum pH resulted to be pH 7 in TRIS buffer at a temperature of 35 °C. A significant decrease in the current densities occurs below pH 5.5 and above 8, in perfect agreement with the data reported in the literature about the optimum pH of the free CDH [56]. The dependence on the temperature is shown in Figure 4c where it is possible to see that the amperometric response increased from 20 to 30–35 °C and drastically decreased above 37 °C, due to a possible inactivation of the enzyme caused by the temperature.
The stability and lifetime of the CtCDH C291Y/GA/4-APh,4-MBA/AuNPs/GC biosensor was evaluated using the FIA system by monitoring the signal decrease within 20 days when the biosensor is used for one measurement per day, as reported in Figure 4d. The modified biosensor seems to retain about 90% of its initial activity after 20 days, probably due to the stability of the enzyme layer directly related to the nanostructuration of the electrode surface.
Finally, the selectivity of the proposed biosensor was studied in order to see the influence of possible interfering compounds generally present in human saliva such as maltose, cortisol, ascorbic acid, urea and calcium ions (Ca2+). The signal obtained for a fixed concentration of glucose (750 μM) was compared to that obtained with a sample containing the same glucose concentration plus equal amounts of the possible interfering compounds. The amperometric signal is lower than 10% for all compounds tested with the exception of Ca2+ ions, which potentially may interfere in real measurements (30% of glucose signal), probably because of its interaction with some amino acid residues present between the DHCDH and CYTCDH domains [56].

3.5. Glucose Detection in Human Saliva

In order to demonstrate the feasibility of the modified electrode for the non-invasive detection of glucose, the proposed biosensor was used to detect the concentration of glucose in human saliva samples. The samples were collected according to the procedure reported in Section 2.3, referred to literature on saliva analysis. The reliability of the amperometric biosensor platform CtCDH C291Y/GA/4-APh,4-MBA/AuNPs/GC was evaluated by comparing the results with those obtained with the glucose oxidase-peroxidase method. The proposed biosensor showed satisfactory results in all samples tested with a recovery between 95.0 and 97.4% (RSD values lower than 4%), as reported in Table 4.
The glucose content was measured also in blood samples collected from the same healthy patients with a commercial self-monitoring system (GlucoContour XT) in order to evaluate the correlation between glucose saliva and blood levels, for future potential development of devices for non-invasive glucose monitoring [57]. Figure 5 shows a good correlation between salivary and blood glucose concentration, opening the doors to the development of possible self-non invasive glucose monitoring devices.

4. Conclusions

We have demonstrated the possibility to carefully monitor the surface coverage of AuNPs on the electrode surface through a direct electrochemical deposition method of AuNPs onto a glassy carbon electrode which allows to achieve an efficient DET thanks to the effective nanostructure and the cross-linking of CDH molecules. AuNPs resulted to be very efficient for retaining the enzyme activity and promoting the electron transfer. The CtCDH C291Y/GA/4-APh,4-MBA/AuNPs/GC biosensor showed great performances in terms of extended linear range and higher sensitivity, selectivity and stability compared to other glucose biosensors. The promising platform allowed the detection of glucose in human saliva with results in very good agreement with those obtained with the standard spectrophotometric method showing also a good correlation with glucose blood levels. For these reasons, the proposed biosensor may represent the basis for the development of a portable non-invasive device for glucose monitoring in diabetes mellitus patients.

Acknowledgments

A particular acknowledgment to Daniel Jacobsson for the SEM characterization of the AuNPs modified GC electrodes. The authors would like to thank for financial funding the Swedish Research Council (Vetenskapsrådet project 2014-5908), the European Commission (project “Bioenergy” FP7-PEOPLE-2013-ITN-607793) and a scholarship of the Erasmus+ Project Unipharma-Graduates, promoted by a Consortium of Italian Universities and coordinated by Sapienza University of Rome.

Author Contributions

P.B. and R.A. conceived and designed the experiments; P.B. performed the experiments and analyzed the data. L.G. and R.A. revised the manuscript and R.L. kindly provided CtCDH C291Y mutant.

Conflicts of Interest

The authors declare no conflicts of interest. All authors have revised and approved the final version.

References

  1. Heller, A.; Feldman, B. Electrochemical glucose sensors and their applications in diabetes management. Chem. Rev. 2008, 108, 2482–2505. [Google Scholar] [CrossRef] [PubMed]
  2. Wang, J. Electrochemical glucose biosensors. Chem. Rev. 2008, 108, 814–825. [Google Scholar] [CrossRef] [PubMed]
  3. American Diabetes Association. Diagnosis and classification of diabetes mellitus. Diabetes Care 2014, 37, S81–S90. [Google Scholar]
  4. Janghorbani, M.; Van Dam, R.M.; Willett, W.C.; Hu, F.B. Systematic review of type 1 and type 2 diabetes mellitus and risk of fracture. Am. J. Epidemiol. 2007, 166, 495–505. [Google Scholar] [CrossRef] [PubMed]
  5. Newman, J.D.; Turner, A.P.F. Home blood glucose biosensors: A commercial perspective. Biosens. Bioelectron. 2005, 20, 2435–2453. [Google Scholar] [CrossRef] [PubMed] [Green Version]
  6. Lehmann, R.; Huber, M.; Beck, A.; Schindera, T.; Rinkler, T.; Houdali, B.; Weigert, C.; Häring, H.U.; Voelter, W.; Schleicher, E.D. Simultaneous, quantitative analysis of UDP-N-acetylglucosamine, UDP-N-acetylgalactosamine, UDP-glucose and UDP-galactose in human peripheral blood cells, muscle biopsies and cultured mesangial cells by capillary zone electrophoresis. Electrophoresis 2000, 21, 3010–3015. [Google Scholar] [CrossRef]
  7. Orata, F. Derivatization Reactions and Reagents for Gas Chromatography Analysis; Mohd, M.A., Ed.; InTech Open Access Publisher: Rijeka, Croatia, 2012; pp. 83–108. ISBN 978-953-0298-4. [Google Scholar] [CrossRef]
  8. Wang, C.; Kong, H.; Guan, Y.; Yang, J.; Gu, J.; Yang, S.; Xu, G. Plasma phospholipid metabolic profiling and biomarkers of type 2 diabetes mellitus based on high-performance liquid chromatography/electrospray mass spectRometry and multivariate statistical analysis. Anal. Chem. 2005, 77, 4108–4116. [Google Scholar] [CrossRef] [PubMed]
  9. Srinivasan, V.; Pamula, V.K.; Fair, R.B. Droplet-based microfluidic lab-on-a-chip for glucose detection. Anal. Chim. Acta 2004, 507, 145–150. [Google Scholar] [CrossRef]
  10. Chen, S.-F.; Danao, M.-G.C.; Singh, V.; Brown, P.J. Determining sucrose and glucose levels in dual-purpose sorghum stalks by Fourier transform near infrared (FT-NIR) spectroscopy. J. Sci. Food Agric. 2014, 94, 2569–2576. [Google Scholar] [CrossRef] [PubMed]
  11. Scheller, F.W.; Schubert, F.; Neumann, B.; Pfeiffer, D.; Hintsche, R.; Dransfeld, I.; Wollenberger, U.; Renneberg, R.; Warsinke, A.; Johansson, G. Second generation biosensors. Biosens. Bioelectron. 1991, 6, 245–253. [Google Scholar] [CrossRef]
  12. Antiochia, R.; Vinci, G.; Gorton, L. Rapid and direct determination of fructose in food: A new osmium-polymer mediated biosensor. Food Chem. 2013, 140, 742–747. [Google Scholar] [CrossRef] [PubMed]
  13. Mazzei, F.; Favero, G.; Bollella, P.; Tortolini, C.; Mannina, L.; Conti, M.E.; Antiochia, R. Recent trends in electrochemical nanobiosensors for environmental analysis. Int. J. Environ. Health 2015, 7, 267–291. [Google Scholar] [CrossRef]
  14. Bollella, P.; Fusco, G.; Tortolini, C.; Sanzò, G.; Favero, G.; Gorton, L.; Antiochia, R. Beyond graphene: Electrochemical sensors and biosensors for biomarkers detection. Biosens. Bioelectron. 2017, 89, 152–166. [Google Scholar] [CrossRef] [PubMed]
  15. Bollella, P.; Schulz, C.; Favero, G.; Mazzei, F.; Ludwig, R.; Gorton, L.; Antiochia, R. Green Synthesis and Characterization of Gold and Silver Nanoparticles and Their Application for Development of a Third Generation Lactose Biosensor. Electroanalysis 2017, 29, 77–86. [Google Scholar] [CrossRef]
  16. Favero, G.; Fusco, G.; Mazzei, F.; Tasca, F.; Antiochia, R. Electrochemical characterization of graphene and MWCNT screen-printed electrodes modified with AuNPs for laccase biosensor development. Nanomaterials 2015, 5, 1995–2006. [Google Scholar] [CrossRef] [PubMed] [Green Version]
  17. Katz, E.; Willner, I. Integrated nanoparticle–biomolecule hybrid systems: Synthesis, properties, and applications. Angew. Chem. Int. Ed. 2004, 43, 6042–6108. [Google Scholar] [CrossRef] [PubMed]
  18. Krueger, M.; Berg, S.; Stone, D.A.; Strelcov, E.; Dikin, D.A.; Kim, J.; Cote, L.J.; Huang, J.; Kolmakov, A. Drop-casted self-assembling graphene oxide membranes for scanning electron microscopy on wet and dense gaseous samples. ACS Nano 2011, 5, 10047–10054. [Google Scholar] [CrossRef] [PubMed]
  19. Bollella, P.; Mazzei, F.; Favero, G.; Fusco, G.; Ludwig, R.; Gorton, L.; Antiochia, R. Improved DET communication between cellobiose dehydrogenase and a gold electrode modified with a rigid self-assembled monolayer and green metal nanoparticles: The role of an ordered nanostructuration. Biosens. Bioelectron. 2017, 88, 196–203. [Google Scholar] [CrossRef] [PubMed]
  20. Shah, A.T.; Din, M.I.; Bashir, S.; Qadir, M.A.; Rashid, F. Green synthesis and characterization of silver nanoparticles using Ferocactus echidne extract as a reducing agent. Anal. Lett. 2015, 48, 1180–1189. [Google Scholar] [CrossRef]
  21. El-Deab, M.S.; Sotomura, T.; Ohsaka, T. Size and crystallographic orientation controls of gold nanoparticles electrodeposited on GC electrodes. J. Electrochem. Soc. 2005, 152, C1–C6. [Google Scholar] [CrossRef]
  22. Hezard, T.; Fajerwerg, K.; Evrard, D.; Collière, V.; Behra, P.; Gros, P. Gold nanoparticles electrodeposited on glassy carbon using cyclic voltammetry: Application to Hg(II) trace analysis. J. Electroanal. Chem. 2012, 664, 46–52. [Google Scholar] [CrossRef] [Green Version]
  23. Luo, X.-L.; Xu, J.-J.; Du, Y.; Chen, H.-Y. A glucose biosensor based on chitosan–glucose oxidase–gold nanoparticles biocomposite formed by one-step electrodeposition. Anal. Biochem. 2004, 334, 284–289. [Google Scholar] [CrossRef] [PubMed]
  24. Ustarroz, J.; Ke, X.; Hubin, A.; Bals, S.; Terryn, H. New insights into the early stages of nanoparticle electrodeposition. J. Phys. Chem. C 2012, 116, 2322–2329. [Google Scholar] [CrossRef]
  25. Matsumura, H.; Ortiz, R.; Ludwig, R.; Igarashi, K.; Samejima, M.; Gorton, L. Direct electrochemistry of Phanerochaete chrysosporium cellobiose dehydrogenase covalently attached onto gold nanoparticle modified solid gold electrodes. Langmuir 2012, 28, 10925–10933. [Google Scholar] [CrossRef] [PubMed]
  26. Ludwig, R.; Ortiz, R.; Schulz, C.; Harreither, W.; Sygmund, C.; Gorton, L. Cellobiose dehydrogenase modified electrodes: Advances by materials science and biochemical engineering. Anal. Bioanal. Chem. 2013, 405, 3637–3658. [Google Scholar] [CrossRef] [PubMed]
  27. Cipri, A.; Schulz, C.; Ludwig, R.; Gorton, L.; Del Valle, M. A novel bio-electronic tongue using different cellobiose dehydrogenases to resolve mixtures of various sugars and interfering analytes. Biosens. Bioelectron. 2016, 79, 515–521. [Google Scholar] [CrossRef] [PubMed]
  28. Falk, M.; Pankratov, D.; Lindh, L.; Arnebrant, T.; Shleev, S. Miniature direct electron transfer based enzymatic fuel cell operating in human sweat and saliva. Fuel Cells 2014, 14, 1050–1056. [Google Scholar] [CrossRef]
  29. Zamocky, M.; Ludwig, R.; Peterbauer, C.; Hallberg, B.M.; Divne, C.; Nicholls, P.; Haltrich, D. Cellobiose dehydrogenase-a flavocytochRome from wood-degrading, phytopathogenic and saprotropic fungi. Curr. Protein. Pept. Sci. 2006, 7, 255–280. [Google Scholar] [CrossRef] [PubMed]
  30. Schulz, C.; Ludwig, R.; Gorton, L. Polyethyleneimine as a promoter layer for the immobilization of cellobiose dehydrogenase from Myriococcum thermophilum on graphite electrodes. Anal. Chem. 2014, 86, 4256–4263. [Google Scholar] [CrossRef] [PubMed]
  31. Tavahodi, M.; Ortiz, R.; Schulz, C.; Ekhtiari, A.; Ludwig, R.; Haghighi, B.; Gorton, L. Direct Electron Transfer of Cellobiose Dehydrogenase on Positively Charged Polyethyleneimine Gold Nanoparticles. ChemPlusChem 2017, 82, 546–552. [Google Scholar] [CrossRef]
  32. Ortiz, R.; Rahman, M.; Zangrilli, B.; Sygmund, C.; Micheelsen, P.O.; Silow, M.; Toscano, M.D.; Ludwig, R.; Gorton, L. Engineering of Cellobiose Dehydrogenases for Improved Glucose Sensitivity and Reduced Maltose Affinity. ChemElectroChem 2017, 4, 846–855. [Google Scholar] [CrossRef]
  33. Dai, X.; Nekrassova, O.; Hyde, M.E.; Compton, R.G. Anodic stripping voltammetry of arsenic(III) using gold nanoparticle-modified electrodes. Anal. Chem. 2004, 76, 5924–5929. [Google Scholar] [CrossRef] [PubMed]
  34. Wang, X.; Falk, M.; Ortiz, R.; Matsumura, H.; Bobacka, J.; Ludwig, R.; Bergelin, M.; Gorton, L.; Shleev, S. Mediatorless sugar/oxygen enzymatic fuel cells based on gold nanoparticle-modified electrodes. Biosens. Bioelectron. 2012, 31, 219–225. [Google Scholar] [CrossRef] [PubMed]
  35. Henson, B.S.; Wong, D.T. Collection, storage, and processing of saliva samples for downstream molecular applications. Oral Biol. Mol. Technol. Appl. 2010, 666, 21–30. [Google Scholar]
  36. Mehta, Y.P.; Munde, B.P. Study of blood sugar levels in high risk neonates using glucometer method and laboratory glucose oxidase peroxidase method. Int. J. Contemp. Pediatr. 2017, 4, 1185–1192. [Google Scholar] [CrossRef]
  37. Trinder, P. Determination of glucose in blood using glucose oxidase with an alternative oxygen acceptor. Ann. Clin. Biochem. 1969, 6, 24–27. [Google Scholar] [CrossRef]
  38. Wilkins, E.; Atanasov, P. Glucose monitoring: State of the art and future possibilities. Med. Eng. Phys. 1996, 18, 273–288. [Google Scholar] [CrossRef]
  39. Oldham, K.B. Analytical expressions for the reversible Randles-Sevcik function. J. Electroanal. Chem. Interfacial Electrochem. 1979, 105, 373–375. [Google Scholar] [CrossRef]
  40. Daglia, M.; Antiochia, R.; Sobolev, A.P.; Mannina, L. Untargeted and targeted methodologies in the study of tea (Camellia sinensis L.). Food Res. Int. 2014, 63, 275–289. [Google Scholar] [CrossRef]
  41. Murata, K.; Kajiya, K.; Nukaga, M.; Suga, Y.; Watanabe, T.; Nakamura, N.; Ohno, H. A Simple Fabrication Method for Three-Dimensional Gold Nanoparticle Electrodes and Their Application to the Study of the Direct Electrochemistry of Cytochrome c. Electroanalysis 2010, 22, 185–190. [Google Scholar] [CrossRef]
  42. Trasatti, S.; Petrii, O.A. Real surface area measurements in electrochemistry. Pure Appl. Chem. 1991, 63, 711–734. [Google Scholar] [CrossRef]
  43. Lavagnini, I.; Antiochia, R.; Magno, F. An extended method for the practical evaluation of the standard rate constant from cyclic voltammetric data. Electroanalysis 2004, 16, 505–506. [Google Scholar] [CrossRef]
  44. Lavagnini, I.; Antiochia, R.; Magno, F. A calibration-base method for the evaluation of the detection limit of an electrochemical biosensor. Electroanalysis 2007, 19, 1127–1230. [Google Scholar] [CrossRef]
  45. Laviron, E. General expression of the linear potential sweep voltammogram in the case of diffusionless electrochemical systems. J. Electroanal. Chem. Interfacial Electrochem. 1979, 101, 19–28. [Google Scholar] [CrossRef]
  46. Rusling, J.F.; Zhang, Z. Thin films on electrodes for direct protein electron transfer. In Handbook of Surfaces and Interfaces of Materials; Elsevier: Amsterdam, The Netherlands, 2001; pp. 33–71. [Google Scholar]
  47. Shrivastava, A.; Gupta, V.B. Methods for the determination of limit of detection and limit of quantitation of the analytical methods. Chron. Young Sci. 2011, 2, 21–25. [Google Scholar] [CrossRef]
  48. Tasca, F.; Zafar, M.N.; Harreither, W.; Nöll, G.; Ludwig, R.; Gorton, L. A third generation glucose biosensor based on cellobiose dehydrogenase from Corynascus thermophilus and single-walled carbon nanotubes. Analyst 2011, 136, 2033–2036. [Google Scholar] [CrossRef] [PubMed]
  49. Gao, Z.-D.; Qu, Y.; Li, T.; Shrestha, N.K.; Song, Y.-Y. Development of amperometric glucose biosensor based on Prussian Blue functionlized TiO2 nanotube arrays. Sci. Rep. 2014, 4, 6891. [Google Scholar] [CrossRef] [PubMed]
  50. Liu, Y.; Chu, Z.; Zhang, Y.; Jin, W. Amperometric glucose biosensor with high sensitivity based on self-assembled Prussian Blue modified electrode. Electrochim. Acta 2009, 54, 7490–7494. [Google Scholar] [CrossRef]
  51. Sekar, N.C.; Shaegh, S.A.M.; Ng, S.H.; Ge, L.; Tan, S.N. A paper-based amperometric glucose biosensor developed with Prussian Blue-modified screen-printed electrodes. Sens. Actuators B Chem. 2014, 204, 414–420. [Google Scholar] [CrossRef]
  52. Lawrence, C.S.K.; Tan, S.N.; Floresca, C.Z. A “green” cellulose paper based glucose amperometric biosensor. Sens. Actuators B Chem. 2014, 193, 536–541. [Google Scholar] [CrossRef]
  53. Cass, A.E.G.; Davis, G.; Francis, G.D.; Hill, H.A.O.; Aston, W.J.; Higgins, I.J.; Plotkin, E.V.; Scott, L.D.L.; Turner, A.P.F. Ferrocene-mediated enzyme electrode for amperometric determination of glucose. Anal. Chem. 1984, 56, 667–671. [Google Scholar] [CrossRef] [PubMed]
  54. Gao, Q.; Guo, Y.; Zhang, W.; Qi, H.; Zhang, C. An amperometric glucose biosensor based on layer-by-layer GOx-SWCNT conjugate/redox polymer multilayer on a screen-printed carbon electrode. Sens. Actuators B Chem. 2011, 153, 219–225. [Google Scholar] [CrossRef]
  55. Zafar, M.N.; Safina, G.; Ludwig, R.; Gorton, L. Characteristics of third-generation glucose biosensors based on Corynascus thermophilus cellobiose dehydrogenase immobilized on commercially available screen-printed electrodes working under physiological conditions. Anal. Biochem. 2012, 425, 36–42. [Google Scholar] [CrossRef] [PubMed]
  56. Harreither, W.; COman, V.; Ludwig, R.; Haltrich, D.; Gorton, L. Investigation of graphite electrodes modified with cellobiose dehydrogenase from the ascomycete Myriococcum thermophilum. Electroanalysis 2007, 19, 172–180. [Google Scholar] [CrossRef]
  57. Zhang, W.; Du, Y.; Wang, M.L. Noninvasive glucose monitoring using saliva nano-biosensor. Sens. Biol. Sens. Res. 2015, 4, 23–29. [Google Scholar] [CrossRef]
Scheme 1. The electrode modification pathway for CtCDH C291Y/GA/4-APh,4-MBA/AuNPs/GC platform has been reported. Initially, AuNPs were directly electrodeposited onto cleaned GC electrode by sweeping the potential. Afterward, the electrode was incubated in a thiol mixture (1:1 v/v 4-APh and 4-MBA) overnight, followed by cross-linking reaction (glutaraldehyde GA: cross-linking agent) to covalently link the enzyme (CtCDH C291Y) to the so modified electrode surface.
Sensors 17 01912 sch001
Figure 1. SEM images of AuNPs-modified GCEs obtained by sweeping the potential between 1.1 and −0.1 V vs. Ag|AgClsat for a given number of scans in 10 mM HAuCl4 (0.5 M H2SO4): (a) 5, (b) 10, (c) 15, (d) 20, (e) 25, (f) 30 and (g) 35.
Sensors 17 01912 g001
Figure 2. Cyclic voltammograms of AuNPs modified GCE electrodes with different number of scans (from 0 scans to 35 scans) in 0.5 M H2SO4. Scan rate 100 mV s−1. T = 25 °C.
Sensors 17 01912 g002
Figure 3. (a) CVs of CtCDH C291Y/GA/4-APh,4-MBA/AuNPs/GC in pH 7.4, 50 mM TRIS (0.1 M KCl) in the potential range of −0.6 V to 0.35 V, scan rates from 2 mV s−1 to 500 mV s−1. Inset: linear part of cathodic (Jpc) and anodic peak current densities (Jpa) vs. scan rate (v). (b) CVs of CtCDH C291Y/GA/4-APh, 4-MBA/AuNPs/GC in absence (black) and in presence of 5 mM glucose (red) in 50 mM TRIS buffer, pH 7.4 (0.1 M KCl) at a scan rate of 5 mV s−1. T = 25 °C.
Sensors 17 01912 g003
Figure 4. (a) Glucose biosensor calibration graph of CtCDH C291Y/GA/4-APh,4-MBA/AuNPs/GC in 50 TRIS buffer pH 7.4 (0.1 M KCl); Eapp = 0.250 vs. Ag|AgClsat; flow rate 0.5 mL min−1; inset: linear part of the calibration curve; (b) biosensor response over the pH range (4.5–8): 50 mM acetate buffer (black), 50 mM MOPS buffer (red) and in 50 mM TRIS buffer (blue), with Eapp = 0.250 vs. Ag|AgClsat; flow rate 0.5 mL min−1; (c) biosensor response over the T range (20–45 °C) in TRIS buffer; (d) lifetime of CtCDH C291Y/GA/4-APh,4-MBA/AuNPs/GC biosensor in presence of 750 μM glucose solution; (e) influence of interfering compounds on glucose response in presence of 750 μM glucose, maltose, cortisol, ascorbic acid, Ca2+. Experimental conditions (ce): 50 TRIS buffer pH 7.4 (0.1 M KCl), Eapp = 0.250 vs. Ag|AgClsat; flow rate 0.5 mL min−1; injection volume 50 μL; T = 25 °C.
Sensors 17 01912 g004
Figure 5. Correlation between glucose blood and saliva glucose concentration in 6 healthy patients at fasting state. Salivary glucose was detected with the CtCDH C291Y/GA/4-APh,4-MBA/AuNPs/GC biosensor, blood glucose was detected with the commercial GlucoContour XT.
Sensors 17 01912 g005
Table 1. Characterization of AuNPs on GC modified electrodes for different numbers of cyclic scans (N) during the electrodeposition step. Experimental conditions: 10 mM Fe(CN)63−/4− in 50 mM TRIS buffer pH 7.4 with 0.1 M KCl for electroactive area (AEA), real surface area (Areal), electron transfer rate constant (k0) and roughness factor (ρ) determination; 0.5 M H2SO4 at a scan rate of 100 mV s−1, for Areal determination.
Scan Numbers (N)AEA/cm2Areal/cm2k0app/10−2 cm s−1Roughness Factor (ρ)
00.09 ± 0.01-4.6 ± 0.11.3 ± 0.1
52.72 ± 0.212.93 ± 0.075.2 ± 0.338.5 ± 0.3
103.92 ± 0.124.13 ± 0.067.9 ± 0.455.5 ± 0.3
154.13 ± 0.194.46 ± 0.0613.4 ± 0.658.5 ± 0.5
208.74 ± 0.259.26 ± 0.0418.2 ± 0.7123.8 ± 0.8
2512.96 ± 0.1813.83 ± 0.0426.8 ± 0.3183.6 ± 1.2
304.18 ± 0.064.39 ± 0.0815.3 ± 0.859.2 ± 0.7
353.26 ± 0.123.99 ± 0.0610.6 ± 0.546.2 ± 1.3
Table 2. Electroanalytical and kinetic parameters of the CtCDH C291Y/GA/4-APh,4-MBA/AuNPs/GC biosensor obtained by FIA amperometry in 50 mM TRIS buffer, pH 7.4. Applied potential: +0.250 V vs. Ag|AgClsat.
CtCDH C291Y/GA/4-APh,4-MBA/AuNPs/GC
Eapp/(V vs. Ag|AgClsat)+0.250
KMapp/mM11.7 ± 1.2
Jmax/μA cm−2126.9 ± 3.0
LOD/μM6.2
Linear range/mM0.02–30
Sensitivity/μA mM−1 cm−23.1 ± 0.1
R20.99
Table 3. Comparison between glucose biosensors based on mediated (MET) and direct electron transfer (DET). List of abbreviations: 1,1′-dimethylferrocene (DMFc), 1,2-diaminobenzene (p-DAB), 4-aminophenol (4-APh), 4-mercaptobenzoic acid (4-MBA), Corynascus thermophilus cellobiose dehydrogenase (CtCDH), Corynascus thermophilus cellobiose dehydrogenase C291Y mutant (CtCDH C291Y), ferrocene-COOH (Fc-COOH), glassy carbon electrode (GC), glucose oxidase (GOx), glutaraldehyde (GA), gold (Au), gold nanoparticles (AuNPs), osmium (bpy)2poly (1-vinylimidazole) (PVI-Os), Prussian Blue (PB), screen-printed carbon electrode (SPCE), single walled carbon nanotubes (SWCNTs), titanium nanotubes (TiNTs).
Modified ElectrodeEapp/V vs. Ag|AgClsatLinear Range/mMLOD/μMSensitivity/μA mM−1 cm−2StabilityReference
(GOx/Au/pDAB)-PB/AuNPs/TiNTs (1st generation)−0.350.01–0.703.2248.0>90% after 1 month[49]
GOx-GA/PB/Pt (1st generation)−0.050.01–1580.083.3% after 23 days[50]
GOx/PB/SPCE (1st generation)−0.300.25–210.017.072% after 45 days[51]
GOx/Fc-COOH/SPCE (2nd generation)+0.251–5180.02.0~80% after 3 weeks[52]
GOx/DMFc/G (2nd generation)+0.161–30300--[53]
GOx-SWCNTs-PVI-Os/SPCE (2nd generation)+0.300.2–7.50.0732~90% after 30 days[54]
CtCDH/GA/SWCNTs/SPCE (3rd generation)+0.100.1–3010.0-~90% after 7.5 h[55]
CtCDH C291Y/GA/4-APh, 4-MBA/AuNPs/GC (3rd generation)+0.250.02–306.23.1~90% after 20 daysthis work
Table 4. Glucose measurements in human saliva with the CtCDH C291Y/GA/4-APh,4-MBA/AuNPs/GC biosensor and with the glucose oxidase-peroxidase kit (GlucoContour XT), as reference method. Experimental conditions: 50 mM TRIS buffer pH 7.4, Eapp = +0.250 V vs. Ag|AgClsat.
Biosensor/mg dL−1Reference Method/mg dL−1Recovery/%
Sample 1 (male)0.77 ± 0.030.79 ± 0.0397.4
Sample 2 (male)0.96 ± 0.021.00 ± 0.0495.7
Sample 3 (male)0.89 ± 0.030.92 ± 0.0596.9
Sample 1 (female)0.74 ± 0.030.75 ± 0.0398.8
Sample 2 (female)0.71 ± 0.010.74 ± 0.0295.0
Sample 3 (female)0.77 ± 0.020.80 ± 0.0196.5

