Real-Time Rain Rate Evaluation via Satellite Downlink Signal Attenuation Measurement

 ,
,  ,
,  ,
, 
Abstract
:1. Introduction
1.1. Ground-Based Instruments
1.2. Weather Radars
1.3. Microwave Links
2. Architecture of the Real-Time Wide-Area Rain-Rate Measurement System
2.1. Rationale and Underlying Idea
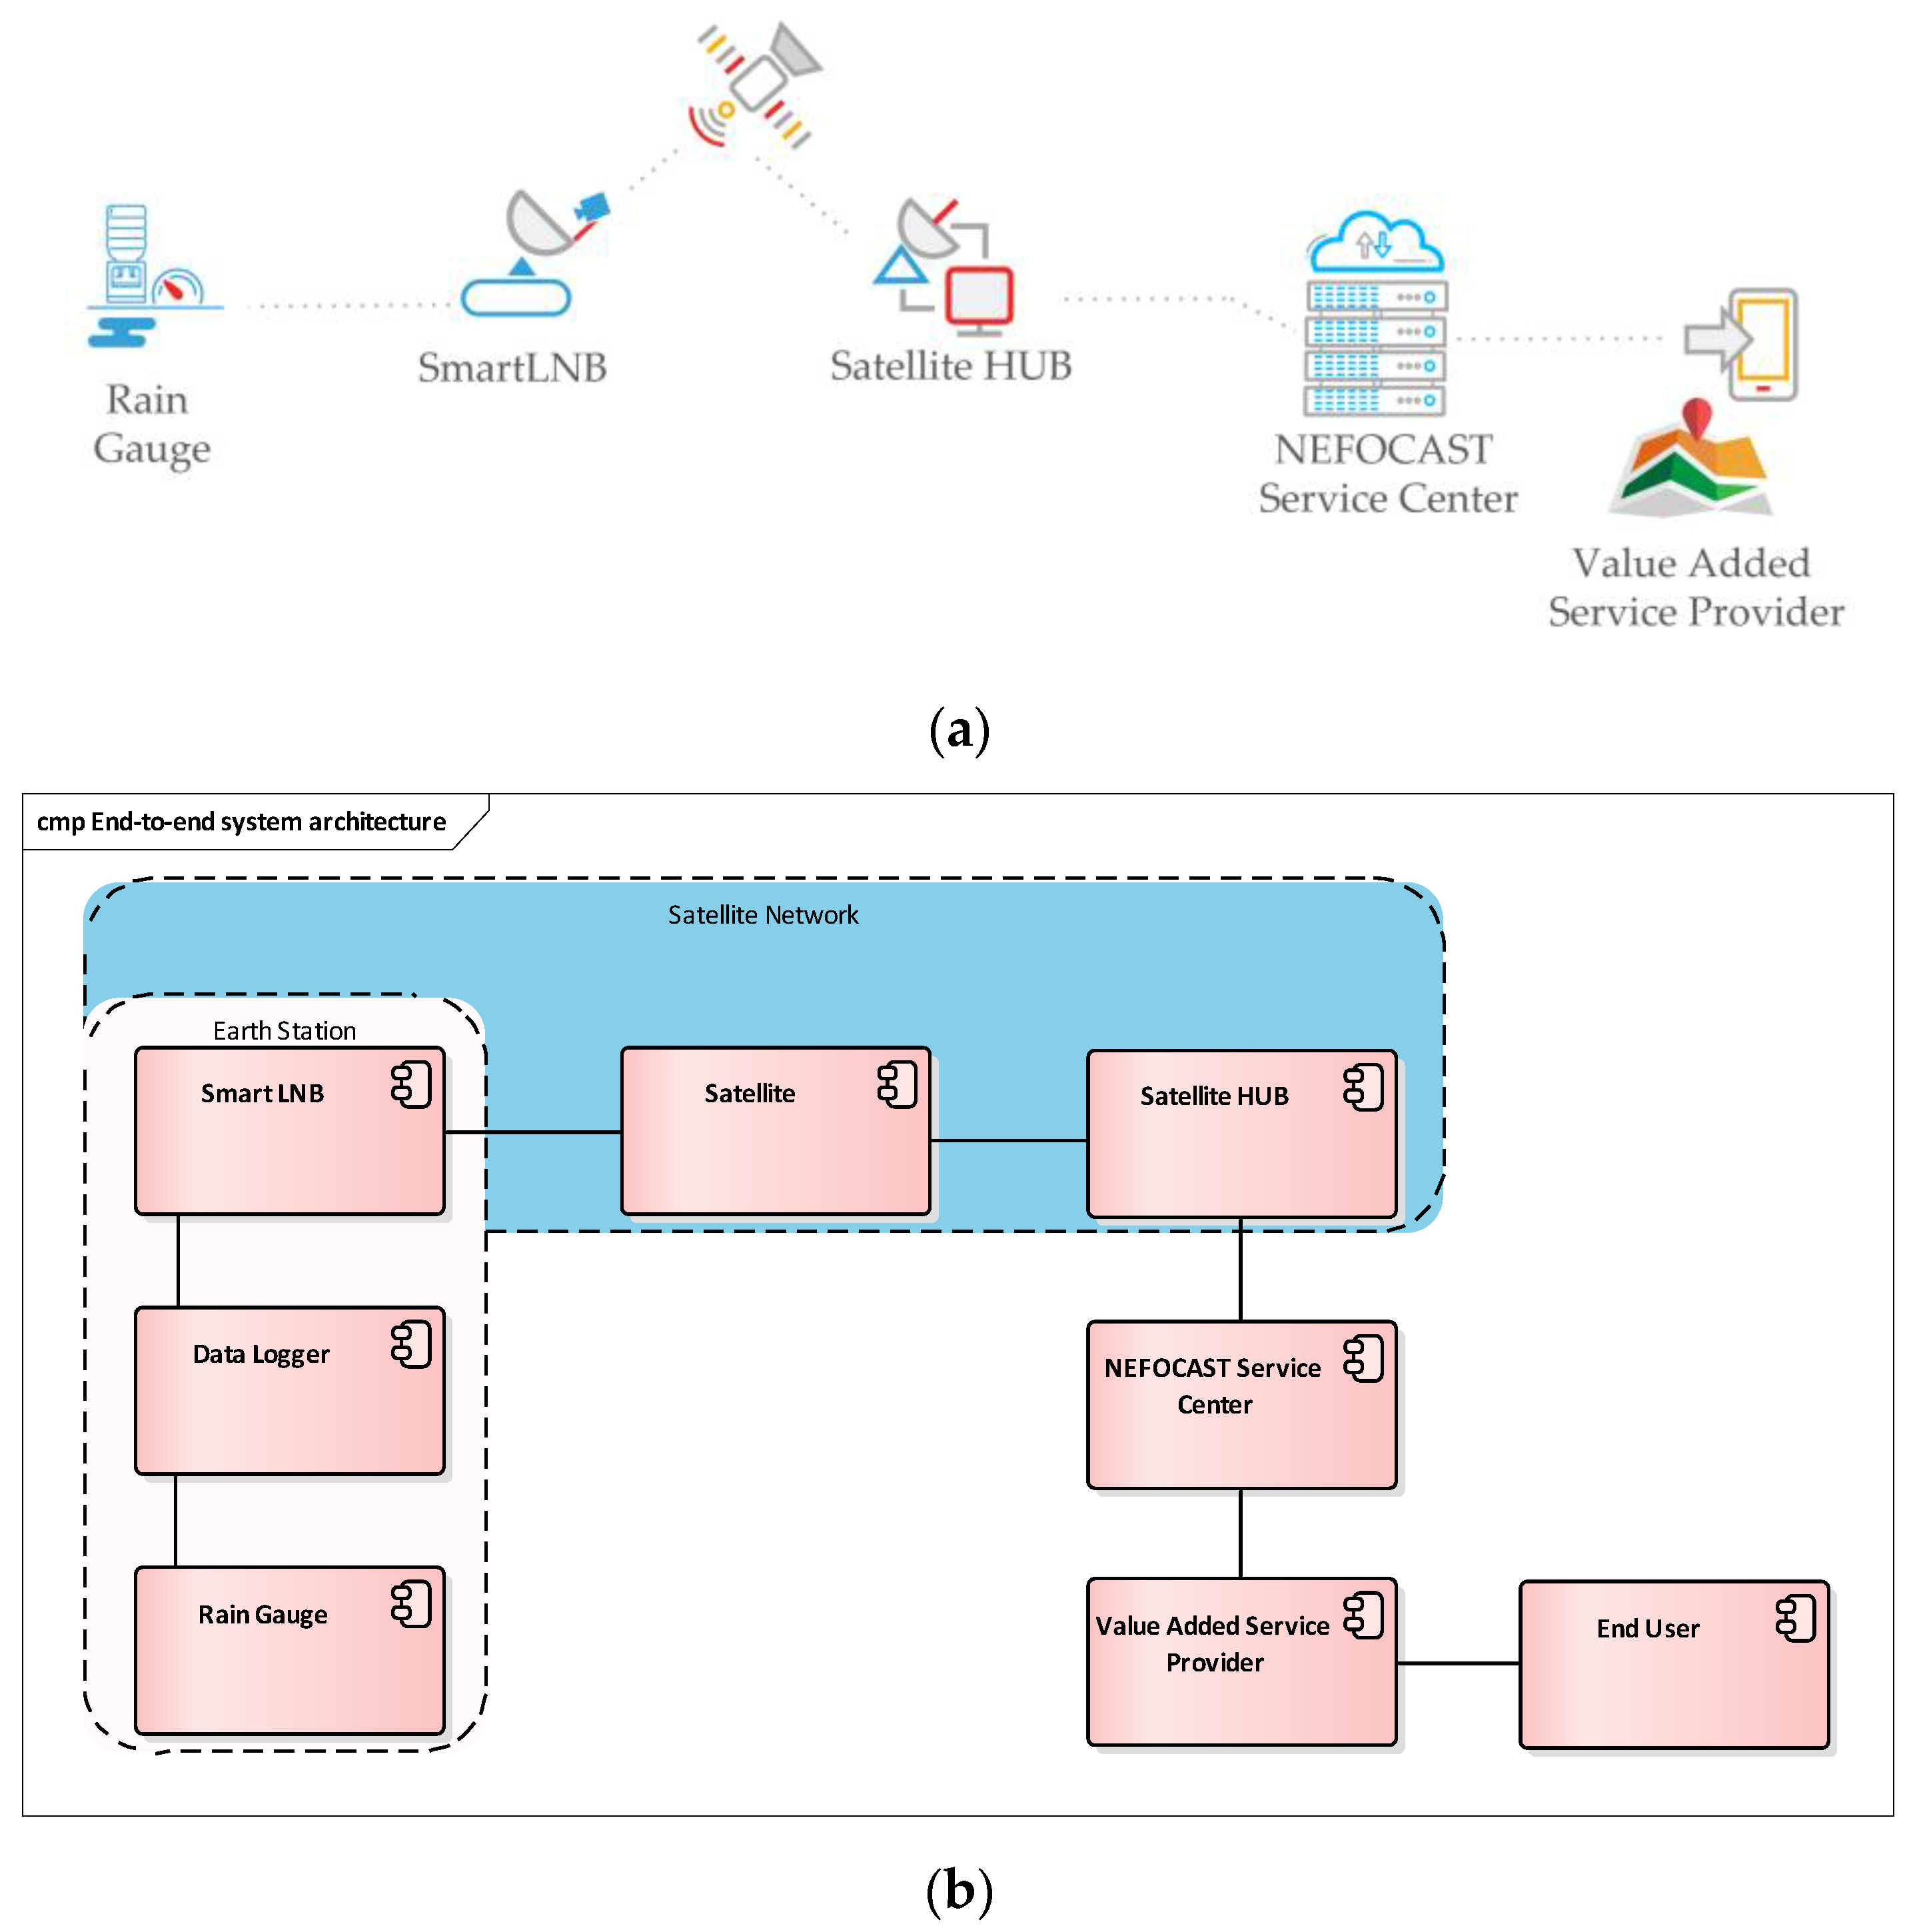
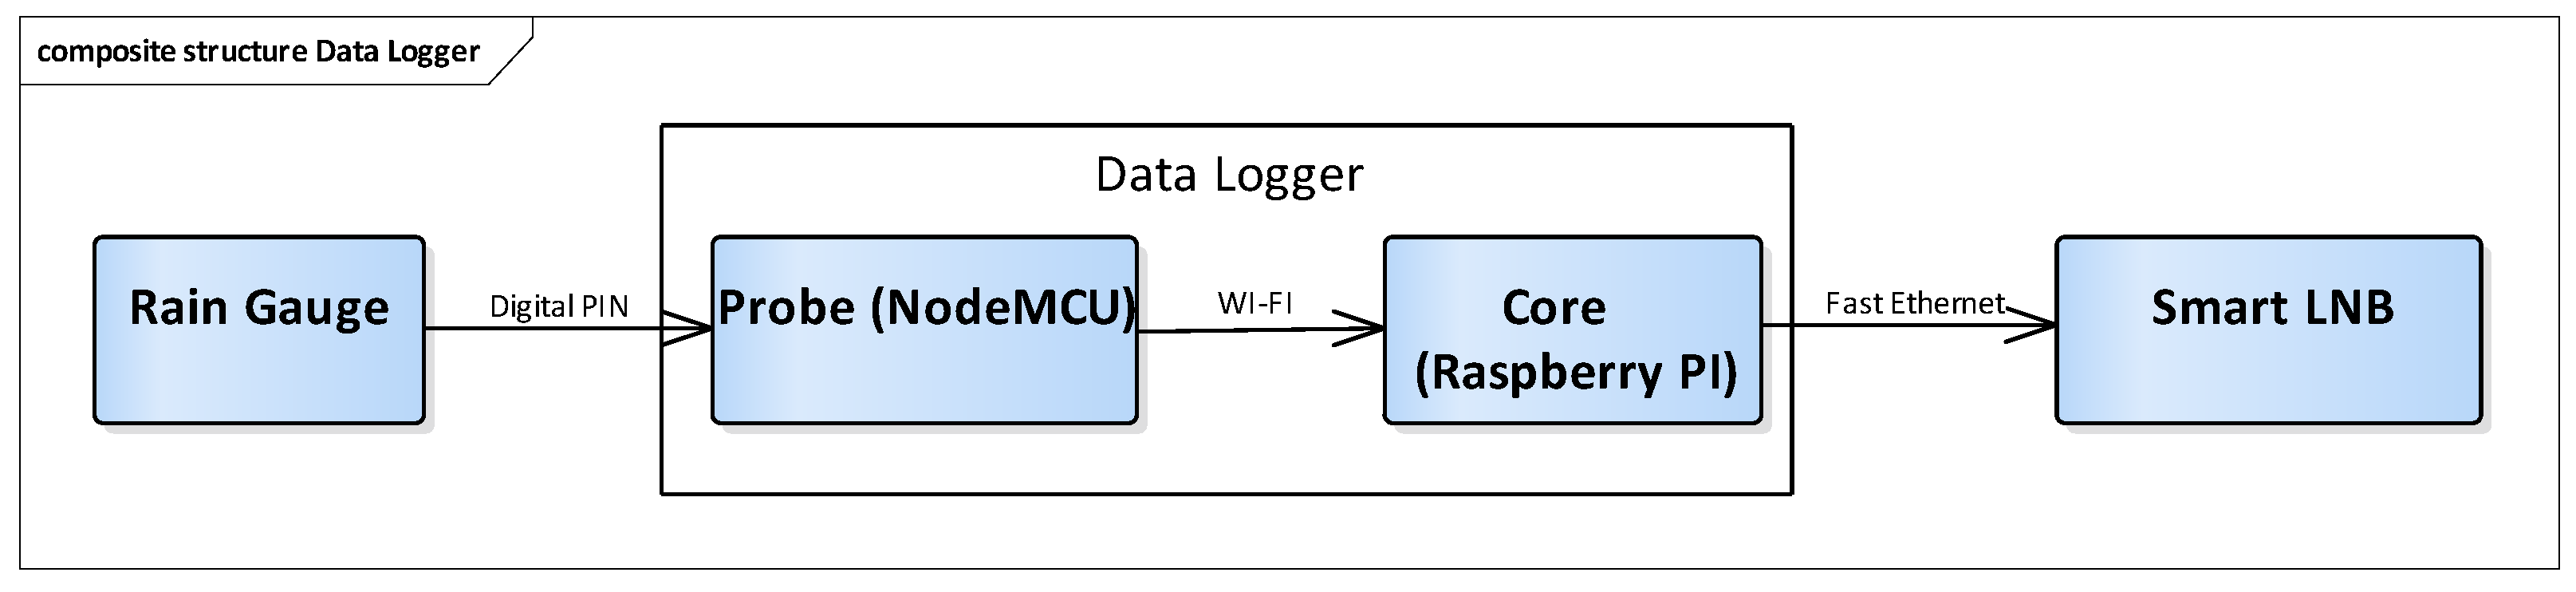
2.2. System Architecture and Description
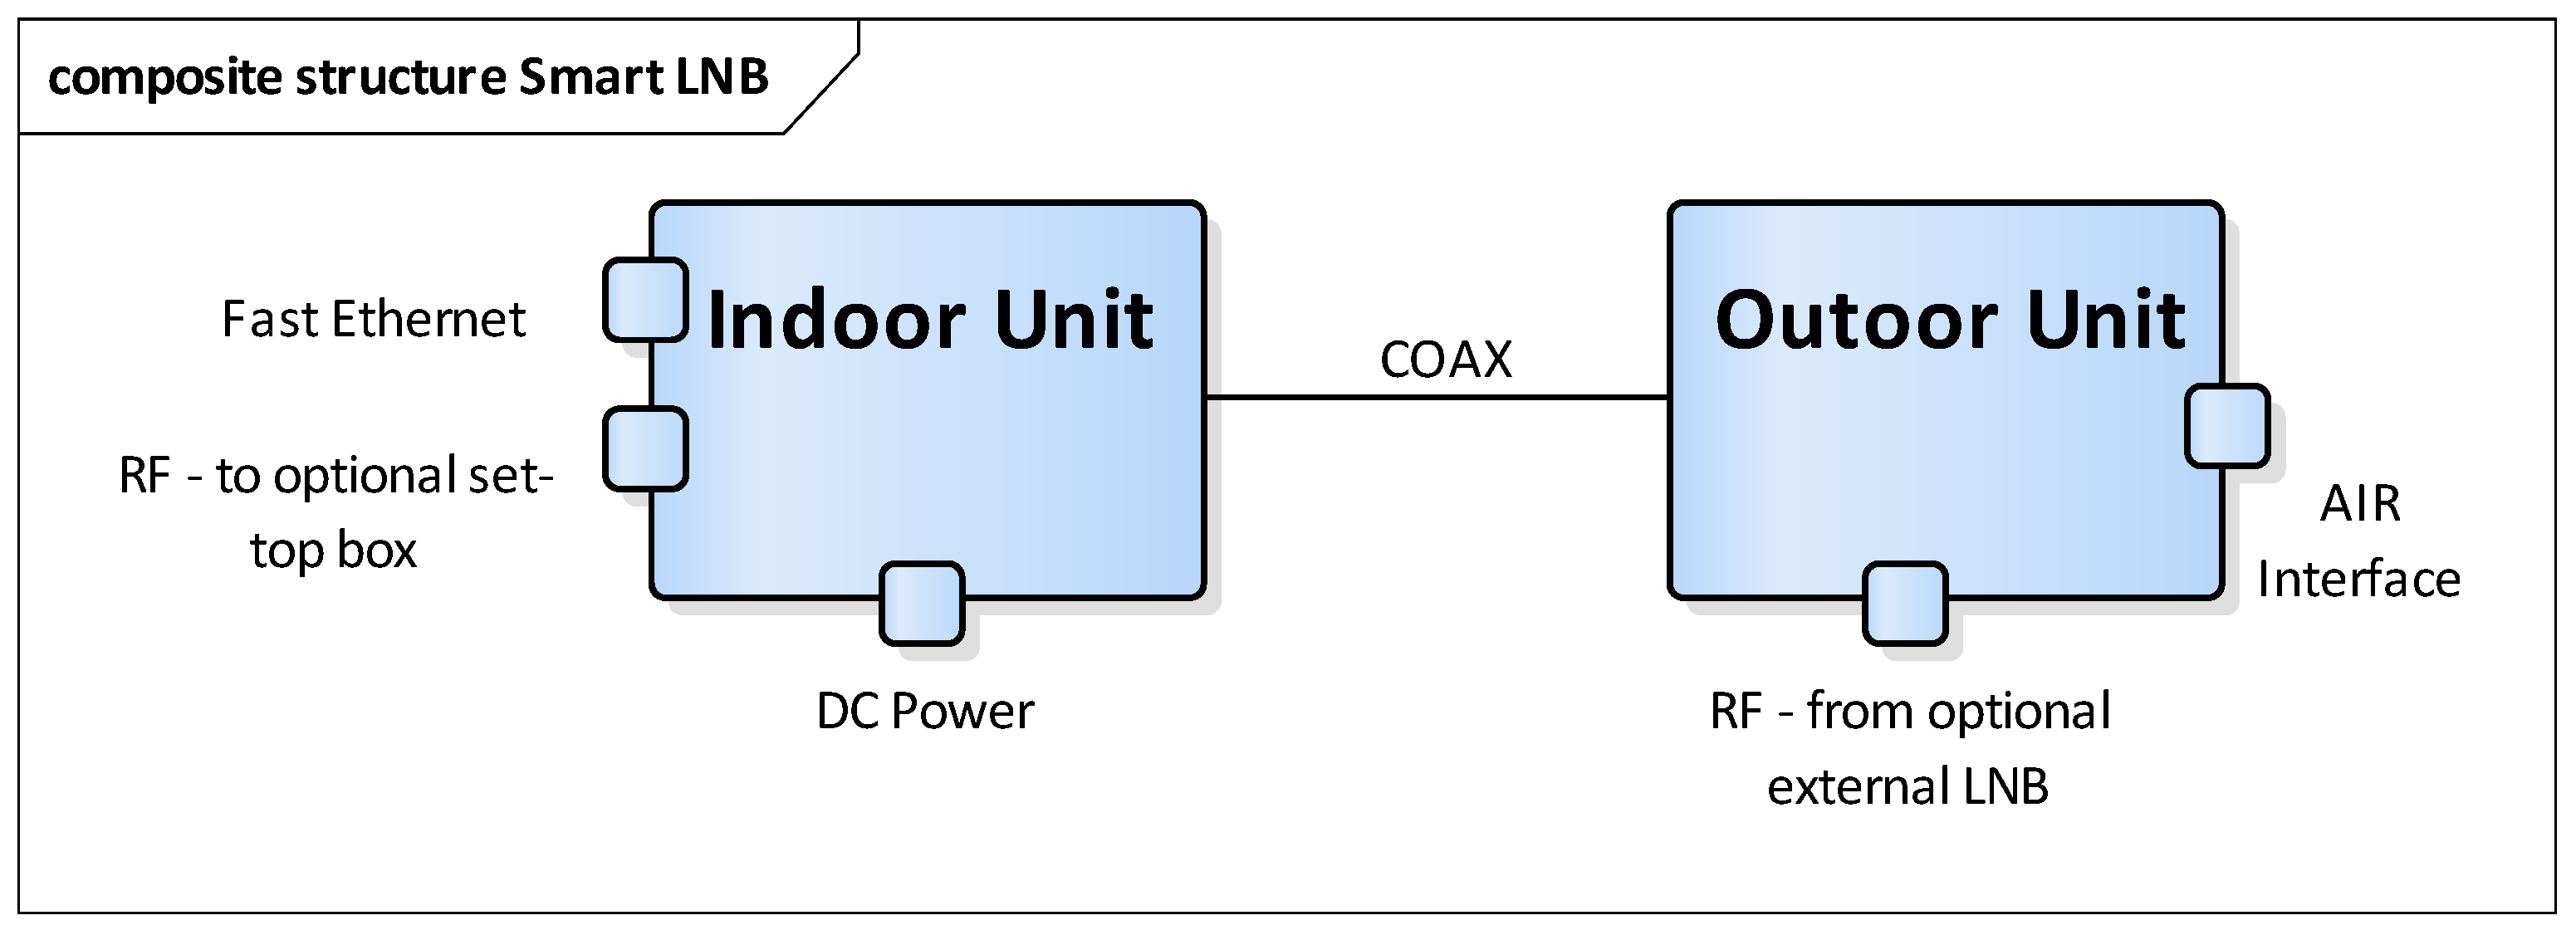
2.3. SmartLNB and Satellite Network
2.4. Tipping Bucket Rain Gauges Sensors
2.5. NEFOCAST’s Space Segment
2.6. NEFOCAST's Service Center
2.7. Market Opportunities
- Higher accuracy, frequency and detail for the provided information, especially when combined with other forecast systems;
- The availability of all information in one single data center;
- The possibility to serve a large number of professional users using the same technological platform.
3. Earth-Space Radio Links in the Presence of Rain
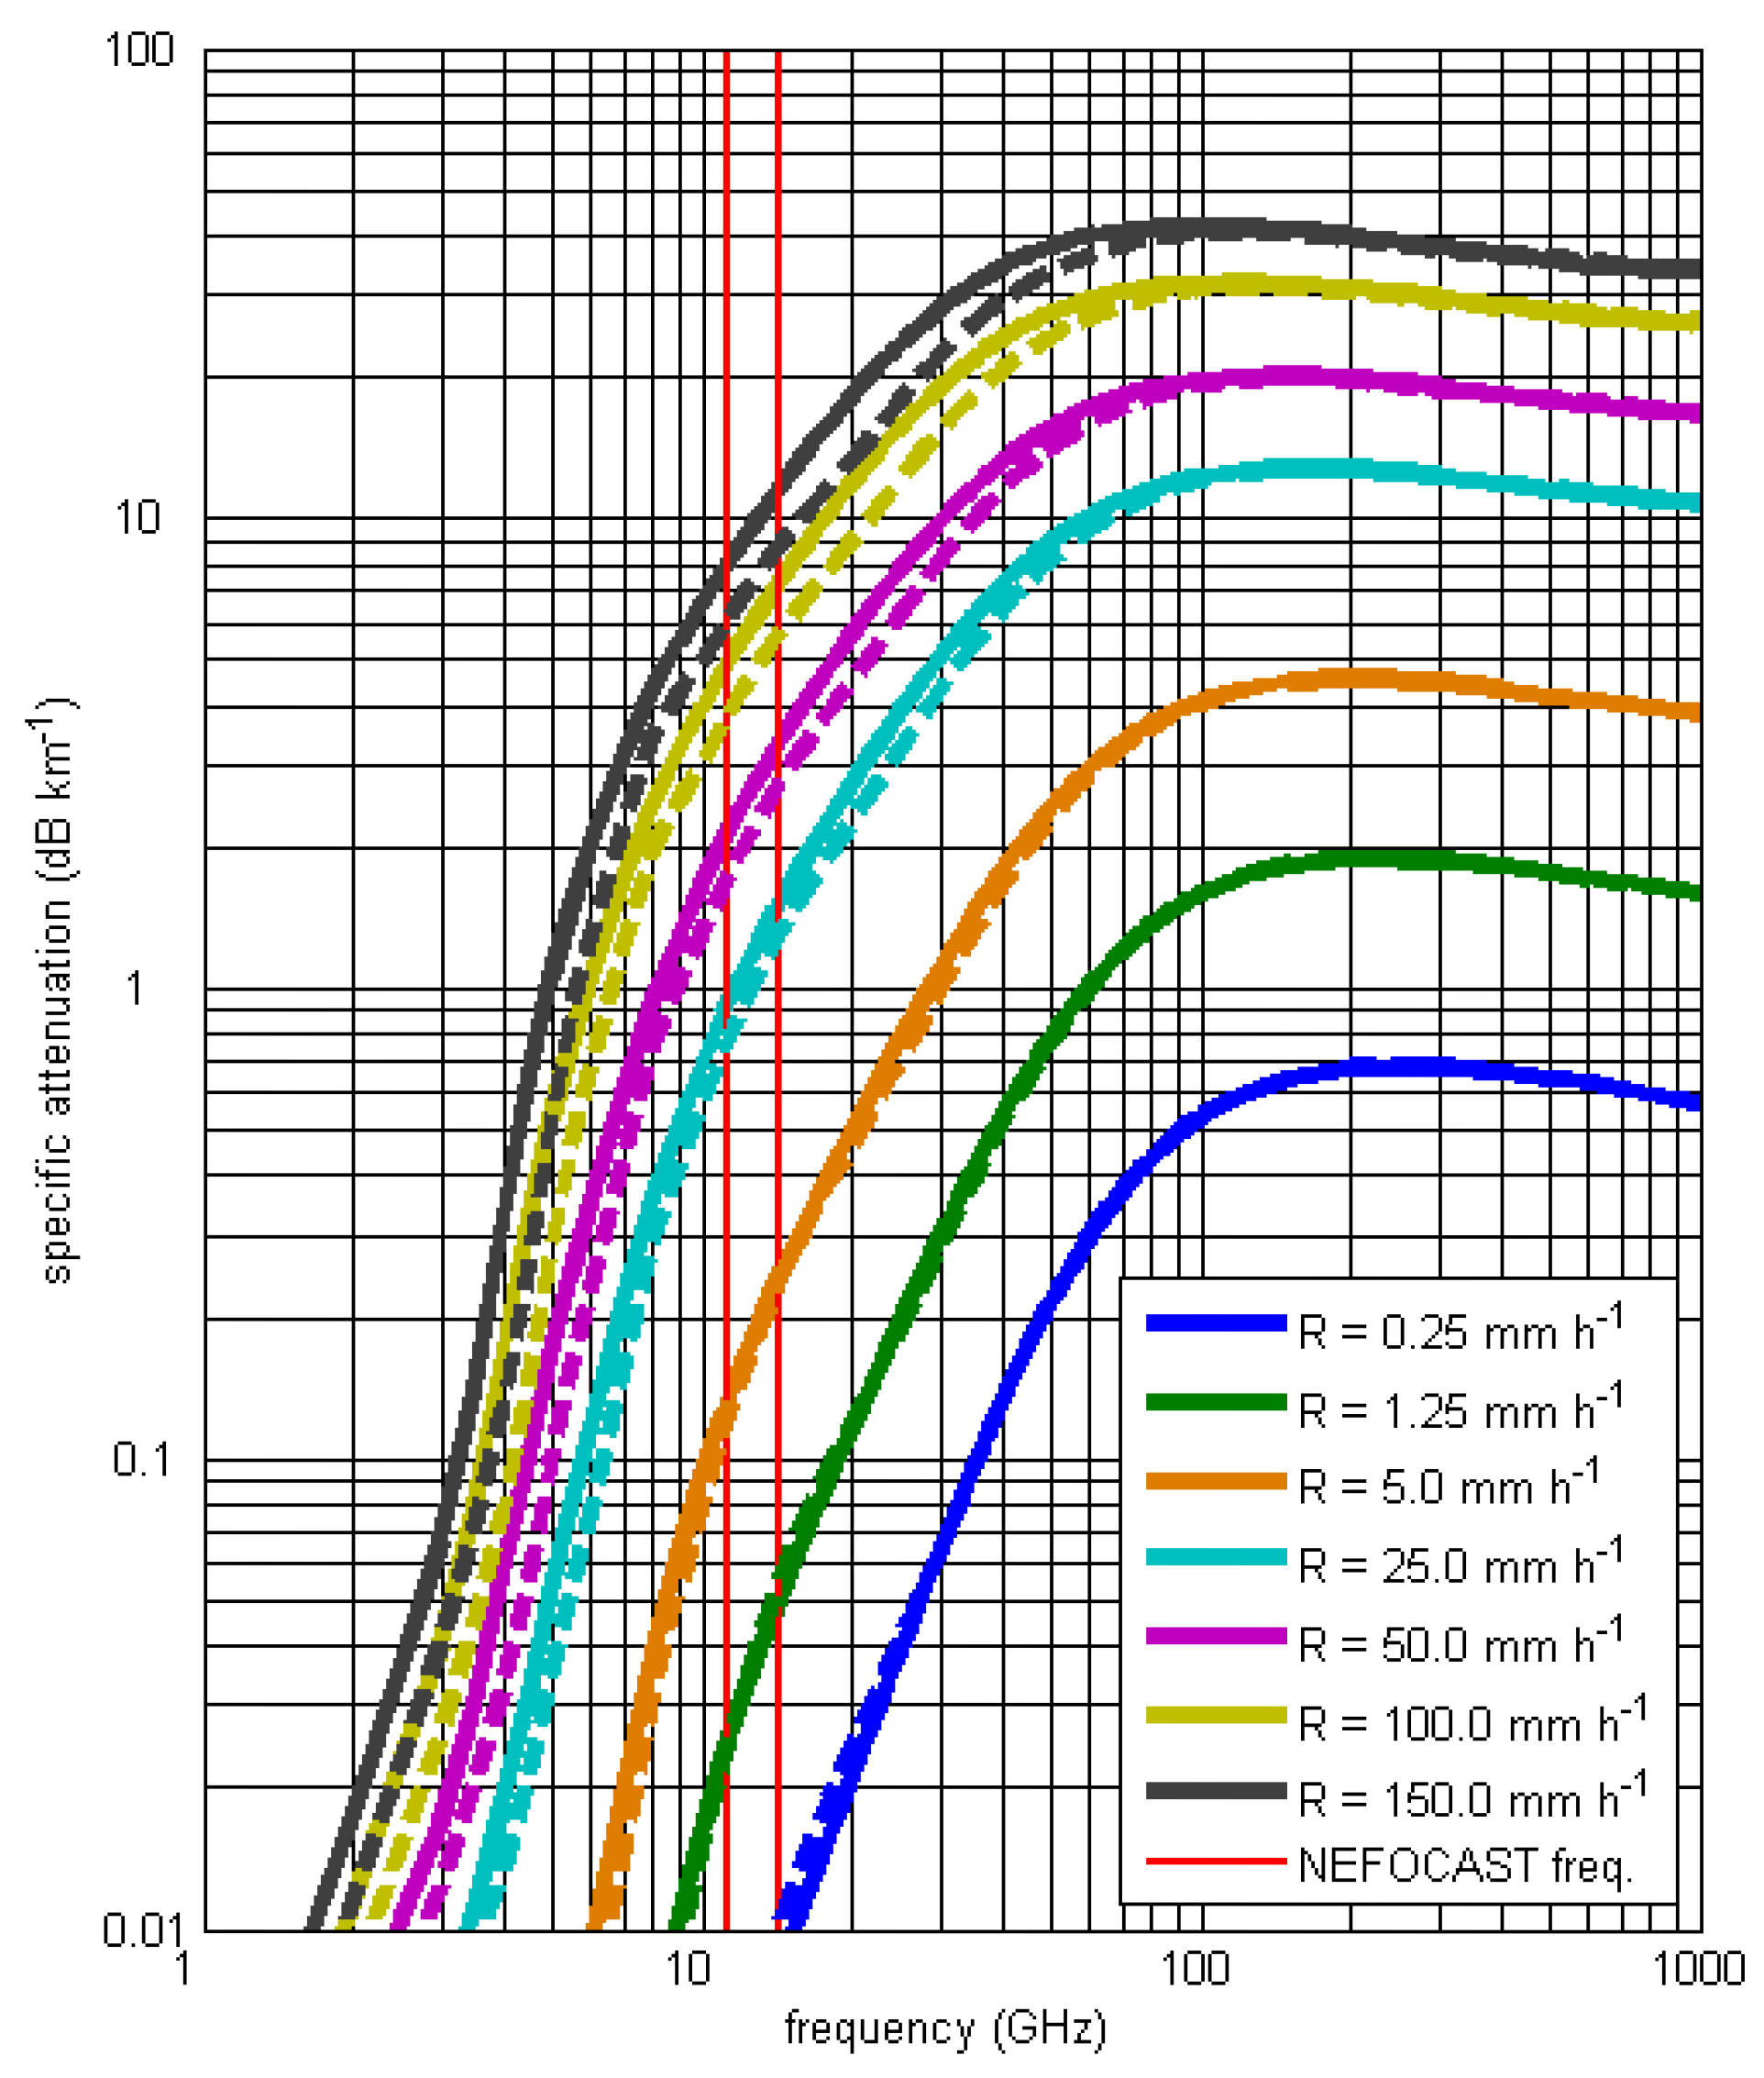
3.1. Effects of Rain on Earth-Space Radio Links
3.2. Conventional Statistical Models for Attenuation Prediction in Earth-Space Radio Links in the Presence of Rain
4. Direct Method for the Estimation of the Rain Rate
4.1. Limitations of the Statistical Models
4.2. Direct Model Concept
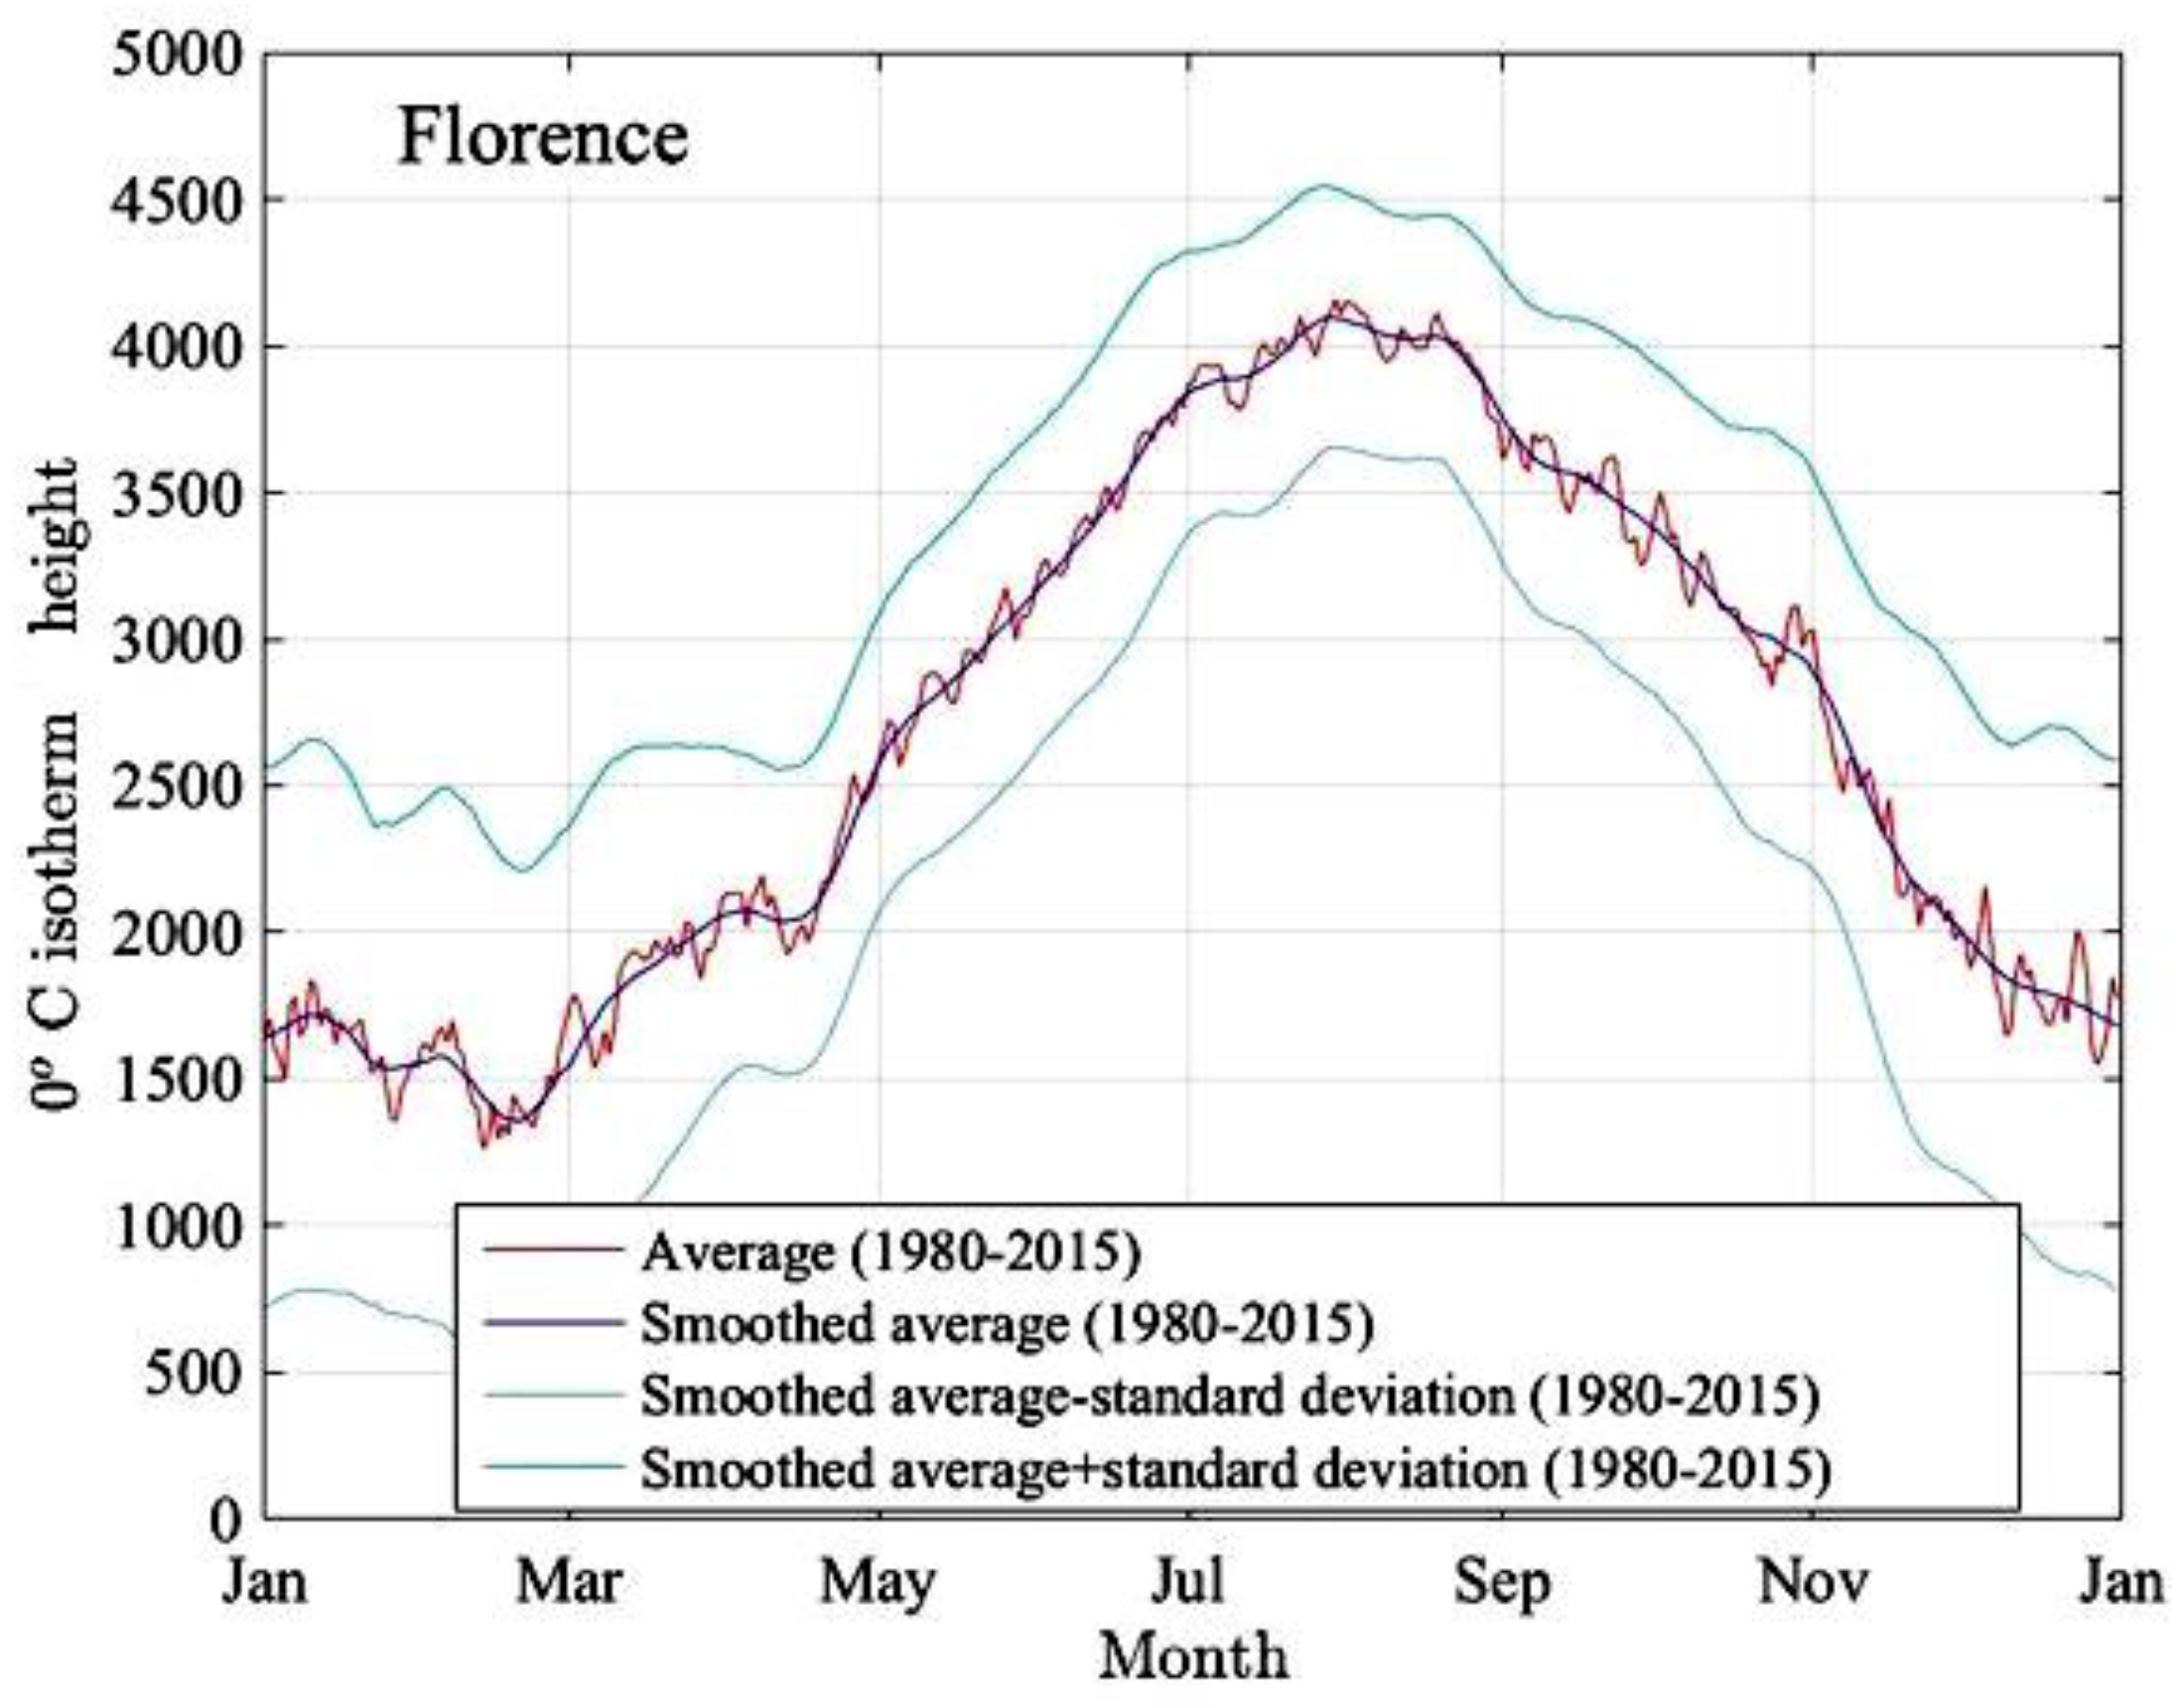
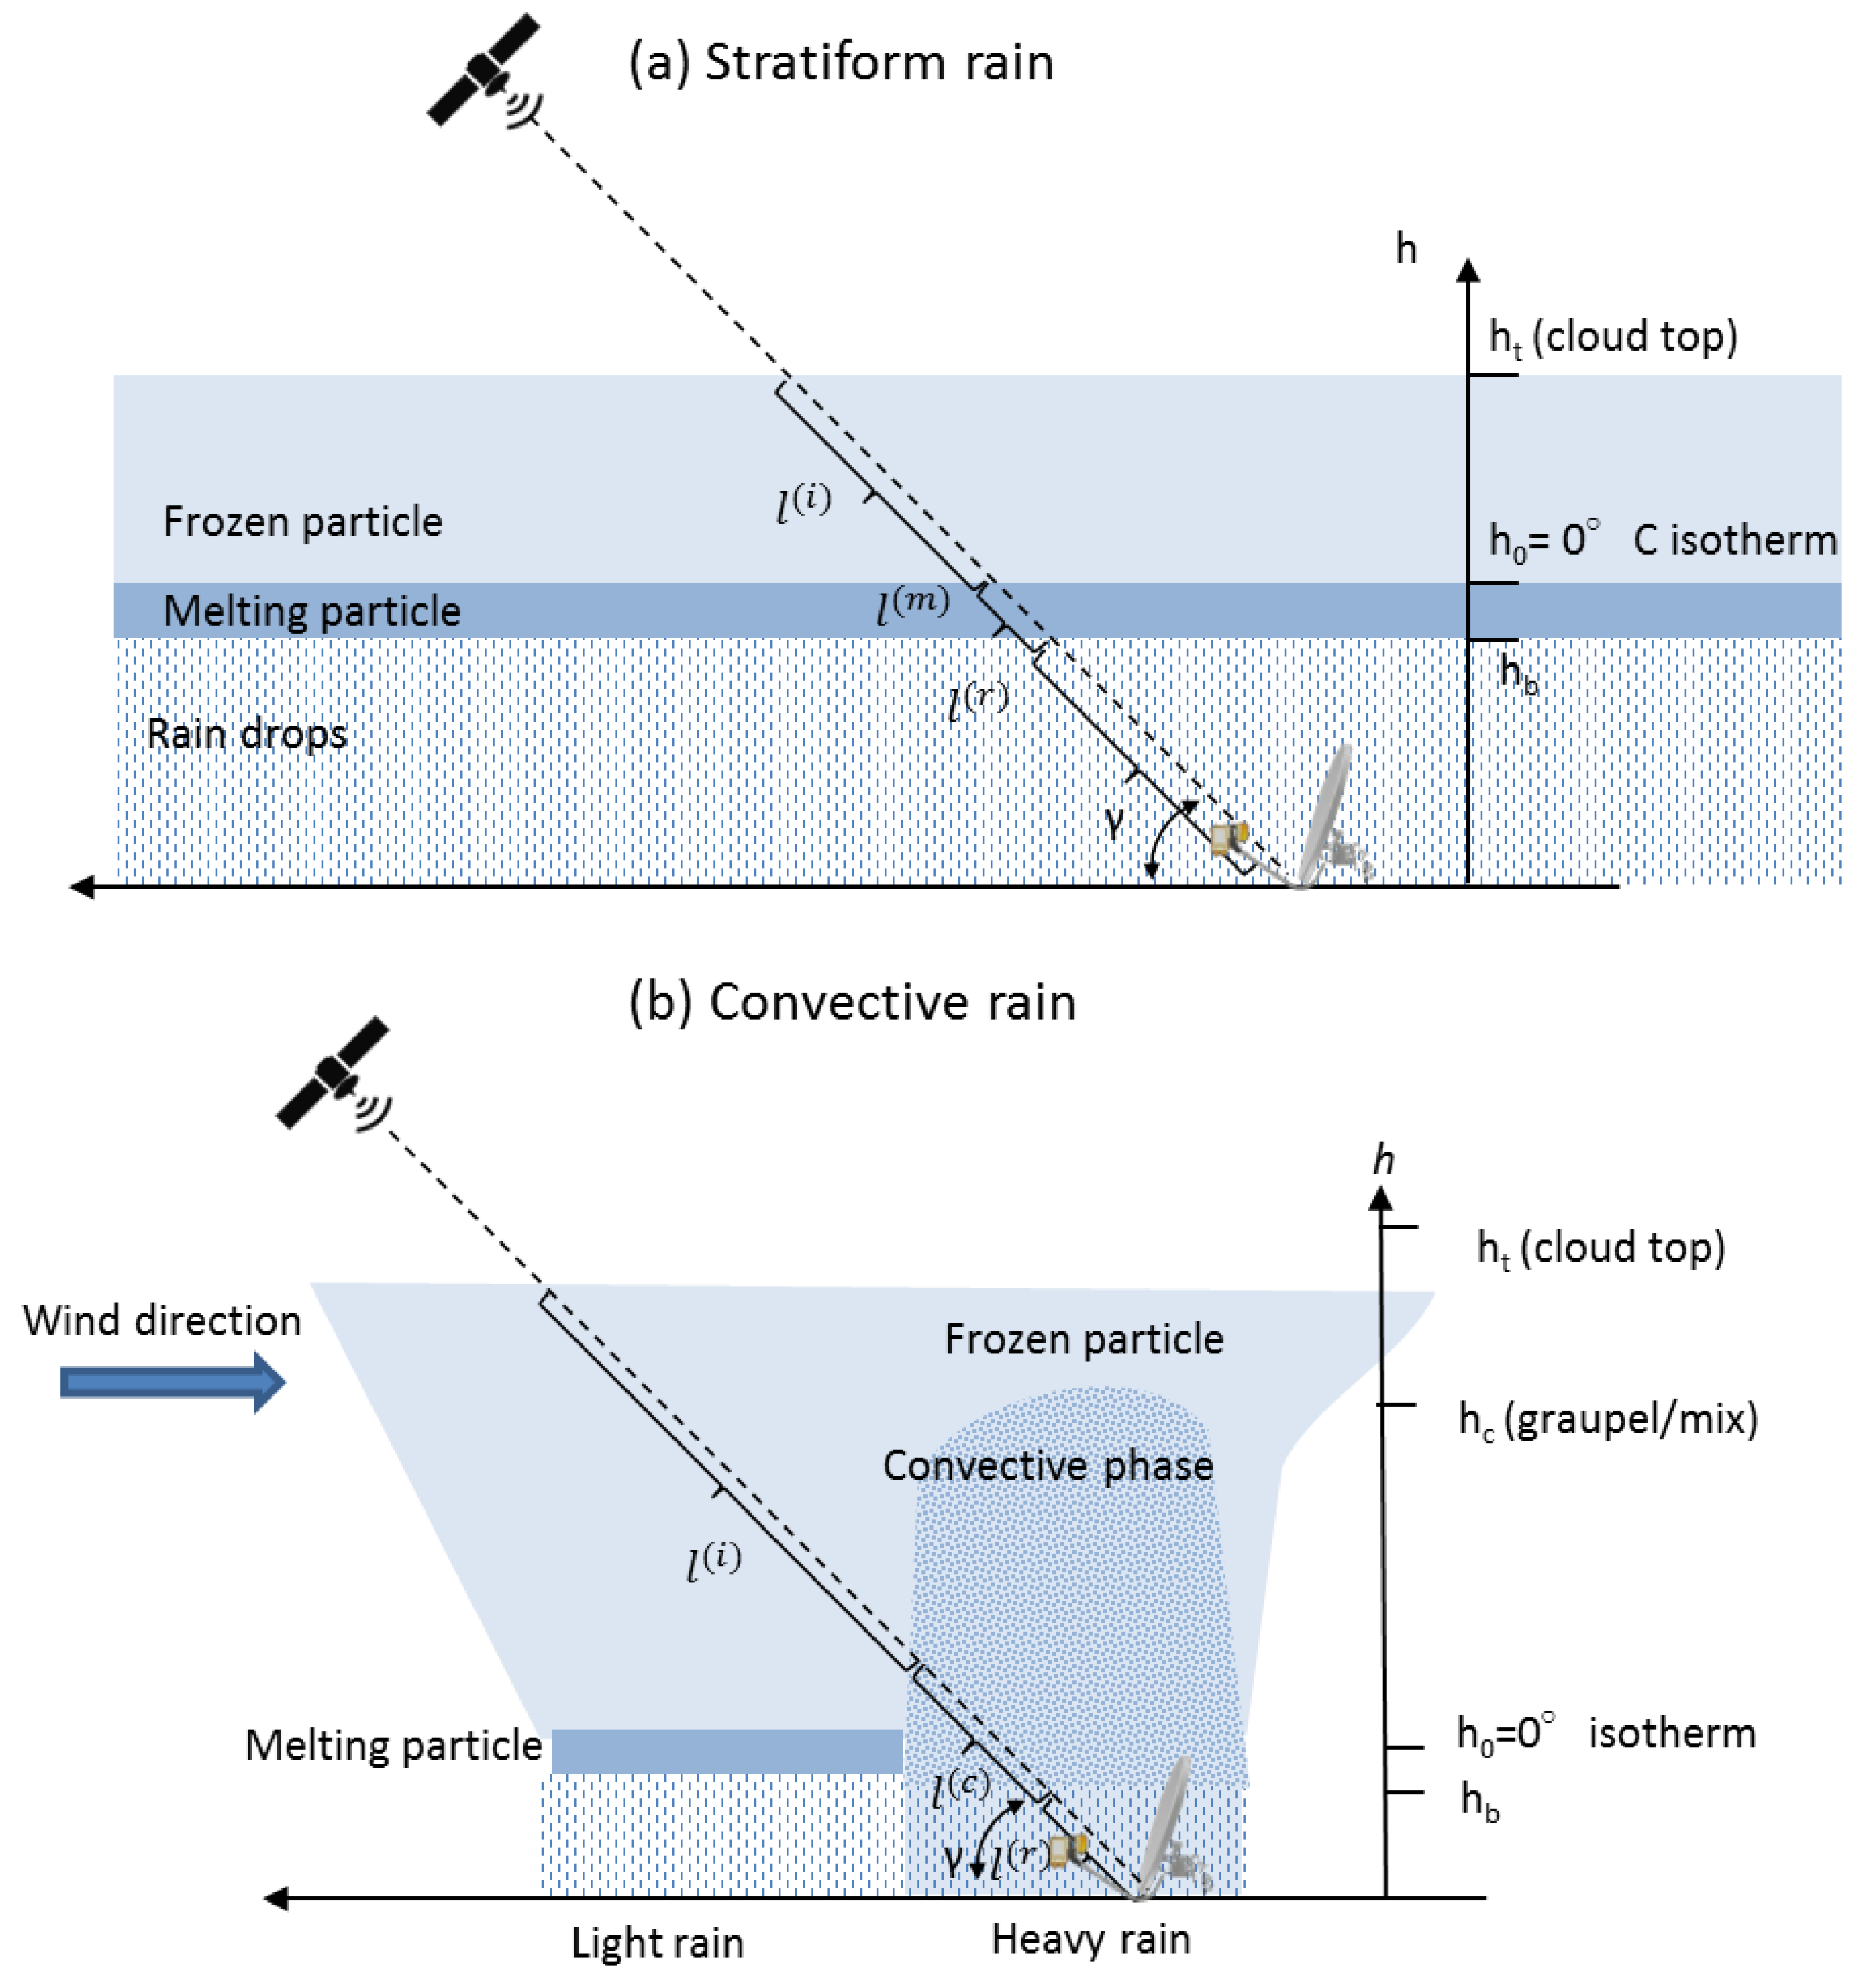
4.3. Rain Height
4.4. Experimental Derivation of the Analytical Regression Formula
4.5. Implementation of the Direct Method
4.6. Rain Rate Estimation Algorithm
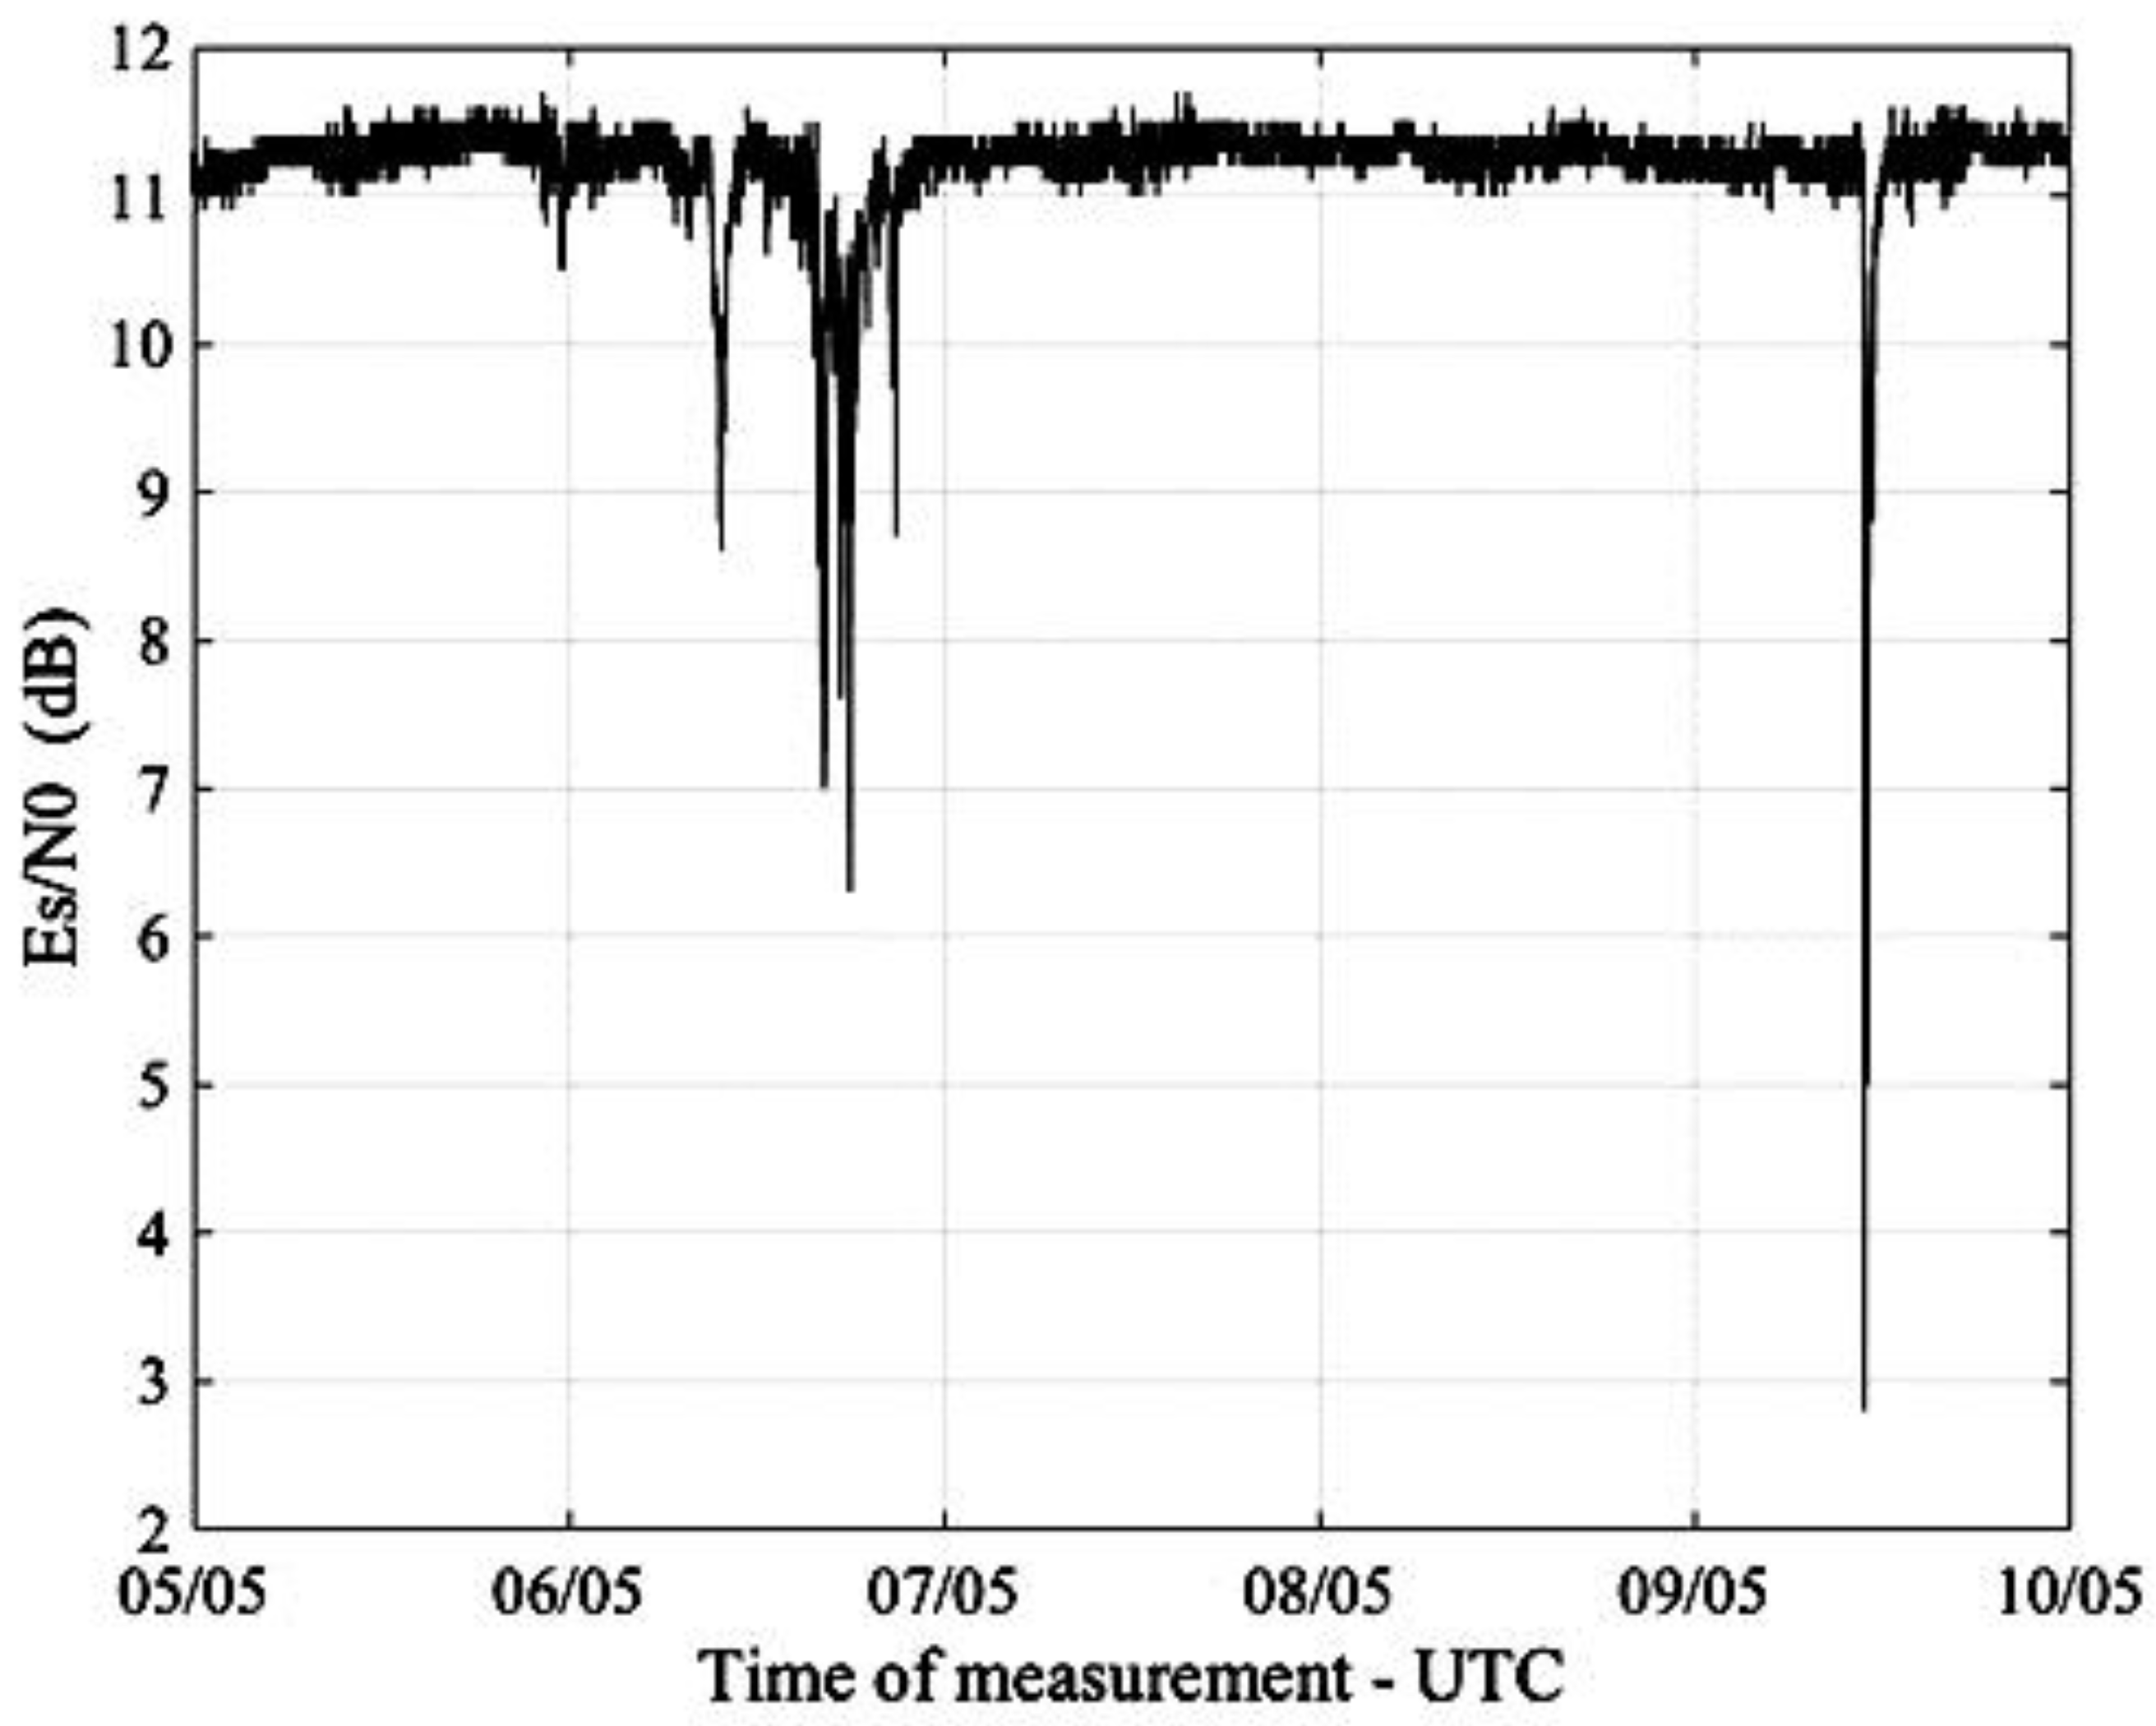
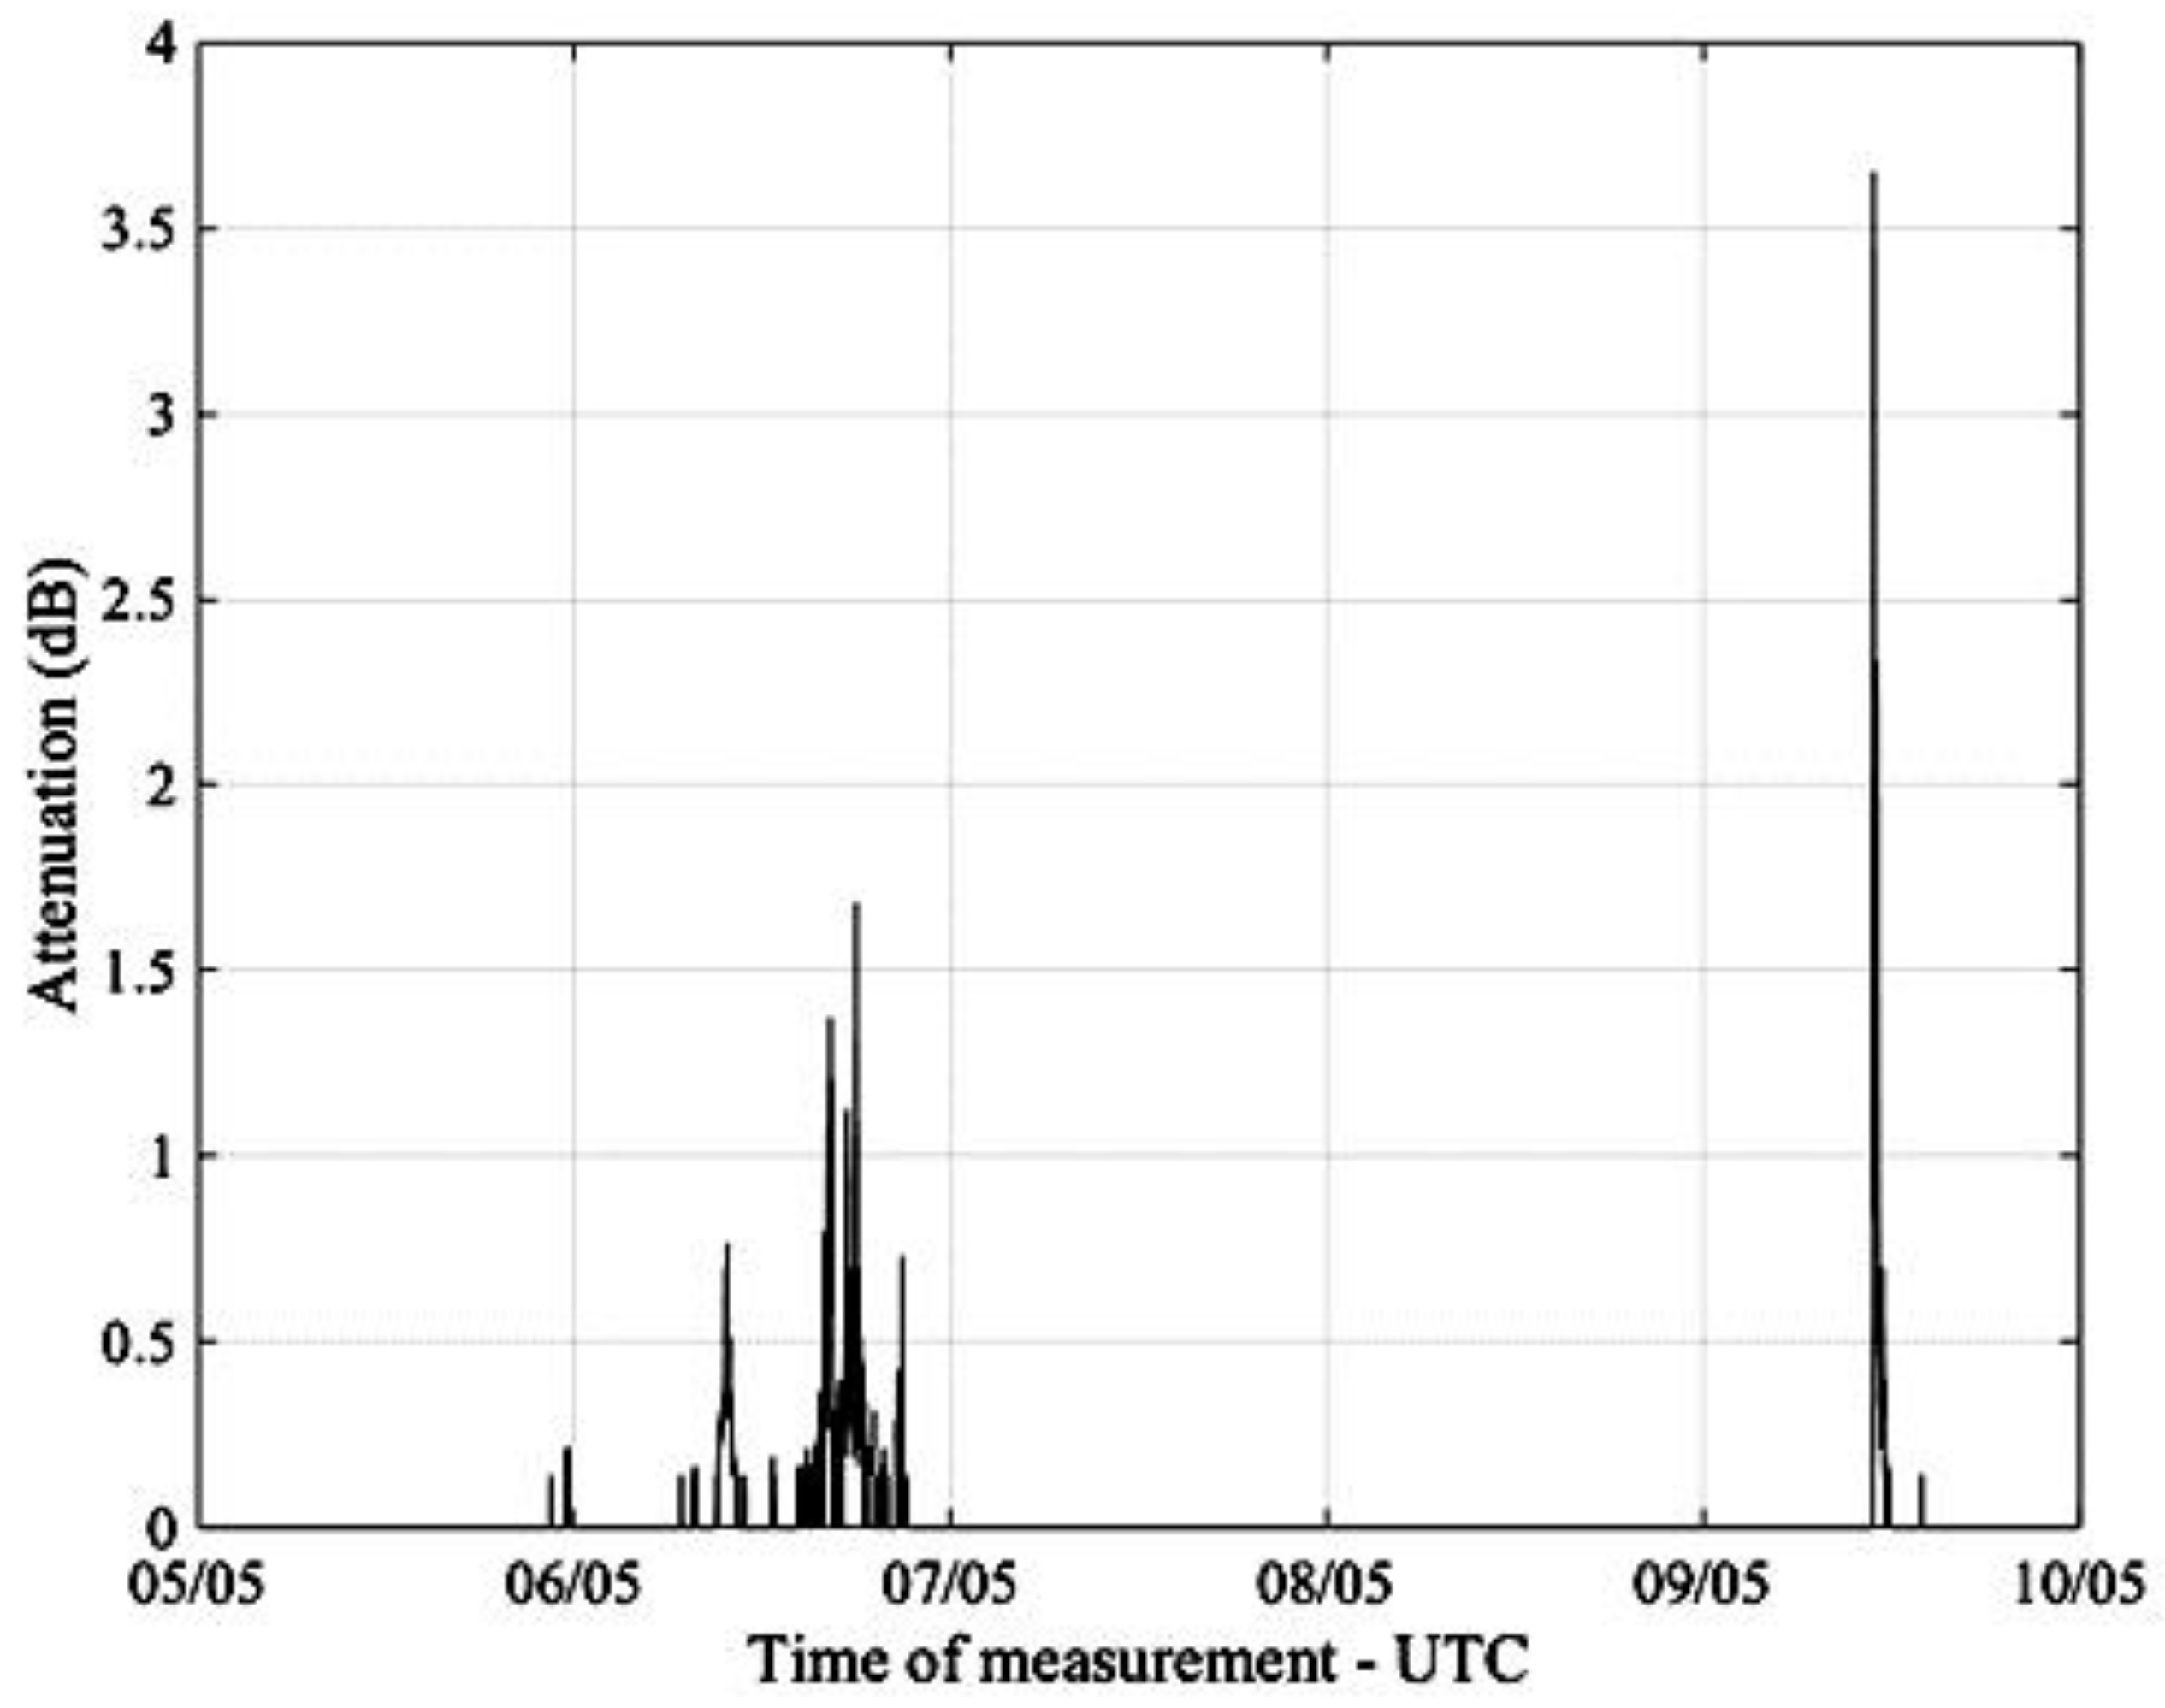
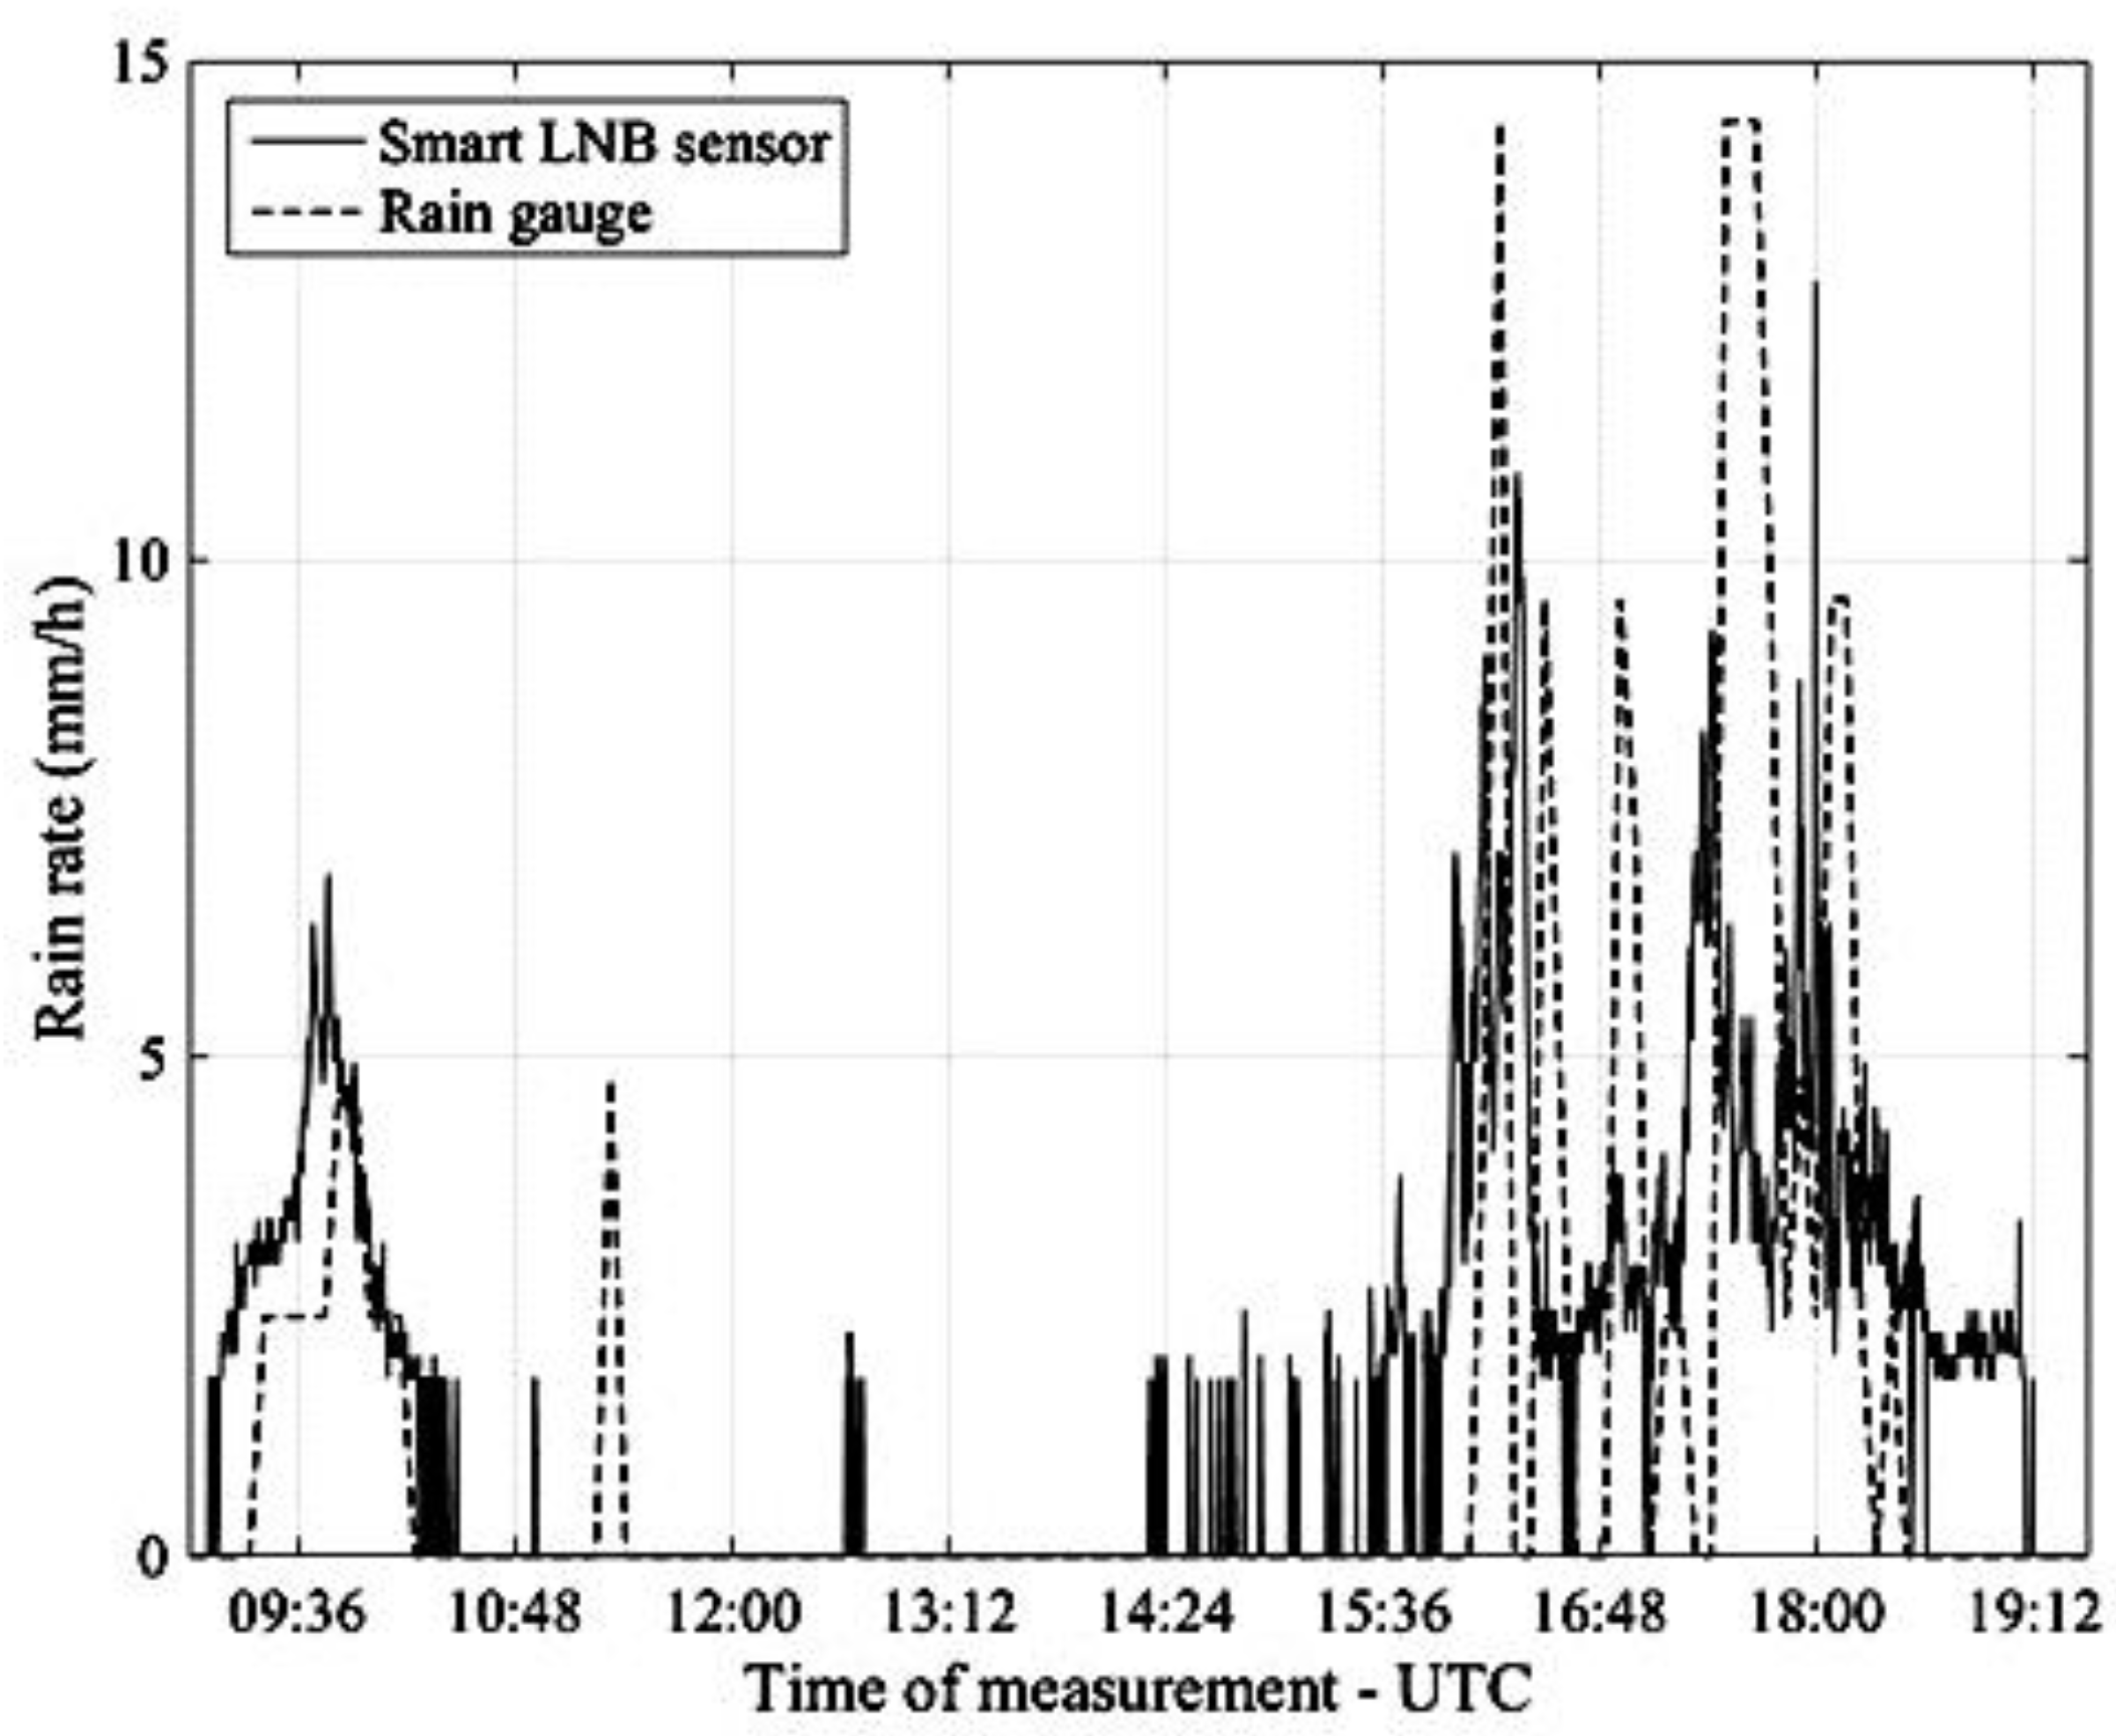
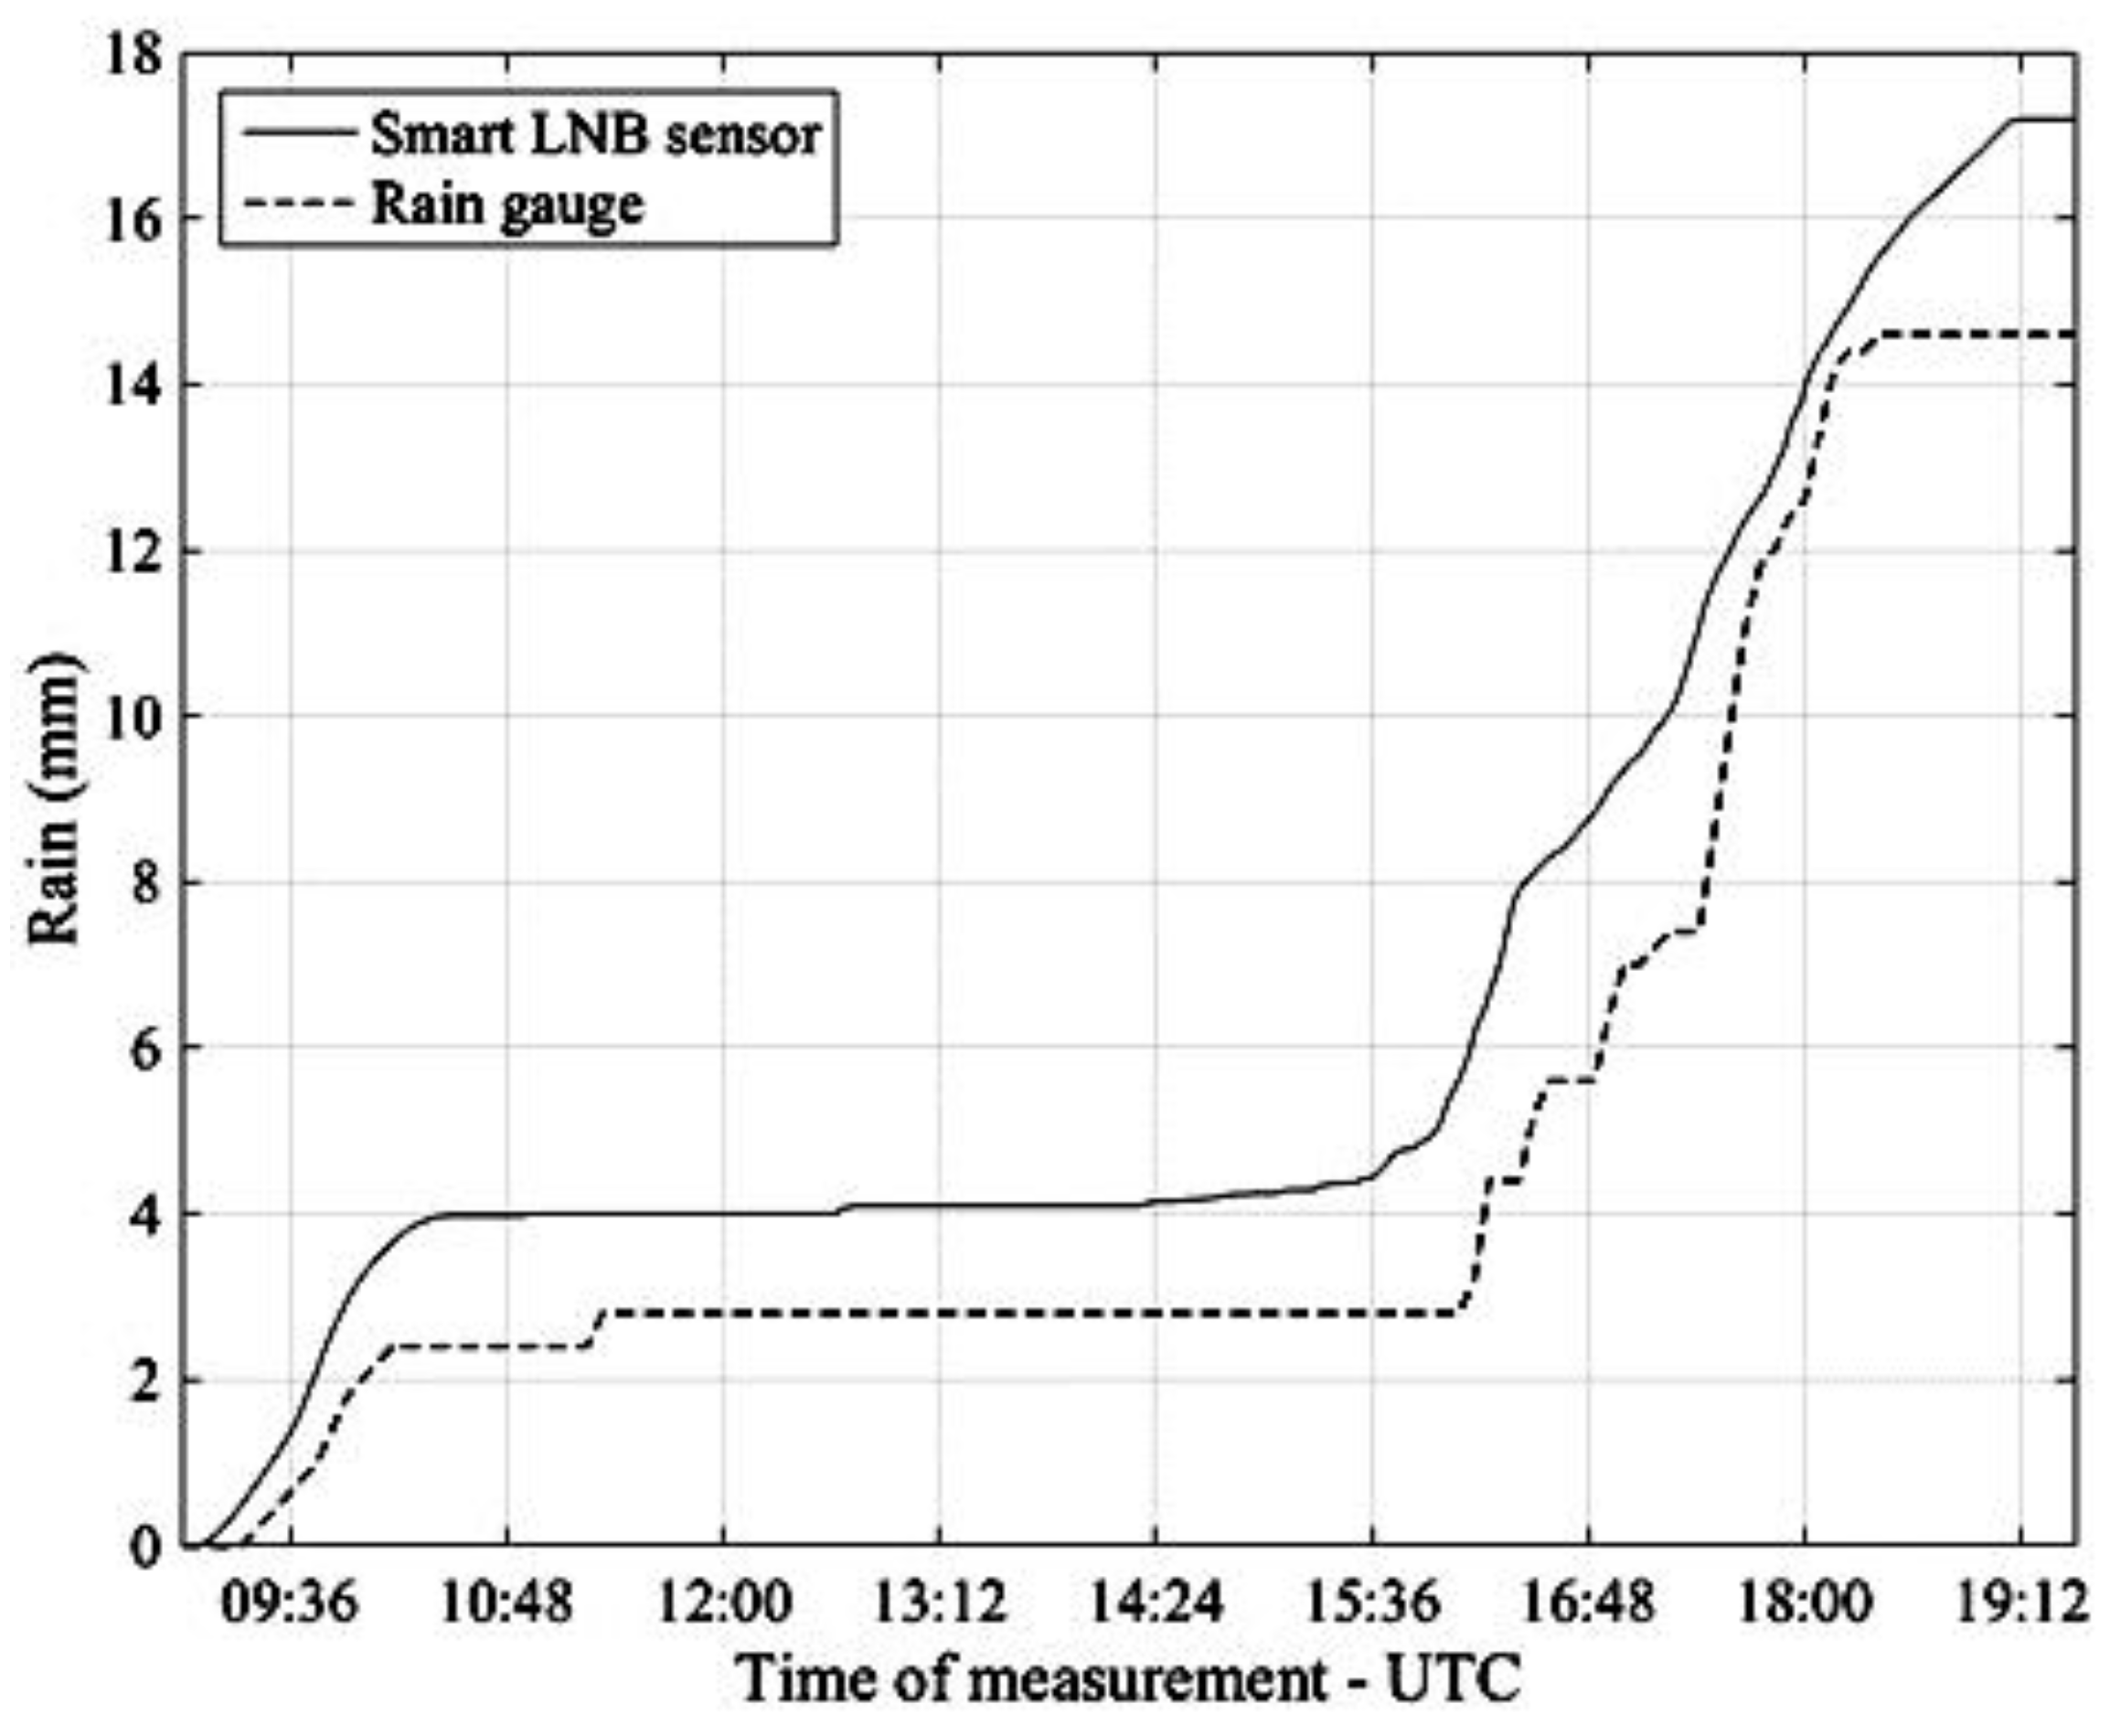
5. Experimental Results
6. Conclusions and Future Work
Acknowledgments
Author Contributions
Conflicts of Interest
References
- Testik, F.Y.; Gebremichael, M. Rainfall: State of the Science; John Wiley & Sons, Inc.: Hoboken, NJ, USA, 2013. [Google Scholar] [CrossRef]
- Antonini, A.; Melani, S.; Ortolani, A.; Pieri, M.; Gozzini, B. Qualitative weather radar mosaic in a multi-sensor rainfall monitoring approach. J. Appl. Remote Sens. 2012, 6, 063572. [Google Scholar] [CrossRef]
- Habib, E.; Lee, G.; Kim, D.; Ciach, G.J. Ground based direct measurement. In Rainfall: State of the Science; Testik, F.Y., Mekonnen, G., Eds.; American Geophysical Union: Washington, DC, USA, 2013; pp. 61–77. [Google Scholar] [CrossRef]
- Kathiravelu, G.; Lucke, T.; Nichols, P. Rain Drop Measurement Techniques: A Review. Water 2016, 8, 29. [Google Scholar] [CrossRef]
- Hodgkinson, R.A.; Pepper, T.J.; Wilson, D.W. Evaluation of Tipping Bucket Rain Gauge Performance and Data Quality; Science Report: W6-084/SR; Environment Agency: Bristol, UK, 2004. [Google Scholar]
- Derived Variables in Davis Weather Products. Davis Application Note 28, Version: A. 11 May 2006. Available online: http://www.davisnet.com/product_documents/weather/app_notes/AN_28-derived-weather-variables.pdf (accessed on 31 May 2017).
- Lelièvre, C. Correction of Tipping-Bucket Data. 24 January 2014. Available online: https://observator.com/en/meteo-hydro/news/tipping-bucket-rain-gauges (accessed on 31 May 2017).
- Habib, E.; Krajewski, W.F.; Kruger, A. Sampling errors of tipping-bucket rain gauge measurements. J. Hydrol. Eng. 2001, 6, 159–166. [Google Scholar] [CrossRef]
- Lanza, L.G.; Stagi, L. On the Quality of Tipping-Bucket Rain Intensity Measurements. Available online: https://www.wmo.int/pages/prog/www/IMOP/publications/IOM-94-TECO2006/P3(15)_Lanza_Italy.pdf (accessed on 31 May 2017).
- Wang, J.; Fisher, B.L.; Wolff, D.B. Estimating Rain Rates from Tipping-Bucket Rain Gauge Measurements. J. Atoms. Ocean. Technol. 2008, 25, 43–56. [Google Scholar] [CrossRef]
- Vuerich, E.; Monesi, C.; Lanza, L.G.; Stagi, L.; Lanzinger, E. WMO field intercomparison of rainfall intensity gauges. World Meteorol. Organ. Instrum. Obs. Method 2009, 99, 286. [Google Scholar]
- Adirosi, E.; Baldini, L.; Roberto, N.; Vulpiani, G.; Russo, F. Using disdrometer measured raindrop size distributions to establish weather radar algorithms. AIP Conf. Proc. 2015, 1648, 190007. [Google Scholar] [CrossRef]
- Seliga, T.A.; Bringi, V.N. Potential use of radar differential reflectivity measurements at orthogonal polarizations for measuring precipitation. J. Appl. Meteorl. 1976, 15, 69–76. [Google Scholar] [CrossRef]
- Bringi, V.N.; Chandrasekar, V. Polarimetric Doppler Weather Radar: Principles and Applications; Cambridge University Press: Cambridge, UK, 2001. [Google Scholar]
- Gorgucci, E.; Baldini, L. Influence of beam broadening on the accuracy of radar polarimetric rainfall estimation. J. Hydrometeorol. 2015, 16, 1356–1371. [Google Scholar] [CrossRef]
- Montopoli, M.; Roberto, N.; Adirosi, E.; Gorgucci, E.; Baldini, L. Investigation of Weather Radar Quantitative Precipitation Estimation Methodologies in Complex Orography. Atmosphere 2017, 8, 34. [Google Scholar] [CrossRef]
- Chwala, C.; Gmeiner, A.; Qiu, W.; Hipp, S.; Nienaber, D.; Siart, U.; Eibert, T.; Pohl, M.; Seltmann, J.; Fritz, J.; et al. Precipitation observation using microwave backhaul links in the alpine and pre-alpine region of Southern Germany. Hydrol. Earth Syst. Sci. 2012, 16, 2647–2661. [Google Scholar] [CrossRef]
- Arslan, C.H.; Aydin, K.; Urbina, J.; Dyrud, L.P. Rainfall Measurements Using Satellite Downlink Attenuation. In Proceedings of the IEEE International Geoscience and Remote Sensing Symposium (IGARSS), Quebec City, QC, Canada, 13–18 July 2014; pp. 4111–4114. [Google Scholar]
- Mugnai, C.; Sermi, F.; Cuccoli, F.; Facheris, L. Rainfall Estimation with a Commercial Tool for Satellite Internet in Ka Band: Model Evolution and Results. In Proceedings of the IEEE International Geoscience and Remote Sensing Symposium (IGARSS), Milan, Italy, 26–31 July 2015; pp. 890–893. [Google Scholar]
- Barthès, F.; Mallet, C. Rainfall measurement from the opportunistic use of earth-space link in the Ku band. Atmos. Meas. Tech. 2013, 6, 2181–2193. [Google Scholar] [CrossRef] [Green Version]
- Mercier, F.; Barthes, F.; Mallet, C. Estimation of finescale rainfall fields using broadcast TV satellite links and a 4DVAR assimilation method. J. Atmos. Ocean. Technol. 2015, 32, 1709–1728. [Google Scholar] [CrossRef]
- The DTH Ecosystem Enters a New Era with Direct-to-Home Connected TV. Available online: http://www.eutelsat.com/en/services/broadcast/direct-to-home/SmartLNB.html (accessed on 20 June 2017).
- ETSI EN 302 307 V1.2.1 (2009–08). Digital Video Broadcasting (DVB); Second Generation Framing Structure, Channel Coding and Modulation Systems for Broadcasting, Interactive Services, News Gathering and Other Broadband Satellite Applications (DVB-S2). Available online: http://www.etsi.org/deliver/etsi_en/302300_302399/302307/01.02.01_60/en_302307v010201p.pdf (accessed on 10 August 2017).
- Arcidiacono, A.; Finocchiaro, D.; Collard, F.; Scalise, S.; Lazaro Blasco, F.; De Gaudenzi, R.; Cioni, S.; Alagha, N.; Andrenacci, M. From S-band Mobile Interactive Multimedia to Fixed Satellite Interactive Multimedia: Making Satellite Interactivity Affordable at Ku-Band and Ka-Band. Int. J. Satell. Commun. Netw. 2016, 34, 575–601. [Google Scholar] [CrossRef]
- Karmakar, P.K. Microwave Propagation and Remote Sensing: Atmospheric Influences with Models and Applications; CRC Press: Boca Raton, FL, USA, 2011. [Google Scholar]
- Oguchi, T. Electromagnetic wave propagation and scattering in rain and other hydrometeors. Proc. IEEE 1983, 71, 1029–1078. [Google Scholar] [CrossRef]
- Barber, P.-W.; Yeh, C. Scattering of electromagnetic waves by arbitrarily shaped dielectric bodies. Appl. Opt. 1975, 14, 2864–2872. [Google Scholar] [CrossRef]
- Adirosi, E.; Baldini, L.; Lombardo, F.; Russo, F.; Napolitano, F.; Volpi, E.; Tokay, A. Comparison of different fittings of drop spectra for rainfall retrievals. Adv. Water Resour. 2015, 83, 55–67. [Google Scholar] [CrossRef]
- Recommendation ITU-R P.838-3; Specific Attenuation Model for Rain for Use in Prediction Methods. 2010. Available online: https://www.itu.int/dms_pubrec/itu-r/rec/p/R-REC-P.838-3-200503-I!!PDF-E.pdf (accessed on 11 August 2017).
- Baldini, L.; Gorgucci, E. Identification of the Melting Layer through Dual-Polarization Radar Measurements at Vertical Incidence. J. Atmos. Ocean. Technol. 2006, 23, 829–839. [Google Scholar] [CrossRef]
- Myers, W. Comparison of Propagation Models; IEEE P802.16 Broadband Wireless Access Working Group: Richardson, TX, USA, 1999. [Google Scholar]
- Recommendation ITU-R P.618-11. Propagation Data and Prediction Methods Required for the Design of Earth-Space Telecommunication Systems, 2013. Available online: https://www.itu.int/dms_pubrec/itu-r/rec/p/R-REC-P.618-11-201309-S!!PDF-E.pdf (accessed on 10 August 2017).
- Crane, R.K. Electromagnetic Wave Propagation through Rain; John Wiley & Sons, Inc.: Hoboken, NJ, USA, 1996. [Google Scholar]
- Stutzman, W.L.; Yon, K.M. 1986: A simple rain attenuation model for earth-space radio links operating at 10–35 GHz. Radio Sci. 1986, 21, 65–72. [Google Scholar] [CrossRef]
- Matricciani, E. Rain attenuation predicted with a two-layer rain model. Radio Sci. 1991, 2, 715–727. [Google Scholar] [CrossRef]
- Capsoni, C.; Luini, L.; Paraboni, A.; Riva, C.; Martellucci, A. A new prediction model of rain attenuation that separately accounts for stratiform and convective rain. IEEE Trans. Antennas Propag. 2009, 57, 196–204. [Google Scholar] [CrossRef]
- Recommendation ITU-R PN.837-6; Characteristics of Precipitation for Propagation Modelling, 2012. Available online: https://www.itu.int/rec/R-REC-P.837-6-201202-S/en (accessed on 10 August 2017).
- Giangrande, S.E.; Krause, J.M.; Ryzhkov, A.V. Automatic Designation of the Melting Layer with a Polarimetric Prototype of the WSR-88D Radar. J. Appl. Meteorl. Climatol. 2008, 47, 1354–1364. [Google Scholar] [CrossRef]
- Ojo, J.S. Rain Height Statistics Based on 0 °C Isotherm Height Using TRMM Precipitation Data for Earth-Space Satellite Links in Nigeria. ISRN Atmos. Sci. 2014, 2014. [Google Scholar] [CrossRef]
- Mondal, N.C.; Sarkar, S.K. Rain height in relation to 0 °C isotherm height for satellite communication over the Indian Subcontinent. Theor. Appl. Climatol. 2003, 76, 89–104. [Google Scholar] [CrossRef]
- Mandeep, J.S. 0 °C isotherm height for satellite communication in Malaysia. Adv. Space Res. 2009, 43, 984–989. [Google Scholar] [CrossRef]
- Badron, K.; Ismail, A.F.; Din, J.; Tharek, A.R. Rain induced attenuation studies for V-band satellite communication in tropical region. J. Atmos. Sol. Terr. Phys. 2011, 73, 601–610. [Google Scholar] [CrossRef] [Green Version]
- Recommendation ITU-R P.839-4; Rain Height Model for Prediction Methods, 2013. Available online: https://www.itu.int/dms_pubrec/itu-r/rec/p/R-REC-P.839-4-201309-I!!PDF-E.pdf (accessed on 10 August 2017).
- Awaka, J.; Iguchi, T.; Okamoto, K. TRMM PR Standard Algorithm and its Performance on Bright Band Detection. J. Meteorol. Soc. Jpn. 2009, 87, 31–52. [Google Scholar] [CrossRef]
- Thurai, M.; Iguchi, T. Rain Height Information from TRMM Precipitation Radar. Electron. Lett. 2000, 36, 1059–1061. [Google Scholar] [CrossRef]
- Azlan, M.A.N.; Din, J.; Lam, H.Y. Rain Height Information from TRMM Precipitation Radar for Satellite Communication in Malaysia. In Proceedings of the IEEE International Conference on Space Science and Communication (IconSpace), Penang, Malaysia, 12–13 July 2011. [Google Scholar]
- Michalakes, J.; Dudahia, J.; Gill, D.; Henderson, T.; Klemp, J.; Skamarock, W.; Wang, W. The Weather Research and Forecast Model: Software Architecture and Performance. In Proceedings of the 11th ECMWF Workshop on the Use of High Performance Computing in Meteorology, Singapore, 25–29 October 2005; pp. 156–168. [Google Scholar]
- Rienecker, M.M.; Suarez, M.J.; Gelaro, R.; Todling, R.; Bacmeister, J.; Liu, E.; Bosilovich, M.G.; Schubert, S.D.; Takacs, L.; Kim, G.K.; et al. MERRA: NASA’s Modern-Era Retrospective Analysis for Research and Applications. J. Clim. 2011, 24, 3624–3648. [Google Scholar] [CrossRef]
- Peel, M.C.; Finlayson, B.L.; McMahon, T.A. Updated world map of the Koppen-Geiger climate classification. Hydrol. Earth Syst. Sci. 2007, 11, 1633–1644. [Google Scholar] [CrossRef]
- Rubel, F.; Kottek, M. Observed and projected climate shifts 1901–2100 depicted by world maps of the Koppen-Geiger climate classification. Meteorol. Z. 2010, 19, 135–141. [Google Scholar] [CrossRef]
- Atlas, D.; Srivastava, R.C.; Sekhon, R.S. Doppler radar characteristics of precipitation at vertical incidence. Rev. Geophys. 1973, 11, 1–35. [Google Scholar] [CrossRef]
- Beard, K.V.; Chuang, C. A new model for the equilibrium shape of raindrops. J. Atmos. Sci. 1987, 44, 1509–1524. [Google Scholar] [CrossRef]
- Freeman, R.L. Radio System Design for Telecommuncations, 3rd ed.; John Wiley & Sons, Inc.: Hoboken, NJ, USA, 2006. [Google Scholar]
- Maral, G.; Bousquet, M.; Sun, Z. Satellite Communications Systems: Systems, Techniques, and Technology, 5th ed.; Wiley: Chichester, UK; New York, NY, USA, 2009; ISBN 978-0-470-71458-4. [Google Scholar]
- Thorn, R.W.; Thirlwell, J.; Emerson, D.J. Slant Path Radiometer Measurements in the Range 11–30 GHz at Martlesham Heath, England. In Proceedings of the 3rd International Conference on Antennas and Propagation, ICAP, London, UK, 12–15 April 1983; pp. 156–161. [Google Scholar]
- Propagation Data and Prediction Methods Required for Earth-Space Telecommunication Systems. In Proceedings of the CCIR Plenary Assembly, Dusseldorf, Germany, 21 May–1 June 1990; pp. 447–505.
- Maral, G.; Bousquet, M. Satellite Communications Systems, 1st ed.; Wiley: Chichester, UK; New York, NY, USA, 1986; ISBN1 10: 0471902209. ISBN2 13: 9780471902201. [Google Scholar]
- Tokay, A.; D’Adderio, L.P.; Wolff, D.B.; Petersen, W.A. A Field Study of Pixel-Scale Variability of Raindrop Size Distribution in the Mid-Atlantic Region. J. Hydrometeorol. 2016, 17, 1855–1868. [Google Scholar] [CrossRef]
- Adirosi, E.; Baldini, L.; Roberto, N.; Gatlin, P.; Tokay, A. Improvement of vertical profiles of raindrop size distribution from micro rain radar using 2D video disdrometer measurements. Atmos. Res. 2016, 169, 404–415. [Google Scholar] [CrossRef]


| Forward Link | Return Link | |
|---|---|---|
| Satellite | EUTELSAT 10A | EUTELSAT 10A |
| Frequency | 11,345.8 MHz | 14,216.6 MHz |
| Polarization | Vertical | Horizontal |
| Physical Layer Protocol | DVB-S2 | F-SIM |
| Link Layer Protocol | IP-MPE | F-SIM |
| EIRP | 48 dBW | - |
| G/T | - | +4 dB/K |
| MODCOD | QPSK 4/5 | - |
| Spreading Factor | - | 16, 32, 64, 128, 256 |
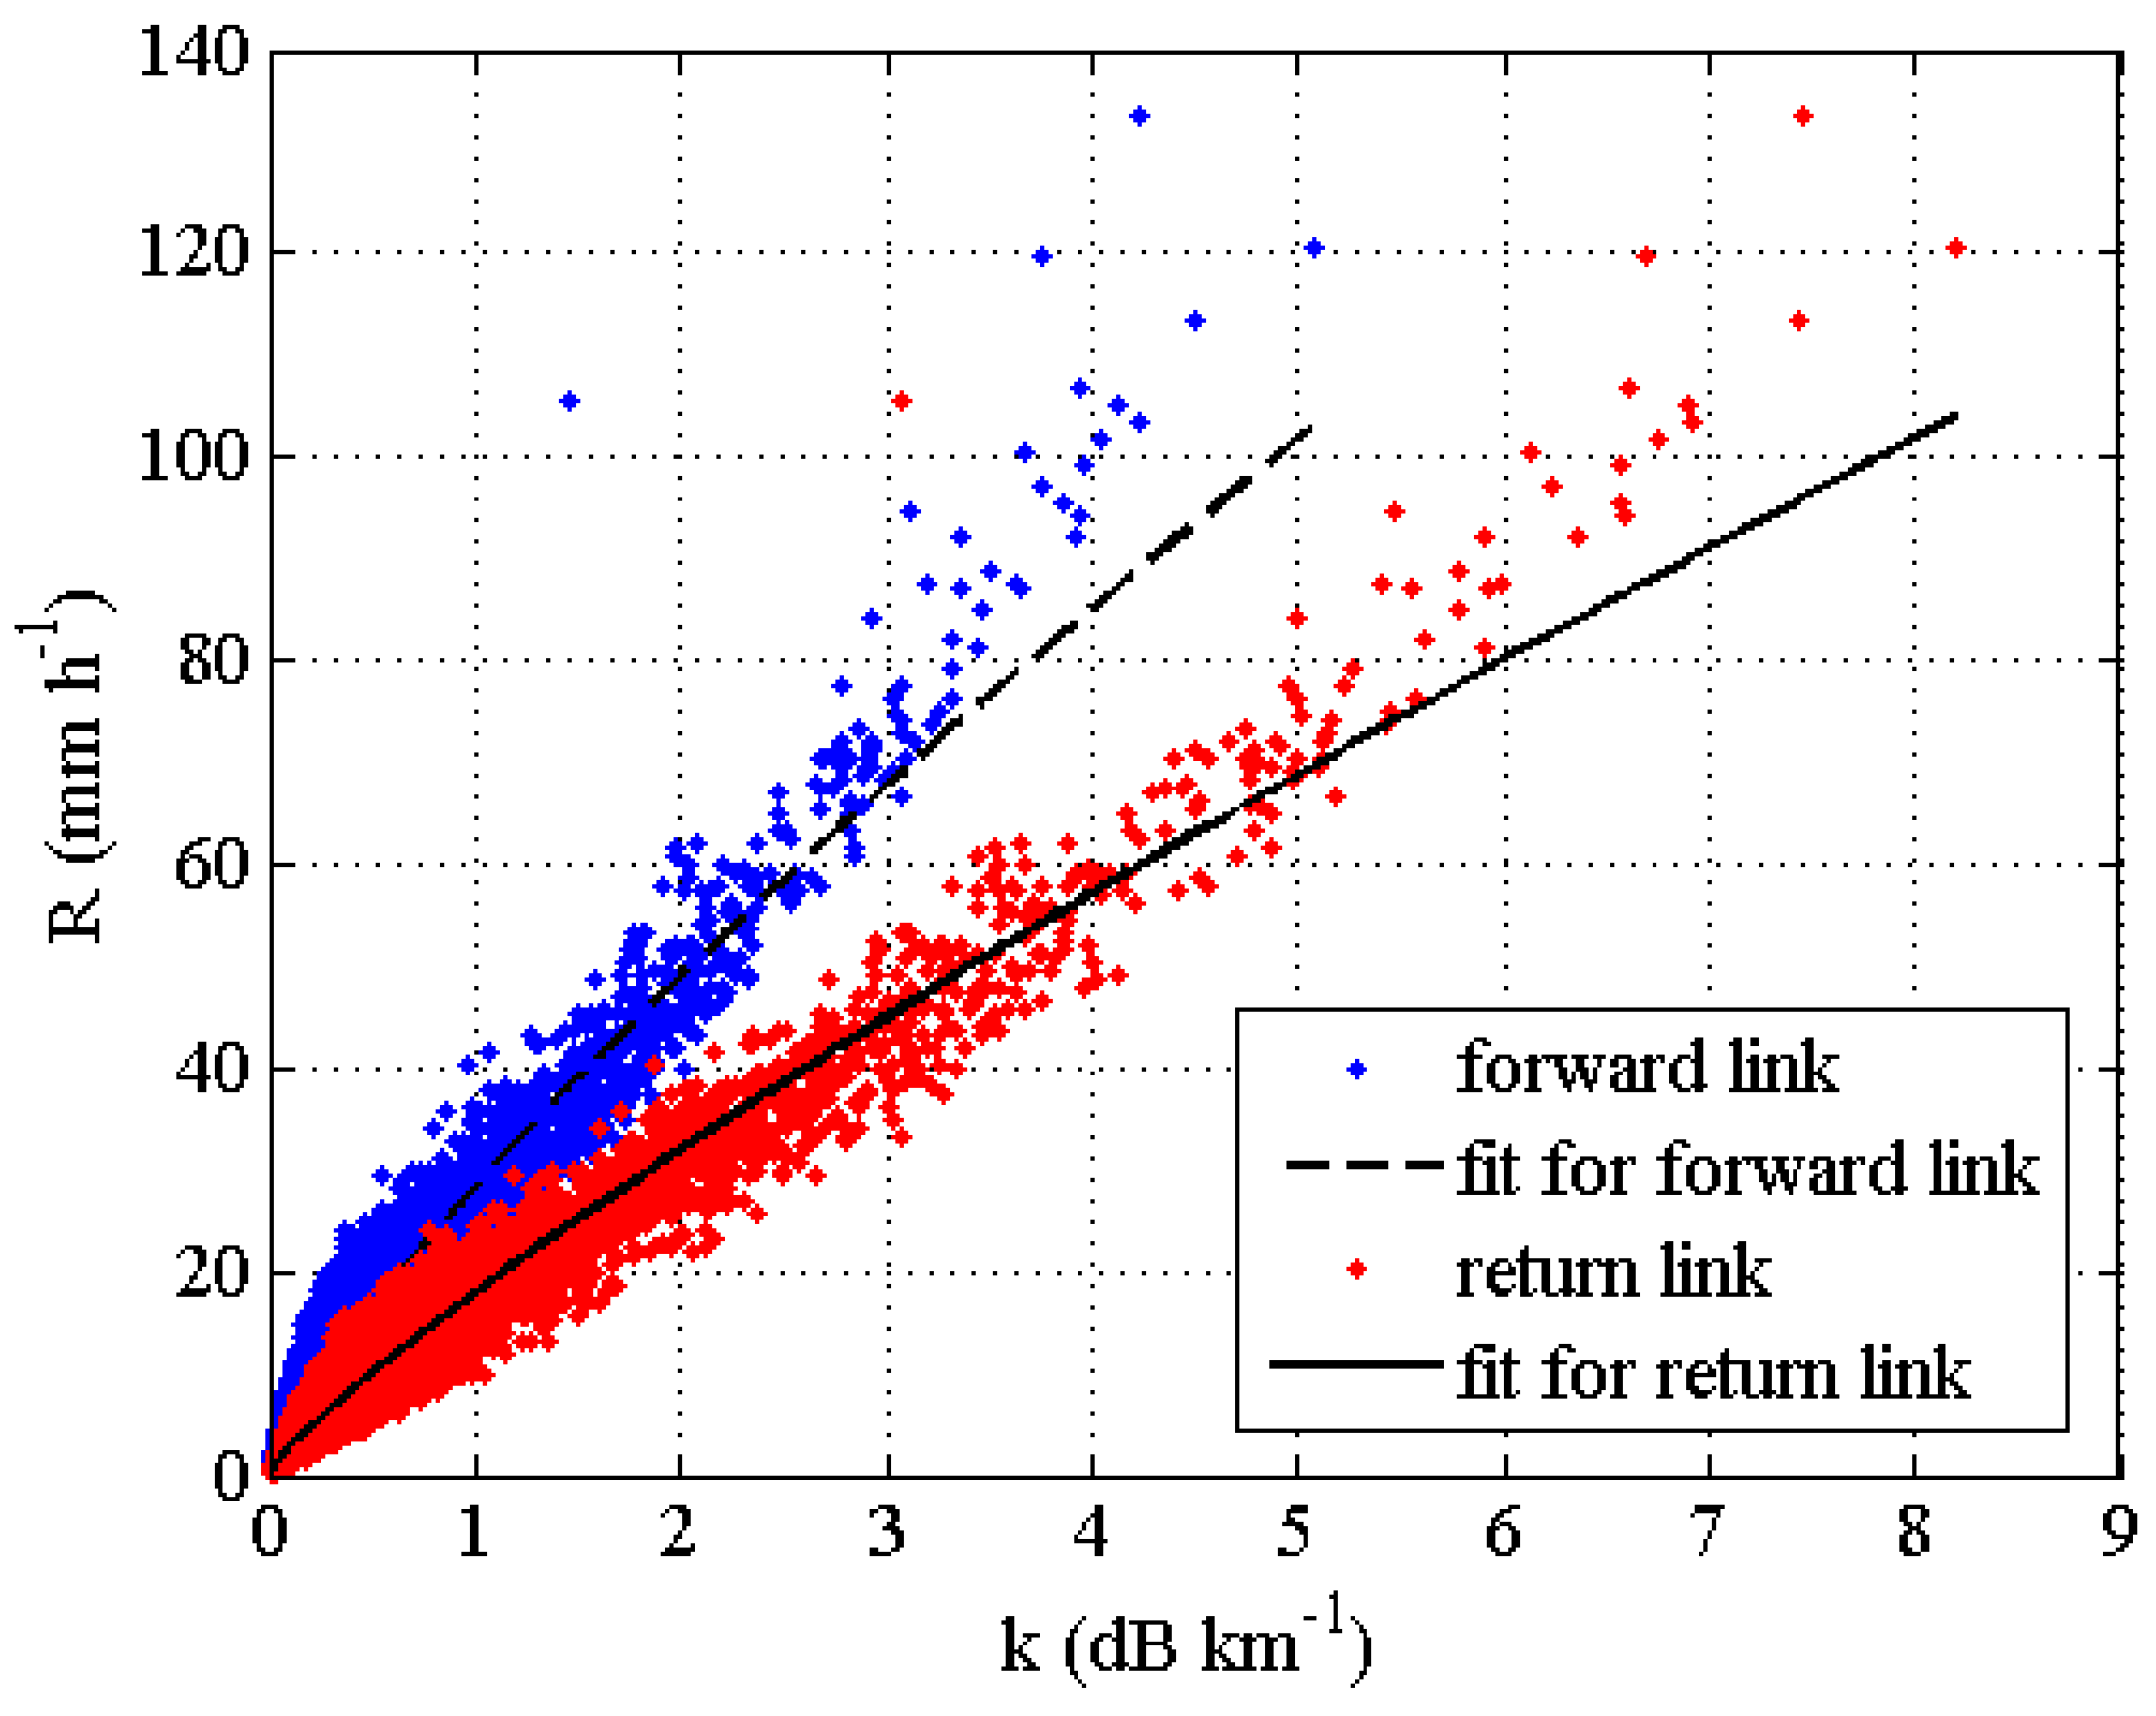
| R = α kβ | α | β | NMAE | NB | RMSE | CC |
|---|---|---|---|---|---|---|
| Return link 14,216.6 MHz, H polarization. | 17.910 | 0.836 | 17.9% | −4.3% | 0.90 | 0.983 |
| Forward link 11,345.5 MHz, V polarization. | 28.140 | 0.798 | 20.6% | −4.4% | 1.07 | 0.976 |
| Parameter | Value |
|---|---|
| kB: Boltzmann constant | 1.38 × 10⁻²³ J/K |
| TC: Cosmic noise temperature | 2.78 K |
| TG: Ground noise temperature | 50 K |
| Tm: Mean thermodynamic temp. of the atm. formations | 265 K |
| TRX: Receiver noise temperature | 13.67 K |
| Aatm: Gaseous atmospheric attenuation | 0.13 dB |
| Parameter/Feature | Value/Description |
|---|---|
| Satellite | EUTELSAT 10A |
| Longitude | 10° East |
| Elevation angle | 39.6° |
| EIRP | 48 dBW |
| Transponder Bandwidth | 36 MHz |
| Frequency | 11,345.833 MHz |
| Polarization | Vertical |
| Receiver Antenna Diameter | 75 cm |
| LNB Noise Figure @ 290 K | 0.2 dB |
| Physical Layer Protocol | DVB-S2 |
| Symbol Rate | 29.00 MBaud |
| MODCOD | QPSK 4/5 |
| Ground Station Coordinates | 43.72031° North 10.38377° East |
© 2017 by the authors. Licensee MDPI, Basel, Switzerland. This article is an open access article distributed under the terms and conditions of the Creative Commons Attribution (CC BY) license (http://creativecommons.org/licenses/by/4.0/).
Share and Cite
Giannetti, F.; Reggiannini, R.; Moretti, M.; Adirosi, E.; Baldini, L.; Facheris, L.; Antonini, A.; Melani, S.; Bacci, G.; Petrolino, A.; et al. Real-Time Rain Rate Evaluation via Satellite Downlink Signal Attenuation Measurement. Sensors 2017, 17, 1864. https://doi.org/10.3390/s17081864
Giannetti F, Reggiannini R, Moretti M, Adirosi E, Baldini L, Facheris L, Antonini A, Melani S, Bacci G, Petrolino A, et al. Real-Time Rain Rate Evaluation via Satellite Downlink Signal Attenuation Measurement. Sensors. 2017; 17(8):1864. https://doi.org/10.3390/s17081864
Chicago/Turabian StyleGiannetti, Filippo, Ruggero Reggiannini, Marco Moretti, Elisa Adirosi, Luca Baldini, Luca Facheris, Andrea Antonini, Samantha Melani, Giacomo Bacci, Antonio Petrolino, and et al. 2017. "Real-Time Rain Rate Evaluation via Satellite Downlink Signal Attenuation Measurement" Sensors 17, no. 8: 1864. https://doi.org/10.3390/s17081864
APA StyleGiannetti, F., Reggiannini, R., Moretti, M., Adirosi, E., Baldini, L., Facheris, L., Antonini, A., Melani, S., Bacci, G., Petrolino, A., & Vaccaro, A. (2017). Real-Time Rain Rate Evaluation via Satellite Downlink Signal Attenuation Measurement. Sensors, 17(8), 1864. https://doi.org/10.3390/s17081864