Feasibility of a Secure Wireless Sensing Smartwatch Application for the Self-Management of Pediatric Asthma

 , and
, and
Abstract
:
1. Introduction
1.1. Related Work
1.2. Objectives
2. Materials and Methods
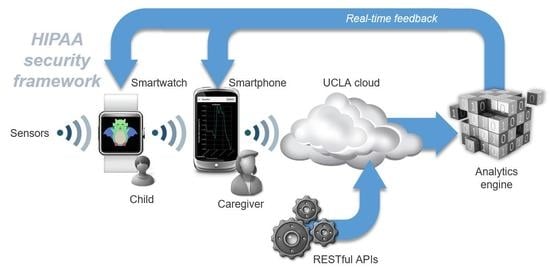
2.1. System Overview
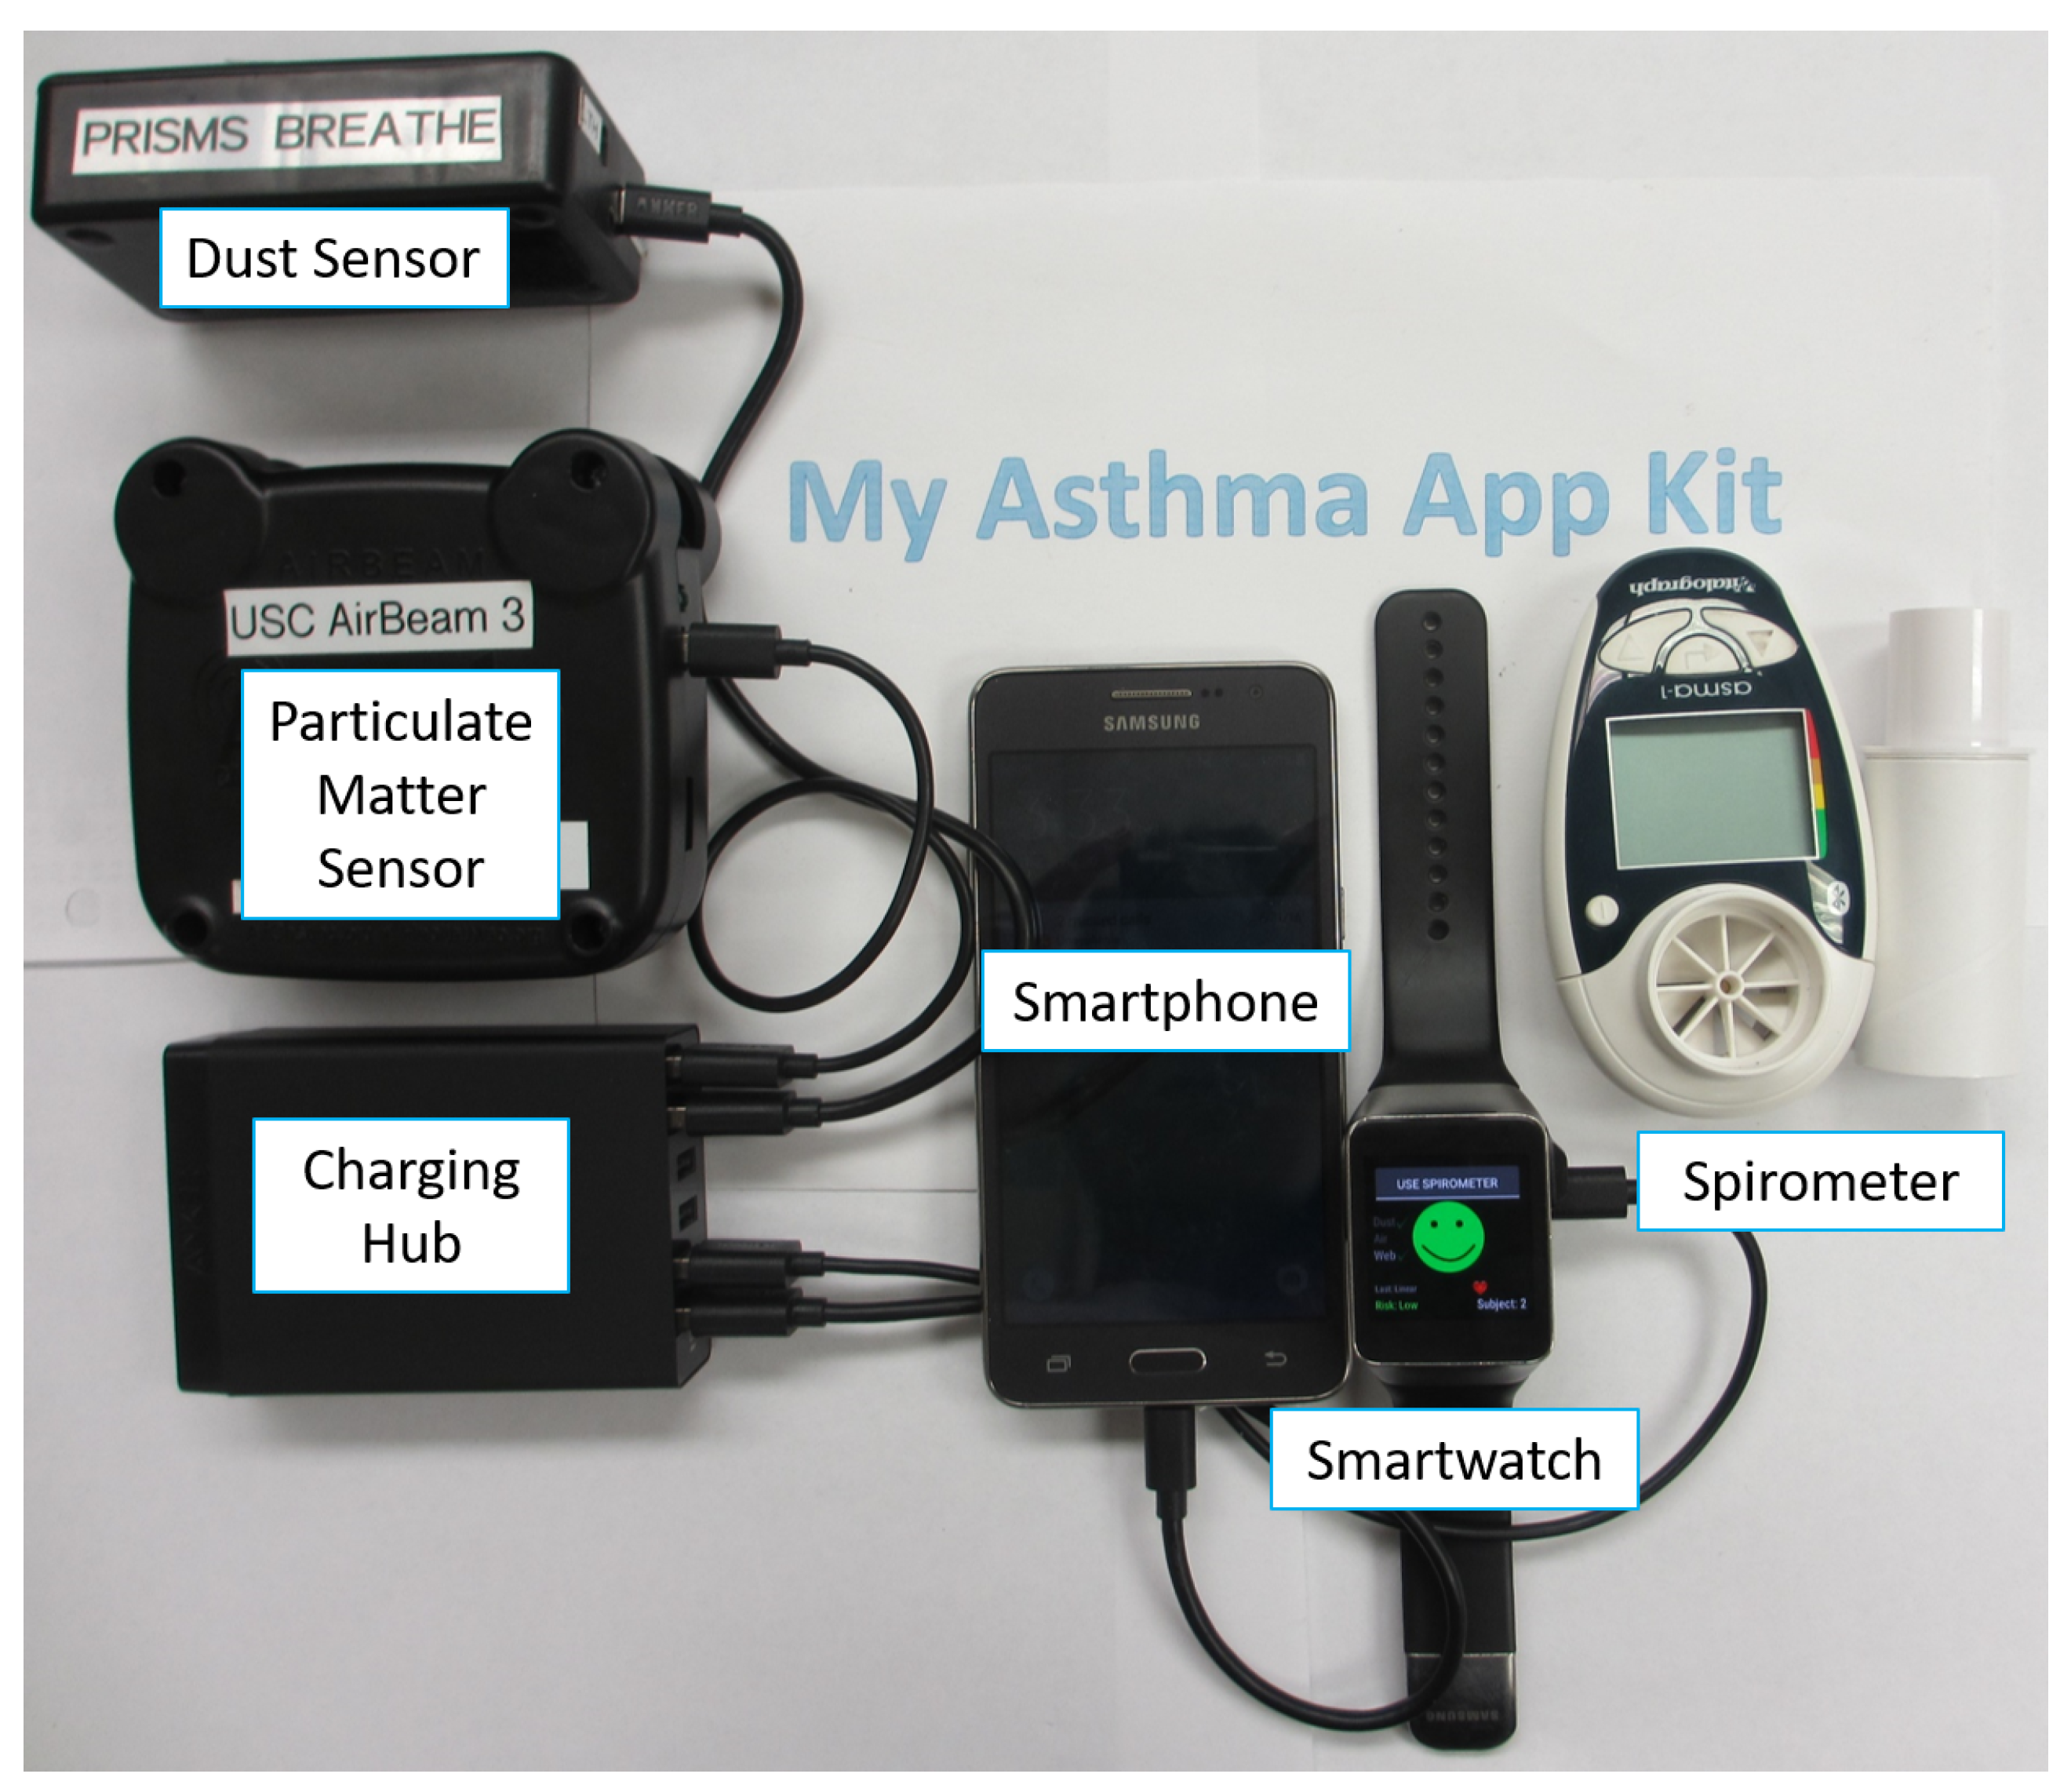
2.2. Wireless Sensors
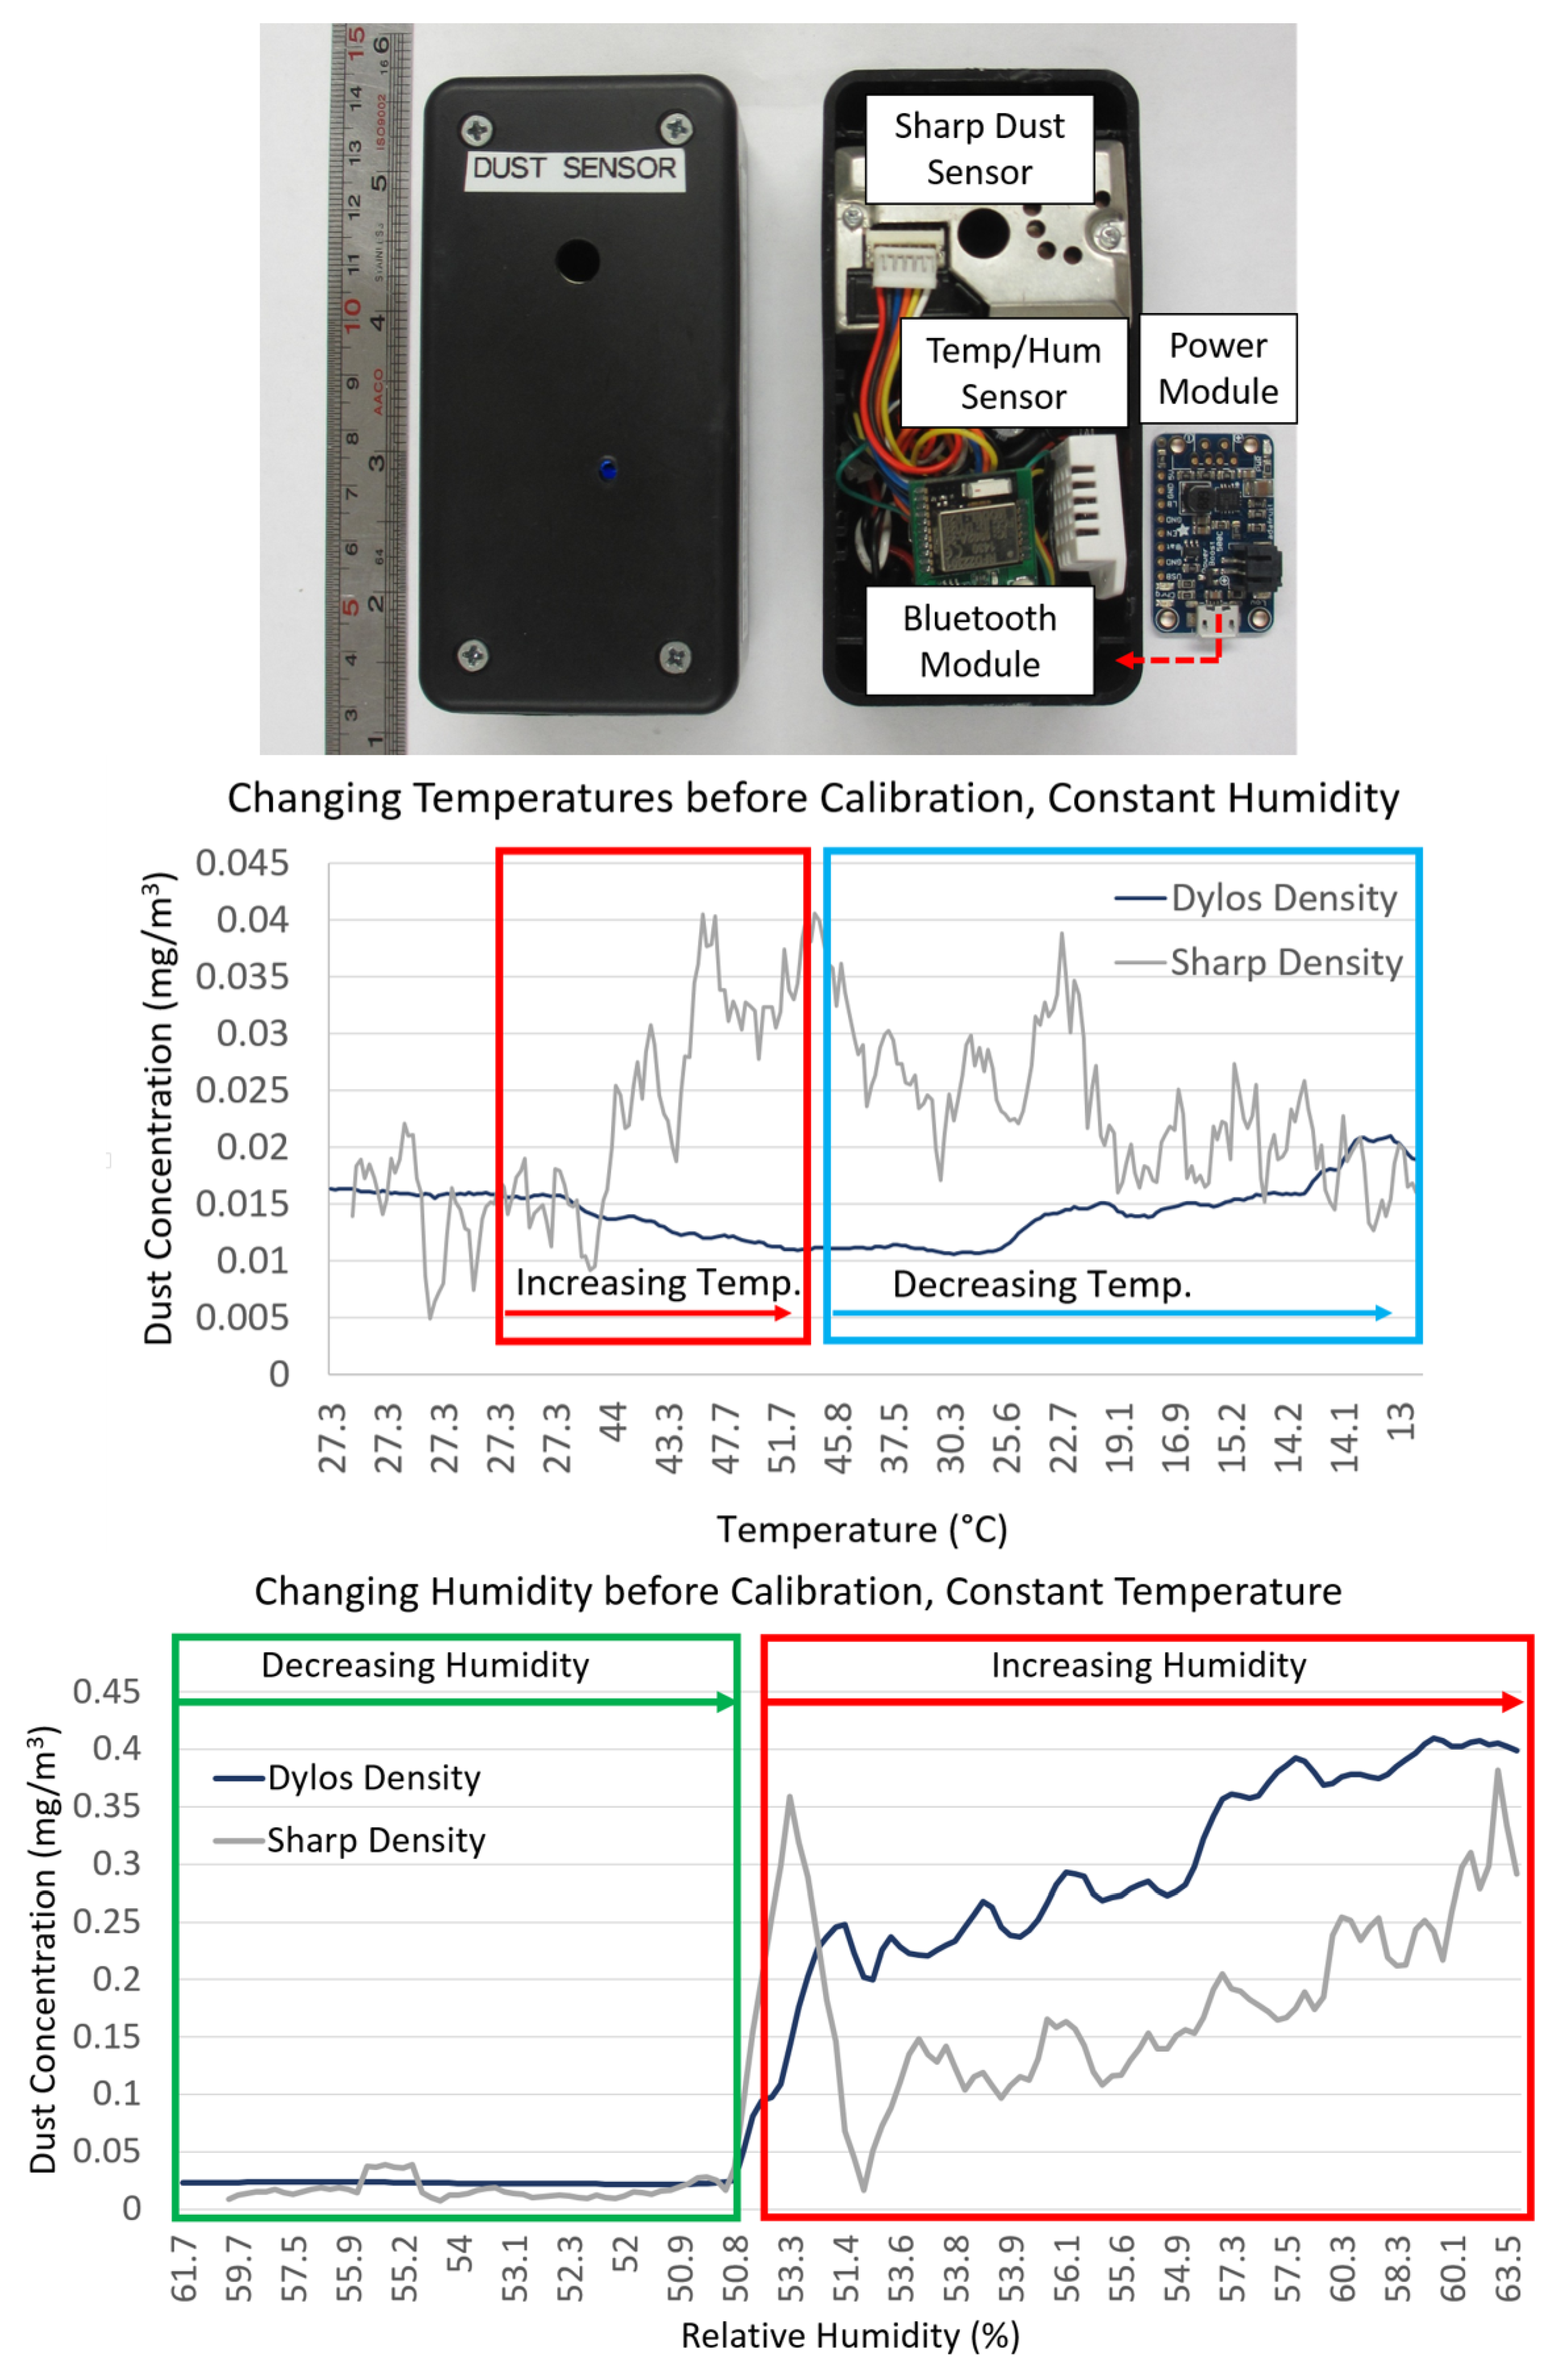
2.2.1. Environmental Sensors
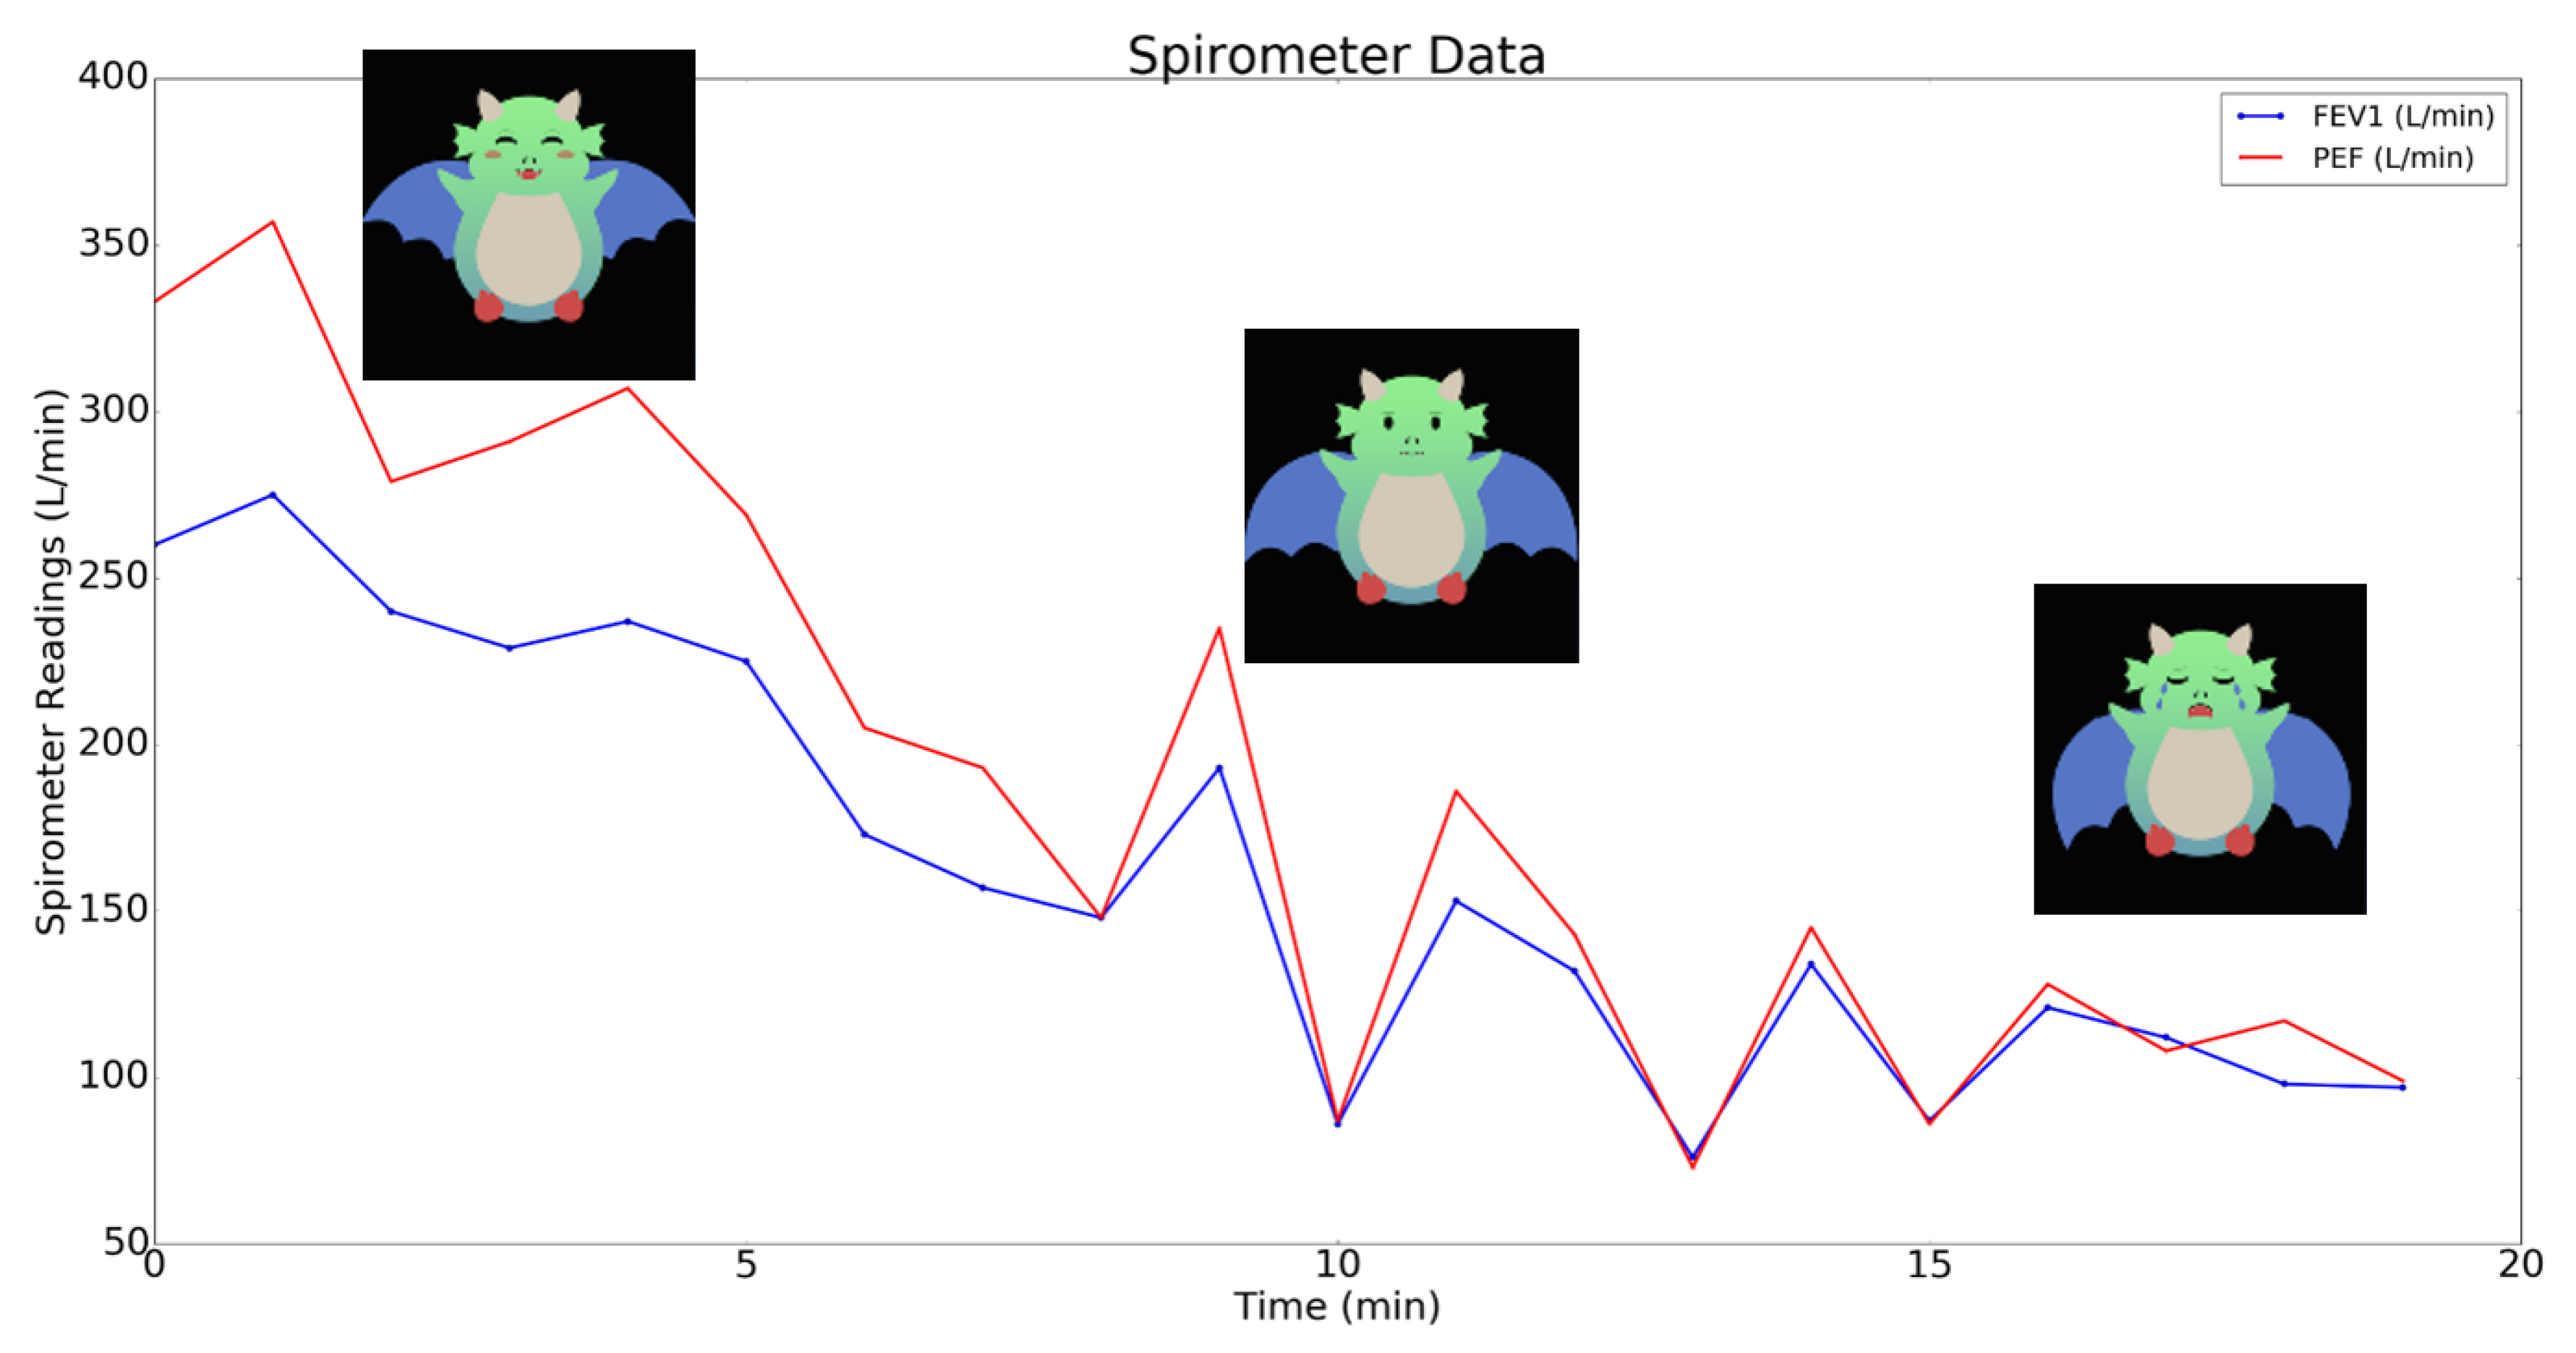
2.2.2. Spirometer
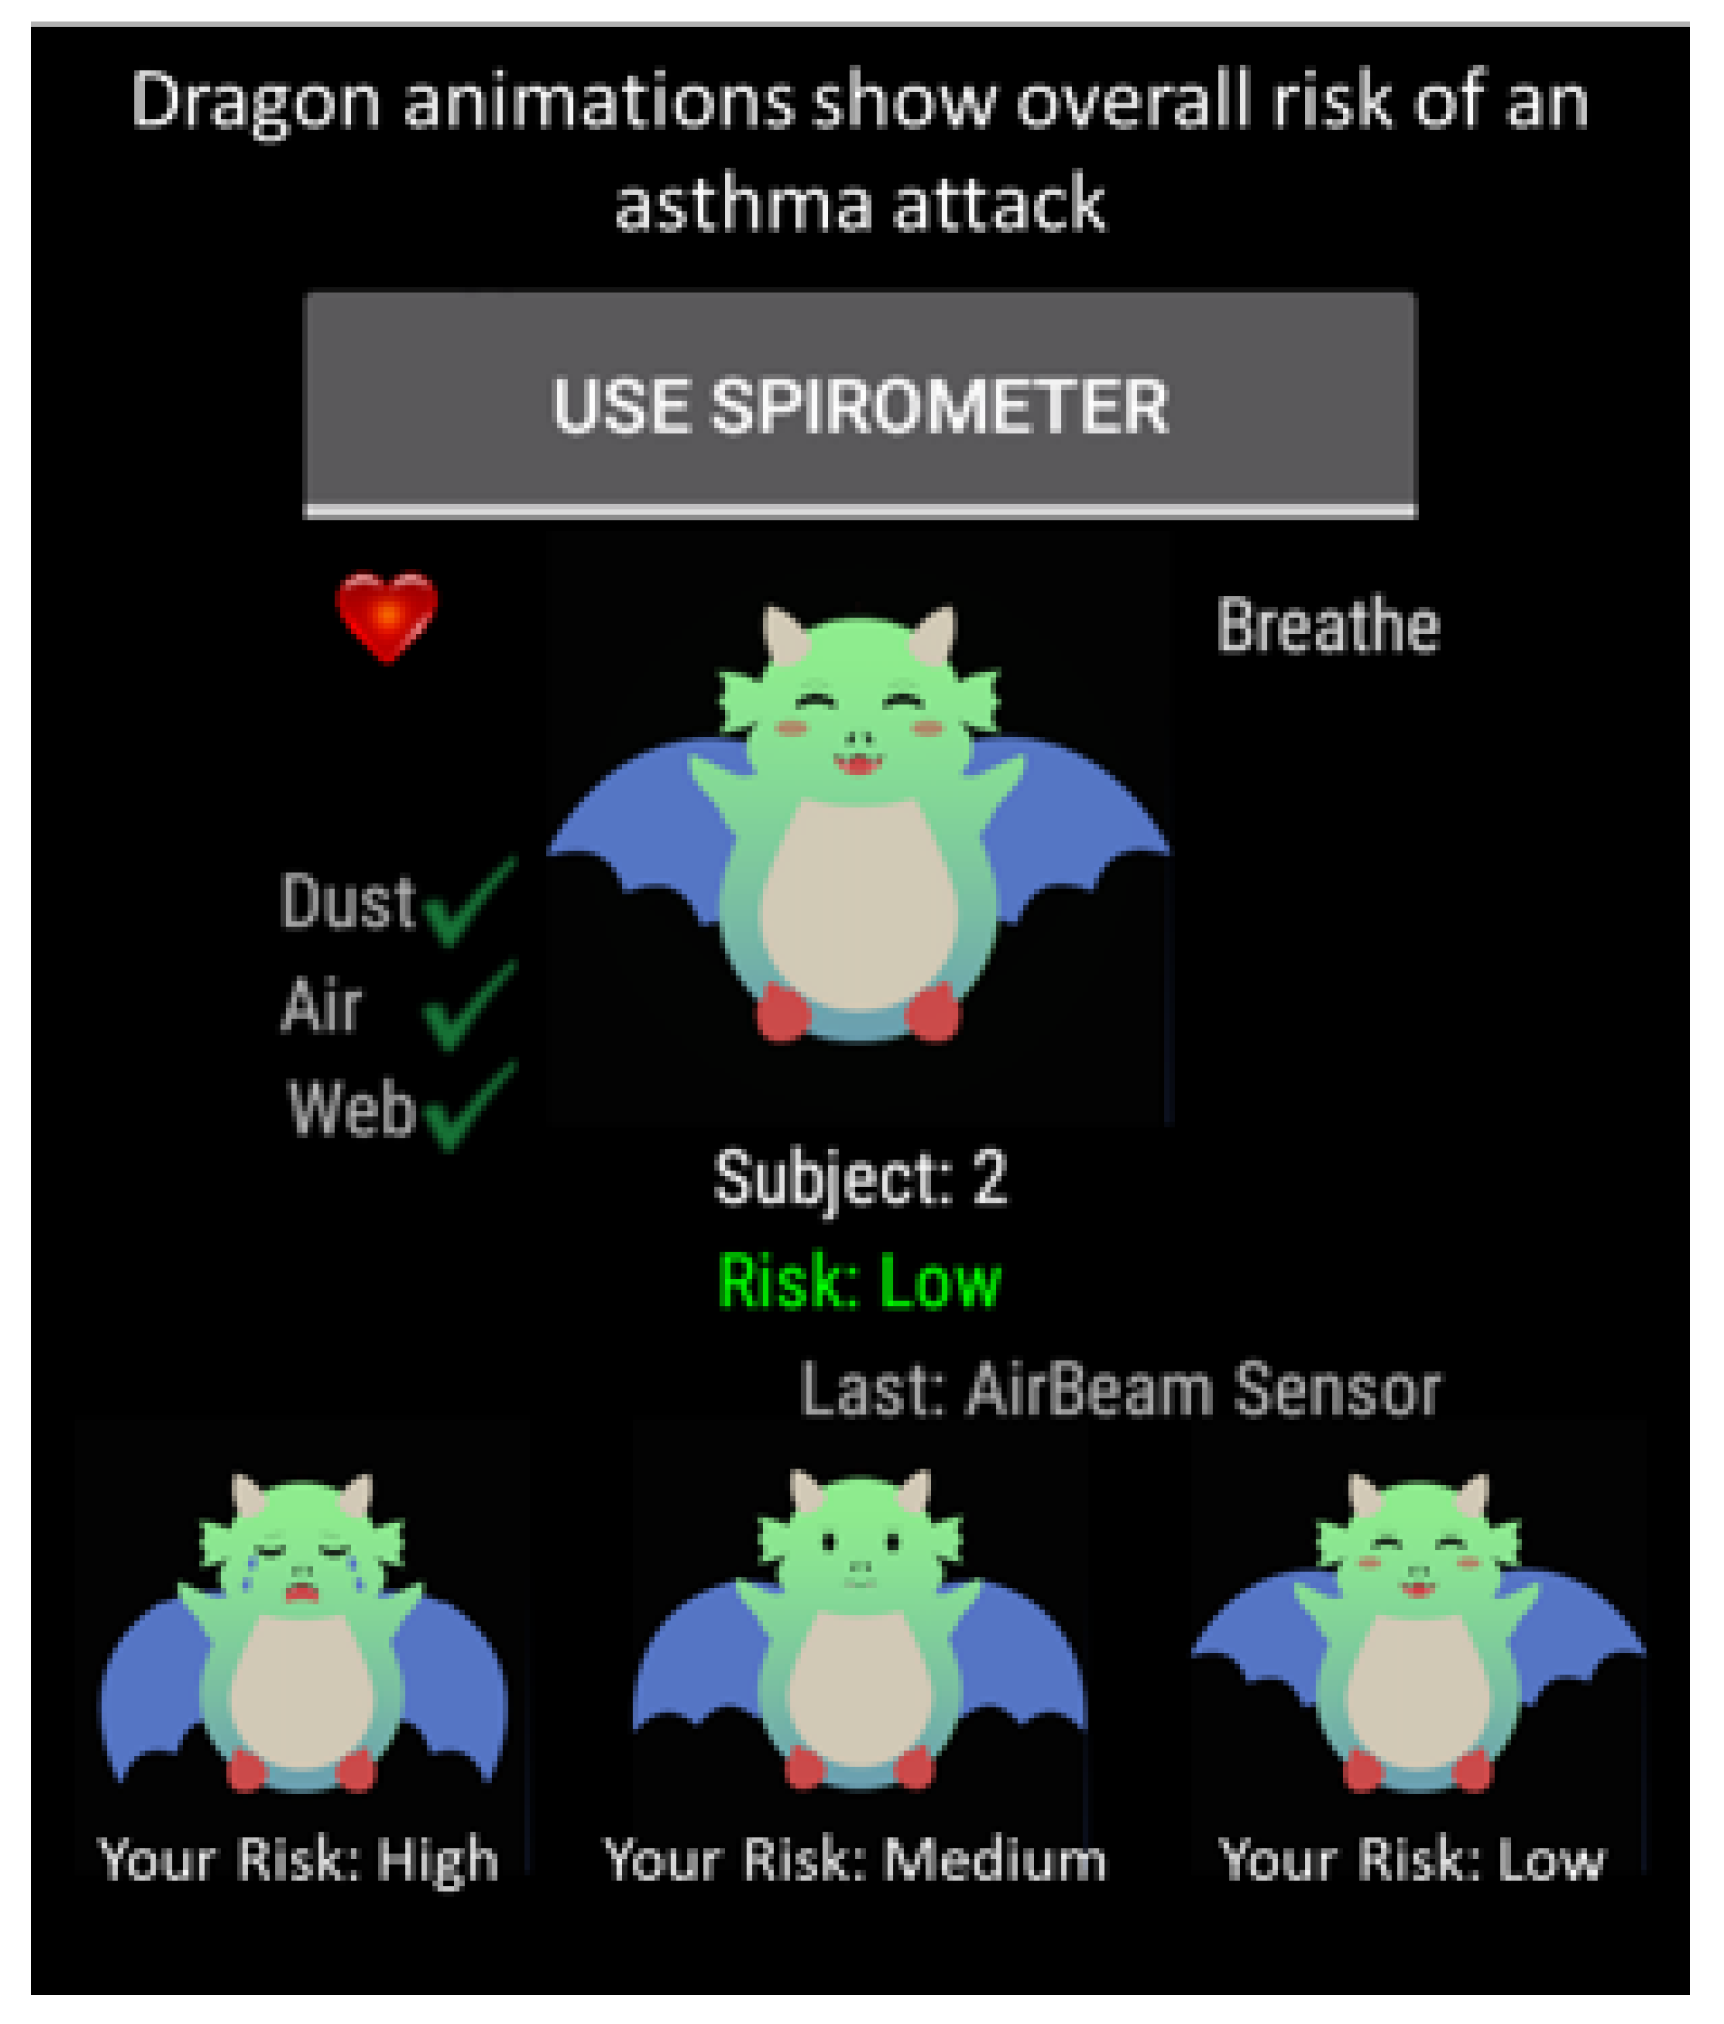
2.3. Asthma App
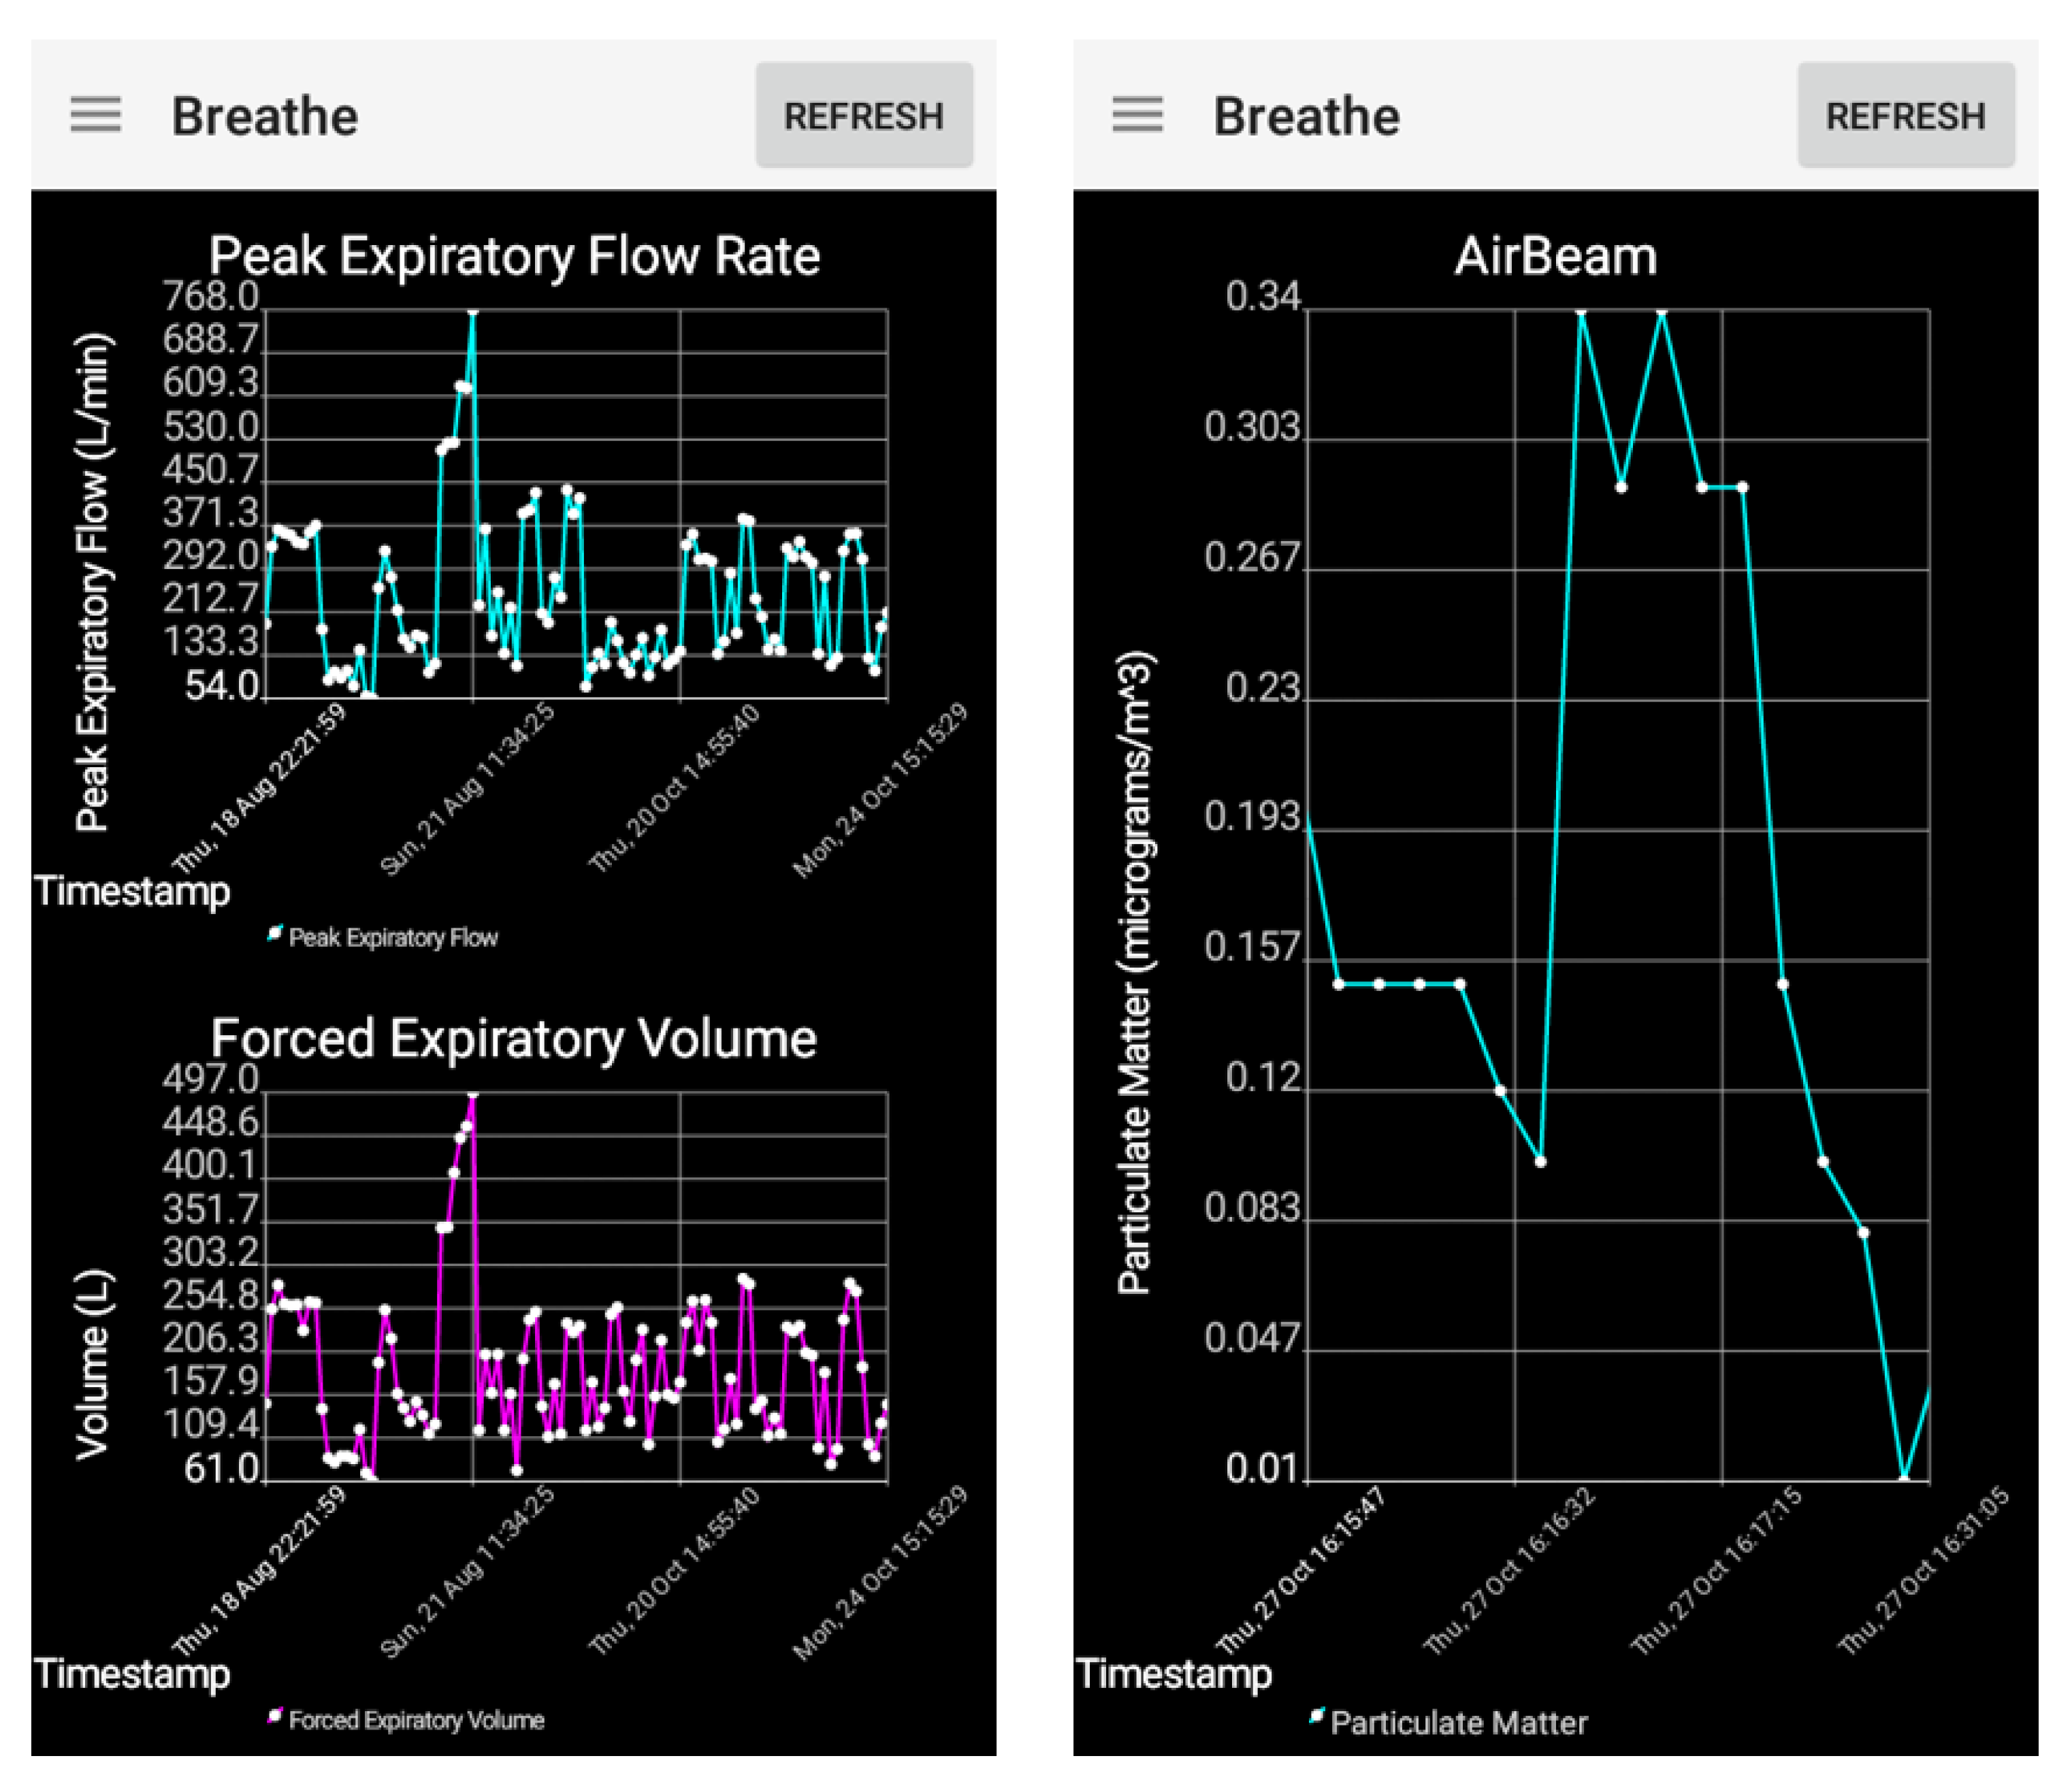
2.4. Smartphone App
2.5. HIPAA Compliant Cryptography
2.6. The BREATHE Cloud Platform
2.7. Real Time Analytics
2.7.1. Data Pre-Processing
2.7.2. Analytics Model
2.7.3. Validation of Asthma Risk
2.7.4. Evaluation Measures
3. Results
3.1. Adult Feasibility Testing
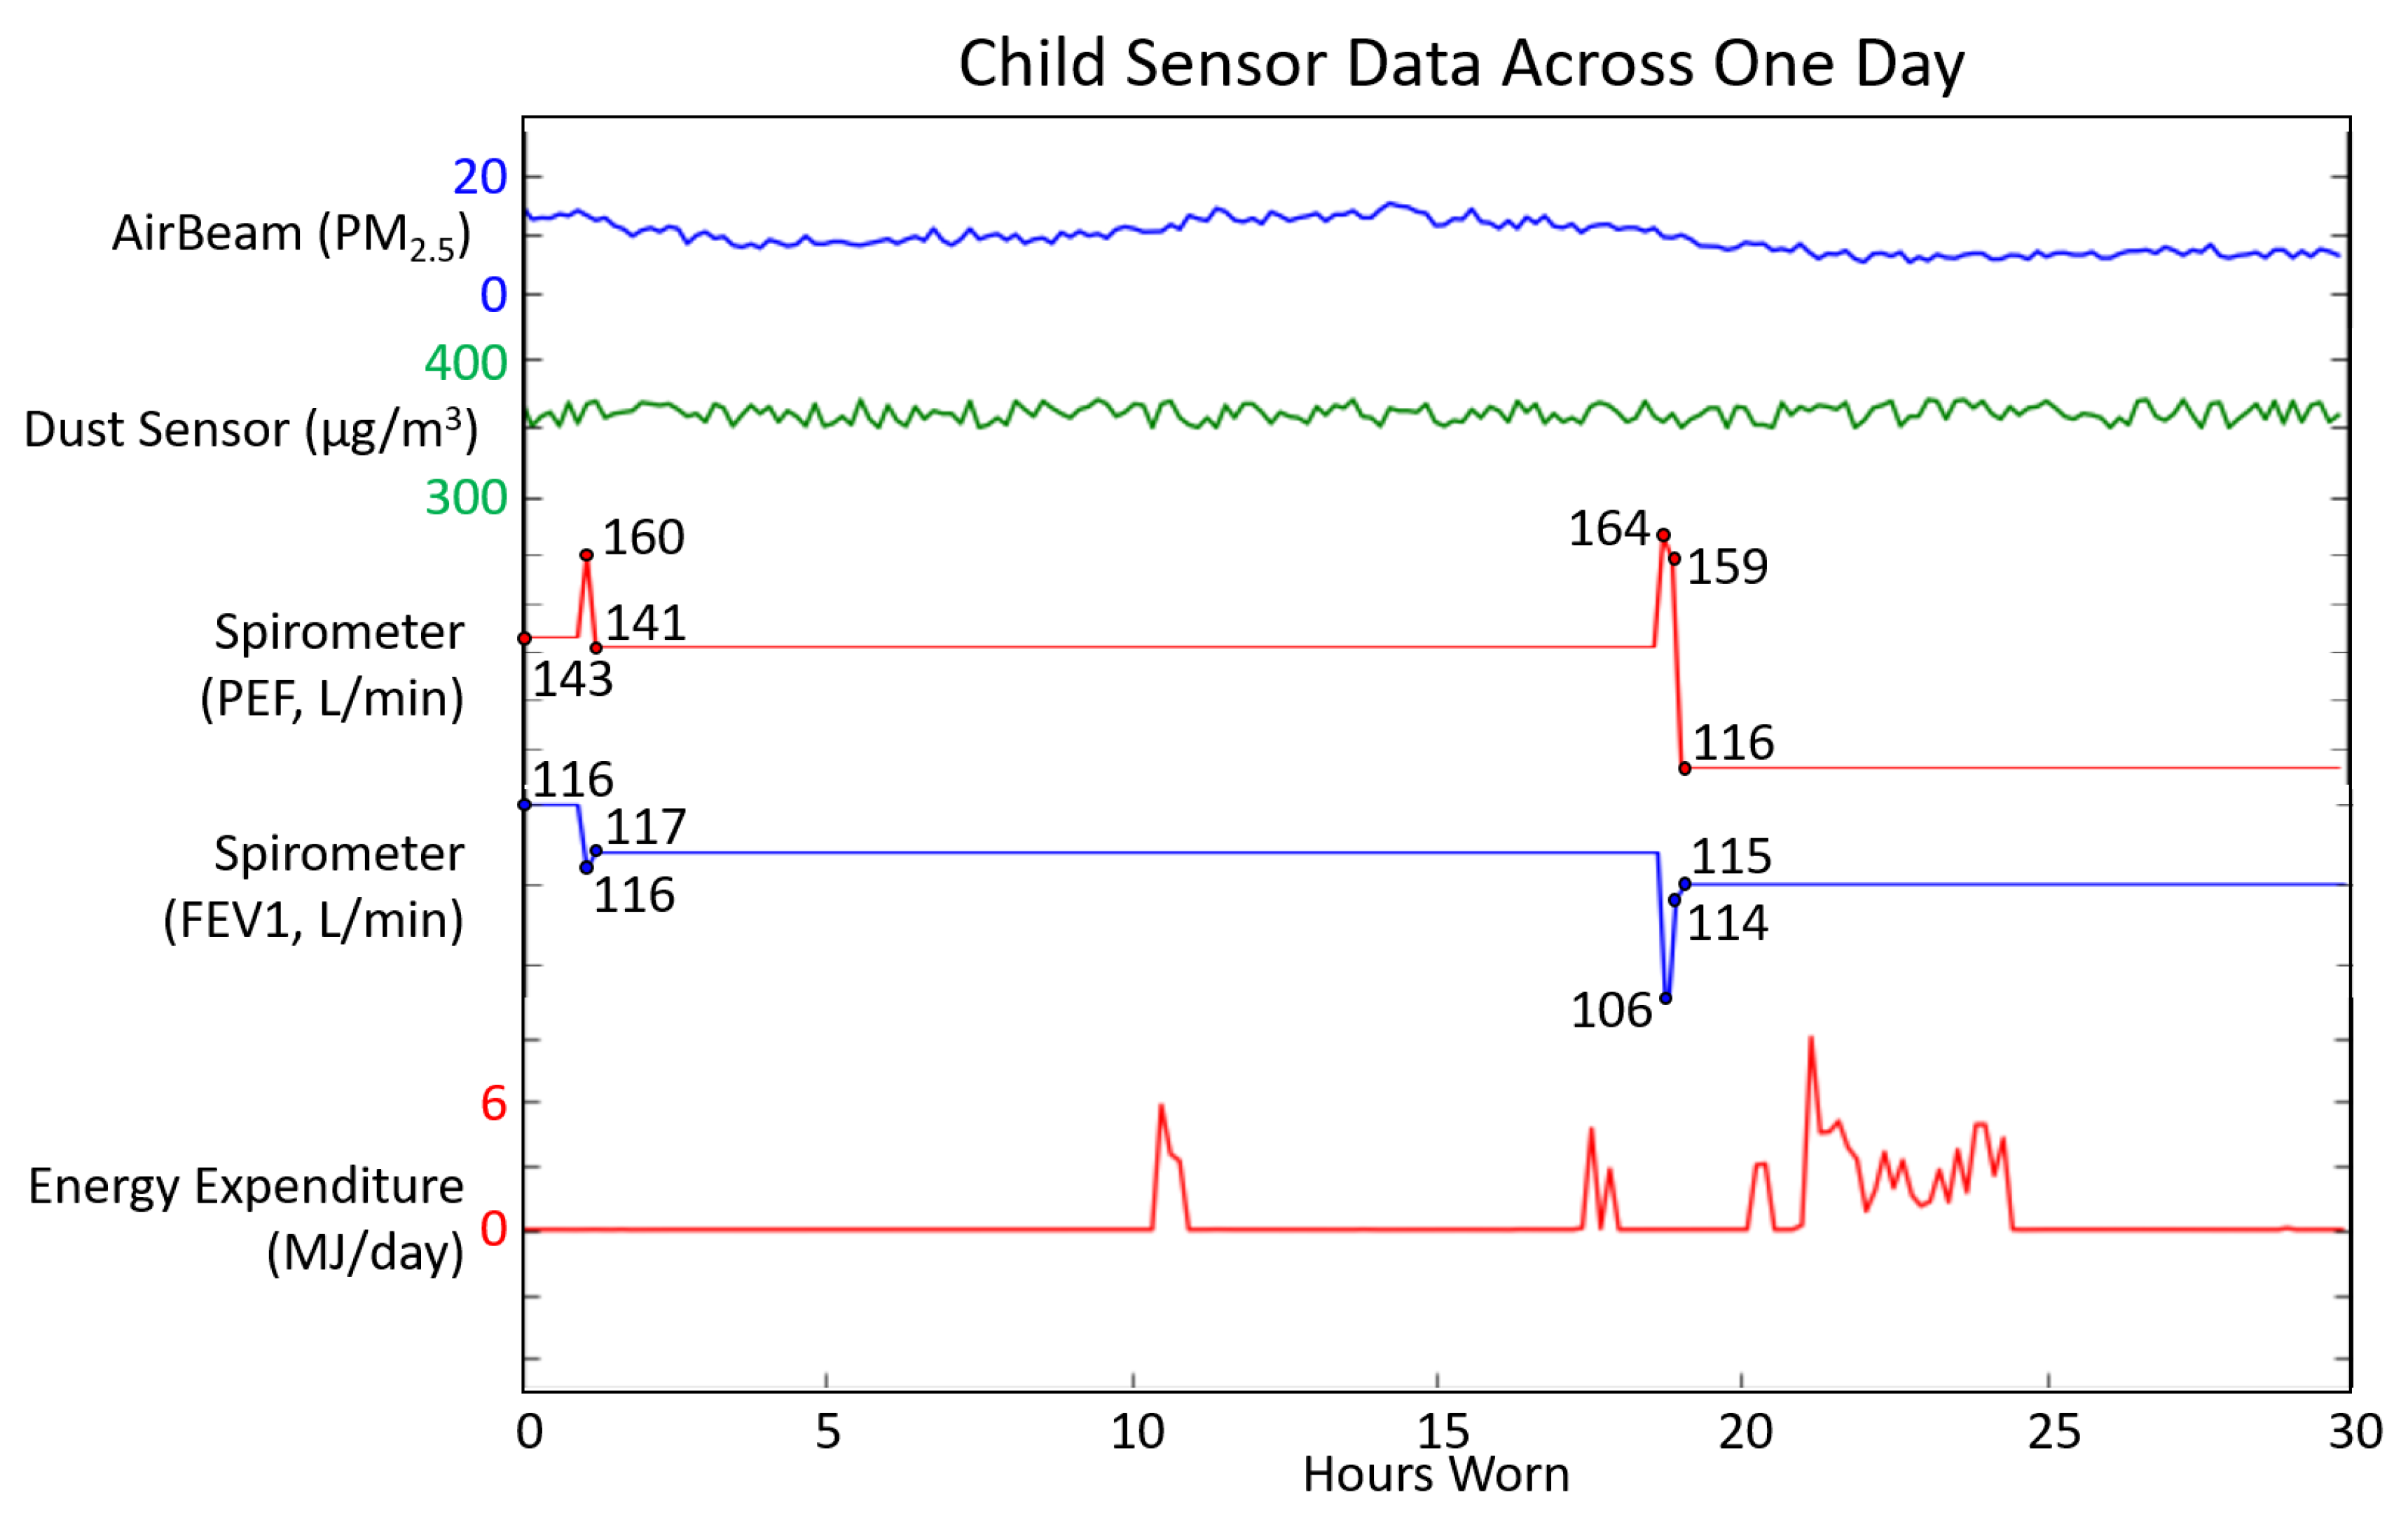
3.2. Child Usability Testing
4. Discussion
5. Conclusions
Acknowledgments
Author Contributions
Conflicts of Interest
Abbreviations
| mHealth | Mobile Health |
| app | Application |
| HIPAA | Health Insurance Portability and Accountability Act |
| RESTful API | Representational State Transfer Application Programming Interface |
| PEF | Peak Expiratory Flow |
| FEV1 | Forced Expiratory Volume in one second |
| PPG | Photoplethysmography |
| NIBIB | National Institute of Biomedical Imaging and Bioengineering |
| PRISMS | Pediatric Research using Integrated Sensor Monitoring Systems |
| BLE | Bluetooth Low Energy |
| AES | Advanced Encryption Standard |
| PM 2.5 | Particulate Matter smaller than 2.5 m in diameter |
| RSA | Rivest–Shamir–Adleman |
| BREATHE | Biomedical Real-Time Health Evaluation |
| ACT | Asthma Control Test |
| AQI | Air Quality Index |
References
- National Heart Lung and Blood Institute Description of Asthma. Available online: http://www.nhlbi.nih.gov/health/health-topics/topics/asthma/atrisk (accessed on 18 May 2017).
- Bloom, B.; Jones, L.; Freeman, G. Summary health statistics for U.S. children: National health interview survey. Vital Health Stat. 2012, 10, 1–88. [Google Scholar]
- Buie, V.; Owings, M.; DeFrances, C.; Golosinskiy, A. National hospital discharge survey: 2006 annual summary. Vital Health Stat. 2010, 13, 1–79. [Google Scholar]
- Moorman, J.; Akinbami, L.; Bailey, C.; Zahran, H.S.; King, M.E.; Johnson, C.A.; Liu, X. National surveillance of asthma: United States, 2001–2010. Vital Health Stat. 2012, 3, 1–58. [Google Scholar]
- American Lung Association Asthma and Children Fact Sheet. Available online: http://www.lung.org/lungdisease/asthma/resources/facts-and-figures/asthma-children-fact-sheet.html#4 (accessed on 18 May 2017).
- Bloom, B.; Cohen, R.; Freeman, G. Summary health statistics for U.S. children: National health interview survey, 2009. Vital Health Stat. 2009, 10, 1–80. [Google Scholar]
- Barnett, S.; Nurmagambetov, T. Costs of asthma in the United States: 2002–2007. J. Allergy Clin. Immunol. 2011, 127, 145–152. [Google Scholar] [CrossRef] [PubMed]
- Centers for Disease Control Asthma’s Impact on the Nation: Data from the CDC National Asthma Control Program. Available online: http://www.cdc.gov/asthma/impactsnation/asthmafactsheet.pdf (accessed on 18 May 2017).
- Marcano Belisario, J.S.; Huckvale, K.; Greenfield, G.; Car, J.; Gunn, L.H. Smartphone and tablet self management apps for asthma. Cochrane Database Syst. Rev. 2013, 11. [Google Scholar] [CrossRef]
- Schneider, T.; Panzera, A.D.; Couluris, M.; Lindenberger, J.; McDermott, R.; Bryant, C.A. Engaging teens with asthma in designing a patient-centered mobile app to aid disease self-management. Telemed. J. e-Health 2015, 22, 170–175. [Google Scholar] [CrossRef] [PubMed]
- Mosa, A.S.M.; Yoo, I.; Sheets, L. A systematic review of healthcare applications for smartphones. BMC Med. Inform. Decis. Mak. 2012, 12, 67–98. [Google Scholar] [CrossRef] [PubMed]
- Rasmussen, L.M.; Phanareth, K.; Nolte, H.; Backer, V. Internet based monitoring of asthma: A long-term, randomized clinical study of 300 asthmatic subjects. J. Allergy Clin. Immunol. 2005, 115, 1137–1142. [Google Scholar] [CrossRef] [PubMed]
- Chan, D.S.; Callahan, C.W.; Hatch-Pigott, V.B.; Lawless, A.; Proffitt, H.L.; Manning, N.E.; Schweikert, M.; Malone, F.J. Internet based home monitoring and education of children with asthma is comparable to ideal office-based care: Results of a 1-year asthma in home monitoring trial. Pediatrics 2007, 119, 569–578. [Google Scholar] [CrossRef] [PubMed]
- Anantharam, P.; Banerjee, T.; Sheth, A.; Thirunarayan, K.; Marupudi, S.; Sridharan, V.; Forbis, S.G. Knowledge-driven personalized contextual mhealth service for asthma management in children. In Proceedings of the IEEE 4th International Conference on Mobile Services, New York, NY, USA, 27 June–2 July 2015; pp. 284–291. [Google Scholar]
- Tahir, D.; Rice, S. New app aids Mount Sinai asthma research. Mod. Healthc. 2015, 45, 28. [Google Scholar] [PubMed]
- Chan, Y.F.Y.; Wang, P.; Rogers, L.; Tignor, N.; Zweig, M.; Hershman, S.G.; Genes, N.; Scott, E.R.; Krock, E.; Badgeley, M.; et al. The asthma mobile health study, a large-scale clinical observational study using ResearchKit. Nat. Biotechnol. 2017, 35, 354–362. [Google Scholar] [CrossRef] [PubMed]
- Jaimini, U.; Banerjee, T.; Romine, W.; Thirunarayan, K.; Sheth, A.; Kalra, M. Investigation of an indoor air quality sensor for asthma management in children. IEEE Sens. Lett. 2017, 1, 1–4. [Google Scholar] [CrossRef]
- Smith, A. US Smartphone Use in 2015. Available online: http://www.pewinternet.org/2015/04/01/us-smartphone-use-in-2015/ (accessed on 25 July 2017).
- Huckvale, K.; Morrison, C.; Ouyang, J.; Ghaghda, A.; Car, J. The evolution of mobile apps for asthma: An updated systematic assessment of content and tools. BMC Med. 2015, 13, 58–73. [Google Scholar] [CrossRef] [PubMed]
- National Heart Lung and Blood Institute Expert Panel Report 3 (EPR 3): Guidelines for the Diagnosis and Management of Asthma Bethesda: National Institutes of Health. Available online: https://www.nhlbi.nih.gov/files/docs/guidelines/asthgdln.pdf (accessed on 18 May 2017).
- Hosseini, A.; Buonocore, C.M.; Hashemzadeh, S.; Hojaiji, H.; Kalantarian, H.; Sideris, C.; Bui, A.A.; King, C.E.; Sarrafzadeh, M. HIPAA compliant wireless sensing smartwatch application for the self-management of pediatric asthma. In Proceedings of the IEEE 2016 Wearable and Implantable Body Sensor Networks Conference, San Francisco, CA, USA, 14–17 June 2016; pp. 49–54. [Google Scholar]
- Bluetooth Smart (Low Energy) Security. Bluetooth Developer Portal. Available online: https://developer.bluetooth.org/TechnologyOverview/Pages/LE-Security.aspx (accessed on 18 May 2017).
- Luxton, D.D.; Kayl, R.A.; Mishkind, M.C. mHealth data security: The need for HIPAA-compliant standardization. Telemed. J. e-Health 2012, 18, 284–288. [Google Scholar] [CrossRef] [PubMed]
- McConnell, R.; Berhane, K.; Gilliland, F.; London, S.J.; Vora, H.; Avol, E.; Gauderman, W.J.; Margolis, H.G.; Lurmann, F.; Thomas, D.C.; et al. Air pollution and bronchitic symptoms in Southern California children with asthma. Environ. Health Perspect. 1999, 107, 757–760. [Google Scholar] [CrossRef] [PubMed]
- Leaderer, B.P.; Belanger, K.; Triche, E.; Holford, T.; Gold, D.R.; Kim, Y.; Jankun, T.; Ren, P.; Je, J.E.M.; Platts-Mills, T.A.; et al. Dust mite, cockroach, cat, and dog allergen concentrations in homes of asthmatic children in the northeastern United States: Impact of socioeconomic factors and population density. Environ. Health Perspect. 2002, 110, 419–425. [Google Scholar] [CrossRef] [PubMed]
- Strauss, R.H.; McFadden, E.R., Jr.; Ingram, R.H., Jr.; Deal, E.C., Jr.; Jaeger, J.J. Influence of heat and humidity on the airway obstruction induced by exercise in asthma. J. Clin. Investig. 1978, 61, 433–440. [Google Scholar] [CrossRef] [PubMed]
- Abushakra, A.; Faezipour, M. Lung capacity estimation through acoustic signal of breath. In Proceedings of the IEEE 12th International Conference on Bioinformatics and Bioengineering, Larnaca, Cyprus, 11–13 November 2012; pp. 386–391. [Google Scholar]
- Dunton, G.F.; Liao, Y.; Intille, S.S.; Spruijt-Metz, D.; Pentz, M. Investigating children’s physical activity and sedentary behavior using ecological momentary assessment with mobile phones. Obesity 2011, 19, 1205–1212. [Google Scholar] [CrossRef] [PubMed]
- Baranowski, T.; Buday, R.; Thompson, D.I.; Baranowski, J. Playing for real: Video games and stories for health-related behavior change. Am. J. Prev. Med. 2008, 34, 74–82. [Google Scholar] [CrossRef] [PubMed]
- Lau, P.W.; Lau, E.Y.; Wong, D.P.; Ransdell, L. A systematic review of information and communication technology–based interventions for promoting physical activity behavior change in children and adolescents. J. Med. Internet Res. 2011, 13, e48. [Google Scholar] [CrossRef] [PubMed]
- Silva, B.M.; Rodrigues, J.J.; Canelo, F.; Lopes, I.C.; Zhou, L. A data encryption solution for mobile health apps in cooperation environments. J. Med. Internet Res. 2013, 15, e66. [Google Scholar] [CrossRef] [PubMed]
- Wu, R.; Ahn, G.J.; Hu, H. Towards HIPAA-compliant healthcare systems. In Proceedings of the 2nd ACM SIGHIT International Health Informatics Symposium, Miami, FL, USA, 28–30 January 2012; pp. 593–602. [Google Scholar]
- Yamada, Y.; Yokoyama, K.; Noriyasu, R.; Osaki, T.; Adachi, T.; Itoi, A.; Naito, Y.; Morimoto, T.; Kimura, M.; Oda, S. Light-intensity activities are important for estimating physical activity energy expenditure using uniaxial and triaxial accelerometers. Eur. J. Appl. Physiol. 2009, 105, 141–152. [Google Scholar] [CrossRef] [PubMed]
- American Lung Association: Measuring Your Peak Flow Rate. Available online: http://www.lung.org/lung-health-and-diseases/lung-disease-lookup/asthma/living-with-asthma/managing-asthma/measuring-your-peak-flow-rate.html (accessed on 18 May 2017).
- Mahon, A.D.; Marjerrison, A.D.; Lee, J.D.; Woodruff, M.E.; Hanna, L.E. Evaluating the prediction of maximal heart rate in children and adolescents. Res. Q. Exerc. Sport 2010, 81, 466–471. [Google Scholar] [CrossRef] [PubMed]
- Sarker, H.; Tyburski, M.; Rahman, M.; Hovsepian, K.; Sharmin, M.; Epstein, D.H.; Preston, K.L.; Furr-Holden, C.D.; Milam, A.; Nahum-Shani, I.; et al. Finding significant stress episodes in a discontinuous time series of rapidly varying mobile sensor data. In Proceedings of the 2016 CHI Conference on Human Factors in Computing Systems, Santa Clara, CA, USA, 7–12 May 2016; pp. 4489–4501. [Google Scholar]
- Weiss, G.M.; Timko, J.L.; Gallagher, C.M.; Yoneda, K.; Schreiber, A.J. Smartwatch-based activity recognition: A machine learning approach. In Proceedings of the 2016 IEEE-EMBS International Conference on Biomedical and Health Informatics, Las Vegas, NV, USA, 24–27 February 2016; pp. 426–429. [Google Scholar]
- Mursalin, M.; Zhang, Y.; Chen, Y.; Chawla, N.V. Automated epileptic seizure detection using improved correlation-based feature selection with random forest classifier. Neurocomputing 2017, 241, 204–214. [Google Scholar] [CrossRef]
- Hiatt, L.; Adams, R.J.; Marlin, B.M. An improved data representation for smoking detection with wearable respiration sensors. In Proceedings of the 2016 IEEE International Conference on Healthcare Informatics, Chicago, IL, USA, 4–7 October 2016; p. 409. [Google Scholar]


© 2017 by the authors. Licensee MDPI, Basel, Switzerland. This article is an open access article distributed under the terms and conditions of the Creative Commons Attribution (CC BY) license (http://creativecommons.org/licenses/by/4.0/).
Share and Cite
Hosseini, A.; Buonocore, C.M.; Hashemzadeh, S.; Hojaiji, H.; Kalantarian, H.; Sideris, C.; Bui, A.A.T.; King, C.E.; Sarrafzadeh, M. Feasibility of a Secure Wireless Sensing Smartwatch Application for the Self-Management of Pediatric Asthma. Sensors 2017, 17, 1780. https://doi.org/10.3390/s17081780
Hosseini A, Buonocore CM, Hashemzadeh S, Hojaiji H, Kalantarian H, Sideris C, Bui AAT, King CE, Sarrafzadeh M. Feasibility of a Secure Wireless Sensing Smartwatch Application for the Self-Management of Pediatric Asthma. Sensors. 2017; 17(8):1780. https://doi.org/10.3390/s17081780
Chicago/Turabian StyleHosseini, Anahita, Chris M. Buonocore, Sepideh Hashemzadeh, Hannaneh Hojaiji, Haik Kalantarian, Costas Sideris, Alex A.T. Bui, Christine E. King, and Majid Sarrafzadeh. 2017. "Feasibility of a Secure Wireless Sensing Smartwatch Application for the Self-Management of Pediatric Asthma" Sensors 17, no. 8: 1780. https://doi.org/10.3390/s17081780
APA StyleHosseini, A., Buonocore, C. M., Hashemzadeh, S., Hojaiji, H., Kalantarian, H., Sideris, C., Bui, A. A. T., King, C. E., & Sarrafzadeh, M. (2017). Feasibility of a Secure Wireless Sensing Smartwatch Application for the Self-Management of Pediatric Asthma. Sensors, 17(8), 1780. https://doi.org/10.3390/s17081780