1. Introduction
In-season monitoring of crop development can assist management practices in different aspects, allowing farmers to optimize agricultural operations according to site-specific characteristics [
1]. Information obtained in previous seasons can also be considered for planning the cultivation of subsequent crops, taking into account the spatiotemporal variability of yield and of different factors related to the production [
1,
2]. In parallel, high-throughput approaches for field-based phenotyping can assist plant breeding in order to identify genotypes with better performance under diverse abiotic and biotic constraints, under realistic production conditions [
3]. In these cases, proximal and remote sensing offers a multitude of techniques that can be applied to estimate crop traits over time in non-destructive and spatially explicit ways. For instance, reflectance in the optical domain has been used to retrieve plants biochemical and biophysical properties, with high potential for the assessment of leaf pigments, like chlorophylls, and leaf area index, amongst other traits of great importance in the evaluation of plant health and of its response to stress conditions [
4,
5].
The estimation of leaf pigments content and canopy structural traits through optical remote sensing, usually with measurements of reflectance in spectral bands between 450 and 900 nm (i.e., from visible to near-infrared), is performed using approaches that can be broadly divided in three categories [
6]: empirical-statistical (i.e., through parametrical or non-parametrical regressions), physical-based and hybrid. The first group comprises calculations of vegetation indices, which are derived considering statistical or physical relations between vegetation properties and its spectral response, and also statistical-based methods, which rely on “best-fit” or regression optimization for a given training dataset [
7]. Physical methods, on the other hand, are based on detailed mathematical description of the interactions between incident energy with vegetation and background (i.e., soil), considering the major factors related to this relationship (e.g., view and illumination geometry, leaf and canopy characteristics, etc.), through radiative transfer models (RTMs). Although physical approaches have a greater generalization potential their parametrization and inversion are considerably more complex and require substantial effort to be implemented in practical frameworks. In order to mitigate these limitations, RTMs can be inverted using non-parametric regressions trained upon simulated data originating hybrid methods, which give a simplified inversion alternative to physical approaches. Despite the fast development of more advanced retrieval techniques based on the physical description of crop spectral response, vegetation indices still are a valuable alternative to perform plat traits modeling in a straightforward and robust way with applications in the assessment of crop health and phenomics [
8,
9,
10].
The timely acquisition of spectral information is a key factor for crop monitoring during the growing season concerning the detection of stress factors and assessment of their impact on the crop development [
1]. To that end, integration of data streams from different optical sensors can bring flexibility to follow crop growth over time, since acquisition can be performed using different platforms, according to environmental constraints, and measurements may be potentially coupled with other agricultural operations [
4]. In this respect, simultaneous use of point-based data or images acquired using terrestrial sensors with spatially continuous information derived from UAV, airborne or satellite systems can provide a more suitable monitoring framework than relying on a single information source, especially considering temporal resolution demanded by agricultural applications and phenotyping methodologies [
11,
12].
Multiple approaches are available to integrate datasets from optical sensors. For instance, intercalibration methods are generally applied to combine reflectance or vegetation indices derived from different satellite systems [
13,
14,
15,
16], although its application to sensors in other platforms has been evaluated as well [
17,
18]. In this context, the use of vegetation indices may simplify the transfer procedure since they are designed to mitigate background effects and changes in illumination conditions over time. Also, RTMs might be included in frameworks intending to extend the analysis to outputs of different sensors, considering the generalization potential of these methods [
6]. However, any integration approach will be potentially subject to bias introduced by the sensors and data acquisition characteristics (e.g., spectral response, data spatial support, information sampling scheme) and the interaction of these factors with illumination conditions and sun-target-sensor geometry. Therefore evaluating the impact that using different sensors, at different acquisition levels, has upon crop traits retrieval and plant development monitoring may help to indicate limitations and potentials of integrate sensing frameworks applied to the context of crop phenotyping or general vegetation growth monitoring.
The retrieval of crop traits during the growing season can be particularly challenging for organic cropping systems. For instance, in organic production of potato (
Solanum tuberosum), nitrogen and late blight (
Phytophthora infestans) are in general the most important aspects affecting the crop development, due to the constraints on the use of chemical fertilizers and synthetic pesticides [
19]. Nutrient shortage and pathogen development can occur simultaneously with other stress factors, increasing the complexity of the system. In addition, the estimation of vegetation properties can be particularly challenging in initial stages of the crop development while canopy is still largely open and considerable amount of background can affect the signal measured by a given sensor [
20]. These factors, together with potential variations in the illumination condition and sun-target-sensor geometry between different data acquisitions [
21], increase the difficulty of crops traits retrieval. Despite that, continuous monitoring of crop development in organic production can be useful to stablish management according to the variability observed in the field, concerning, for example, fertilization and varietal choices. However, research focusing on the application of precision agriculture practices in organic cropping is still scarce [
22], and solutions suitable to this particular cultivation system need to be established.
Therefore, the present study has the following objectives: (a) evaluate the accuracy of simple retrieval methods (i.e., calculation of vegetation indices from narrow band spectral data coupled with linear regression) for predicting organic potato traits during the growing season, based on UAV hyperspectral data; (b) compare results obtained using UAV imagery with those derived from ground-based measurements concerning crop traits estimation and discriminative potential of the information derived, in this case focusing on late blight development; (c) intercompare data derived from both acquisition levels (i.e., UAV- and ground-based) in order to evaluate implications that a potential integration of different sensing approaches may have in agricultural applications or phenotyping frameworks.
4. Discussion
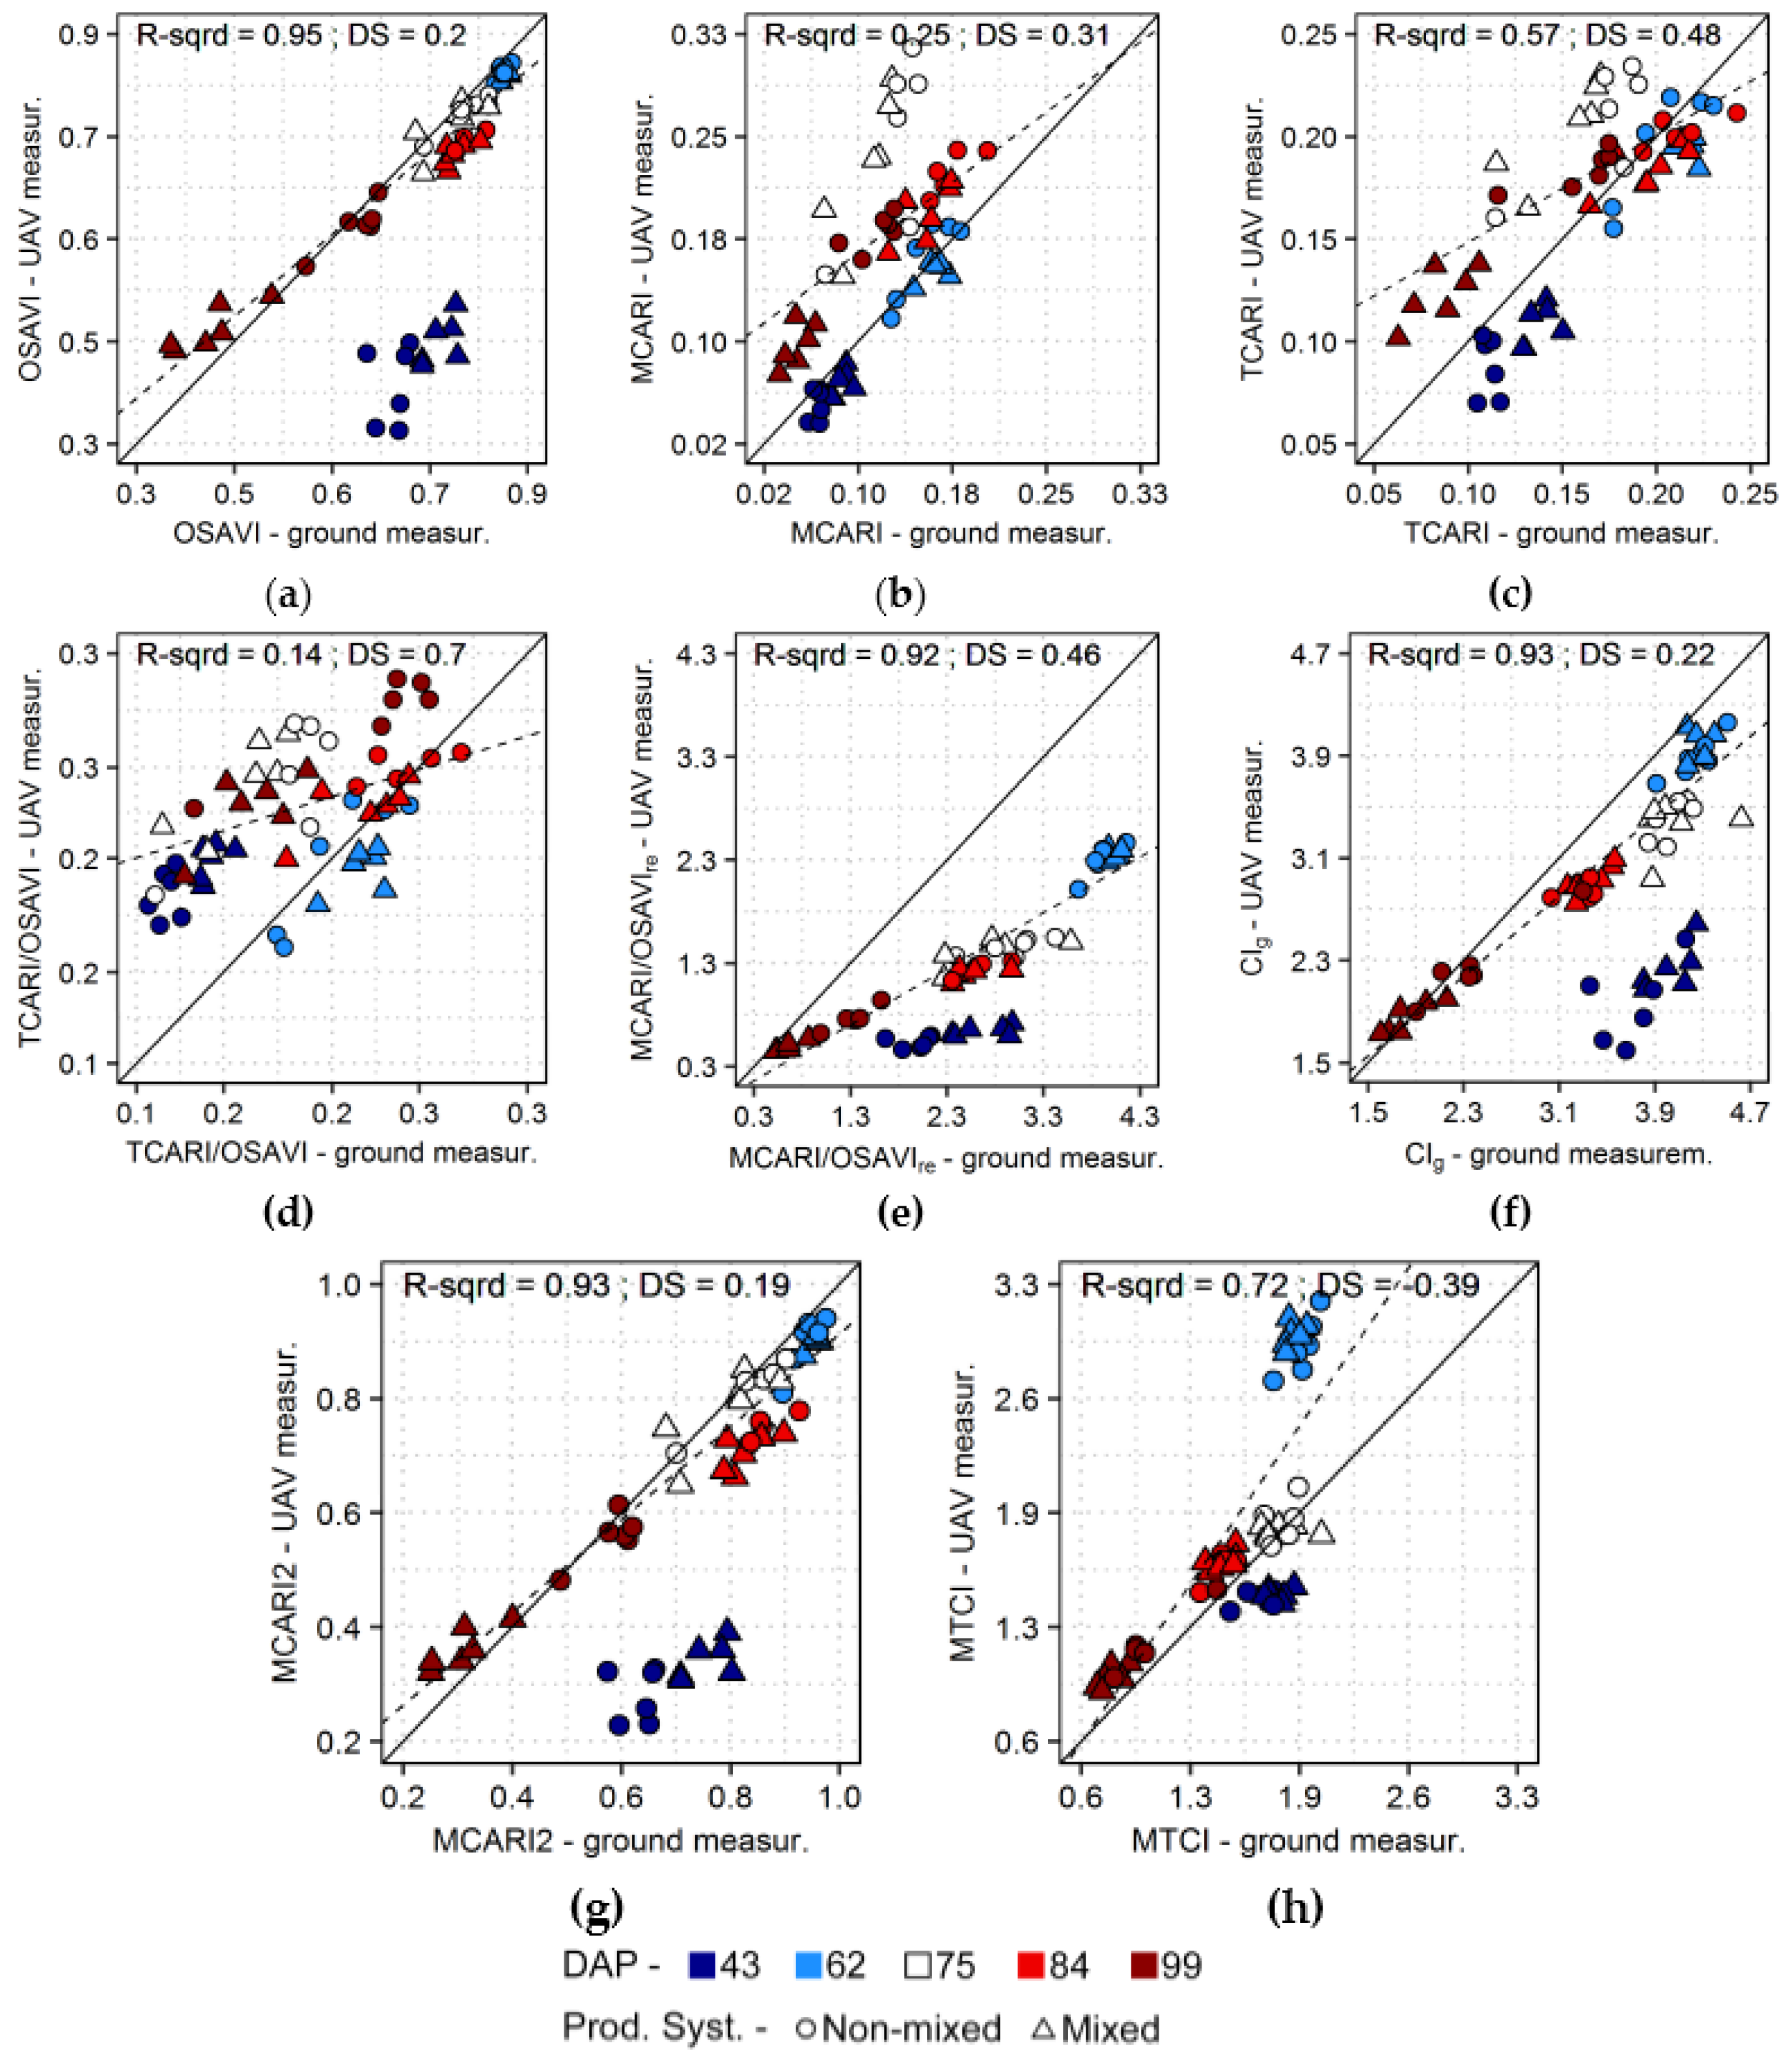
Although models derived from measurements of the different sensors resulted in comparable prediction accuracies (
Section 3.2,
Table 3 and
Table 4), and intercomparison of vegetation indices calculated from UAV and ground-based data indicated that integration of the sensors streams is possible in some cases (
Section 3.3,
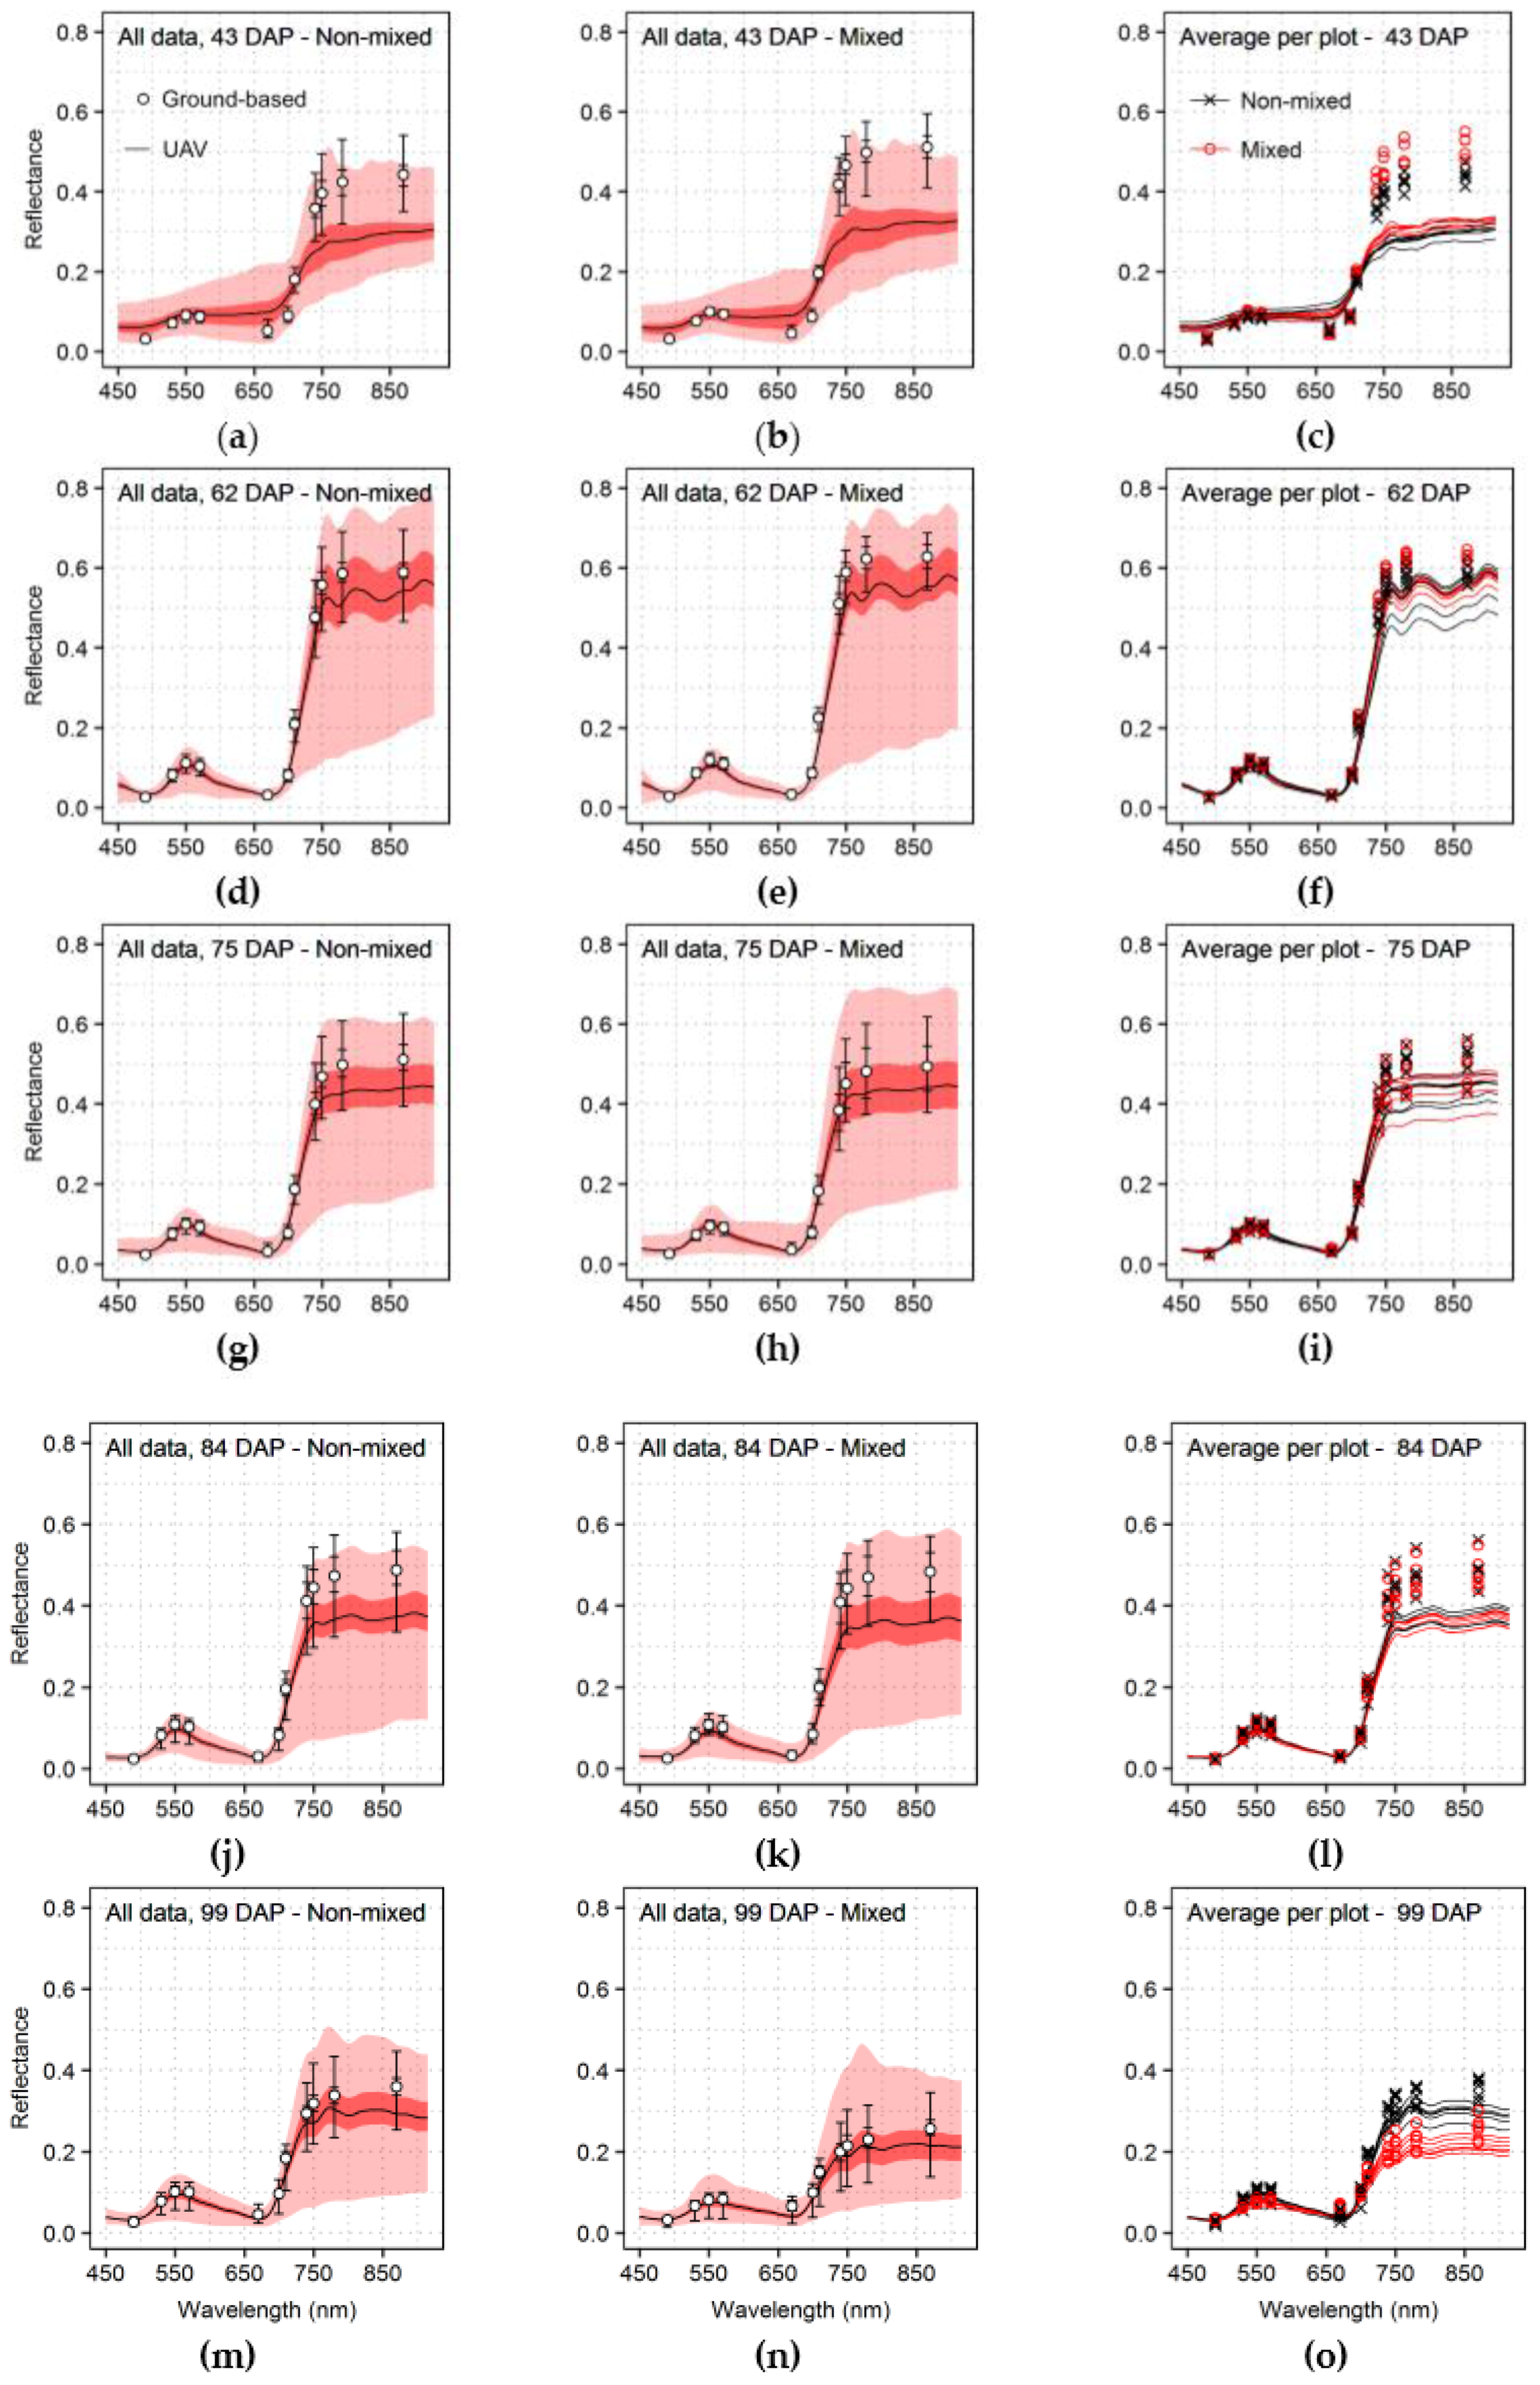
Figure 11), differences could be observed between sensing solutions, especially concerning the first and second data acquisitions (43 and 62 DAP). These differences between datasets can be related to intrinsic sensor characteristics, data spatial support, information sampling and environmental conditions during the measurements.
Spectral resolution and spectral response of the sensors probably had low impact in the methodology tested here since bands used to derive vegetation indices from UAV and ground-based measurements (
Table 2) are comparable (i.e., same or very close bands central wavelengths position and FWHM). Also, reflectance values were derived differently for both sensing approaches. For UAV data a reference panel was used to calculate reflectance factors, as described in
Section 2.2, while ground-based reflectance was retrieved through simultaneous acquisition of up-welling radiance and down-welling irradiance, which was measured by a cosine-corrected diffusor [
4,
8,
18]. Despite that, previous studies reported comparable outputs using handheld sensors and reflectance readings calculated through both methods [
18], and therefore differences due to this factor are supposed to be small considering the methods evaluated here.
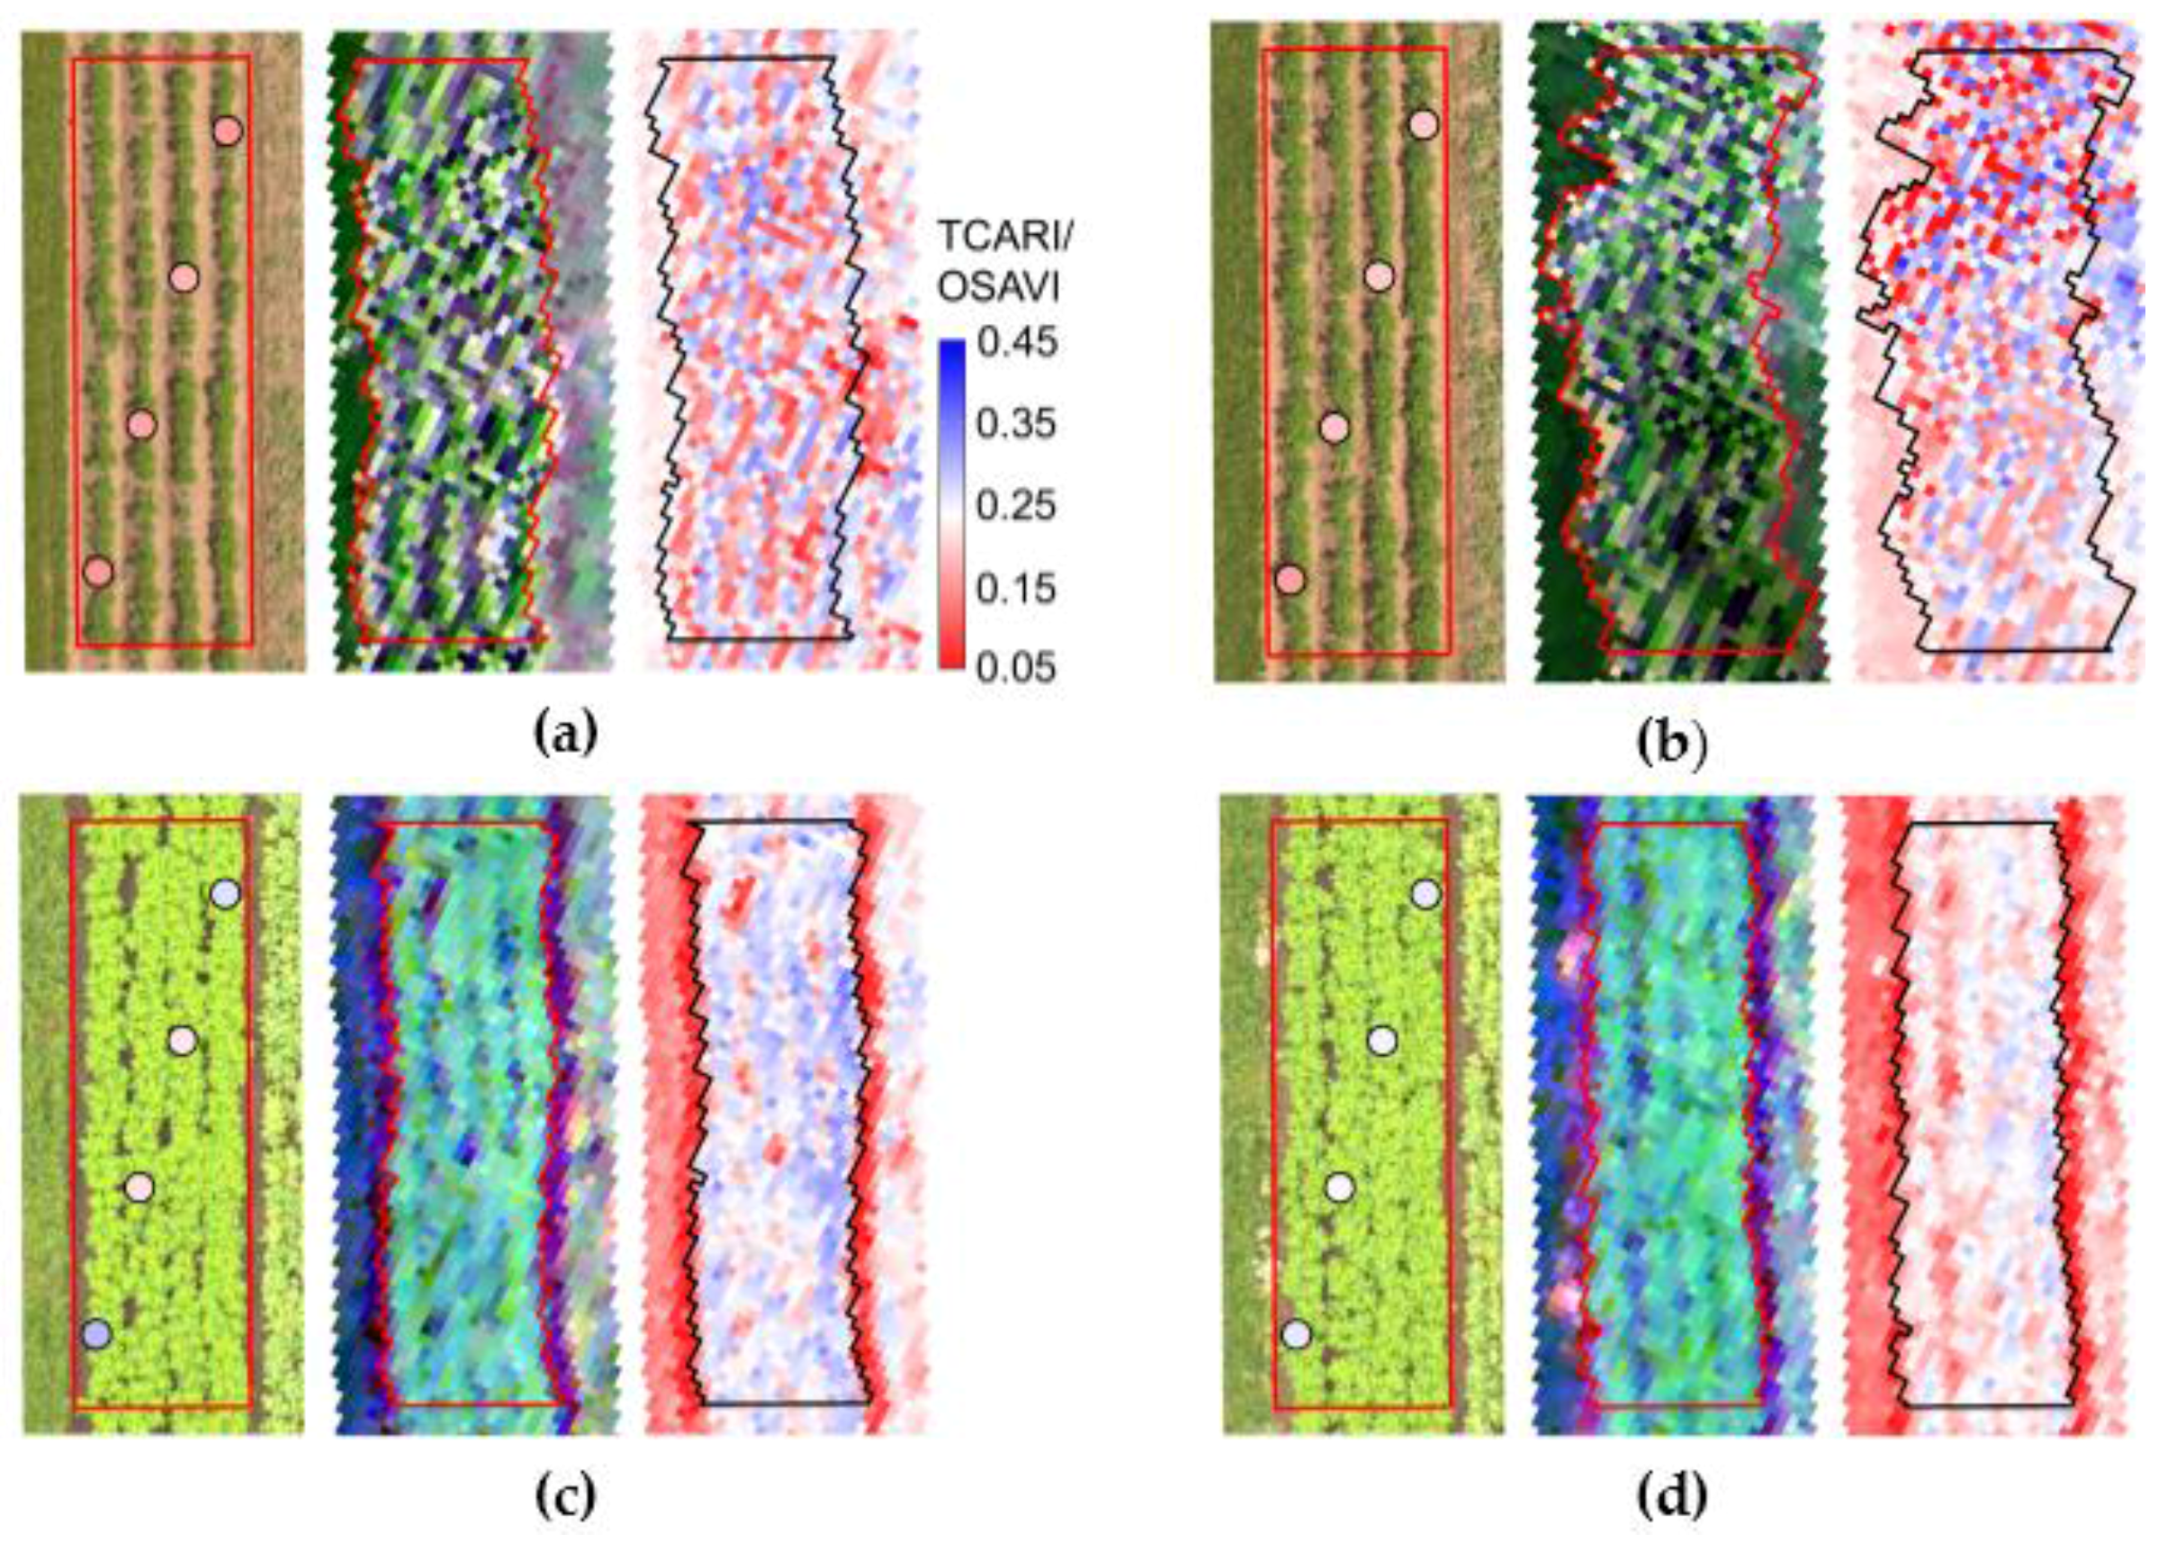
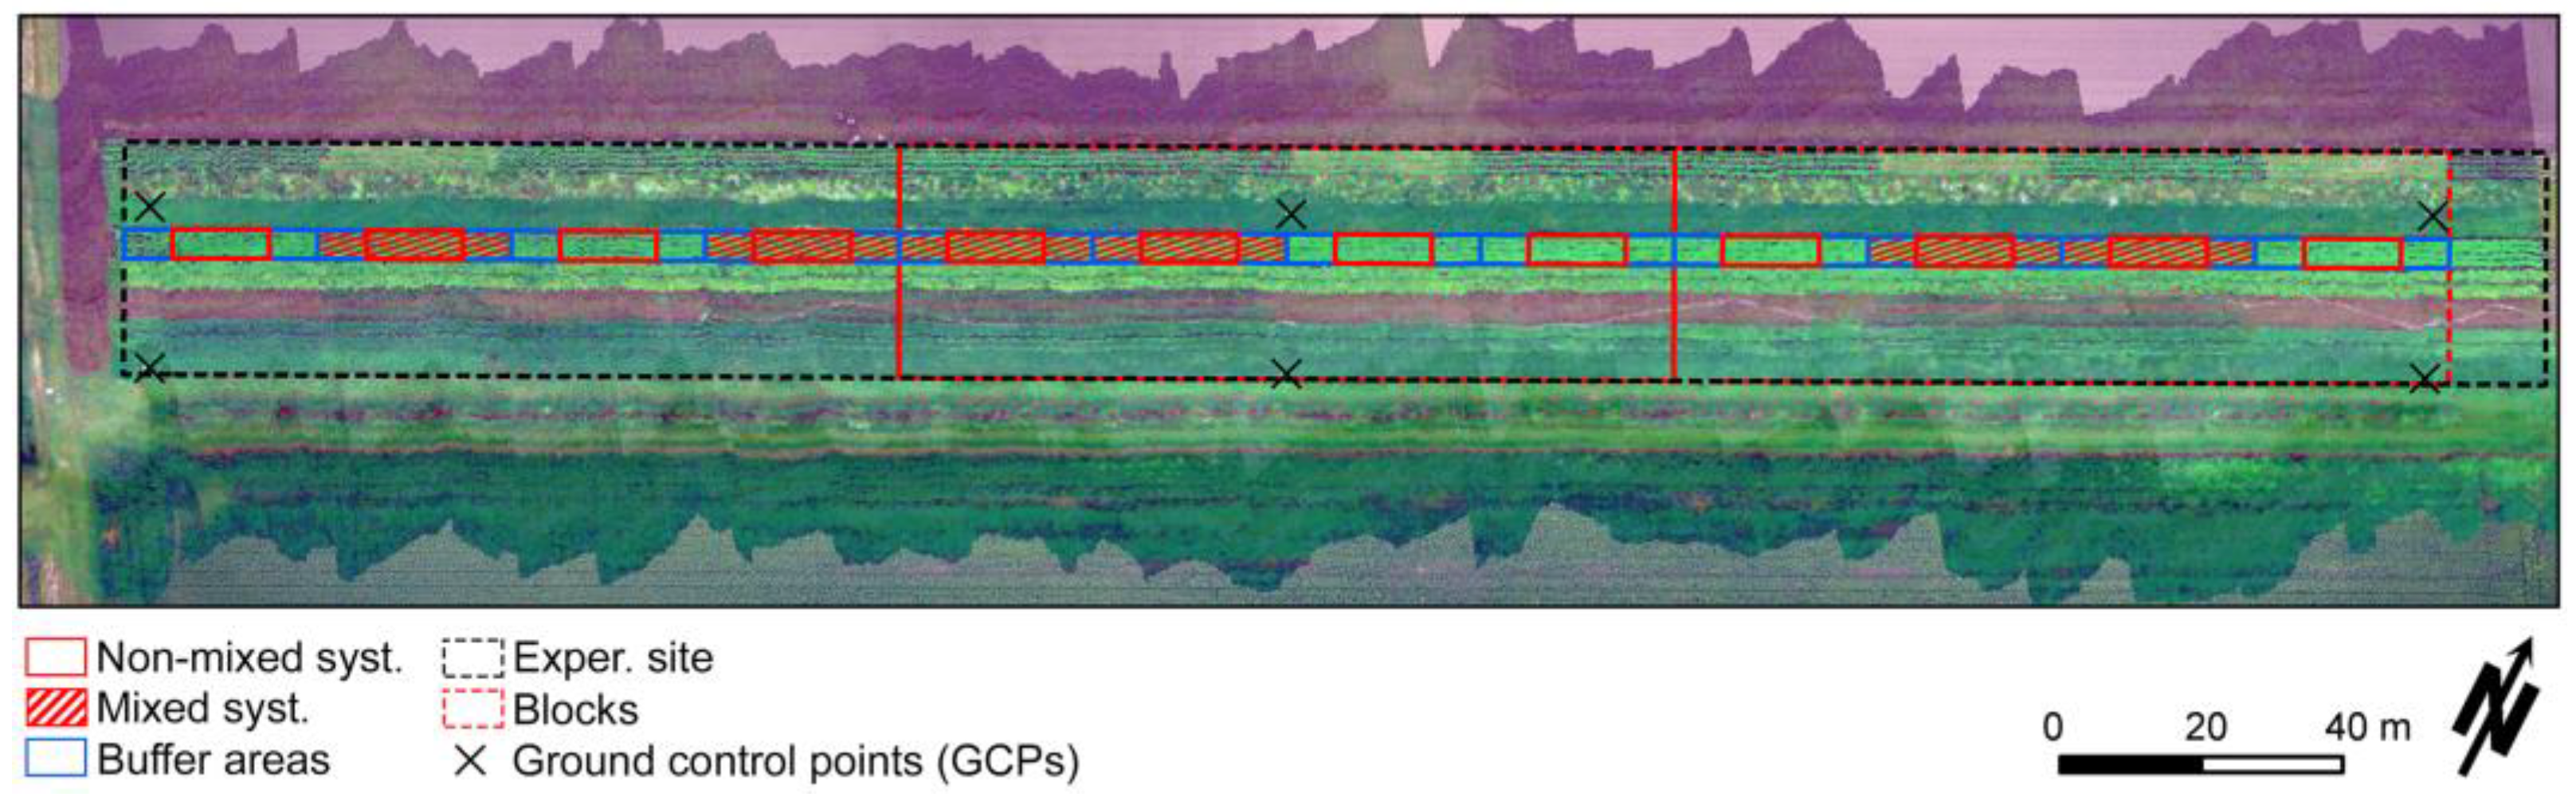
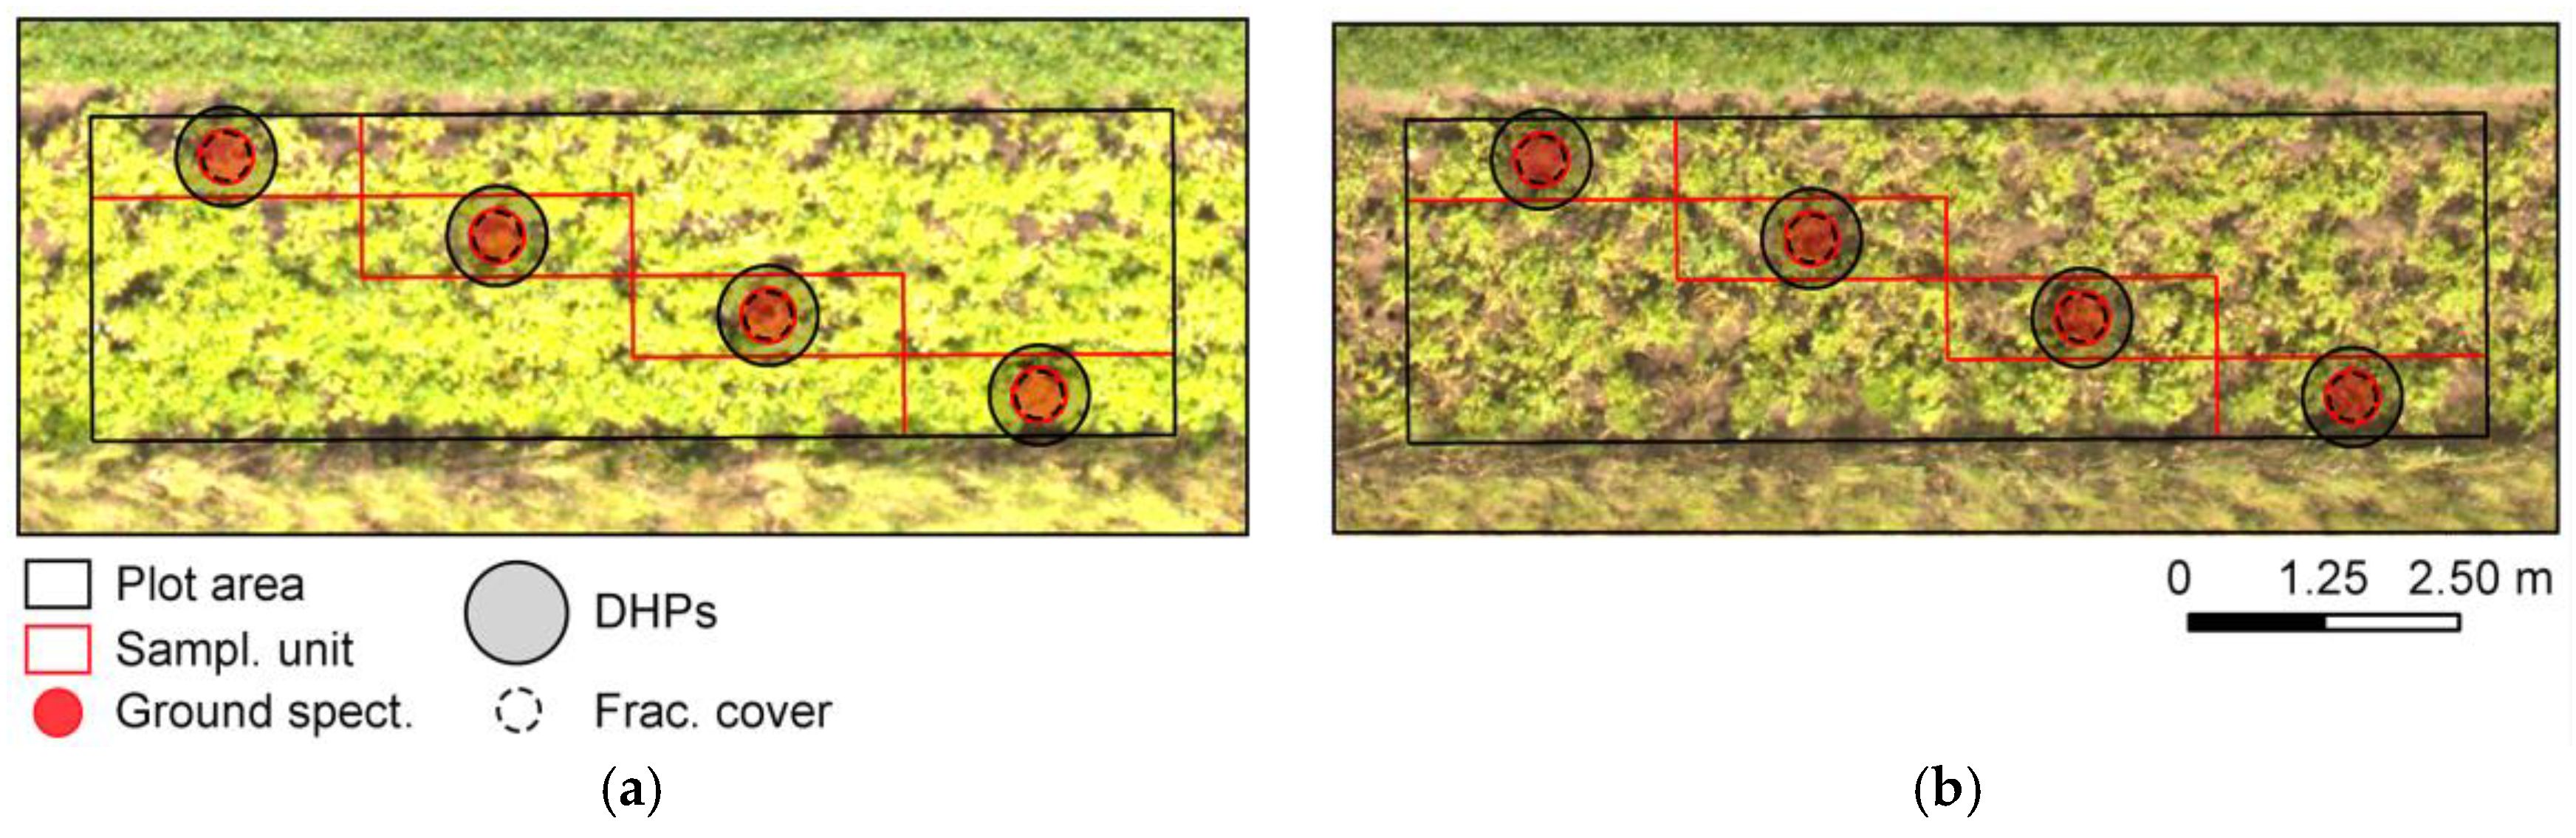
Ground-based reflectance corresponded to slightly larger footprint (approximately 0.5 m diameter) than the pixel size (approximately 0.2 m, while flying at 80 m height) obtained using UAV measurements. Also spectra were acquired directly over the crop rows at four points inside each plot during ground-based readings (
Figure 2), while UAV data represented most of the plot area, after spectra extraction (
Figure 12). According to results presented in
Section 3.1,
Section 3.2 and
Section 3.3, these are probably the main factors causing inconsistencies between sensors outputs, due to their impact on the information sampled and changes in the contribution of background or illumination conditions to the reflectance measured. Other authors, comparing ground-based and UAV-carried spectrometers, indicated that a combination of factors, including footprint mismatch (i.e., differences in the area measured), may cause differences in the reflectance values obtained, even if data is acquired in the same date, with comparable sensor footprints and over the same areas [
82,
83,
84]. Conversely, Aasen et al. [
85] reported comparable reflectance factors derived from ground-based and UAV measurements corresponding to reference targets, but in this case changes concerning sensor footprint probably have lower impact due to the relative uniformity of these surfaces.
On the other hand, authors focusing on the calculation of vegetation indices for characterization of crop growth indicate that robust formulations, like NDVI and OSAVI, result in very similar values for data measured in different acquisition levels for the same areas [
11,
83,
86]. Here we demonstrate that some vegetation indices designed to be derived from narrow band spectra, like MCARI/OSAVI
re and CI
g (
Section 3.3,
Figure 11), also may provide equivalent outputs between sensor systems for specific period of the growing season, despite differences concerning information sampling, illumination conditions and sun-target-sensor geometry over time. This is an important aspect to consider if one is interested in the integration of different sensing sources using simple approaches like vegetation indices, while benefiting from improved retrieval performance using formulations designed for narrow band spectra. In some cases, even simple linear transfer functions could be used to combine outputs of different sensors, like proposed eventually to integrate data from different satellite systems [
13,
15], provided that the function itself (i.e., bias from values derived from one sensor in relation to another) is known (e.g., from dataset acquired in previous years) and that the relationship observed is stable over time.
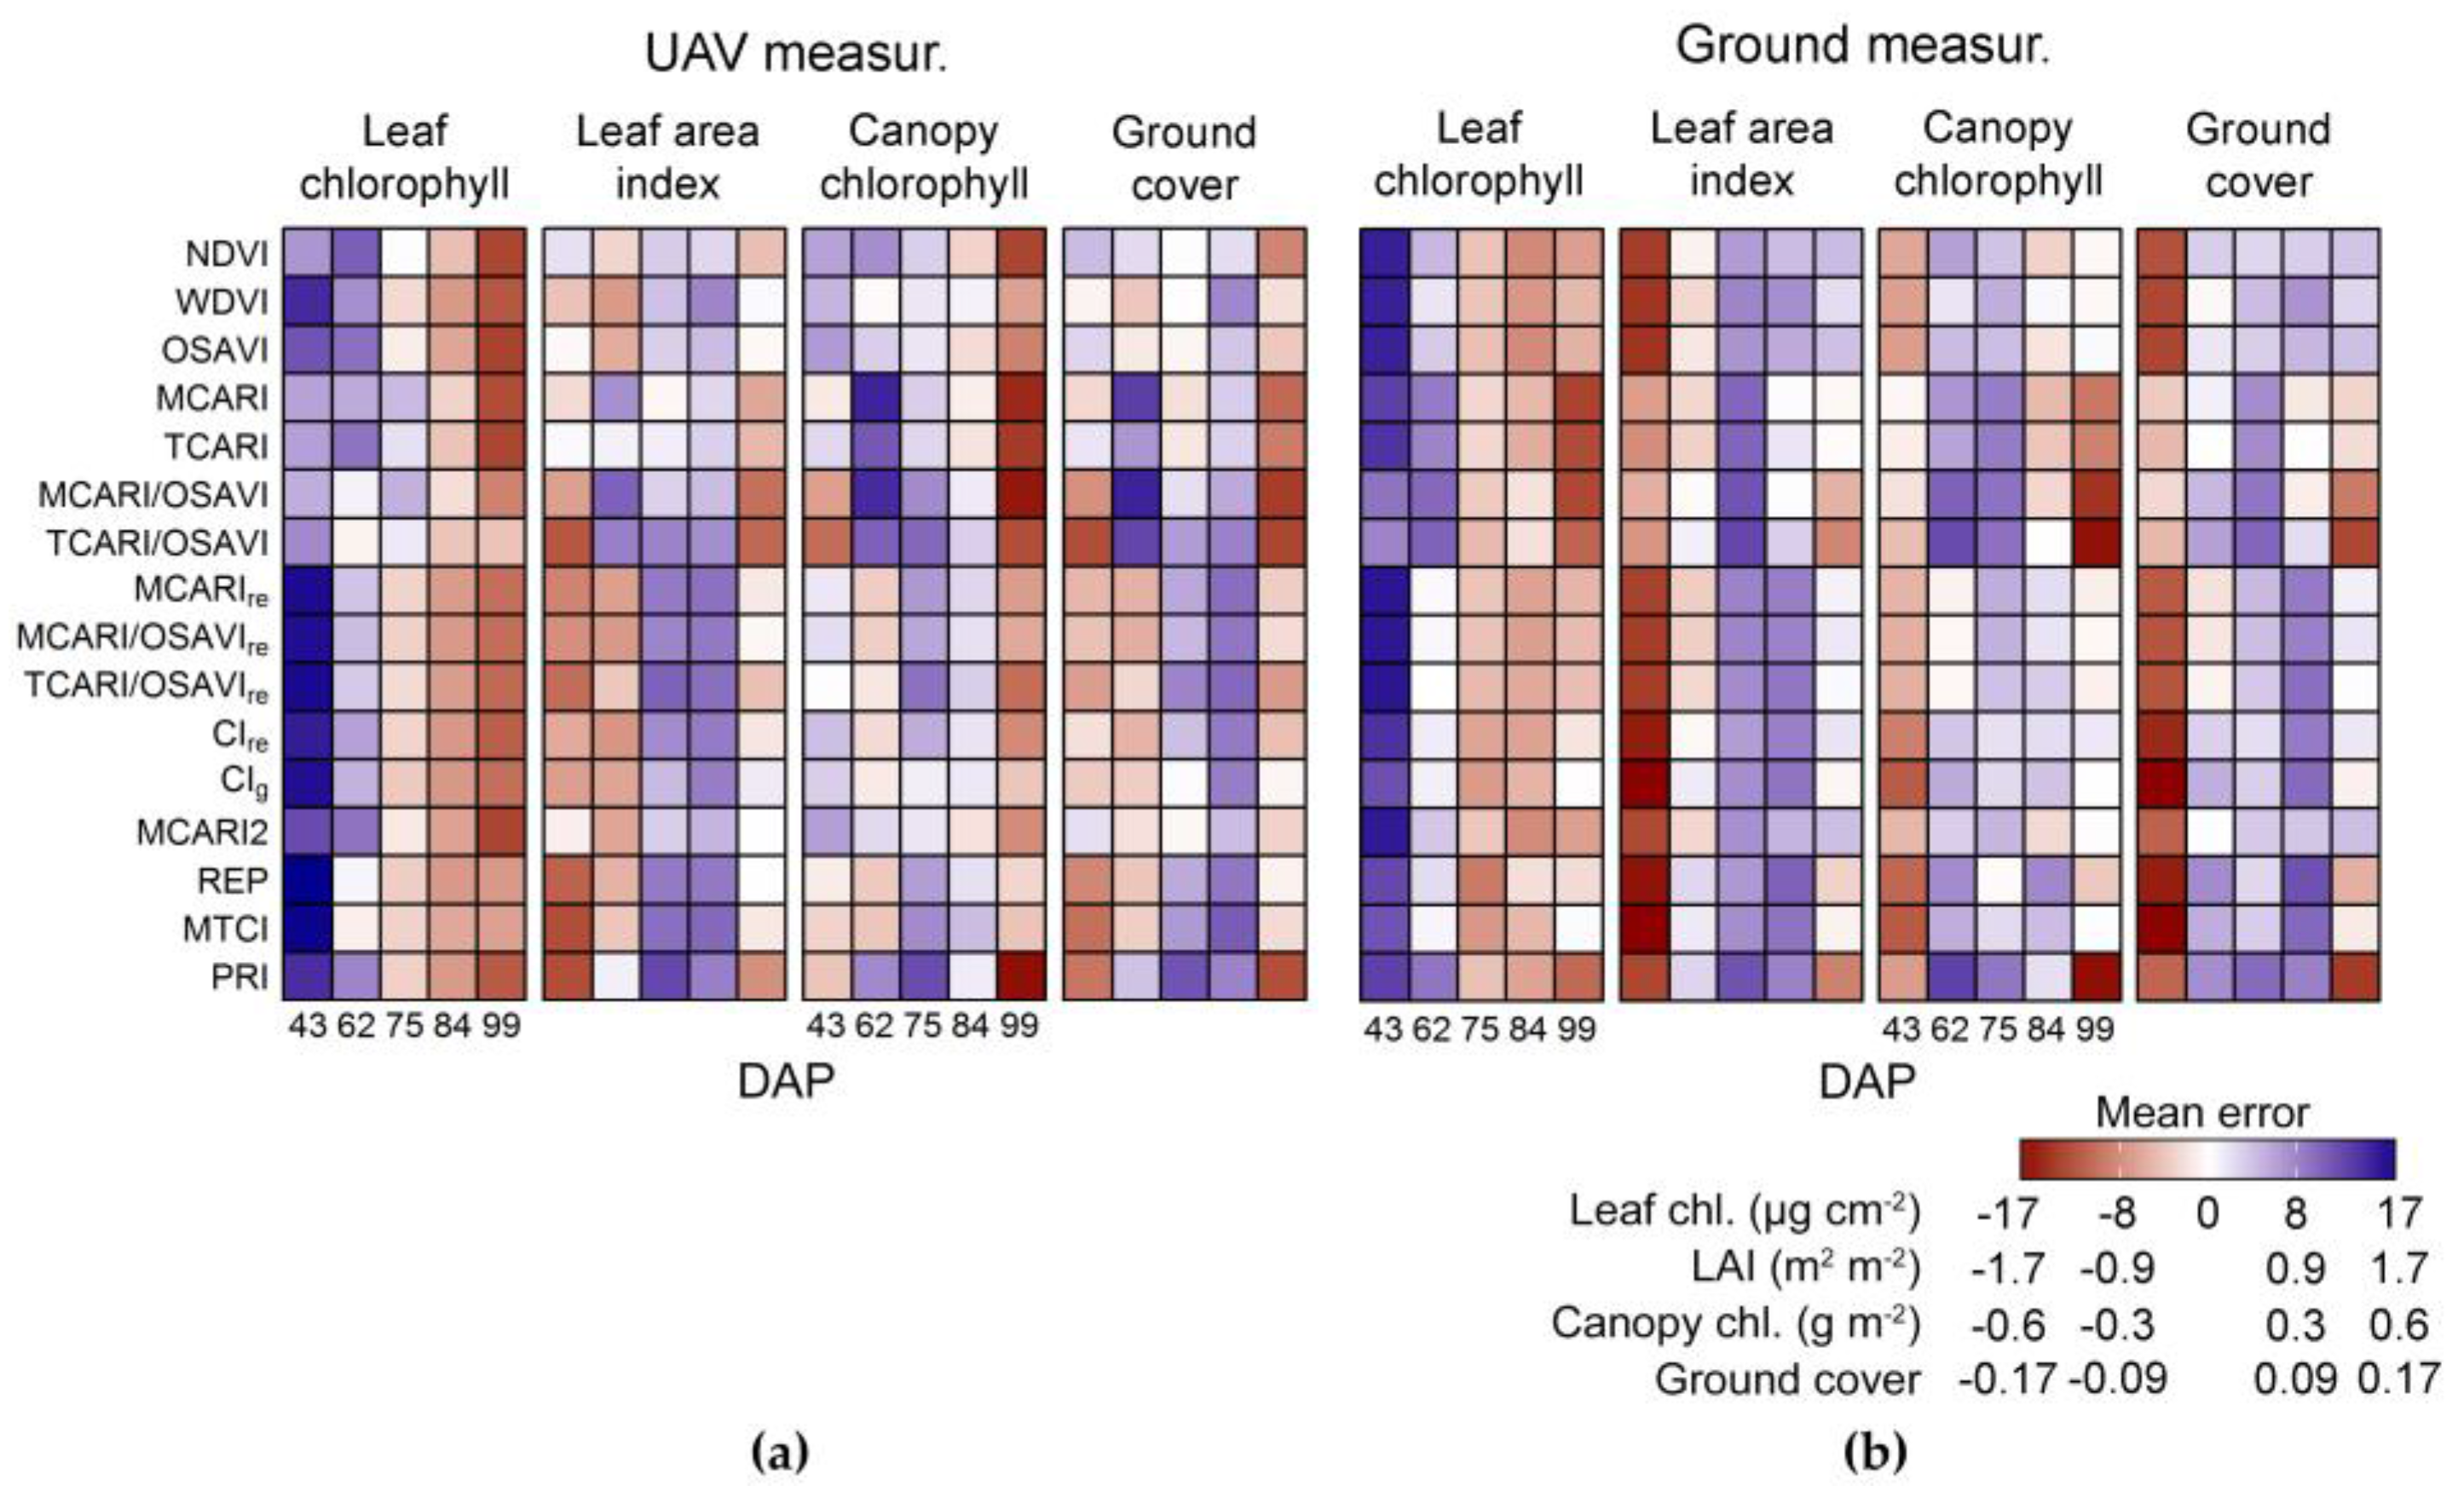
Predictions of crop properties were more accurate for observations acquired latter in the season, after canopy development reached its maximum (
Section 3.2,
Table 3 and
Table 4,
Figure 10). Other authors, using ground-based or UAV measurements also arrived to similar conclusions [
77,
87], indicating that lower background effects and more homogeneous canopy distribution, which are generally characteristics of crops in the middle to late season period, provided better conditions for modelling crop traits. Similar results may also be observed in the assessment of crop properties through RTMs inversion, especially for models including a simplified representation of the vegetation canopy, not taking into account row structure arrangement [
88].
Inaccurate crop traits estimation during early season may be detrimental, for instance, to the evaluation of varieties vigor in phenotyping studies [
89]. On the other hand, relatively accurate middle to late season retrieval of vegetation properties may still be useful to optimize nitrogen side-dress rates, besides its potential application in diseases assessment and yield estimation [
10,
90,
91,
92,
93]. Particularly late blight management may benefit from middle to late season monitoring, since climate (i.e., mild-temperatures with high humidity) coupled with canopy closure provide ideal conditions for the pathogen development during this period [
72,
94,
95,
96]. In the context of organic production, the most important practices available for in season management of late blight are the application of copper fungicides, which will be banned from 2018 onwards in the European Union, and desiccation of above ground biomass [
19,
96,
97]. Although desiccation using propane burners, after a certain disease incidence threshold, reduces sporangia viability and its spread to nearby fields, it is not advantageous to the producer since yield increases by delaying vine desiccation, due to extra growing days in a period of rapid tubers bulking, are superior than the production loss caused by the pathogen infection until approximately 60% of disease severity [
97]. Therefore, early desiccation is mandatorily implemented as national policy to control disease spread, for example in The Netherlands (at approximately 7% of the leaf surface affected), and becomes therefore an important limiting factor for the production. Concerning nitrogen management, organic crops depend mainly on crop rotation and organic fertilization, which are mostly out of season practices [
19]. Although few actions are available for in season nutrient management, early within field detection of late blight might allow site-specific control of infection through local use of propane burner or mechanical destruction of affected plants, for example, in areas around the sites affected. In general, crop development monitoring may assist implementation of cultural practices when needed and help to adapt cultivation of future crops considering site-specific characteristics. For instance, intercropping with non-hosts and more resistant varieties, eventually in mixture with others as well, can be alternatives to improve crop protection in organic production of potato, while optical sensing approaches may help to evaluate optimal strip widths for prevention of across strip infection and optimal planting densities of variety mixtures, although these practices need to be evaluated considering different aspects of the crop production (e.g., characteristics of the cultivars to be used, like potential yield and tubers quality; productivity reduction due to smaller surfaces cultivated with the main crop of interest or more productive varieties; etc.) [
96,
98]. Struik [
72] discuss different physiological pathways that can be explored to “escape” late blight infestation, advancing the crop cycle or the tuber bulking, although the author affirms that these practices can only slightly reduce the impact related to disease and indicate that better varieties are a most promising alternative to combat late blight in organic potato cultivation. Lammerts van Bueren et al. [
97] indicate that the participation of farmers in the selection of varieties more suitable for organic production can help to complement the comparatively low amount of breeding outputs offered by companies to organic potato producers. In this context, field phenotyping solutions, including optical sensors, can help farmers to better evaluate the varieties under selection. For example, Tiemens-Hulscher et al. [
99] evaluated the development of different cultivars, under distinct nitrogen fertilization regimes, based on ground cover estimated through field assessments over the season, an approach that could be adapted to UAV measurements considering the relatively accurate results described here (
Table 3 and
Table 4). Also, activities related to weed management may benefit from continuous field monitoring in systems under conventional or organic cultivation, despite not being an aspect evaluated in this study. Early or late weed detection in the growing season based on spectral information in the optical domain may be possible and of interested for in season management and out of season cultivation planning [
100,
101]. Although in this case the sensing effort does not concern directly the crop monitored, weed may have different biochemical and biophysical properties and their development might affect reflectance measurements over an area [
102]. Despite that, current research on approaches applied to weed management in agricultural context, especially with UAV data, seem to focus on high spatial resolution imagery and different features extracted from a few spectral bands, while integrating hyperspectral data in monitoring methodologies could provide an increased feature space for infestation detection and intensity assessment, in particular for approaches to be applied later in the growing season [
103,
104,
105].
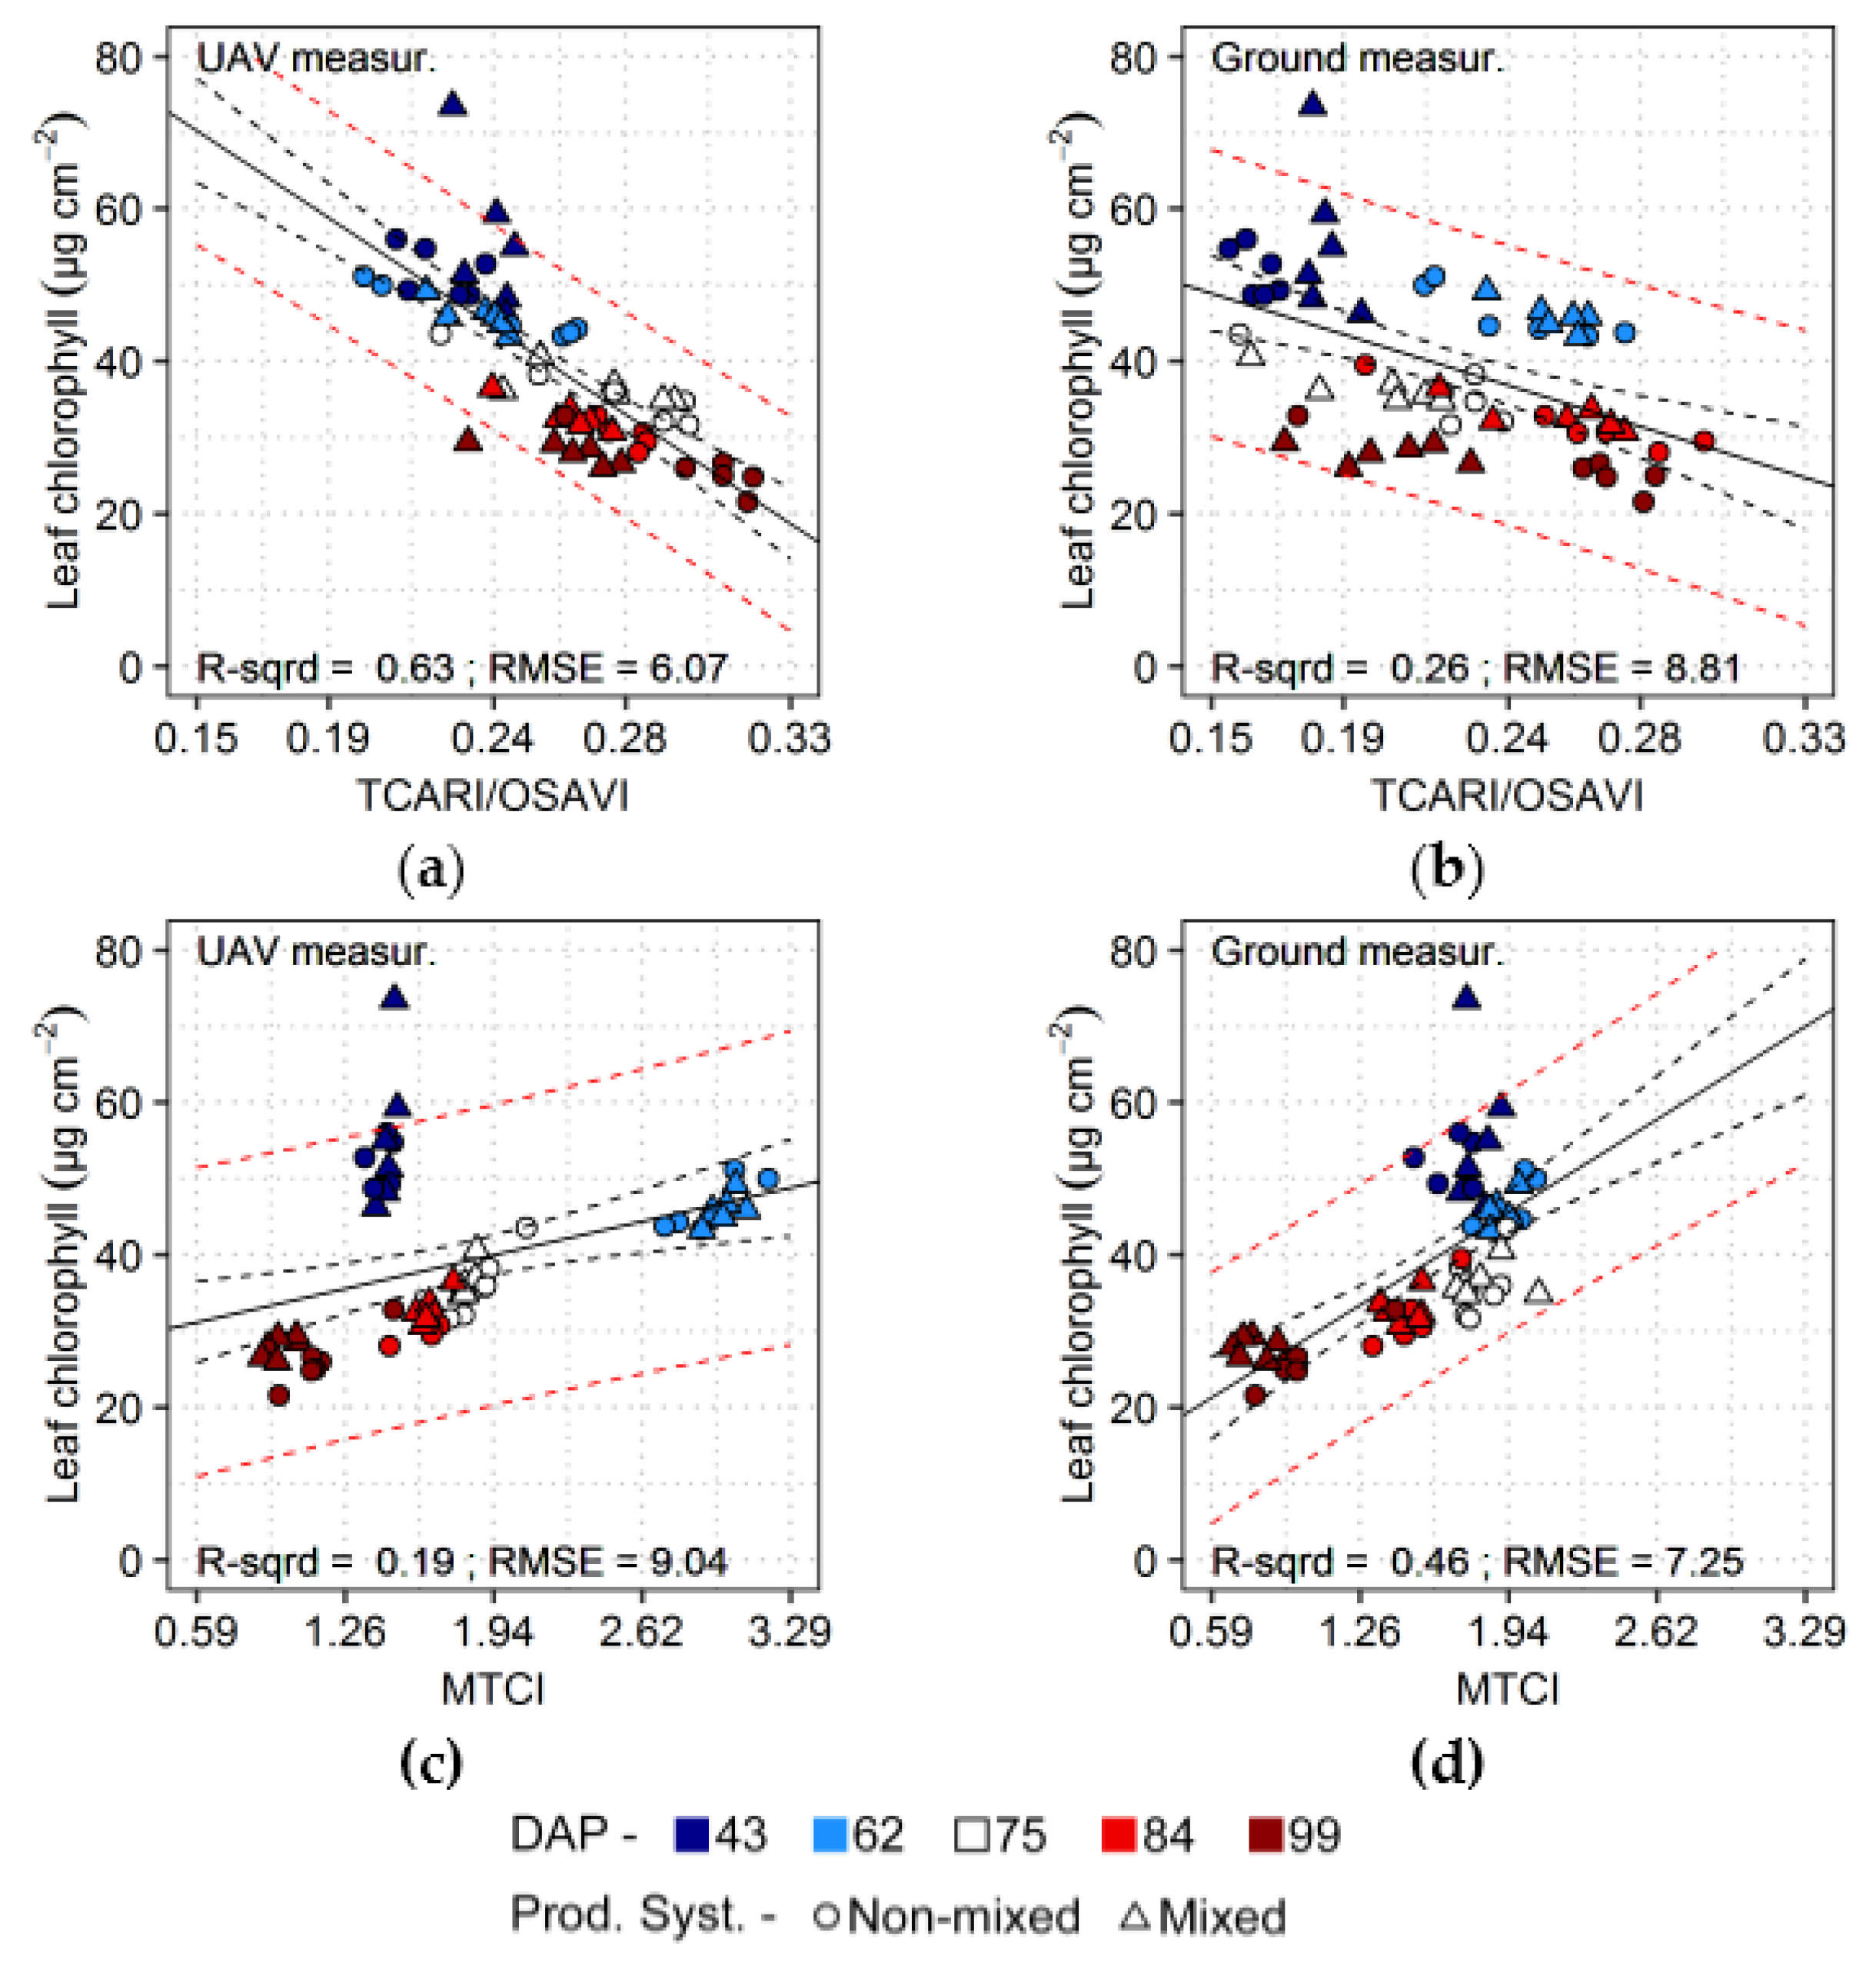
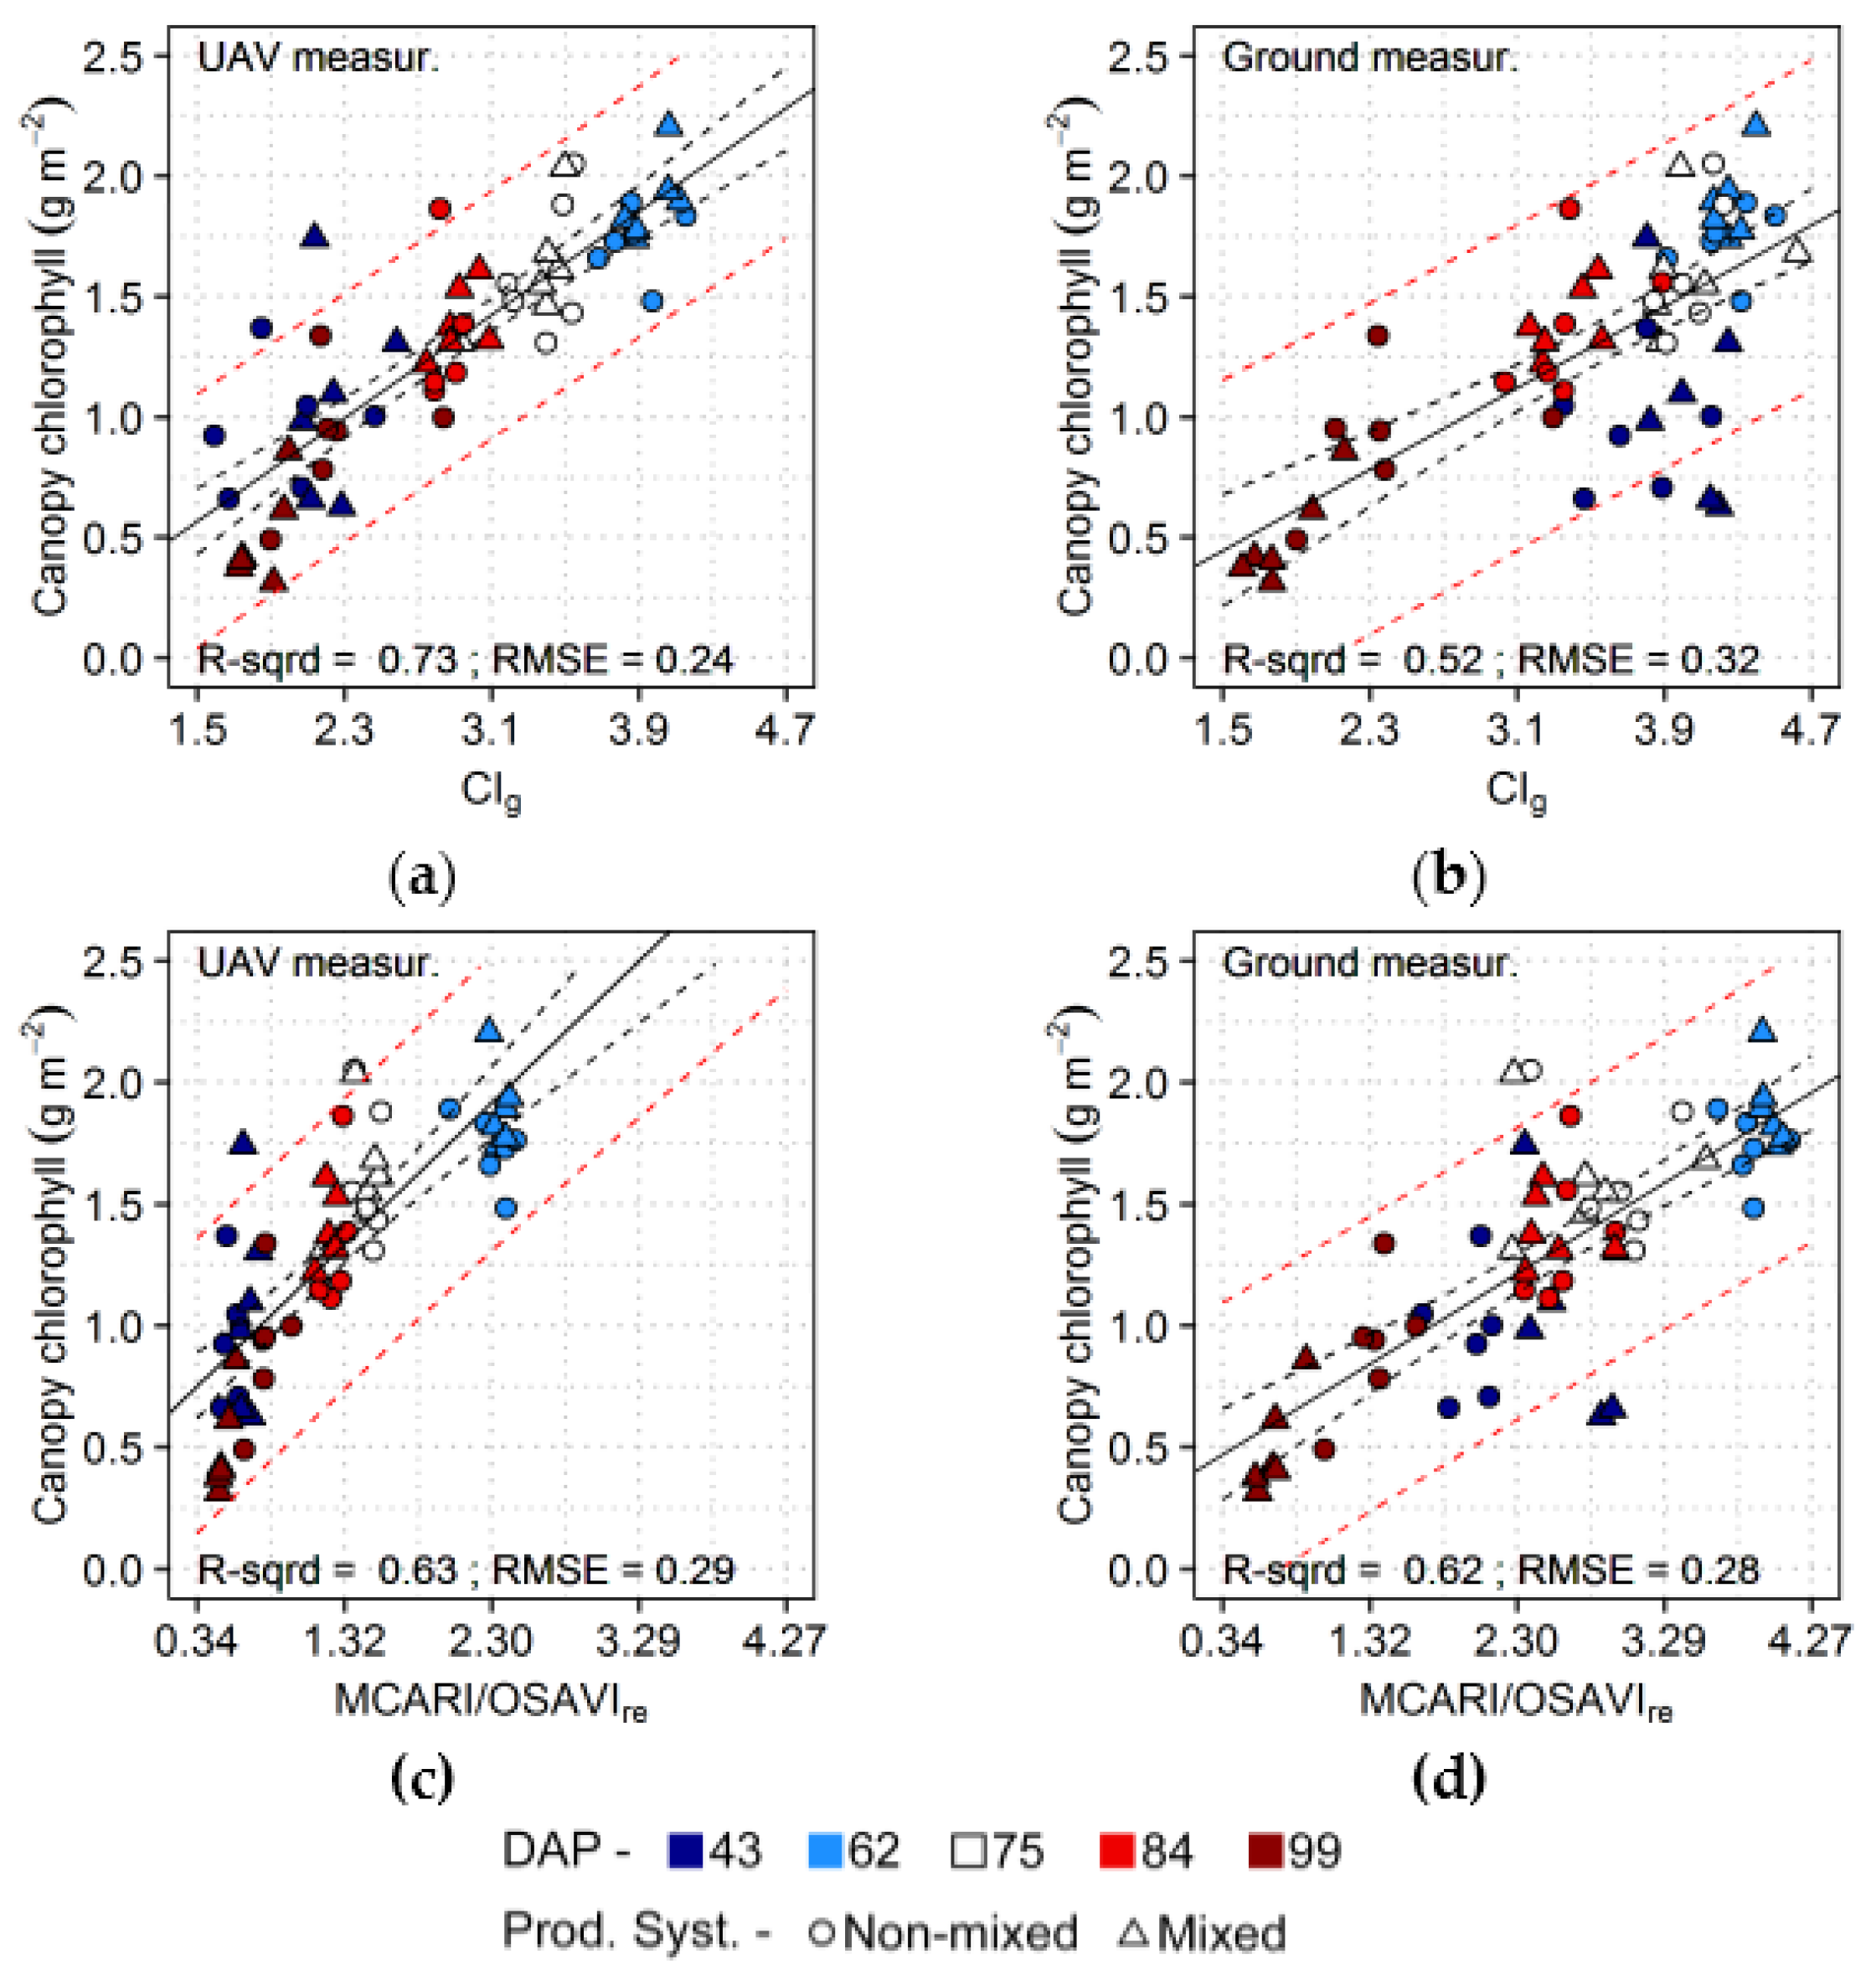
Best prediction for different crop traits were achieved using different vegetation indices, as presented in
Section 3.2 (
Table 3 and
Table 4). Retrieval of leaf and canopy chlorophyll content was generally more accurate with indices including bands in the red edge, like MTCI and TCARI/OSAVI
re, or using formulations designed for narrow spectral bands in the visible region in contrast to bands in the near-infrared, like CI
g. Other studies also report similar results using ground-based, UAV, airborne and satellite derived datasets in comparable scales to the data collected in this study (i.e., at field or plot level) [
4,
8,
12,
79,
90,
106,
107,
108], indicating that these indices are good options for retrieval and monitoring of leaf and canopy chlorophyll content using simple quantification approaches. More specifically, retrieval based on proximal and remote sensing described by [
4,
8,
12,
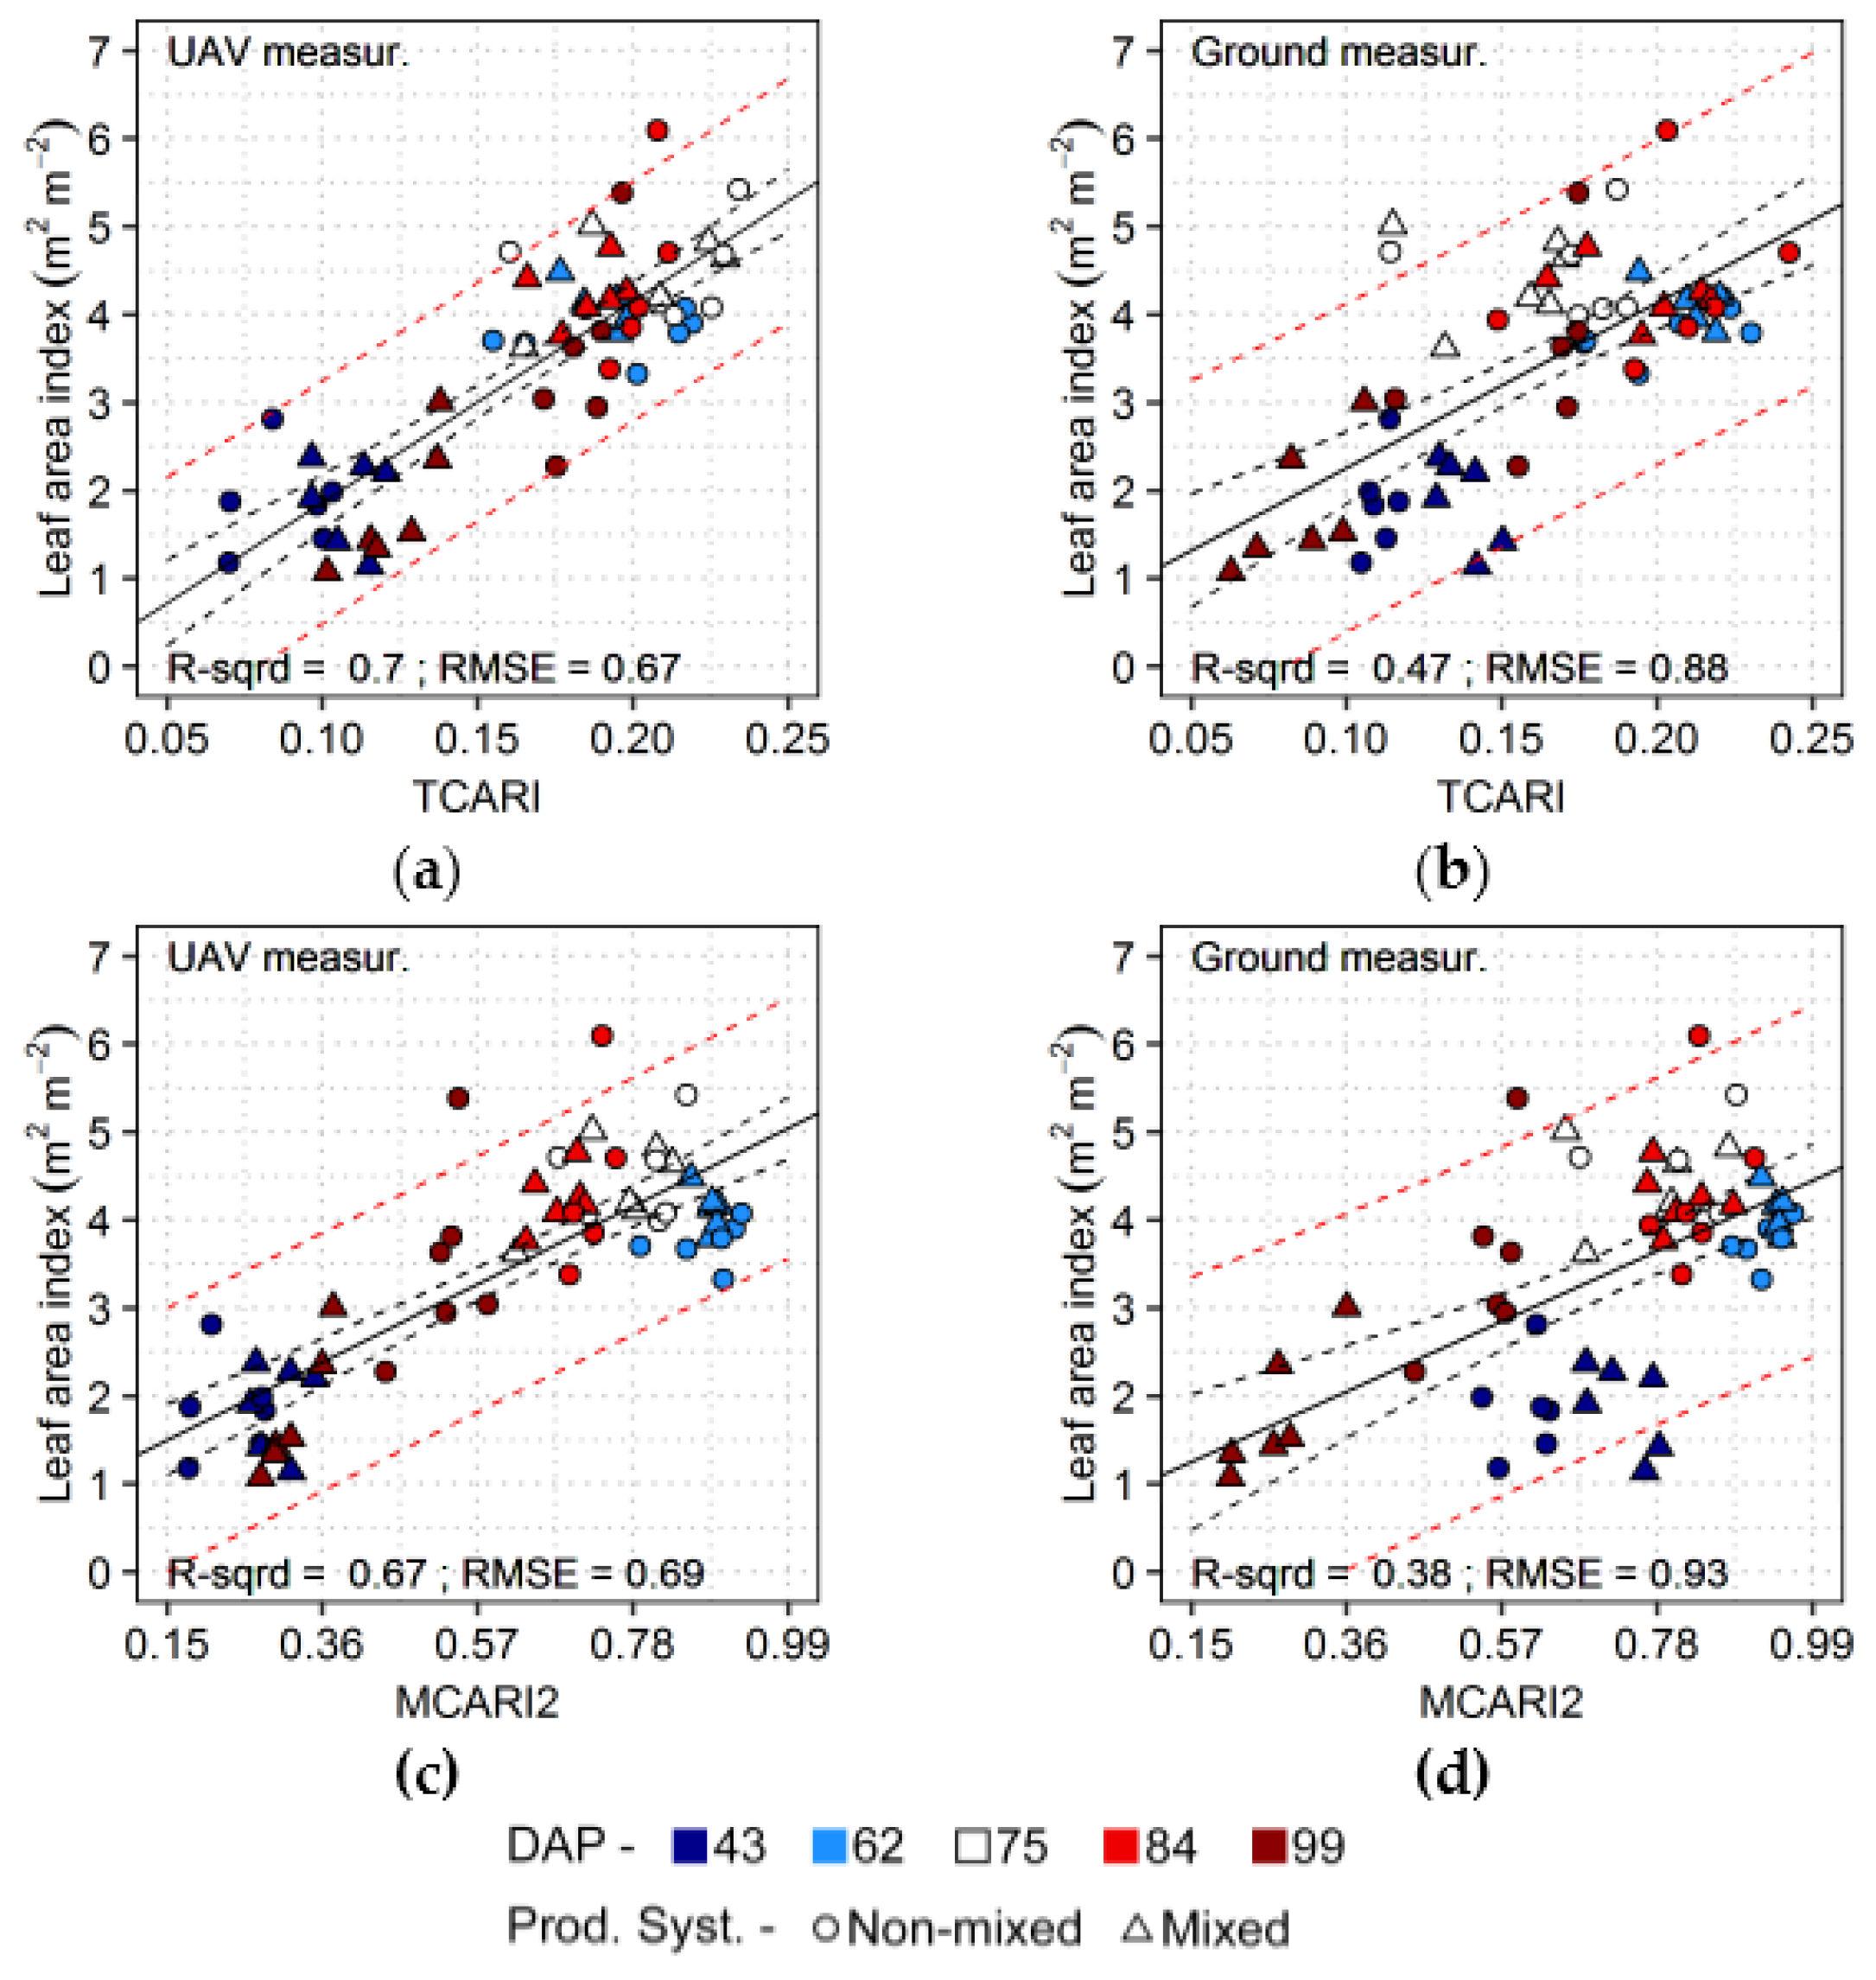
90] in studies with potato help to confirm trends observed here, concerning leaf and canopy chlorophyll estimations. Conversely, leaf area index was unexpectedly better predicted through indices not especially designed to quantify this trait, like MCARI and OSAVI. This may be related to the fact that the crop canopy was not completely closed at any moment during the growing season (i.e., maximum ground cover of approximately 90%) and leaf area index variation was very small after a certain level of canopy development was reached, probably resulting in low model sensitivity to saturation issues of indices not optimized to leaf area estimation. Also, leaf area index is a difficult trait to estimate in potato even through indirect methods used as ground truth in remote sensing studies (e.g., DHPs, plant canopy analyzer, etc.), due to the large amount of stems and to the canopy configuration. Despite that, R
2 (0.5–0.6) and RMSE (0.6–0.7 m
2·m
−2) obtained using vegetation indices derived from UAV and ground-based reflectance are comparable to those reported in other studies [
12,
79,
87,
106,
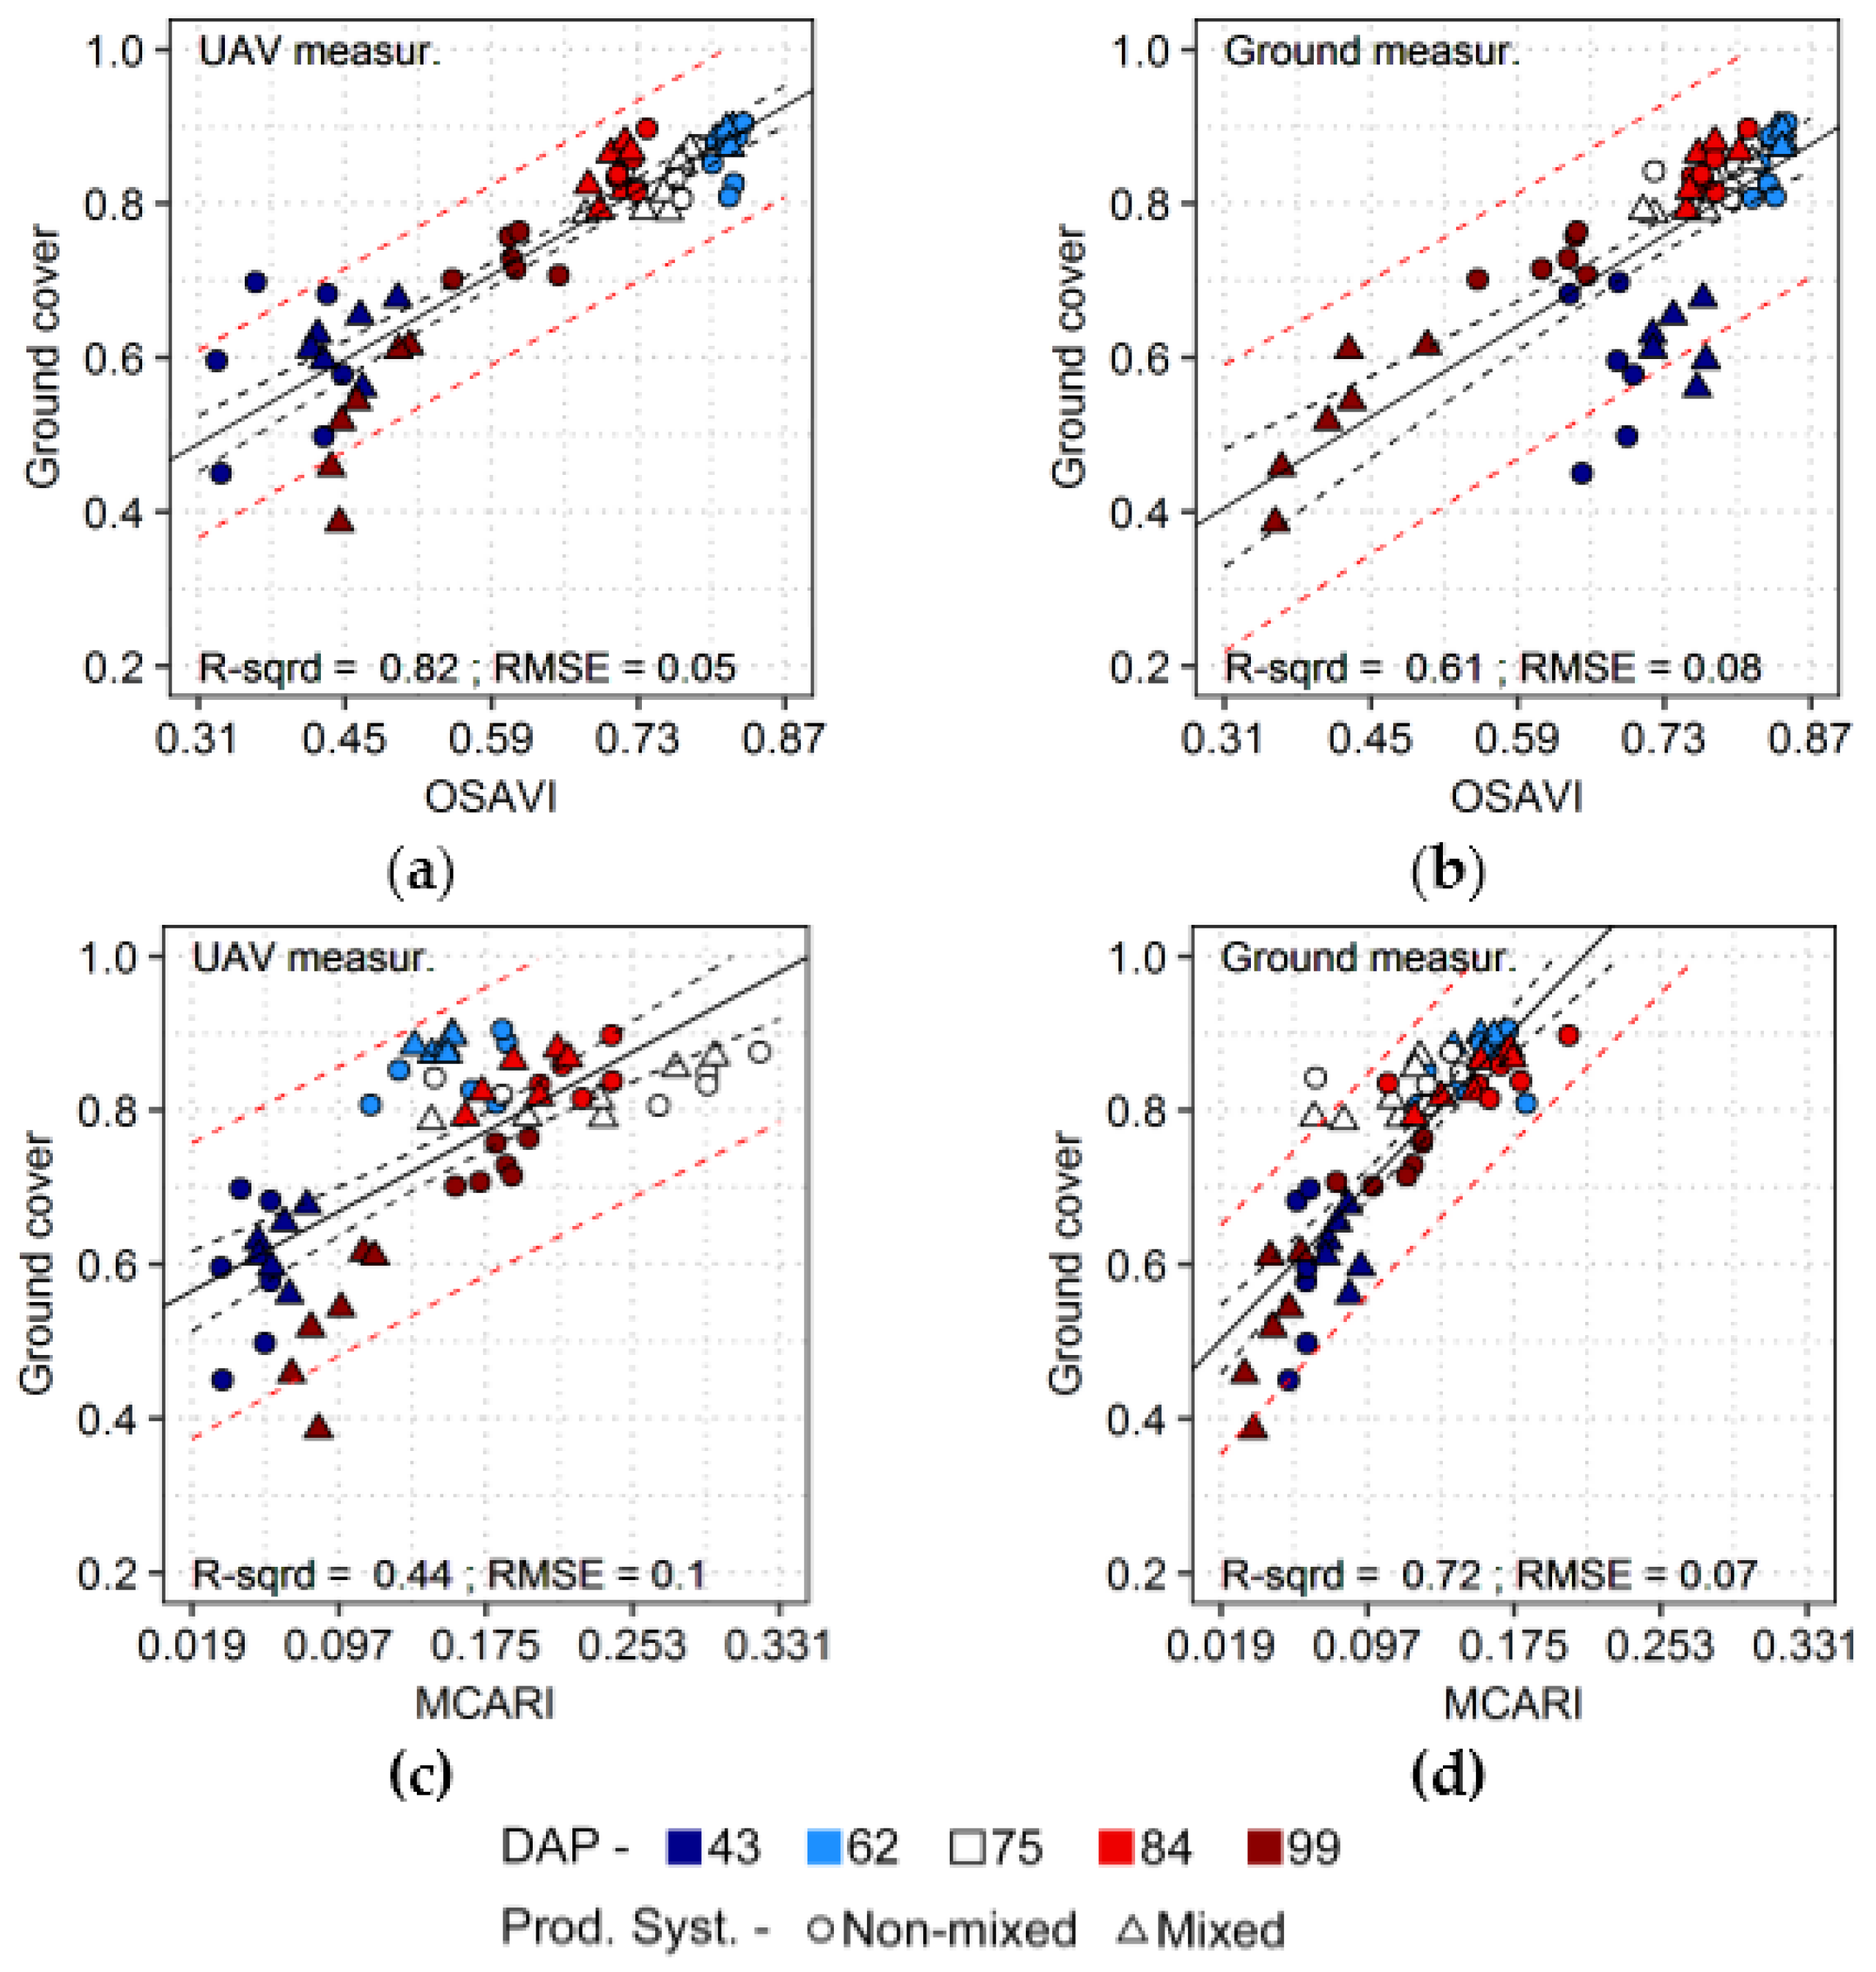
108], including results for potato, and therefore relatively accurate retrieval through indices designed to predict other properties most likely occurred due to specific characteristics of the dataset used in this work. On the other hand, ground cover was generally best predicted using indices sensitive to leaf and canopy properties, i.e., NDVI and OSAVI. The same relatively high accuracy for predictions of this trait using broad band vegetation indices was achieved by other authors [
109,
110,
111]. This can be explained by the relation between fractional cover with reflectance in the whole Vis-NIR spectral region, not only in specific wavelengths, since the effects observed for changes in this property originate mostly from the overall contrast between soil (i.e., background) and vegetation spectral response [
112].
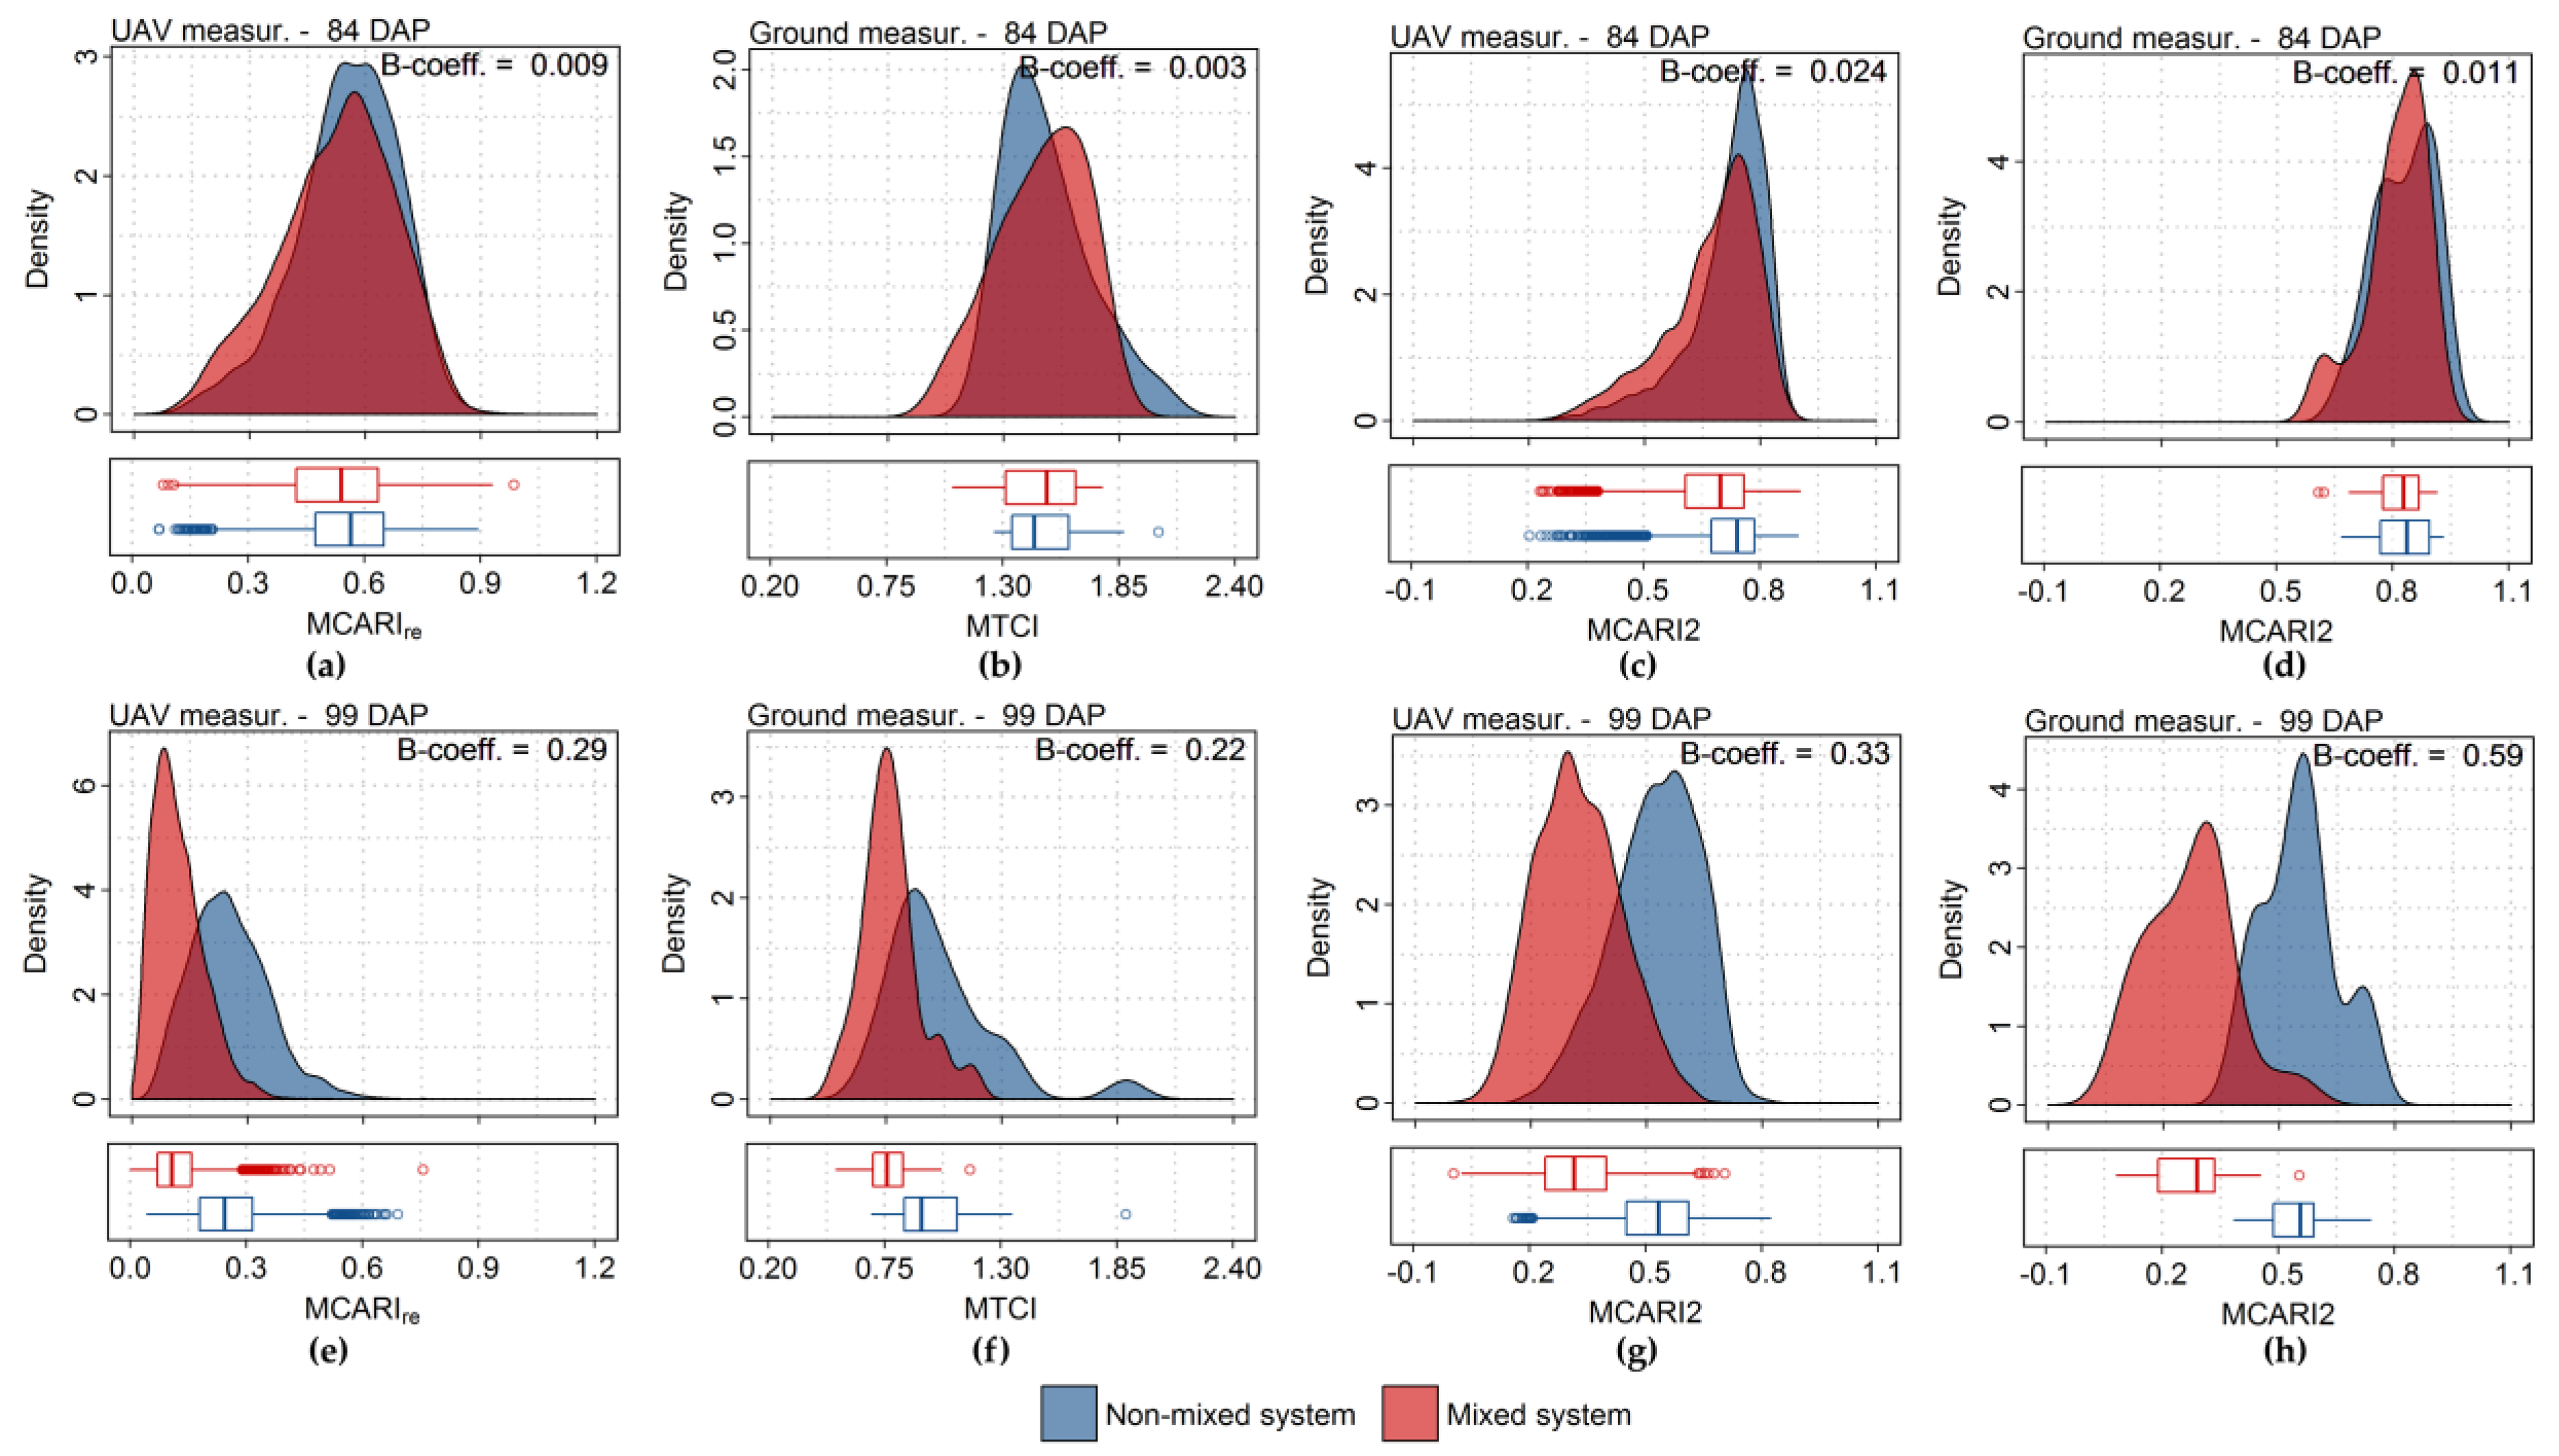
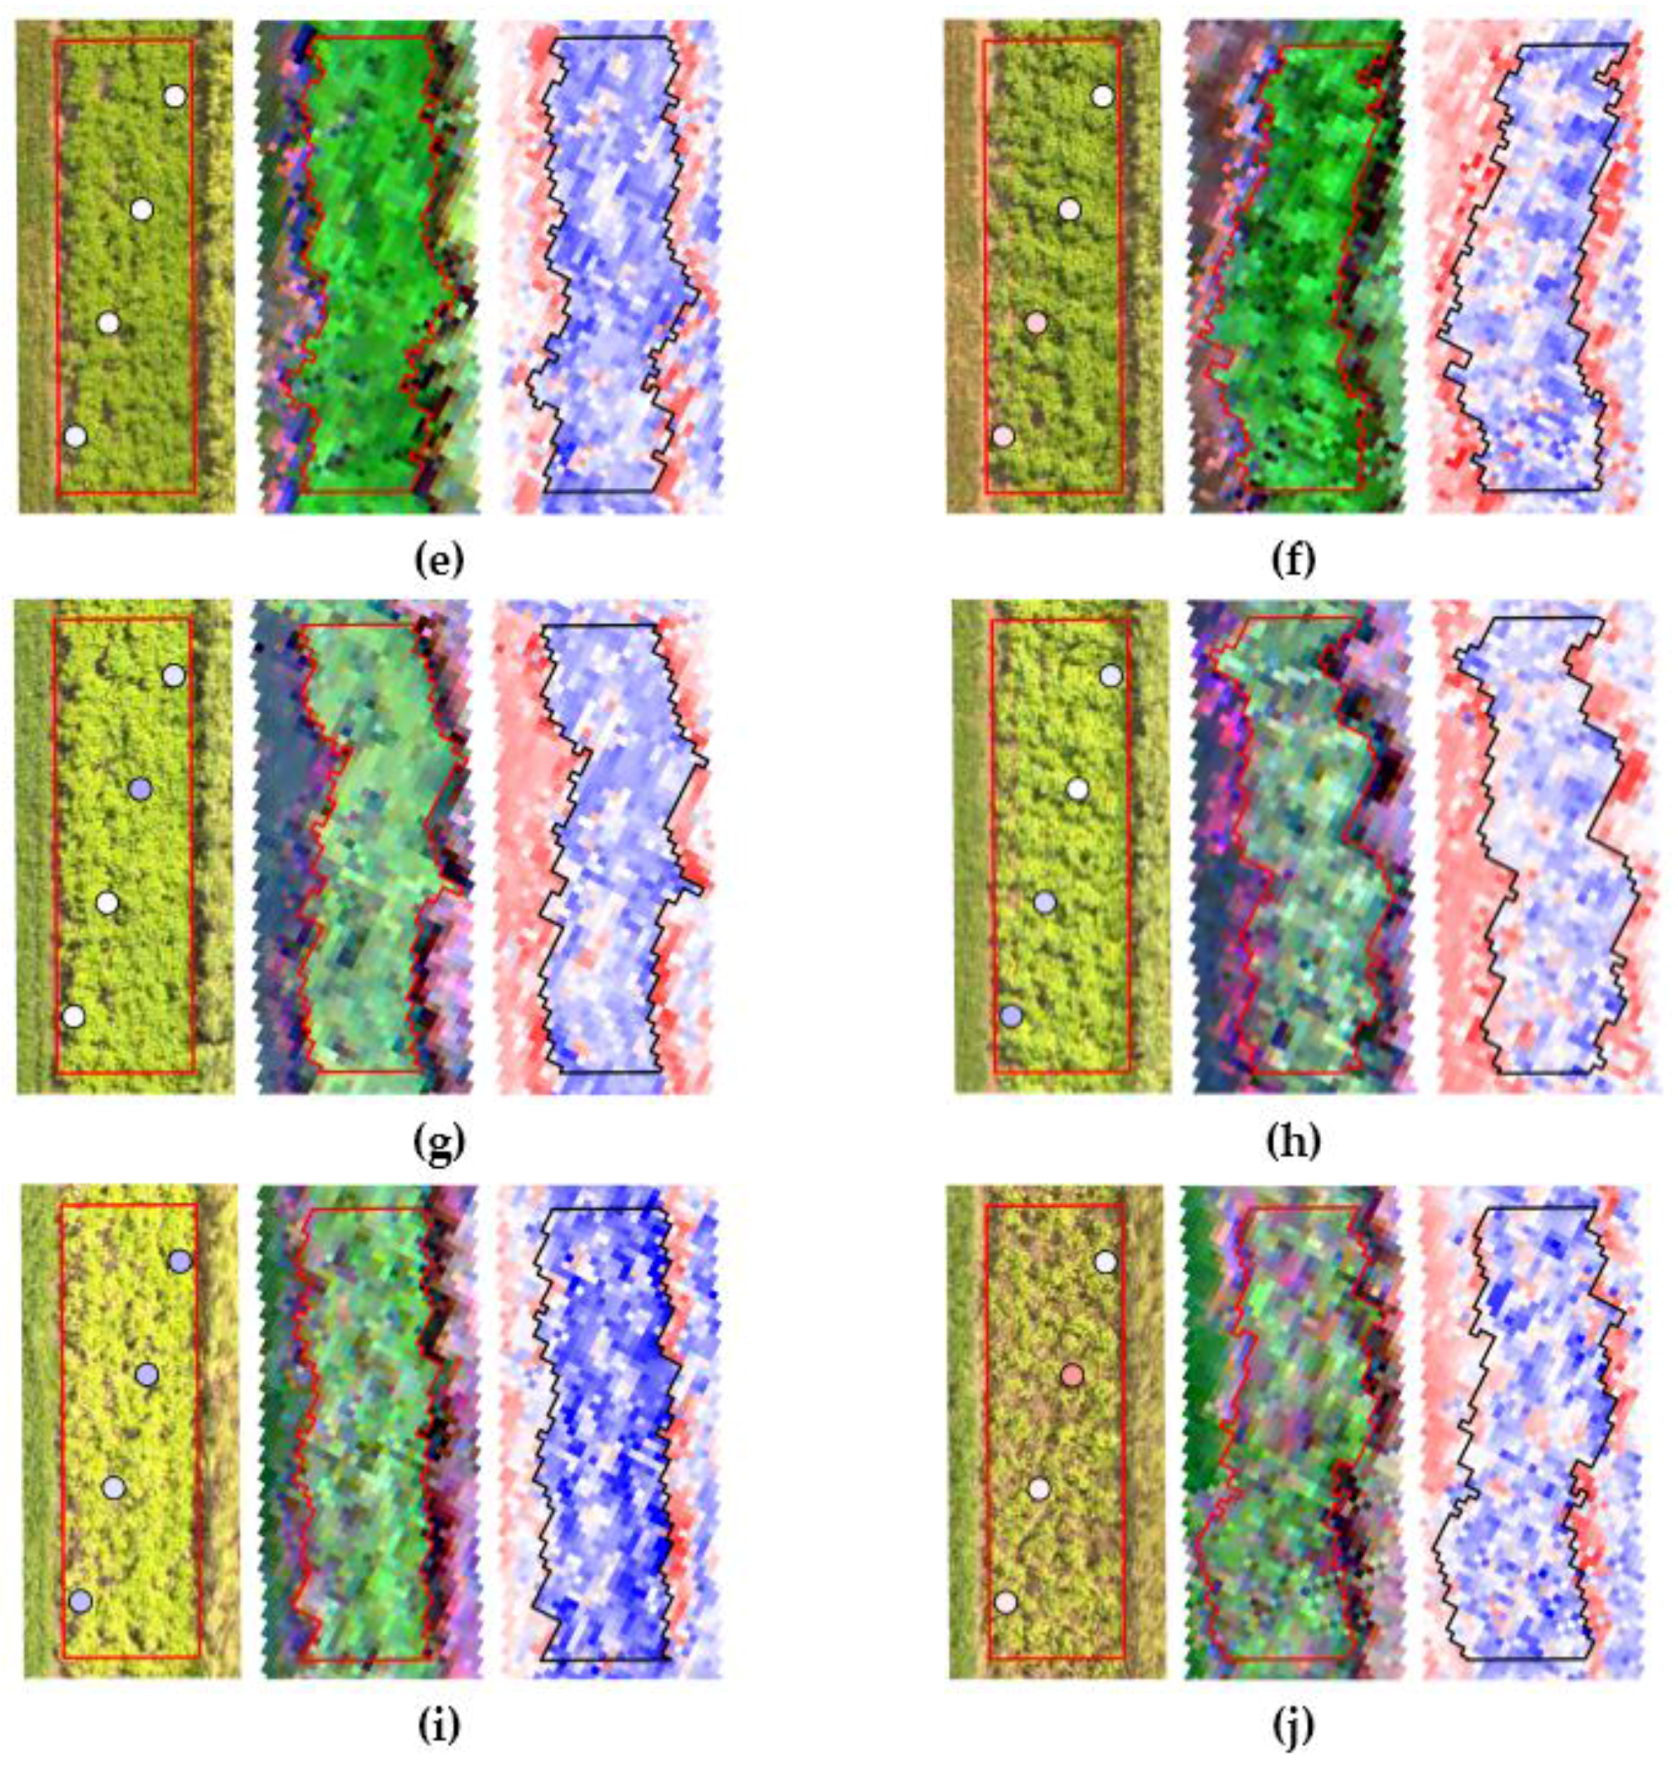
Besides good agreement between modelling outputs (
Section 3.2,
Table 3 and
Table 4) and quasi-linear relationship during intercomparison for some vegetation indices (
Section 3.3,
Figure 11), ground-based and UAV measurements provided comparable descriptive potential concerning the variation of vegetation indices over time, more specifically in relation to late blight development at end of the growing season. This was evaluated in this study through comparison of probability distributions corresponding to vegetation indices derived for the different production systems, as described in
Section 3.3 (
Figure 13,
Table A2). The discriminative potential observed was related mainly to changes in biochemical (i.e., chlorophyll content) and biophysical (i.e., leaf area) properties at canopy level, which were well described by vegetation indices derived from data of the different sensors. Similarly, Nebiker et al. [
113] and Whitehead et al. [
114] describe the potential for qualitative identification of late blight incidence in potato fields using UAV-based multispectral data with high spatial resolution. Sugiura et al. [
91], extended the occurrence detection to severity assessment based also on optical multispectral sensor on board of UAV, and achieved accurate estimates in relation to conventional assessments, even at low incidence levels. These attempts to upscale observations from leaf, as described by Prashar and Jones [
115] using thermal data, to canopy level indicate that disease assessment can potentially be performed at field scale, even using multispectral information. Concerning hyperspectral measurements (from 325 to 1075 nm), Ray et al. [
116] reported the potential to detect differences between healthy and diseased plants, even at low levels of disease severity (i.e., 0.1%). These results agree with those reported in more frequent studies concerning late blight assessment in tomato (
Solanum lycopersicum) [
117,
118,
119,
120,
121,
122], although, for this crop, early detection of the disease was reported to be difficult by some authors [
120], mainly due to the similarity between the spectral response of diseased and healthy plants.
It is important to notice that in most studies concerning late blight assessment potato traits are not monitored together with disease incidence or severity, and these traits are eventually assumed to be homogeneous before disease occurrence, i.e., comparison of information corresponding to diseased sites with “general” standards of healthy crop, without considering variability in the fields monitored. These facts, indicate that further studies are still needed to better evaluate the suitability of spectral measurements in the optical domain to detect early stages of late blight development in potato, in particular following changes of leaf and canopy traits over time, according to different disease severity levels, in order to allow better description of the disease development and distinction from other stress factors.

 ,
, 


