Correction: Domingues Franceschini, M.H.; et al. Intercomparison of Unmanned Aerial Vehicle and Ground-Based Narrow Band Spectrometers Applied to Crop Trait Monitoring in Organic Potato Production. Sensors 2017, 17, 1428

 , and
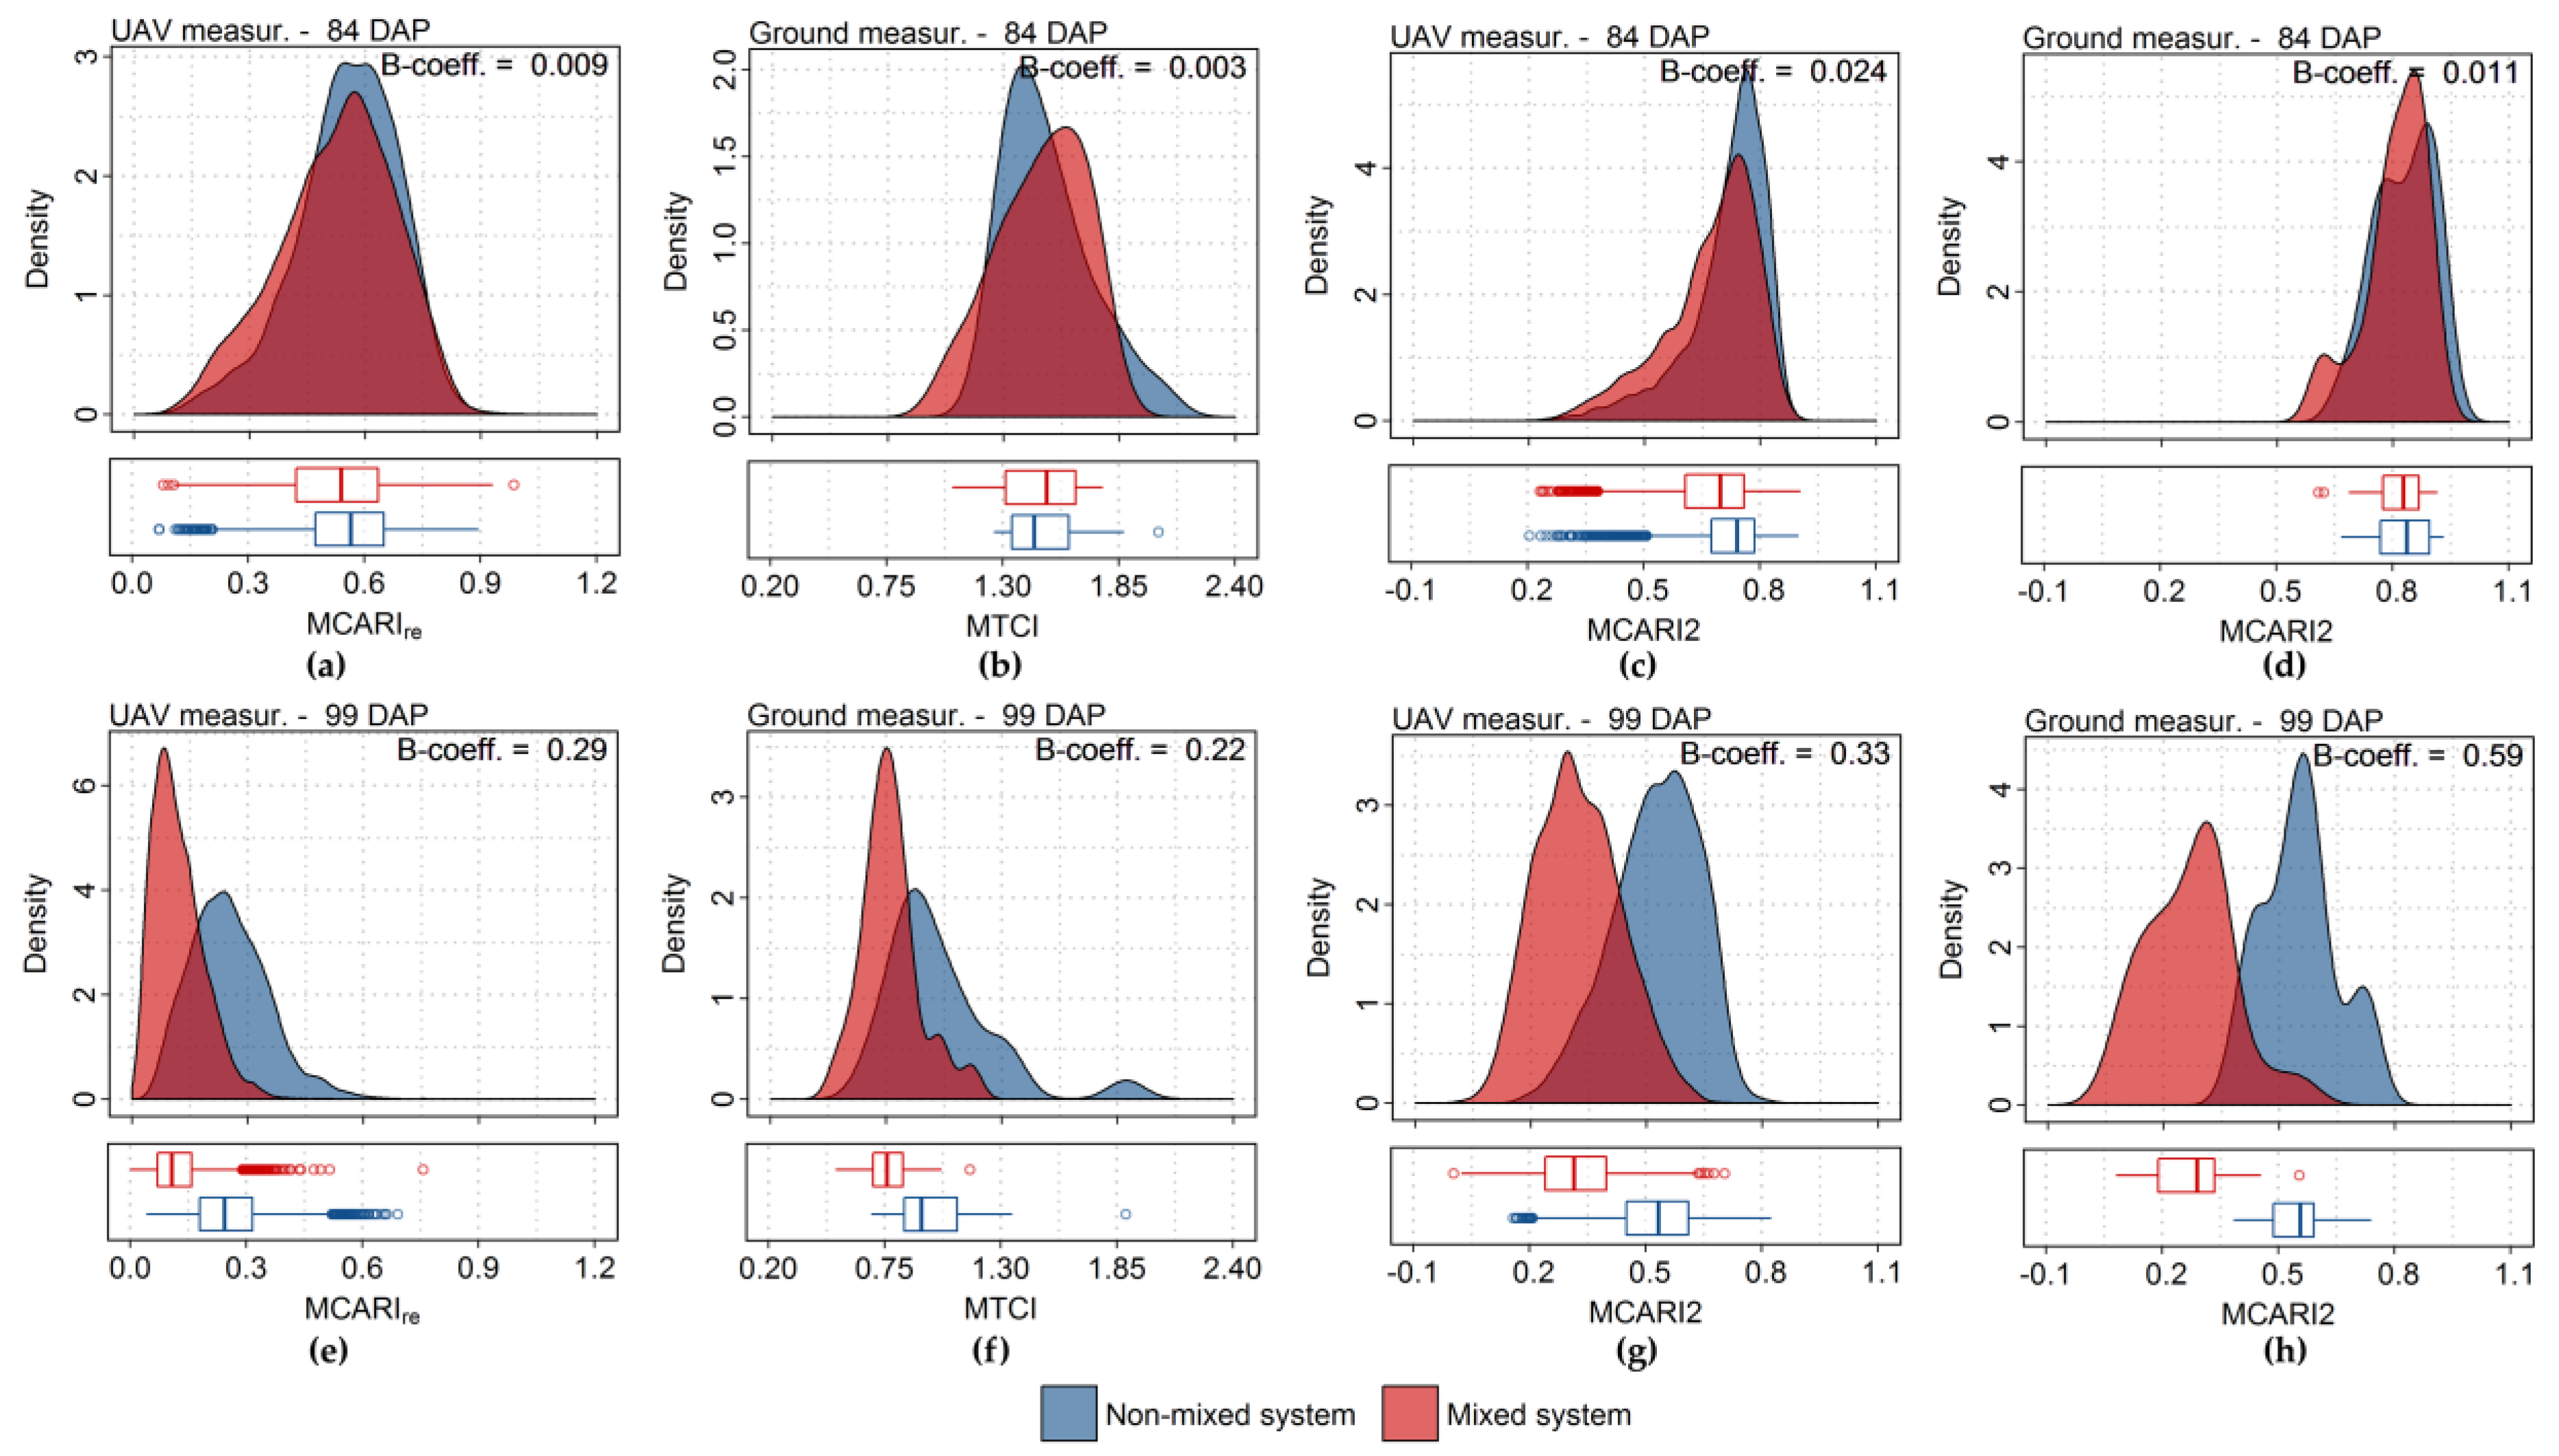
, and 3.3. Intercomparison of UAV and Ground-Based Spectra
Appendix A

| Vegetation Indices | B-Coefficient | Difference between B-Coefficients (99 DAP–84 DAP) | ||||
|---|---|---|---|---|---|---|
| 84 DAP | 99 DAP | |||||
| UAV | Ground | UAV | Ground | UAV (Order) | Ground (Order) | |
| NDVI | 0.052 | 0.049 | 0.289 | 0.459 | 0.237 (6) | 0.410 (7) |
| WDVI | 0.008 | 0.003 | 0.258 | 0.564 | 0.250 (4) | 0.561 (2) |
| OSAVI | 0.014 | 0.011 | 0.262 | 0.558 | 0.248 (5) | 0.547 (4) |
| MCARI | 0.041 | 0.011 | 0.264 | 0.419 | 0.223 (8) | 0.408 (8) |
| TCARI | 0.037 | 0.007 | 0.268 | 0.444 | 0.231 (7) | 0.437 (6) |
| MCARI/OSAVI | 0.048 | 0.007 | 0.189 | 0.297 | 0.141 (9) | 0.290 (10) |
| TCARI/OSAVI | 0.029 | 0.004 | 0.053 | 0.184 | 0.024 (14) | 0.180 (15) |
| MCARIre | 0.009 | 0.007 | 0.285 | 0.535 | 0.276 (3) | 0.528 (5) |
| MCARI/OSAVIre | 0.010 | 0.007 | 0.302 | 0.559 | 0.292 (2) | 0.552 (3) |
| TCARI/OSAVIre | 0.018 | 0.004 | 0.089 | 0.189 | 0.071 (11) | 0.185 (14) |
| CIre | 0.006 | 0.008 | 0.127 | 0.319 | 0.121 (10) | 0.311 (9) |
| CIg | 0.009 | 0.000 | 0.023 | 0.228 | 0.014 (15) | 0.228 (11) |
| MCARI2 | 0.024 | 0.011 | 0.333 | 0.594 | 0.309 (1) | 0.583 (1) |
| REP | 0.007 | 0.010 | 0.042 | 0.004 | 0.035 (13) | −0.006 (16) |
| MTCI | 0.010 | 0.003 | 0.067 | 0.217 | 0.057 (12) | 0.214 (12) |
| PRI | 0.003 | 0.033 | 0.003 | 0.226 | 0.000 (16) | 0.193 (13) |
Reference
- Franceschini, M.H.D.; Bartholomeus, H.; van Apeldoorn, D.; Suomalainen, J.; Kooistra, L. Intercomparison of Unmanned Aerial Vehicle and Ground-Based Narrow Band Spectrometers Applied to Crop Trait Monitoring in Organic Potato Production. Sensors 2017, 17, 1428. [Google Scholar] [CrossRef]

© 2017 by the authors. Licensee MDPI, Basel, Switzerland. This article is an open access article distributed under the terms and conditions of the Creative Commons Attribution (CC BY) license (http://creativecommons.org/licenses/by/4.0/).
Share and Cite
Domingues Franceschini, M.H.; Bartholomeus, H.; Van Apeldoorn, D.; Suomalainen, J.; Kooistra, L. Correction: Domingues Franceschini, M.H.; et al. Intercomparison of Unmanned Aerial Vehicle and Ground-Based Narrow Band Spectrometers Applied to Crop Trait Monitoring in Organic Potato Production. Sensors 2017, 17, 1428. Sensors 2017, 17, 2265. https://doi.org/10.3390/s17102265
Domingues Franceschini MH, Bartholomeus H, Van Apeldoorn D, Suomalainen J, Kooistra L. Correction: Domingues Franceschini, M.H.; et al. Intercomparison of Unmanned Aerial Vehicle and Ground-Based Narrow Band Spectrometers Applied to Crop Trait Monitoring in Organic Potato Production. Sensors 2017, 17, 1428. Sensors. 2017; 17(10):2265. https://doi.org/10.3390/s17102265
Chicago/Turabian StyleDomingues Franceschini, Marston Héracles, Harm Bartholomeus, Dirk Van Apeldoorn, Juha Suomalainen, and Lammert Kooistra. 2017. "Correction: Domingues Franceschini, M.H.; et al. Intercomparison of Unmanned Aerial Vehicle and Ground-Based Narrow Band Spectrometers Applied to Crop Trait Monitoring in Organic Potato Production. Sensors 2017, 17, 1428" Sensors 17, no. 10: 2265. https://doi.org/10.3390/s17102265