Study of a Compression-Molding Process for Ultraviolet Light-Emitting Diode Exposure Systems via Finite-Element Analysis


Abstract
:1. Introduction
2. Materials and Methods
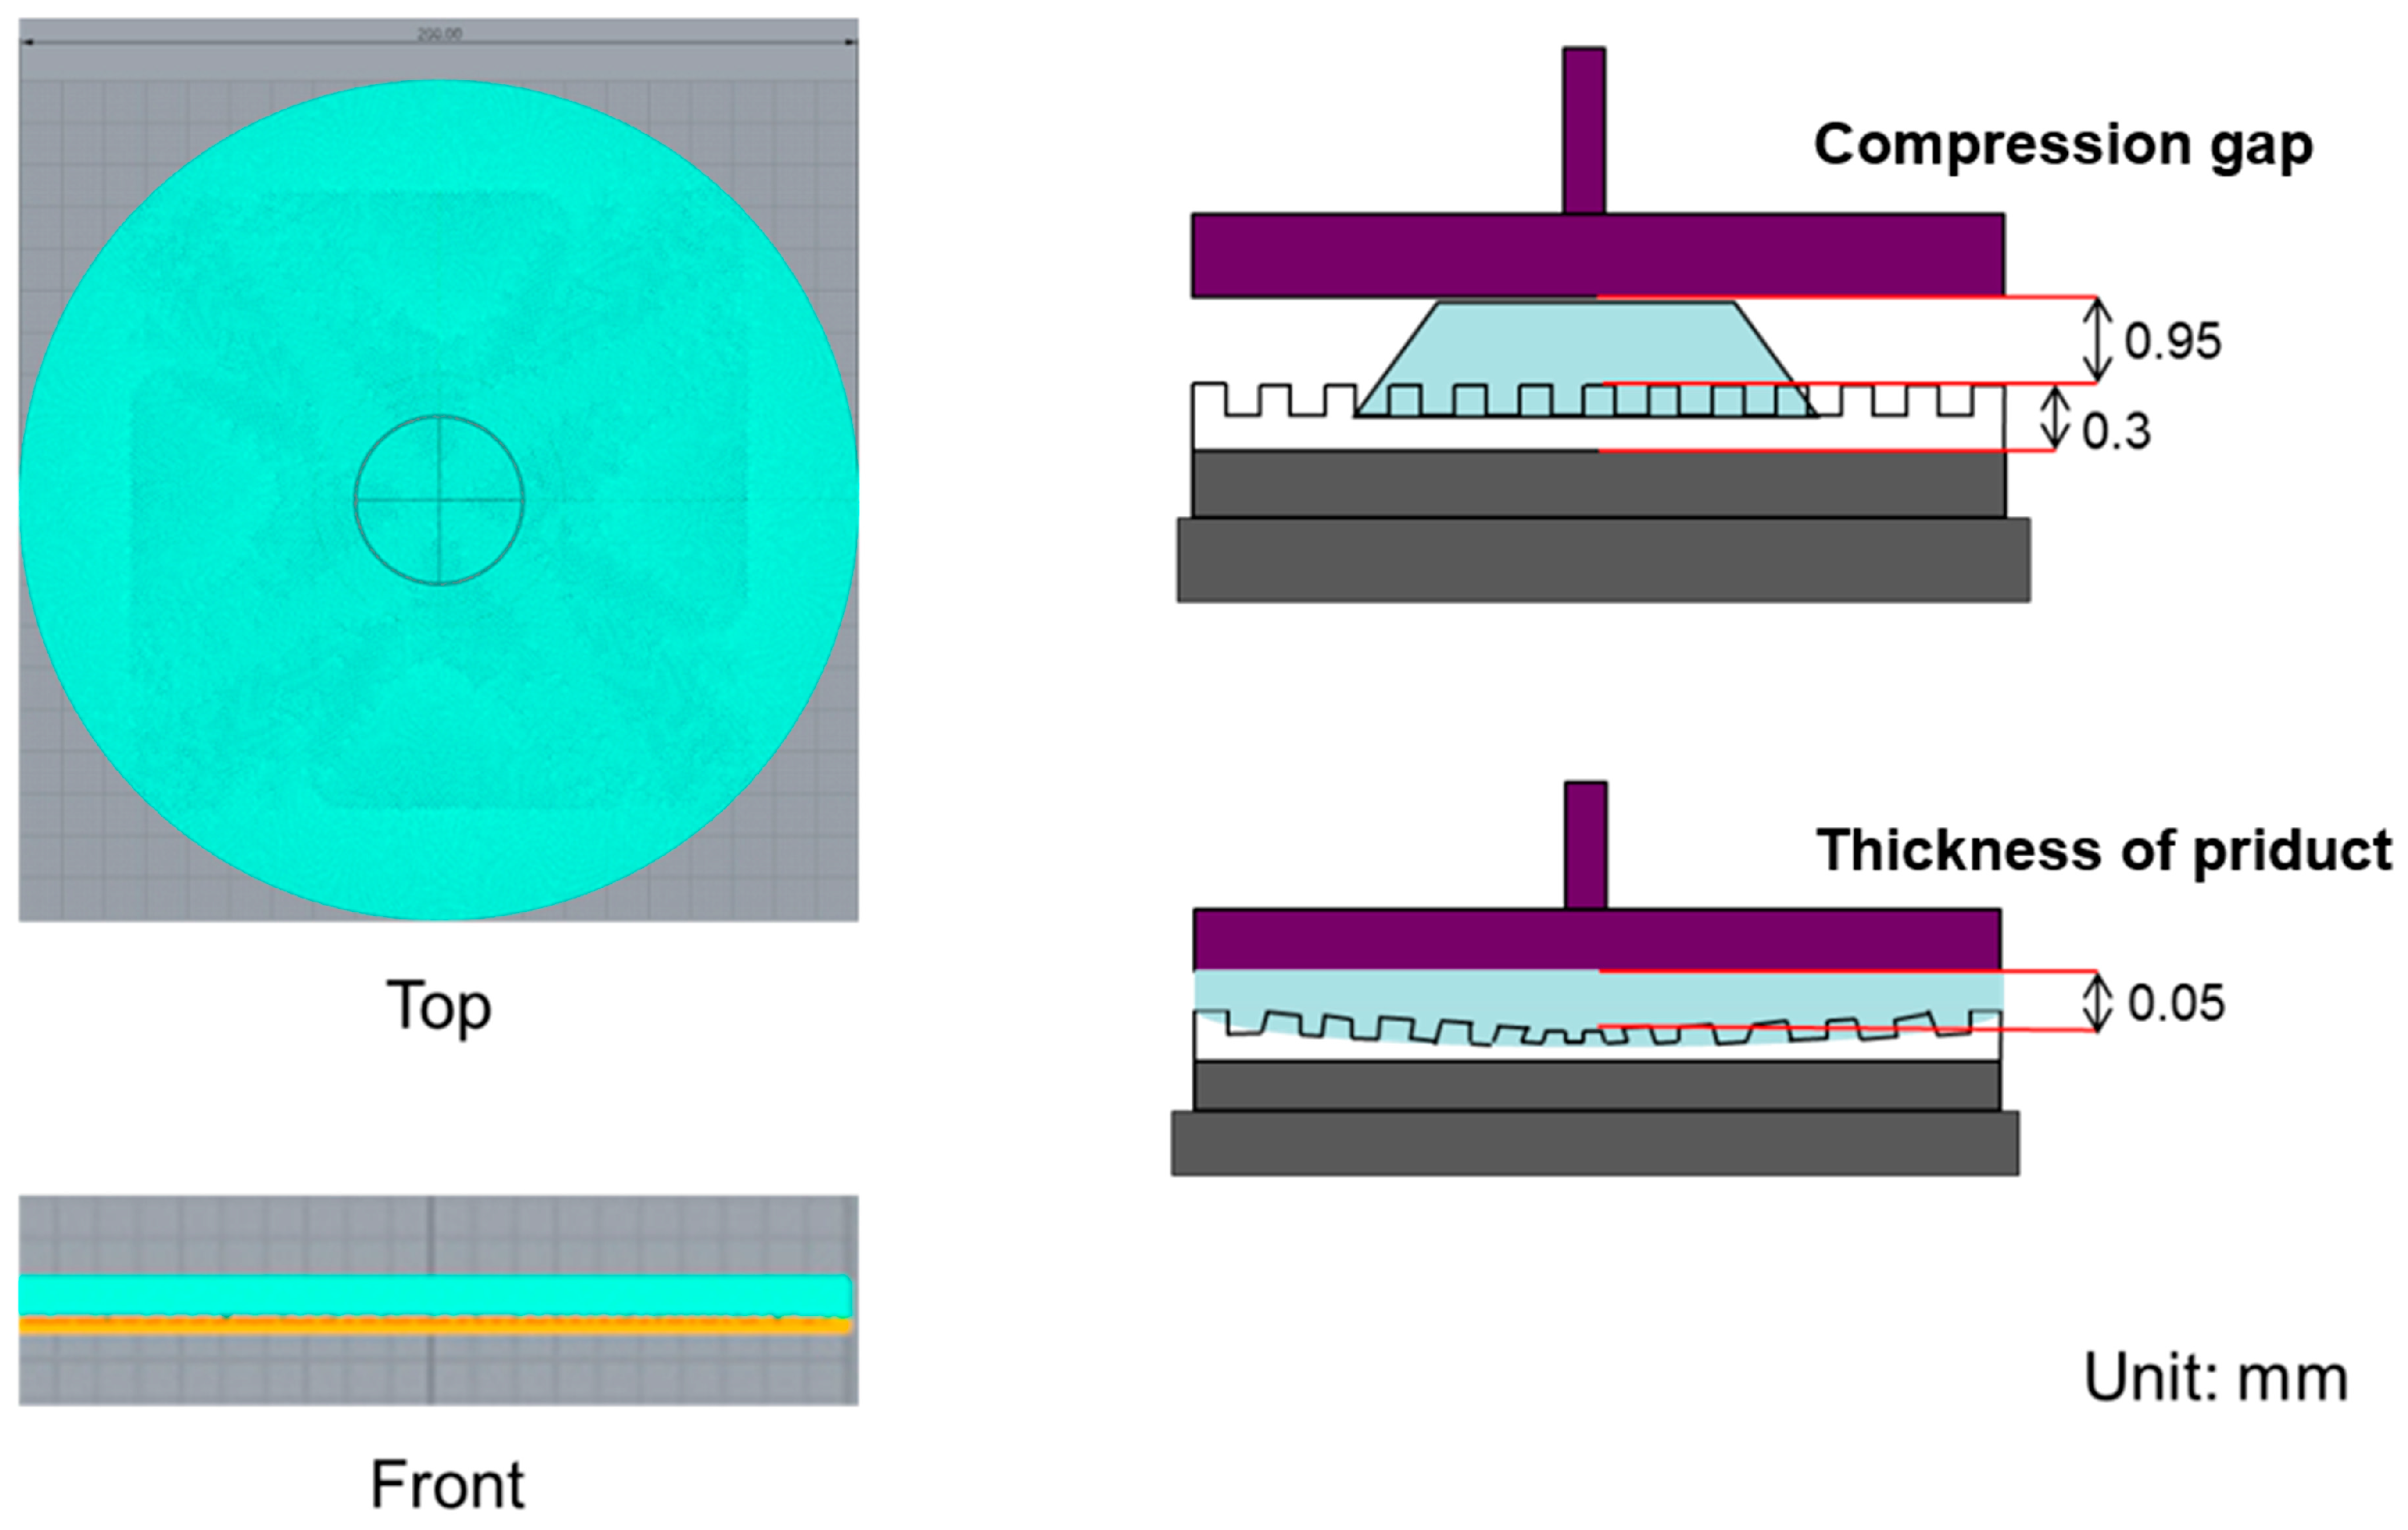
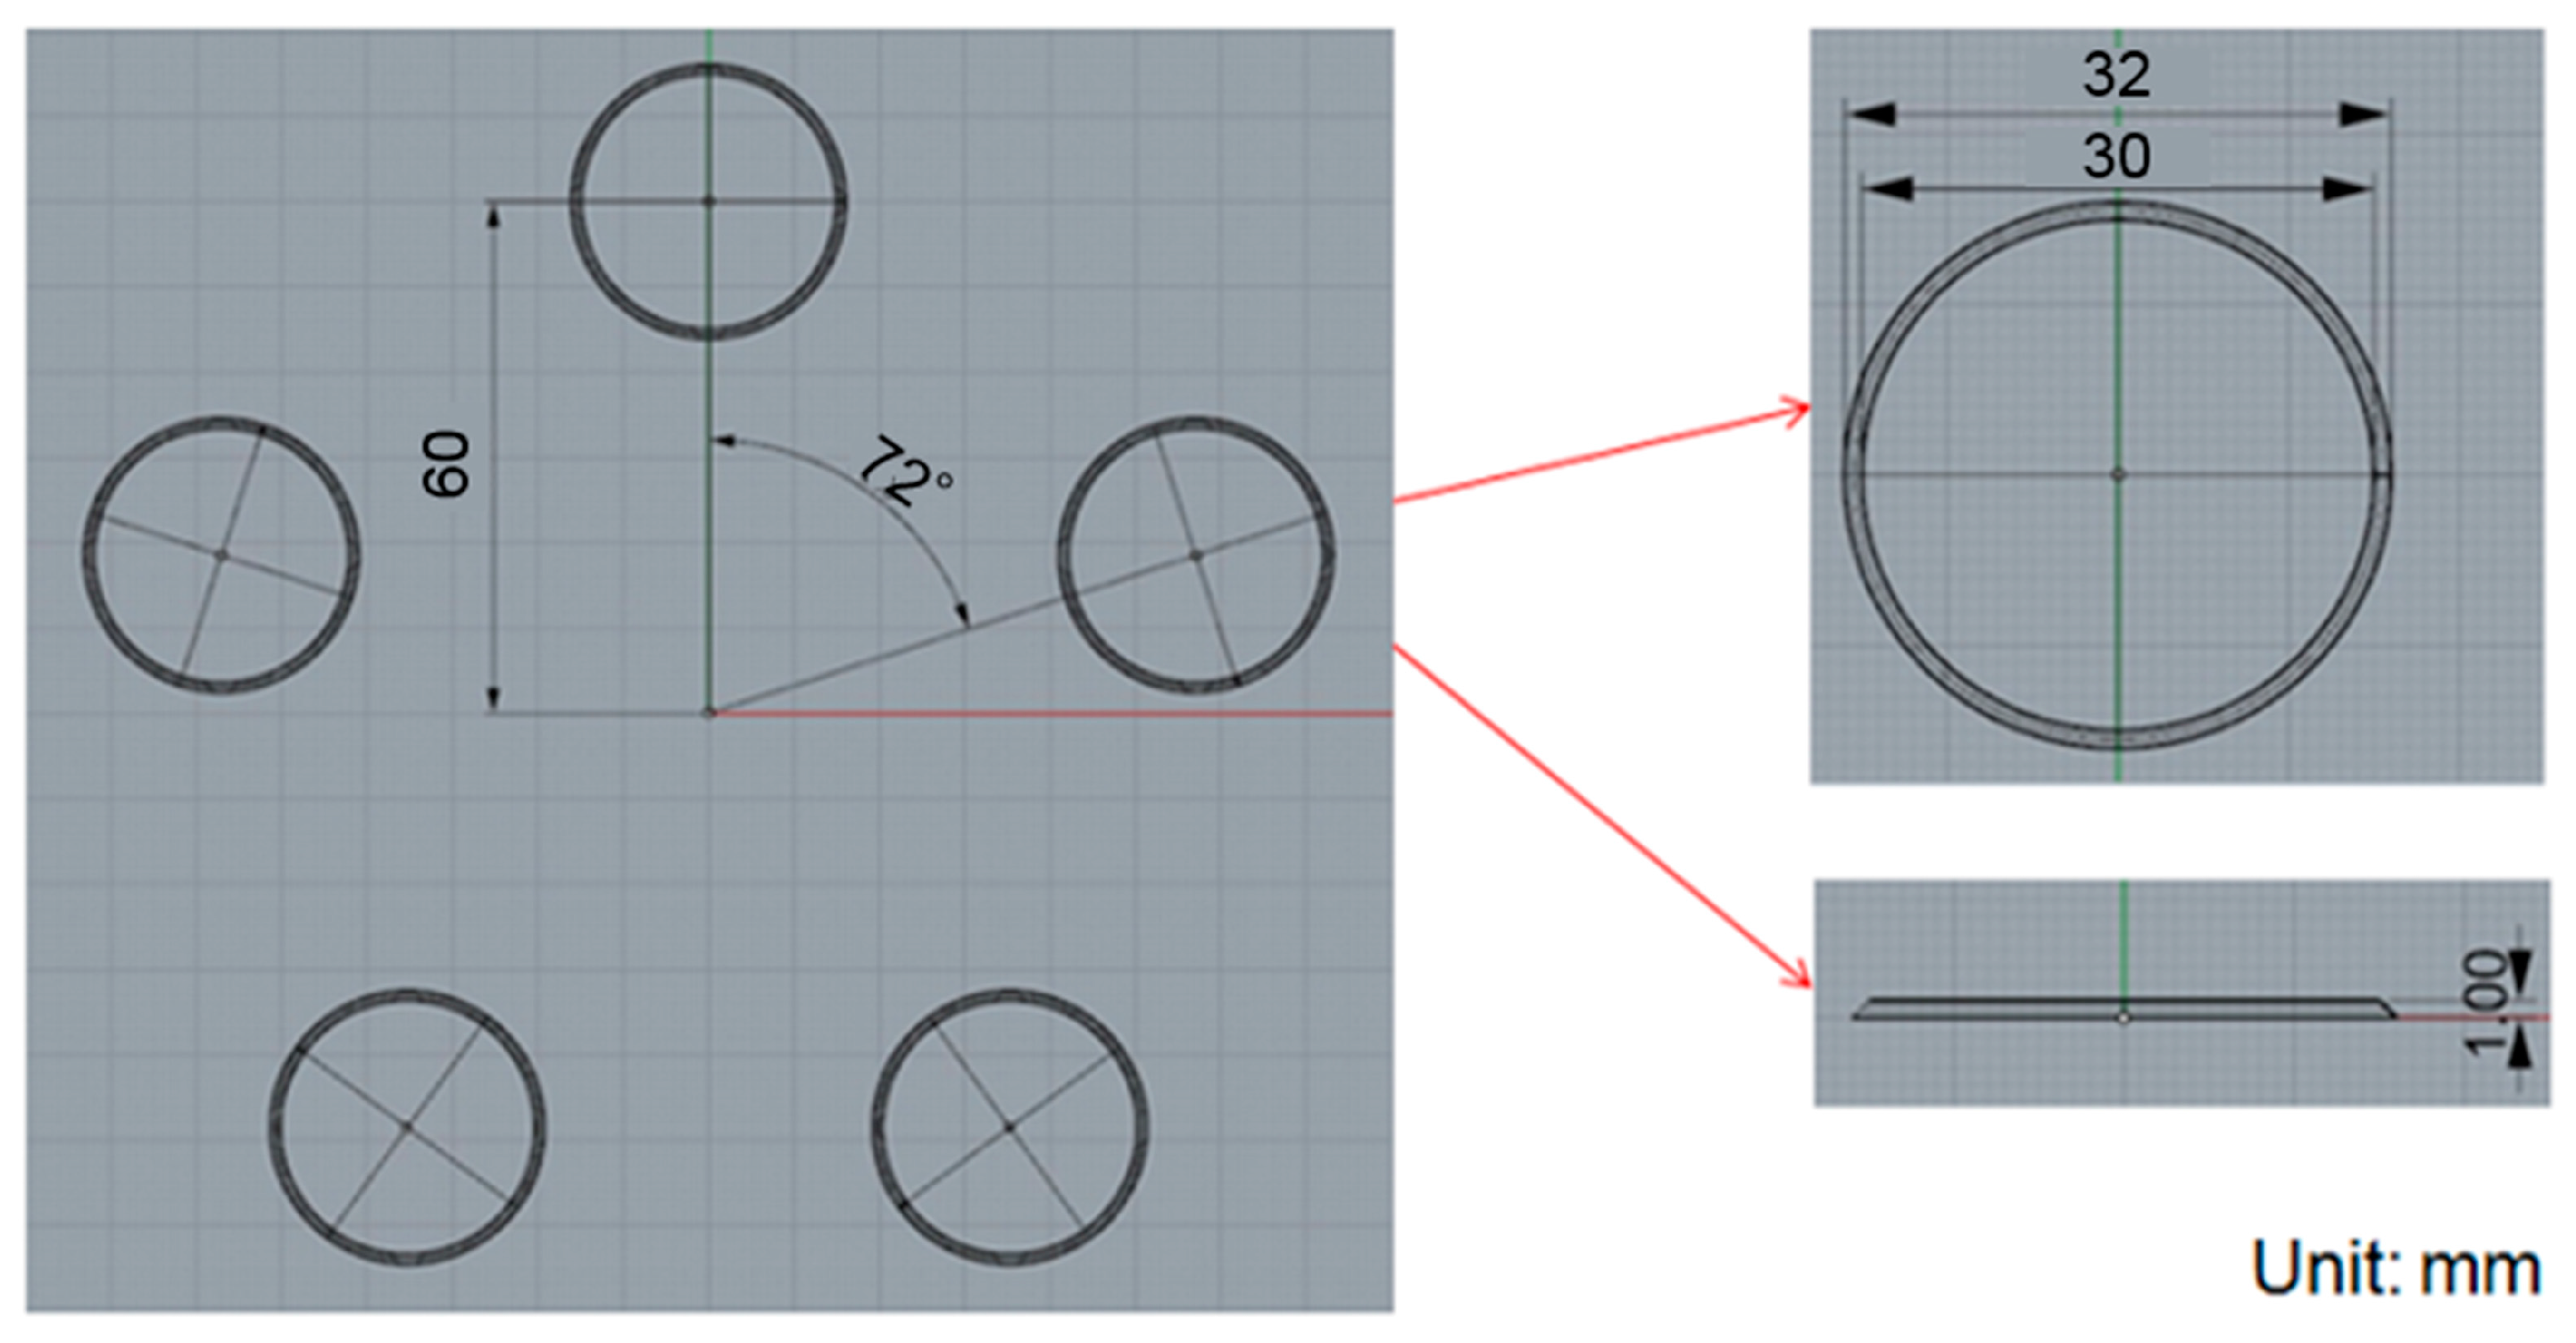
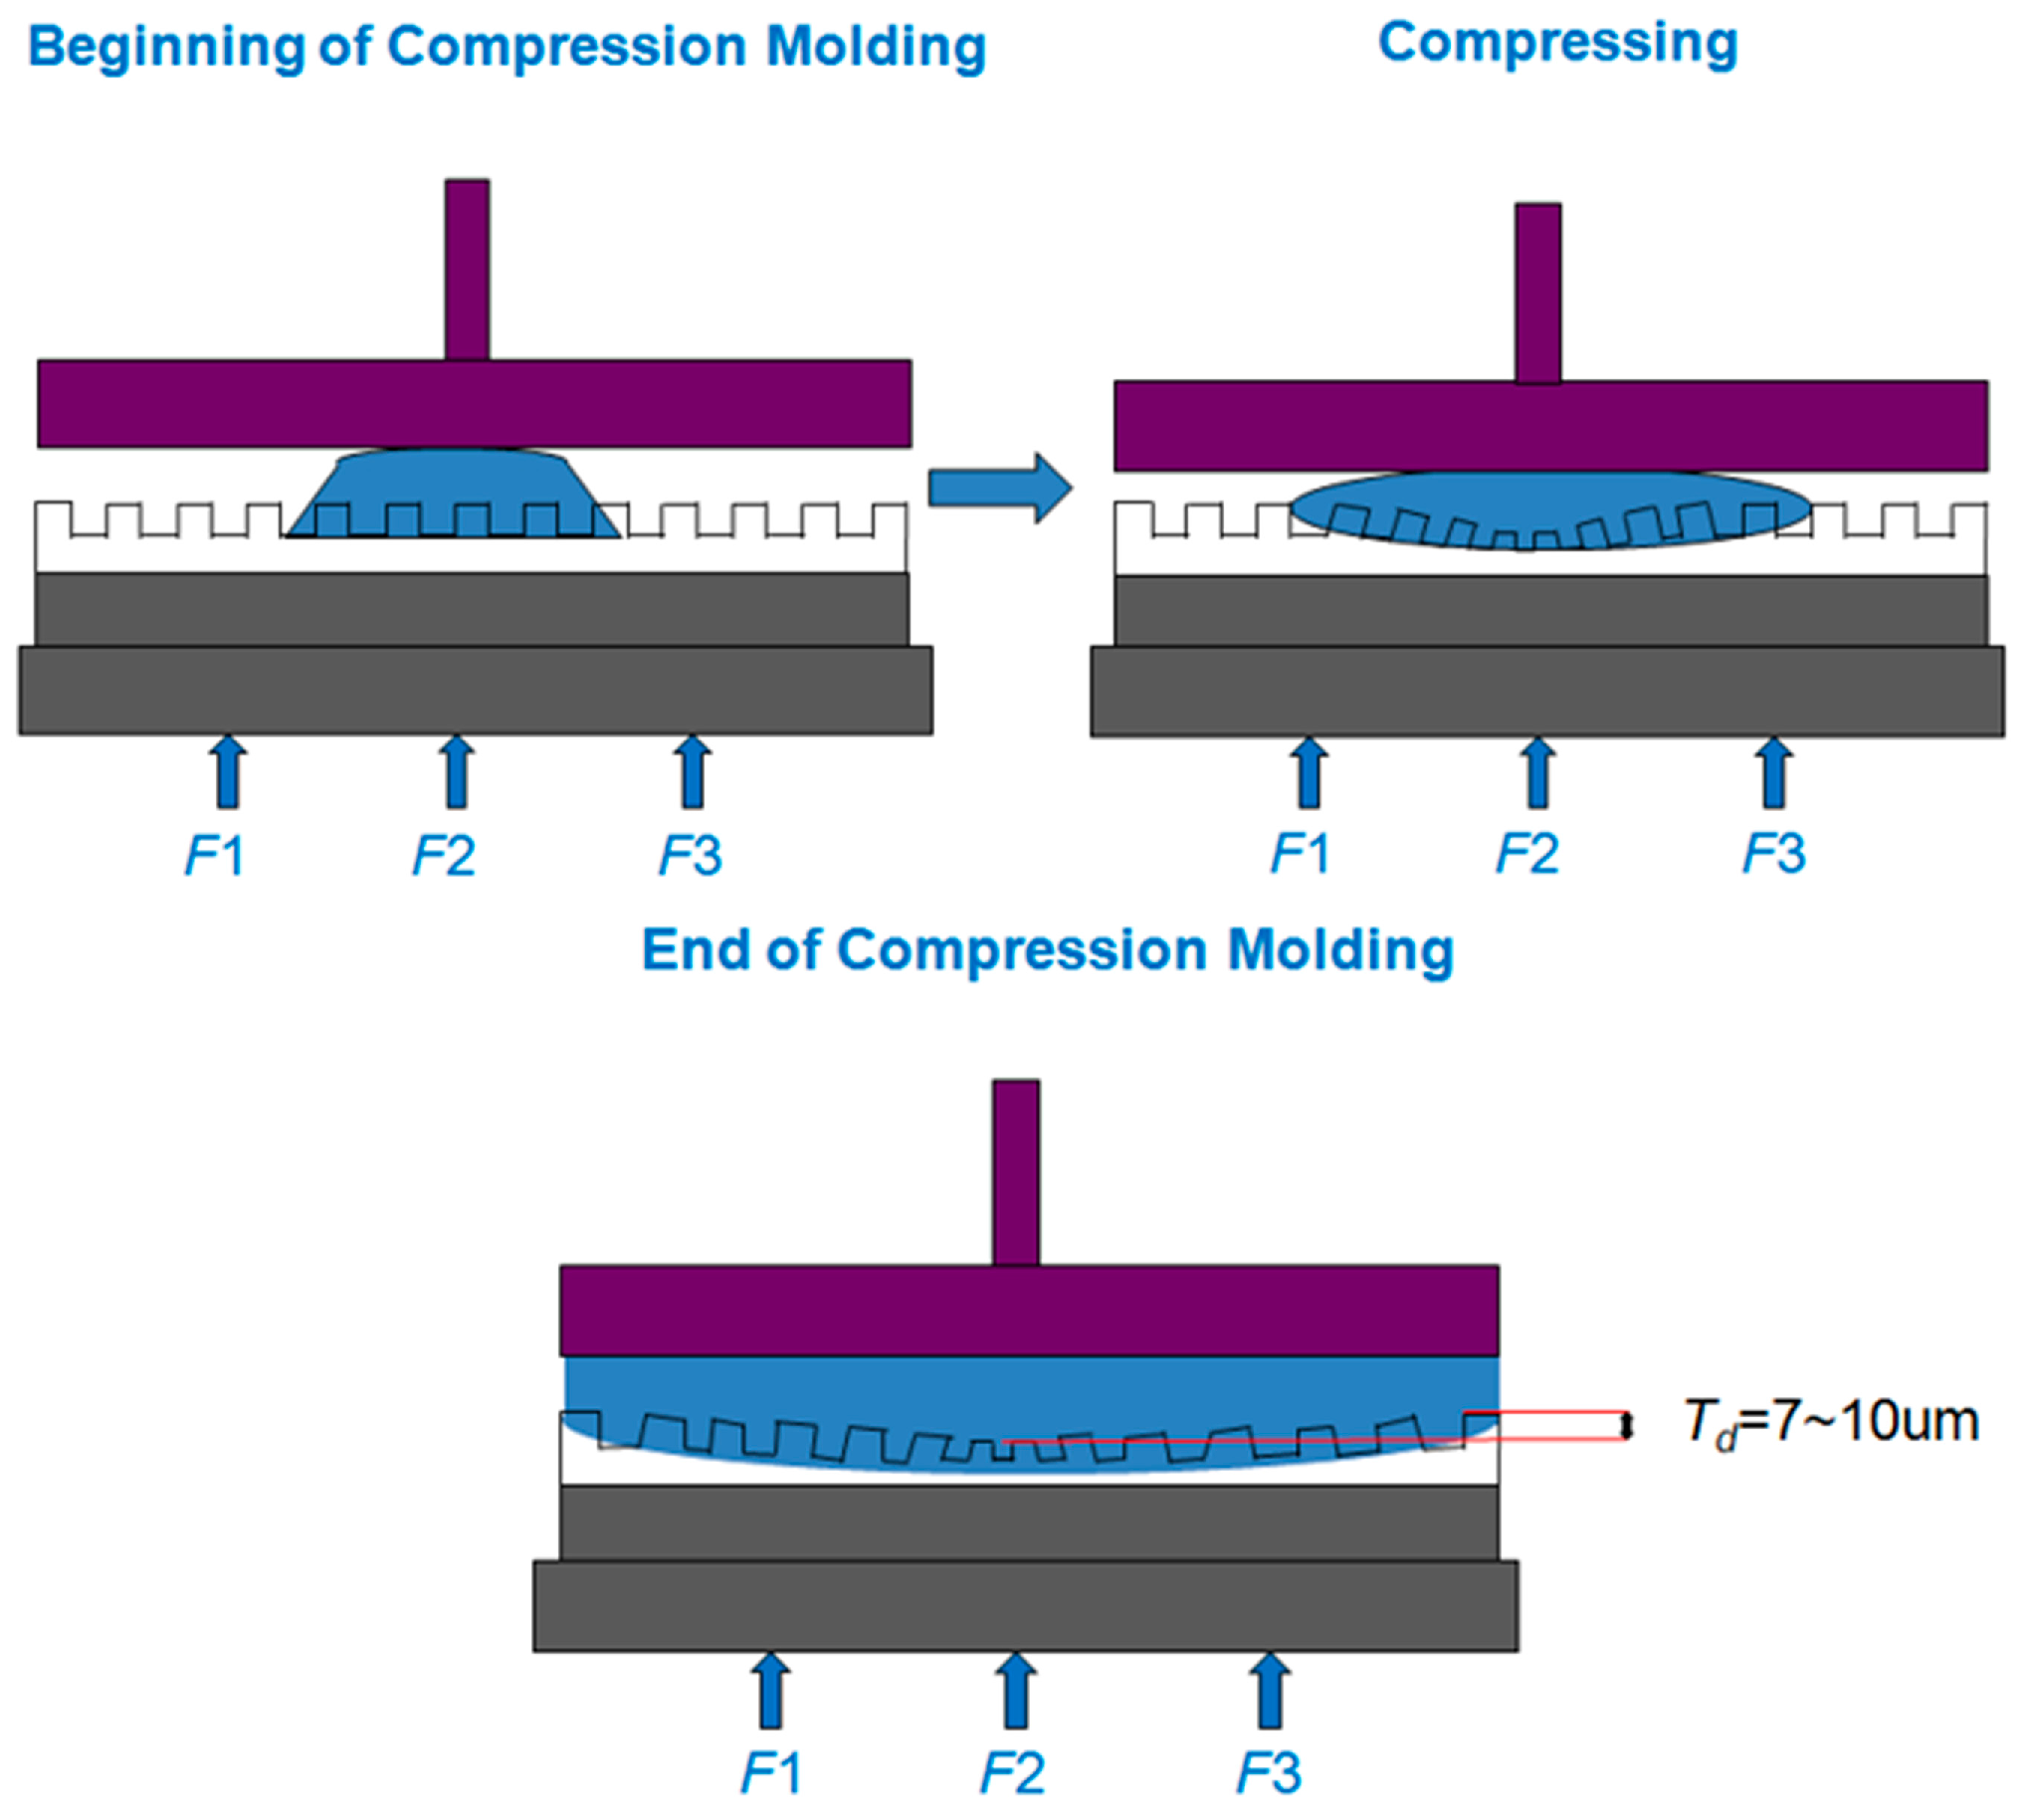
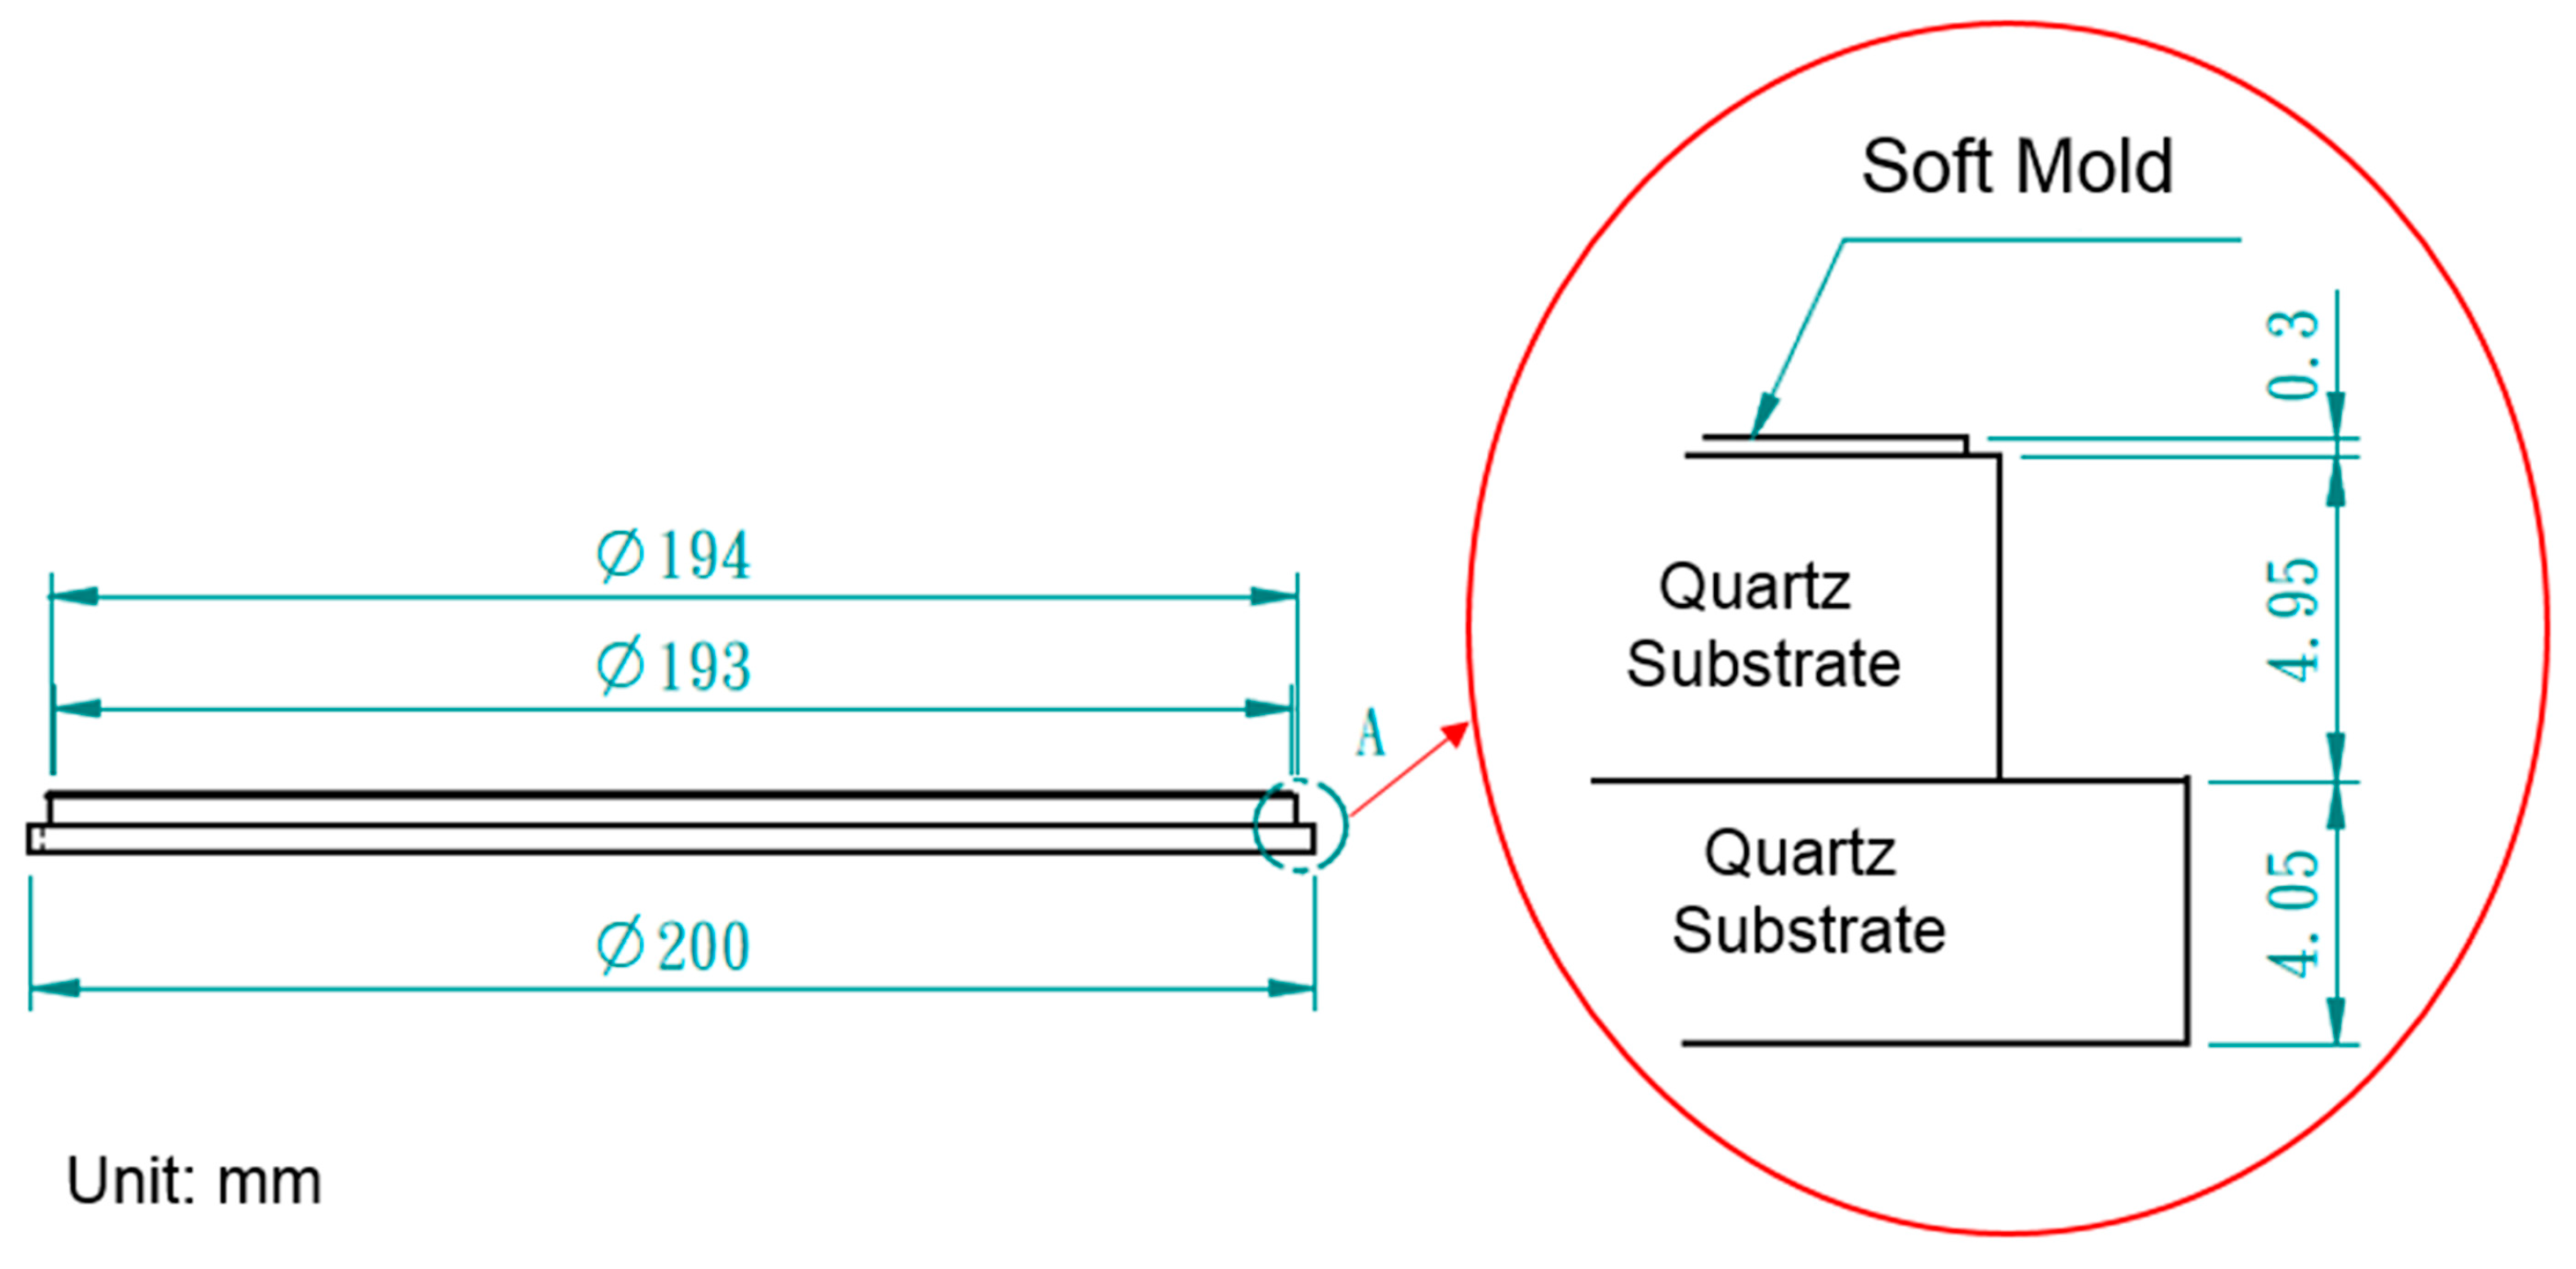
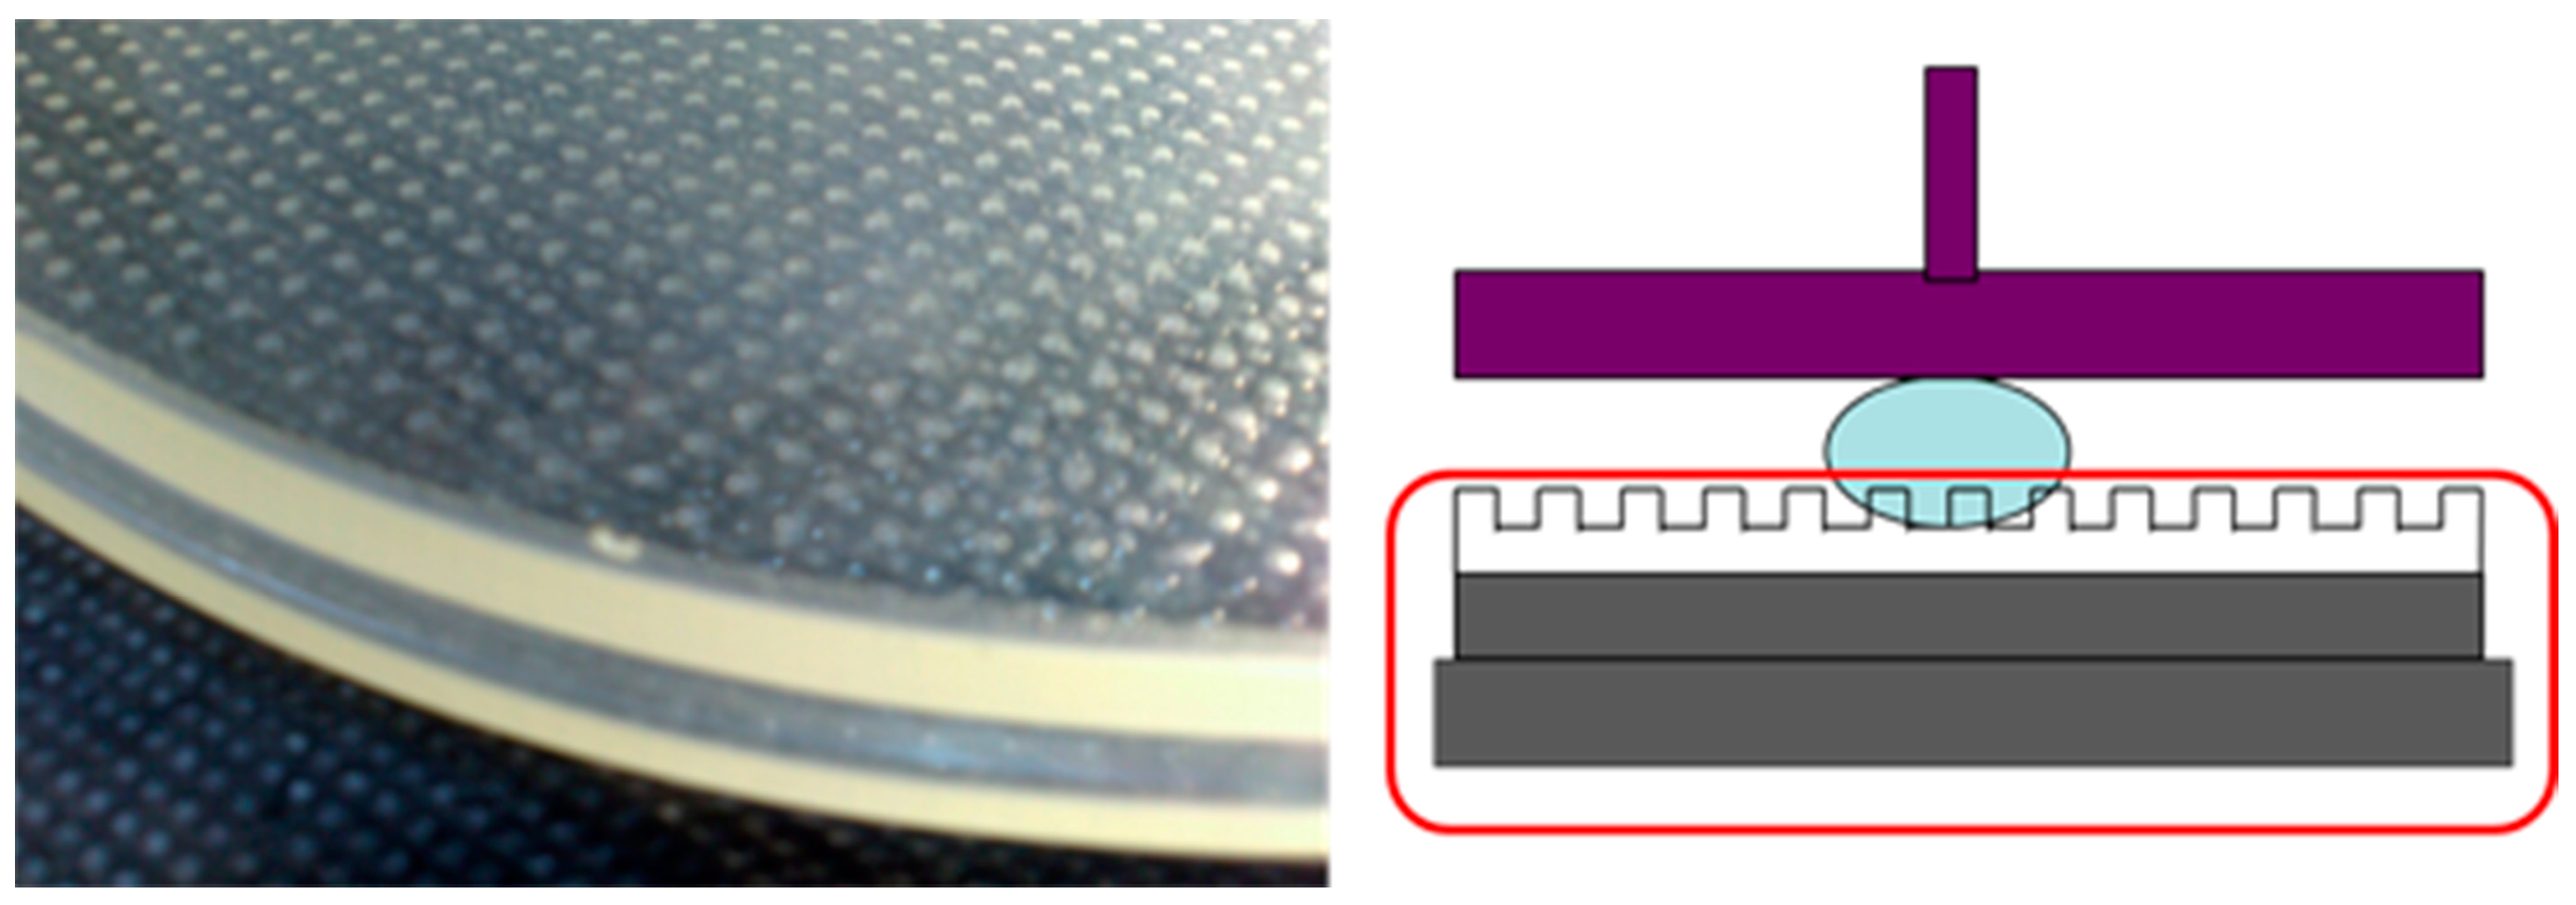
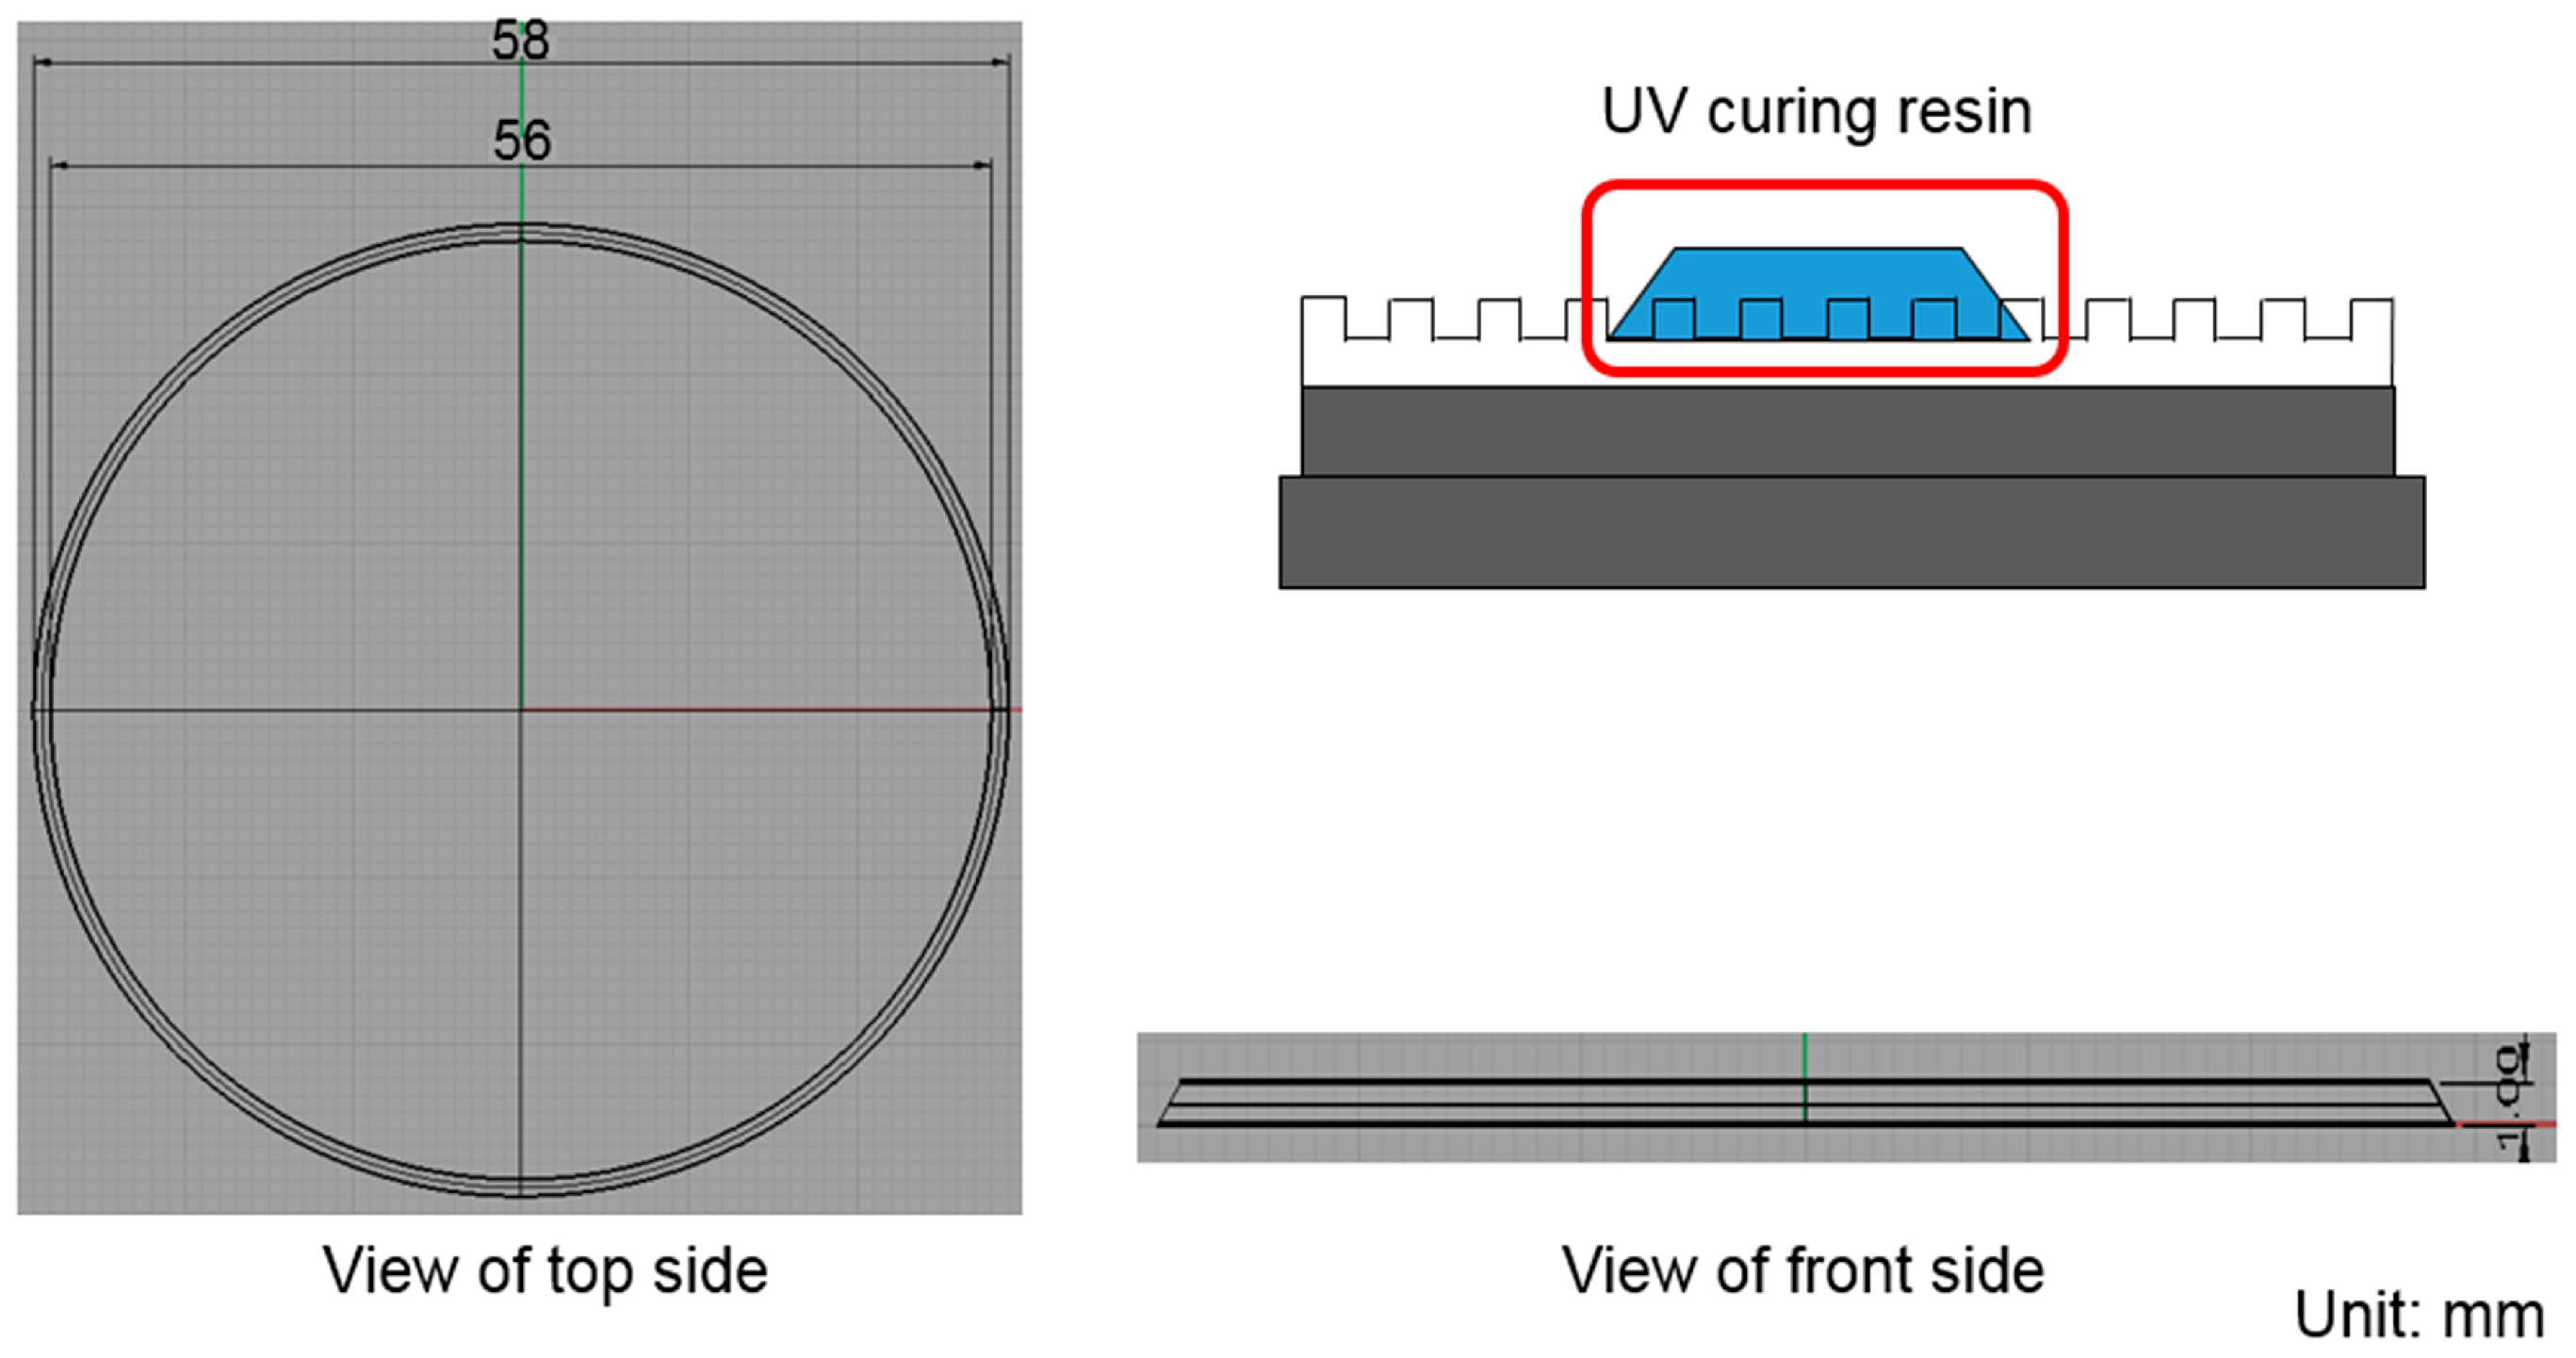
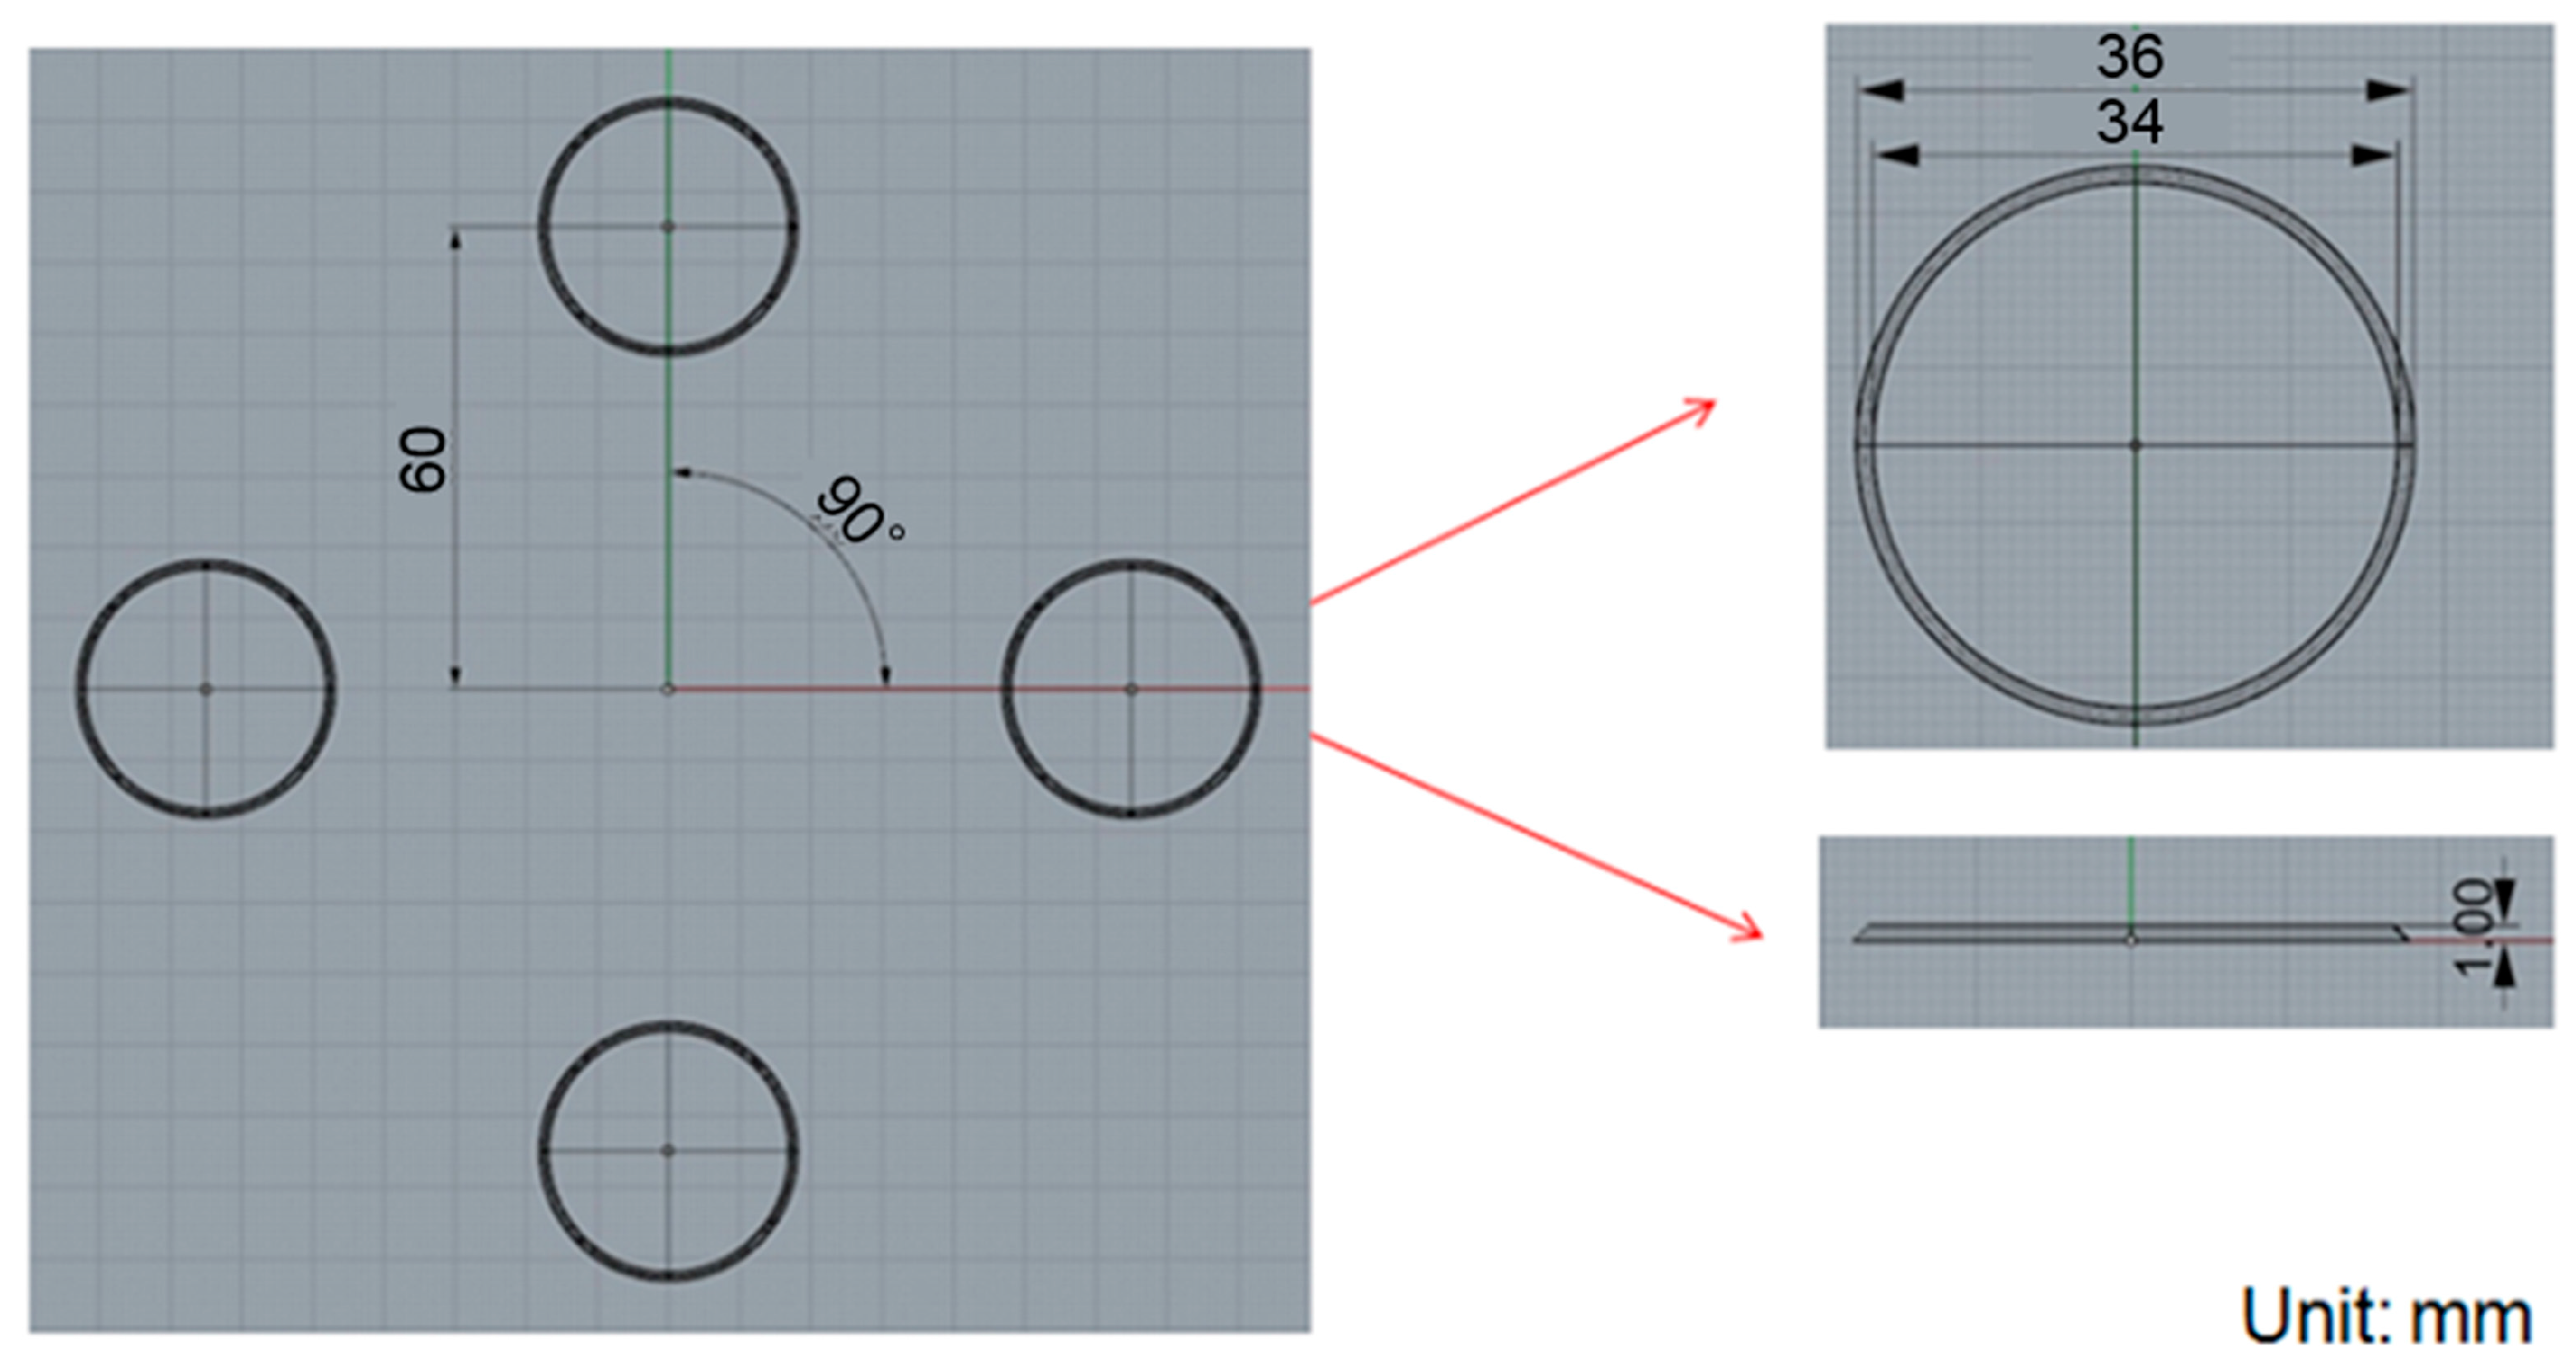
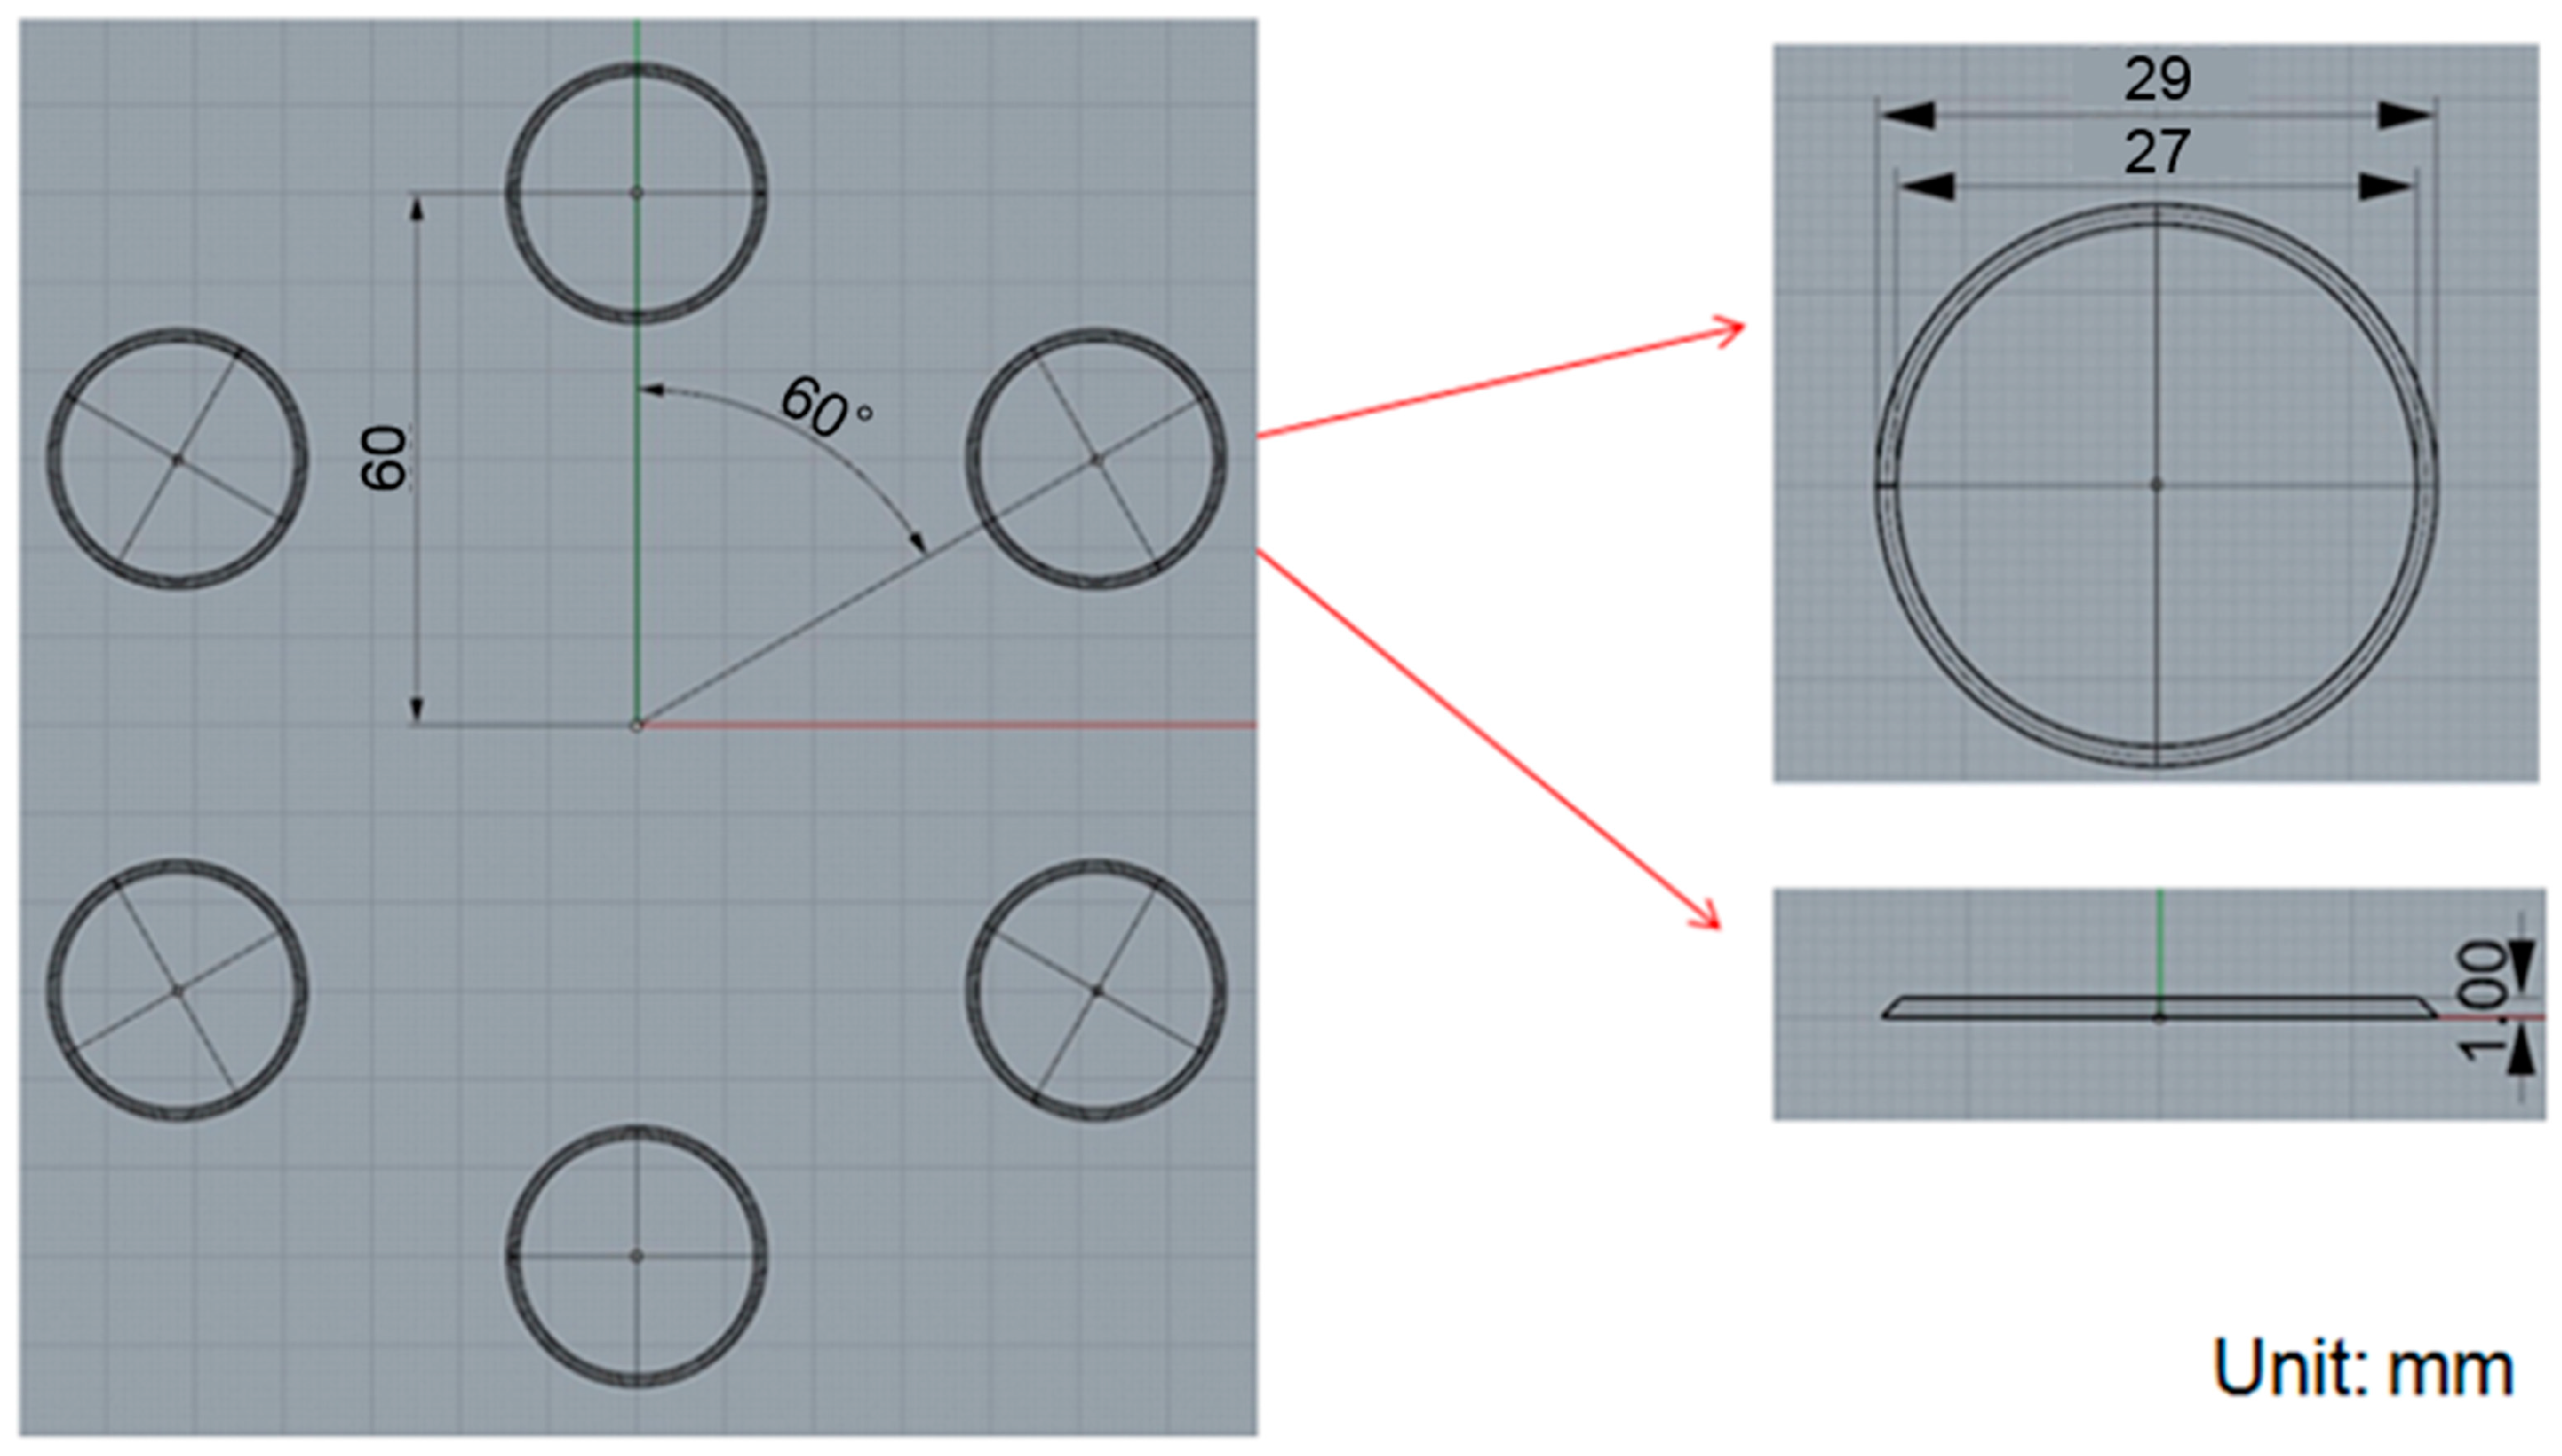
2.1. Problem Description
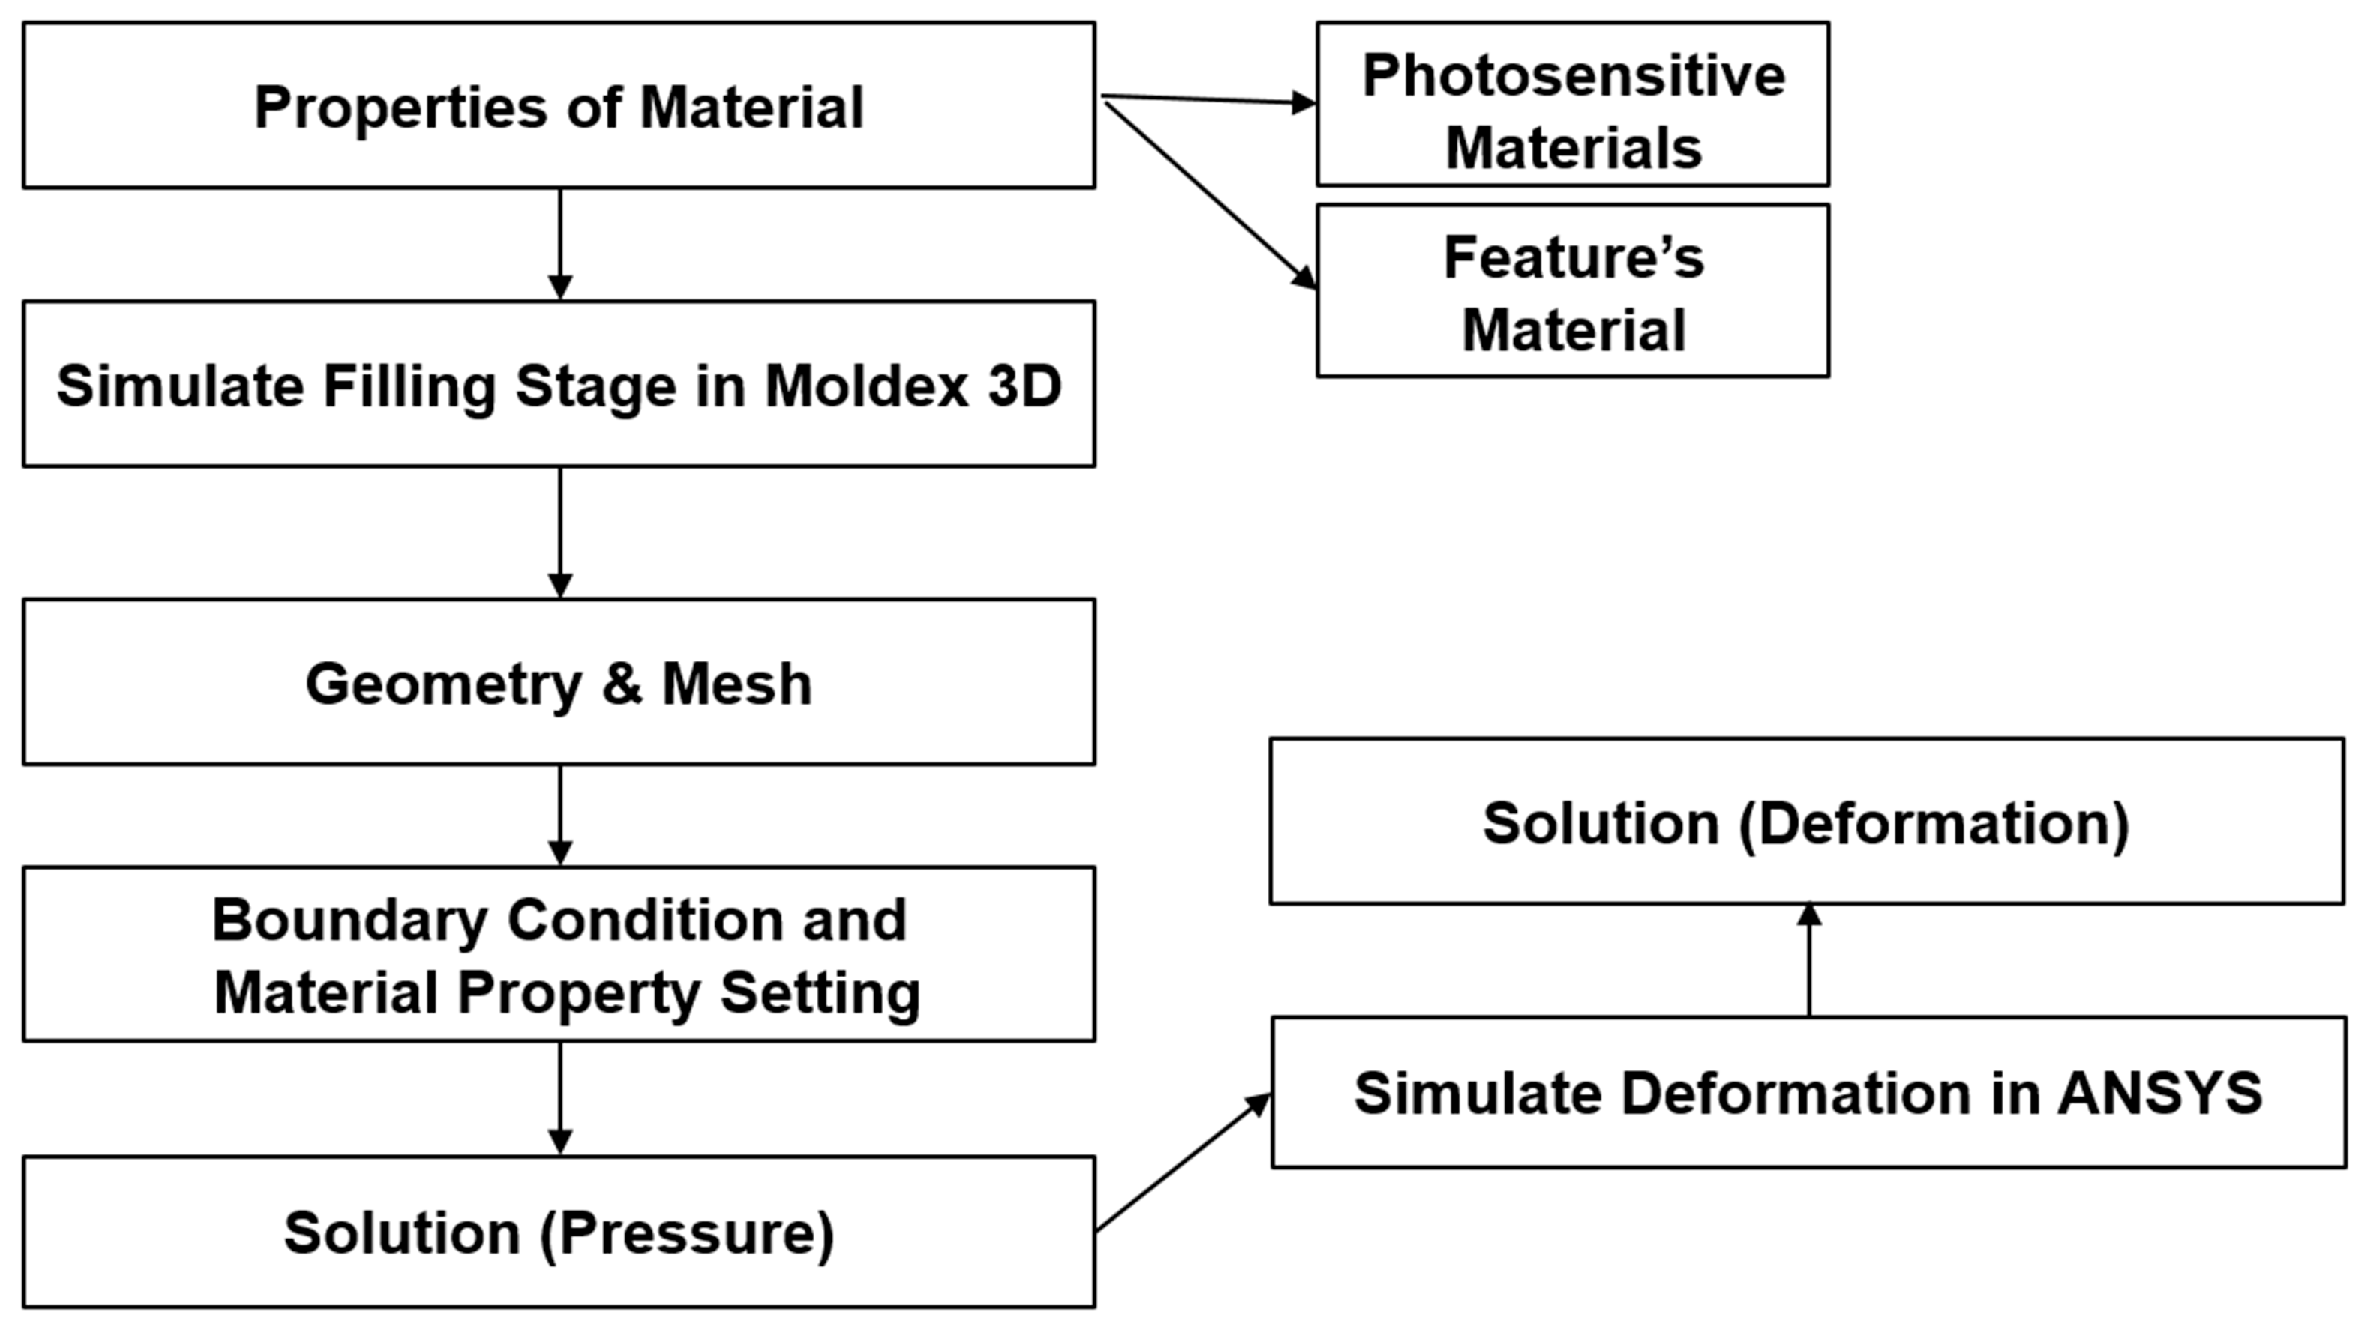
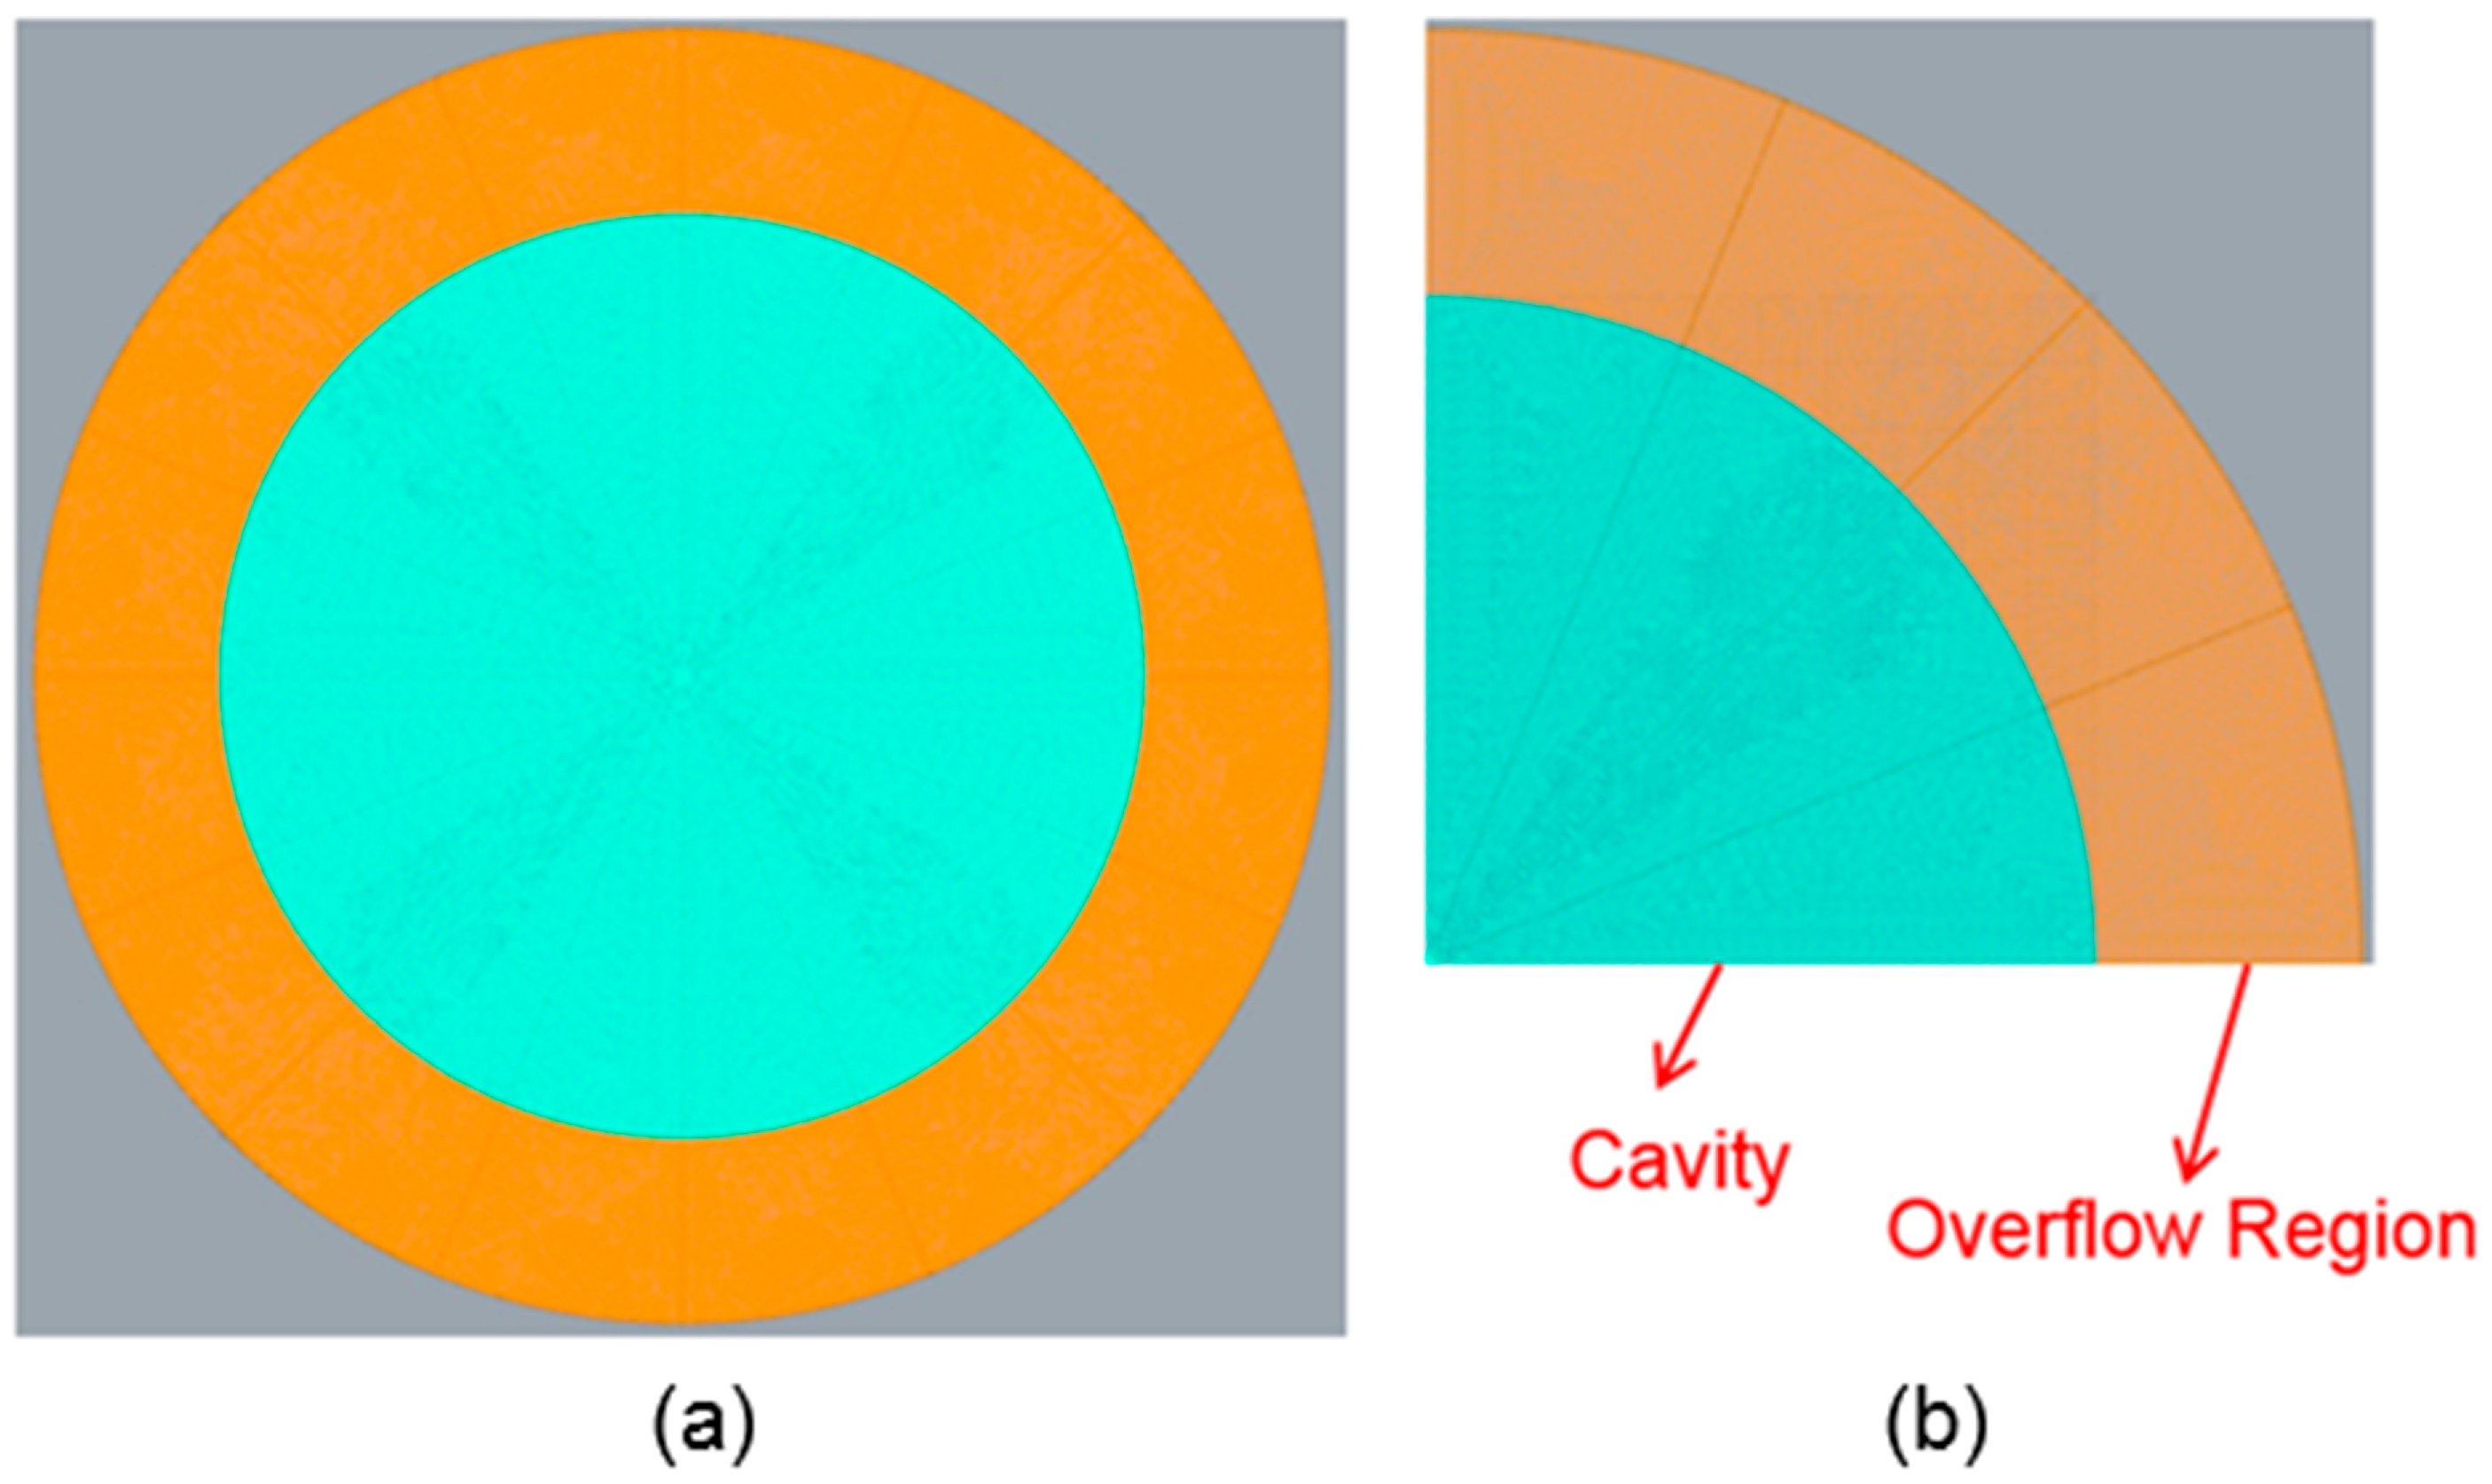
2.2. Establishing the Simulation Models
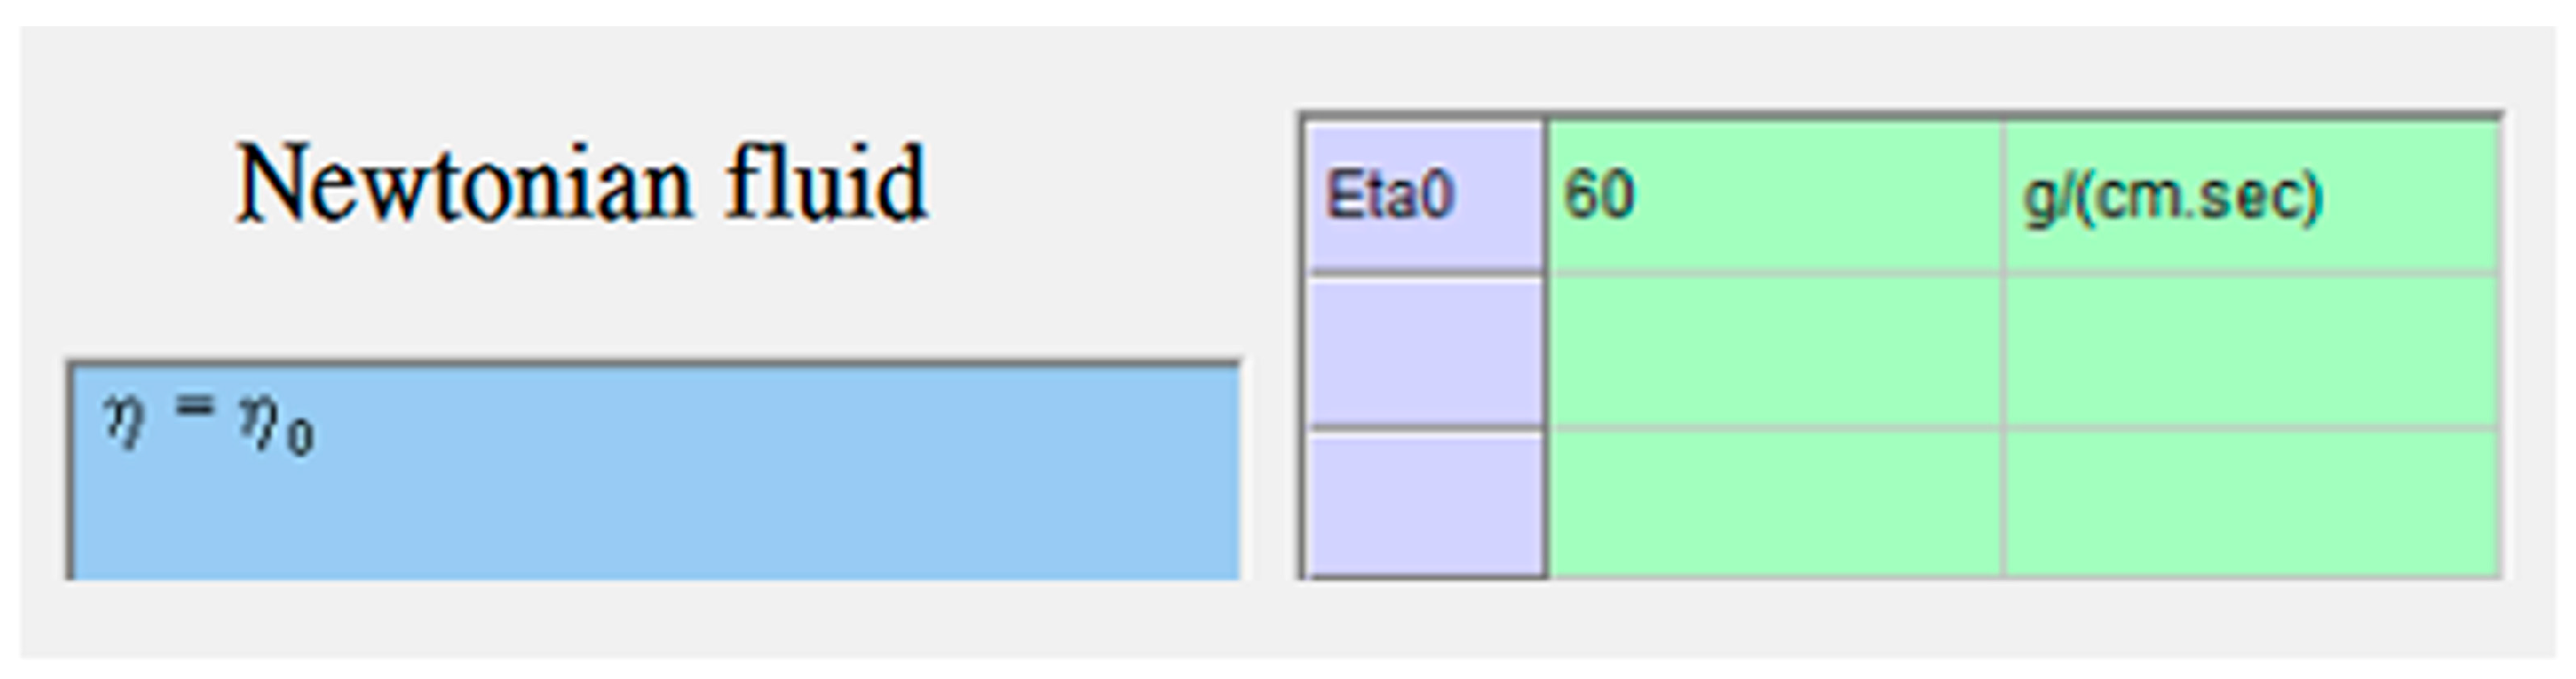
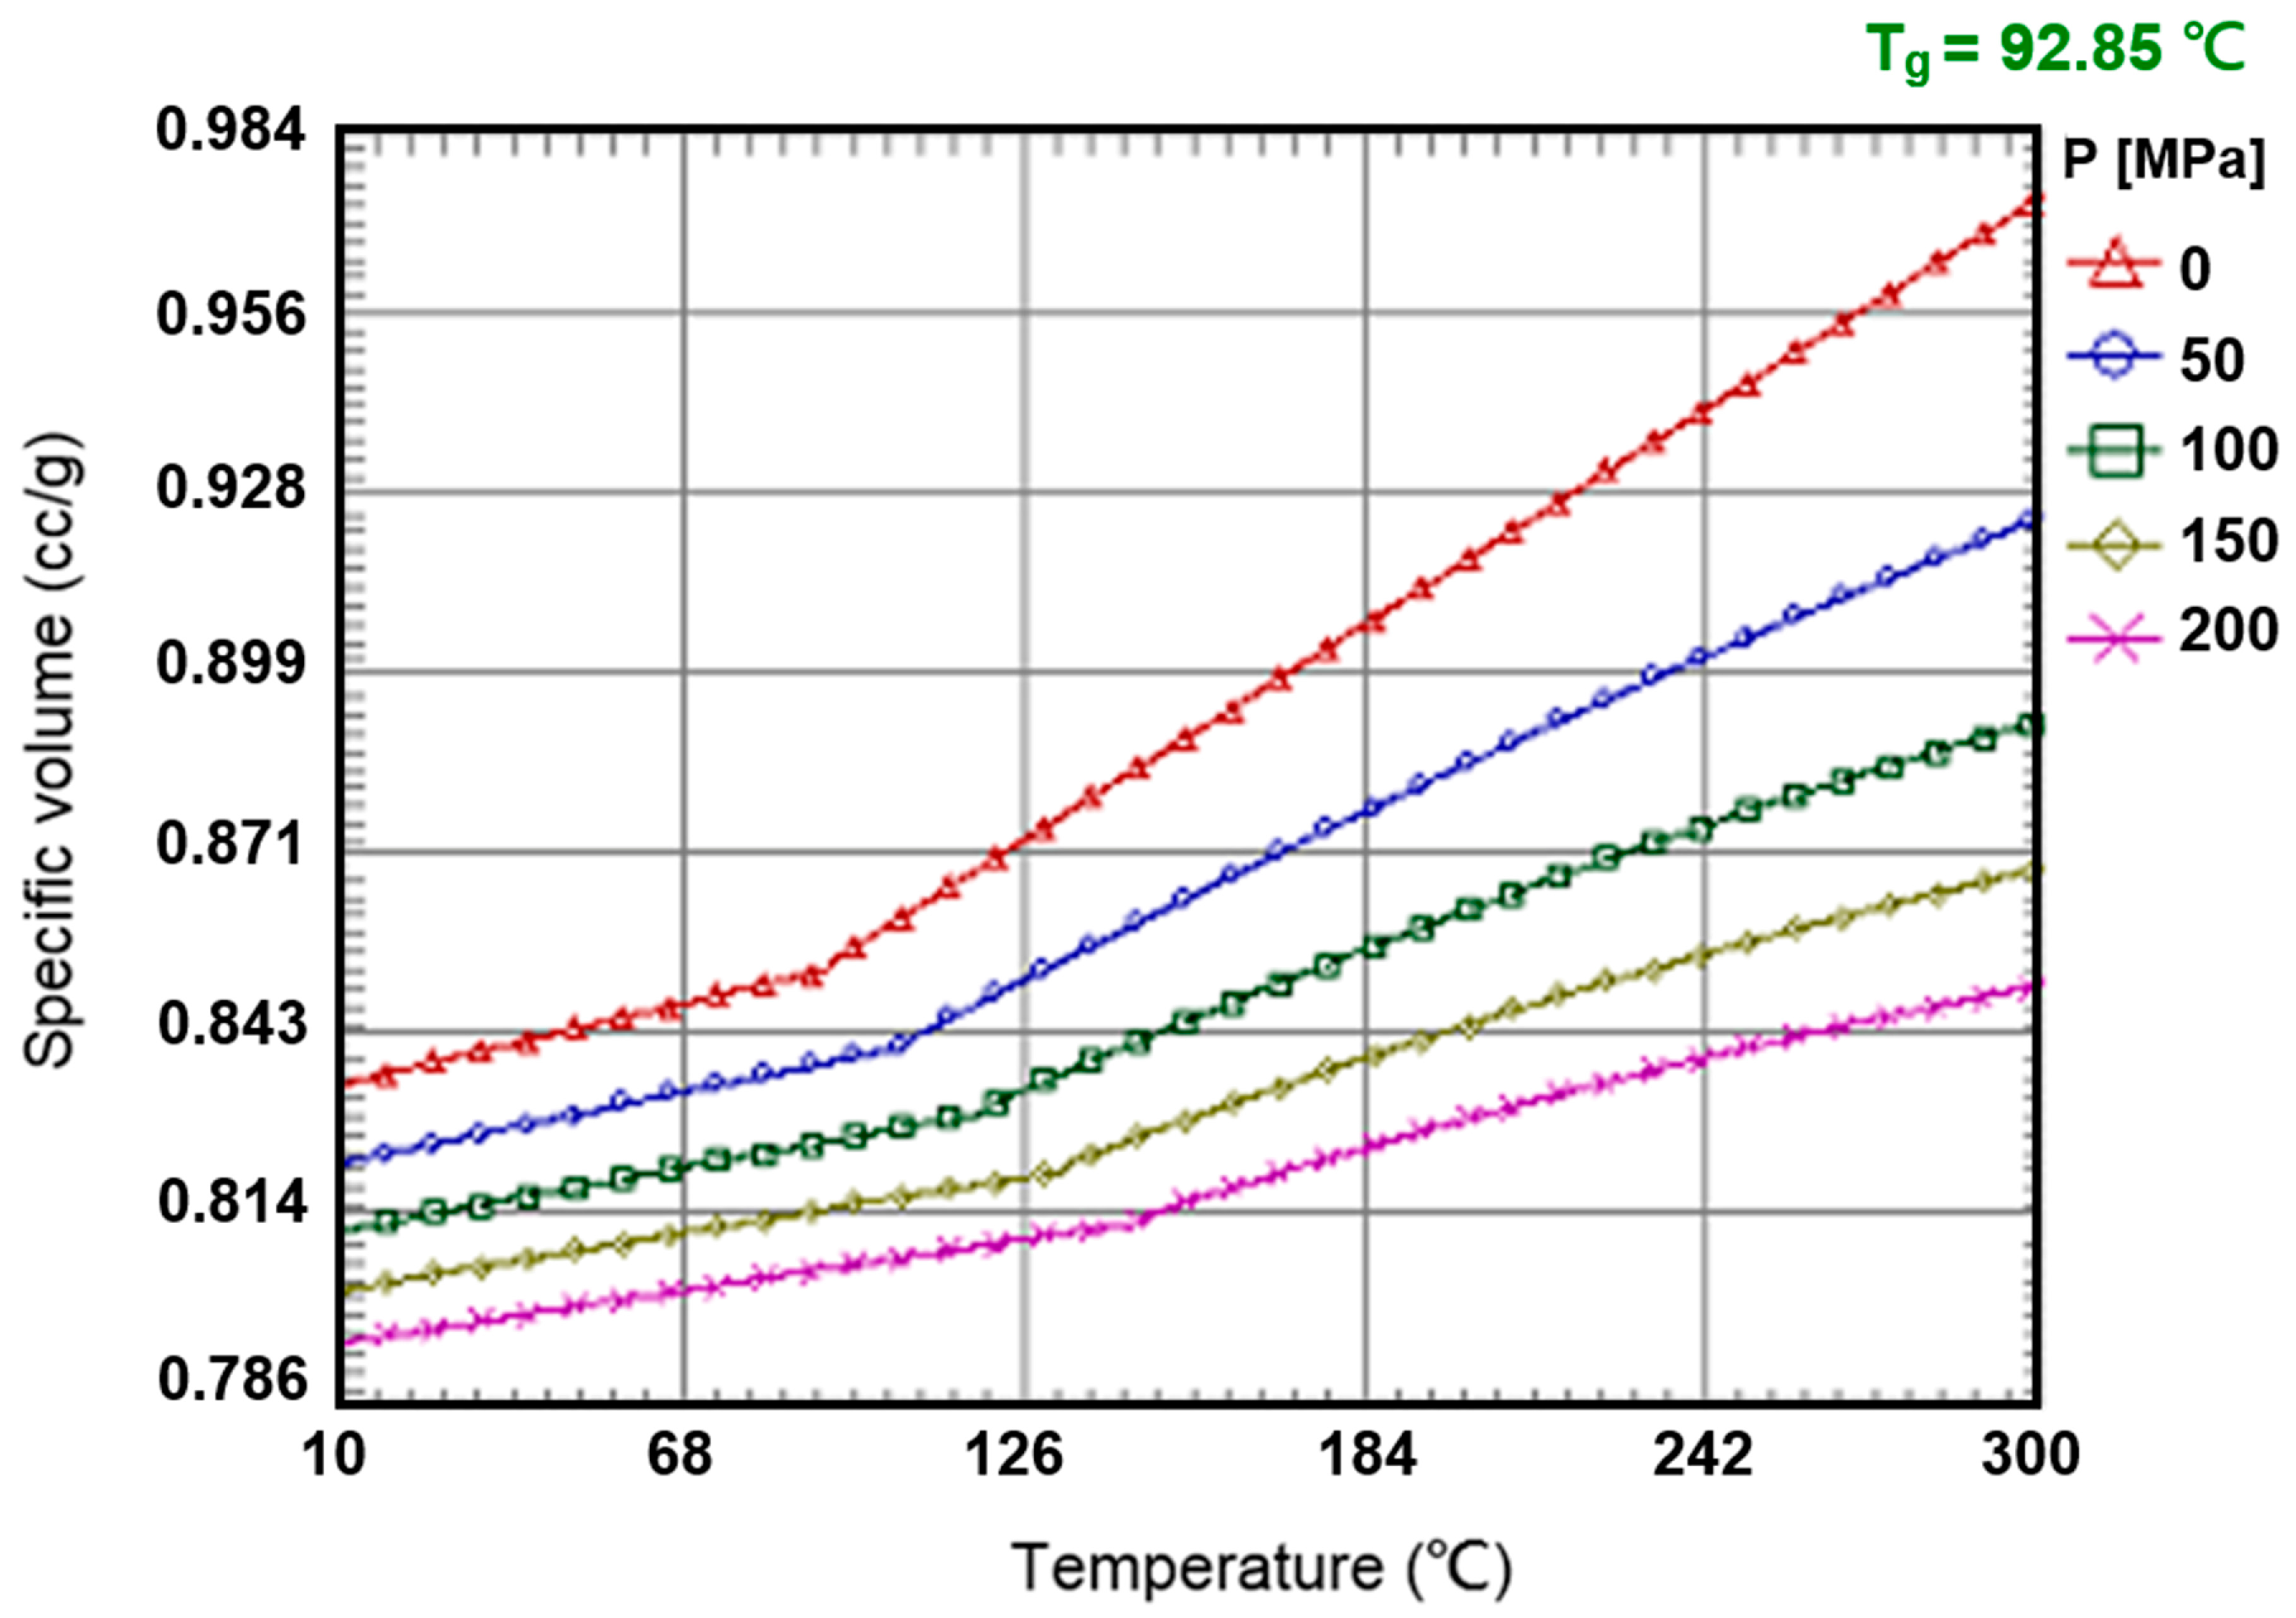
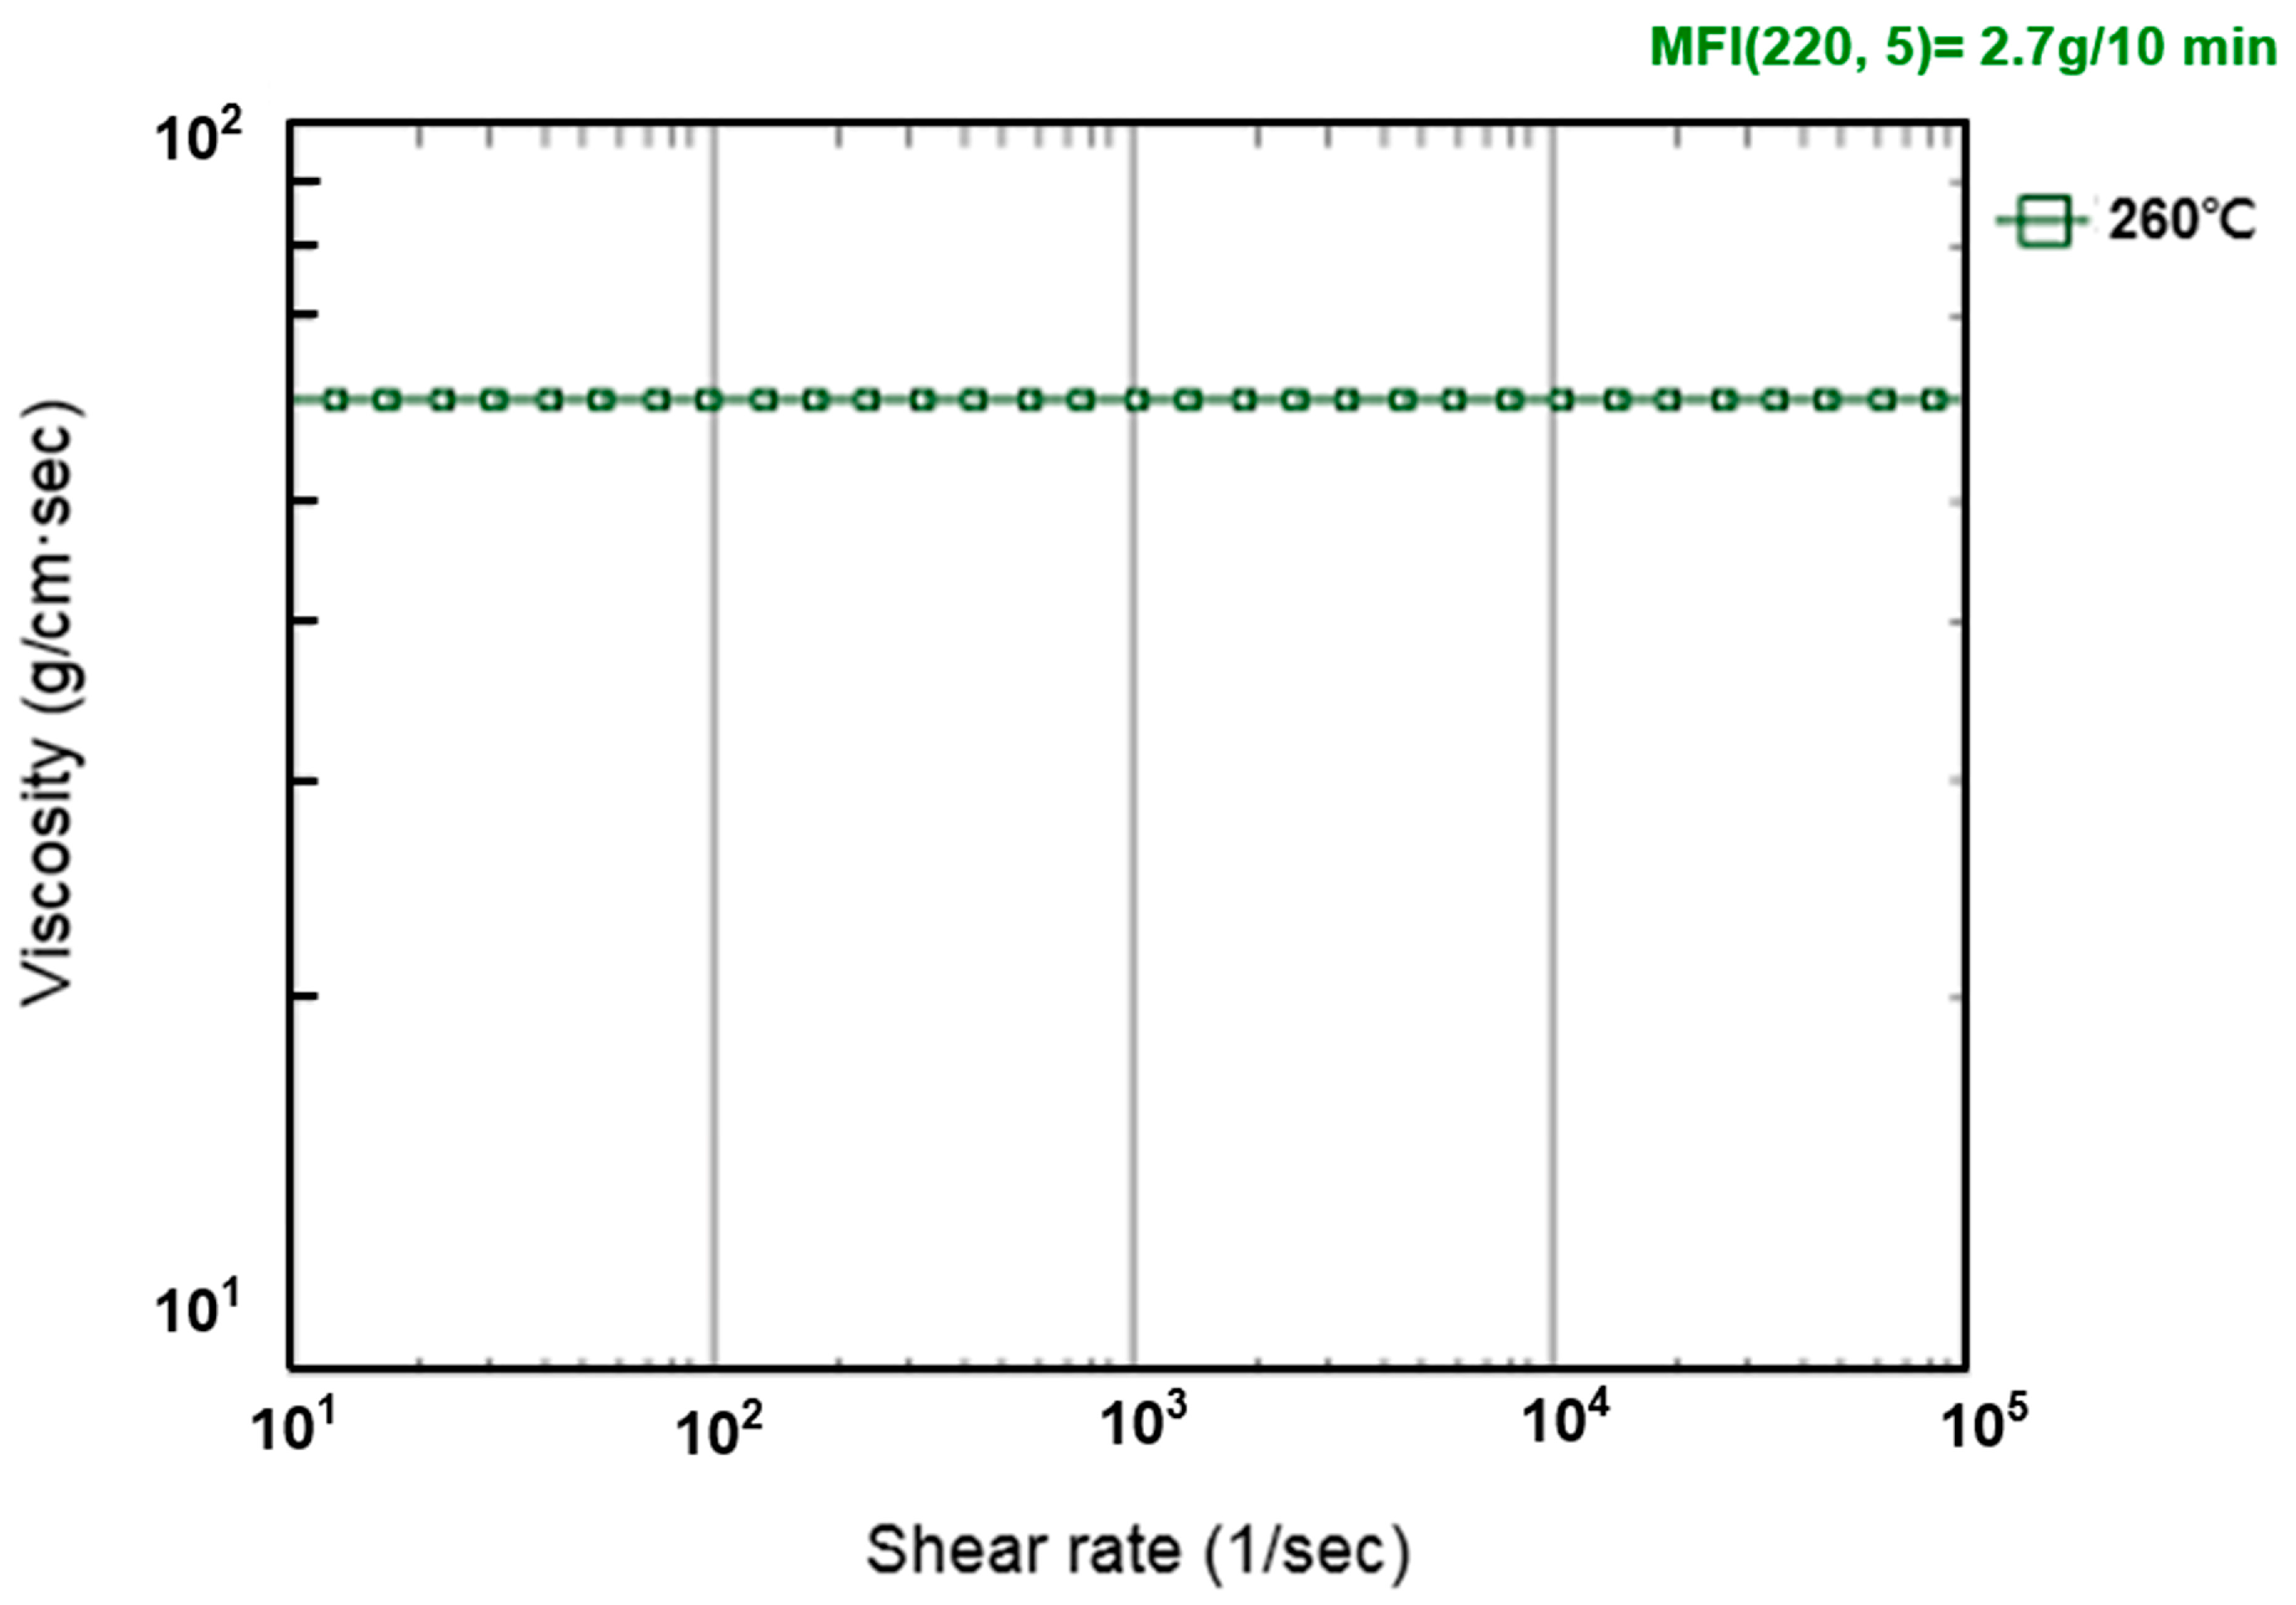
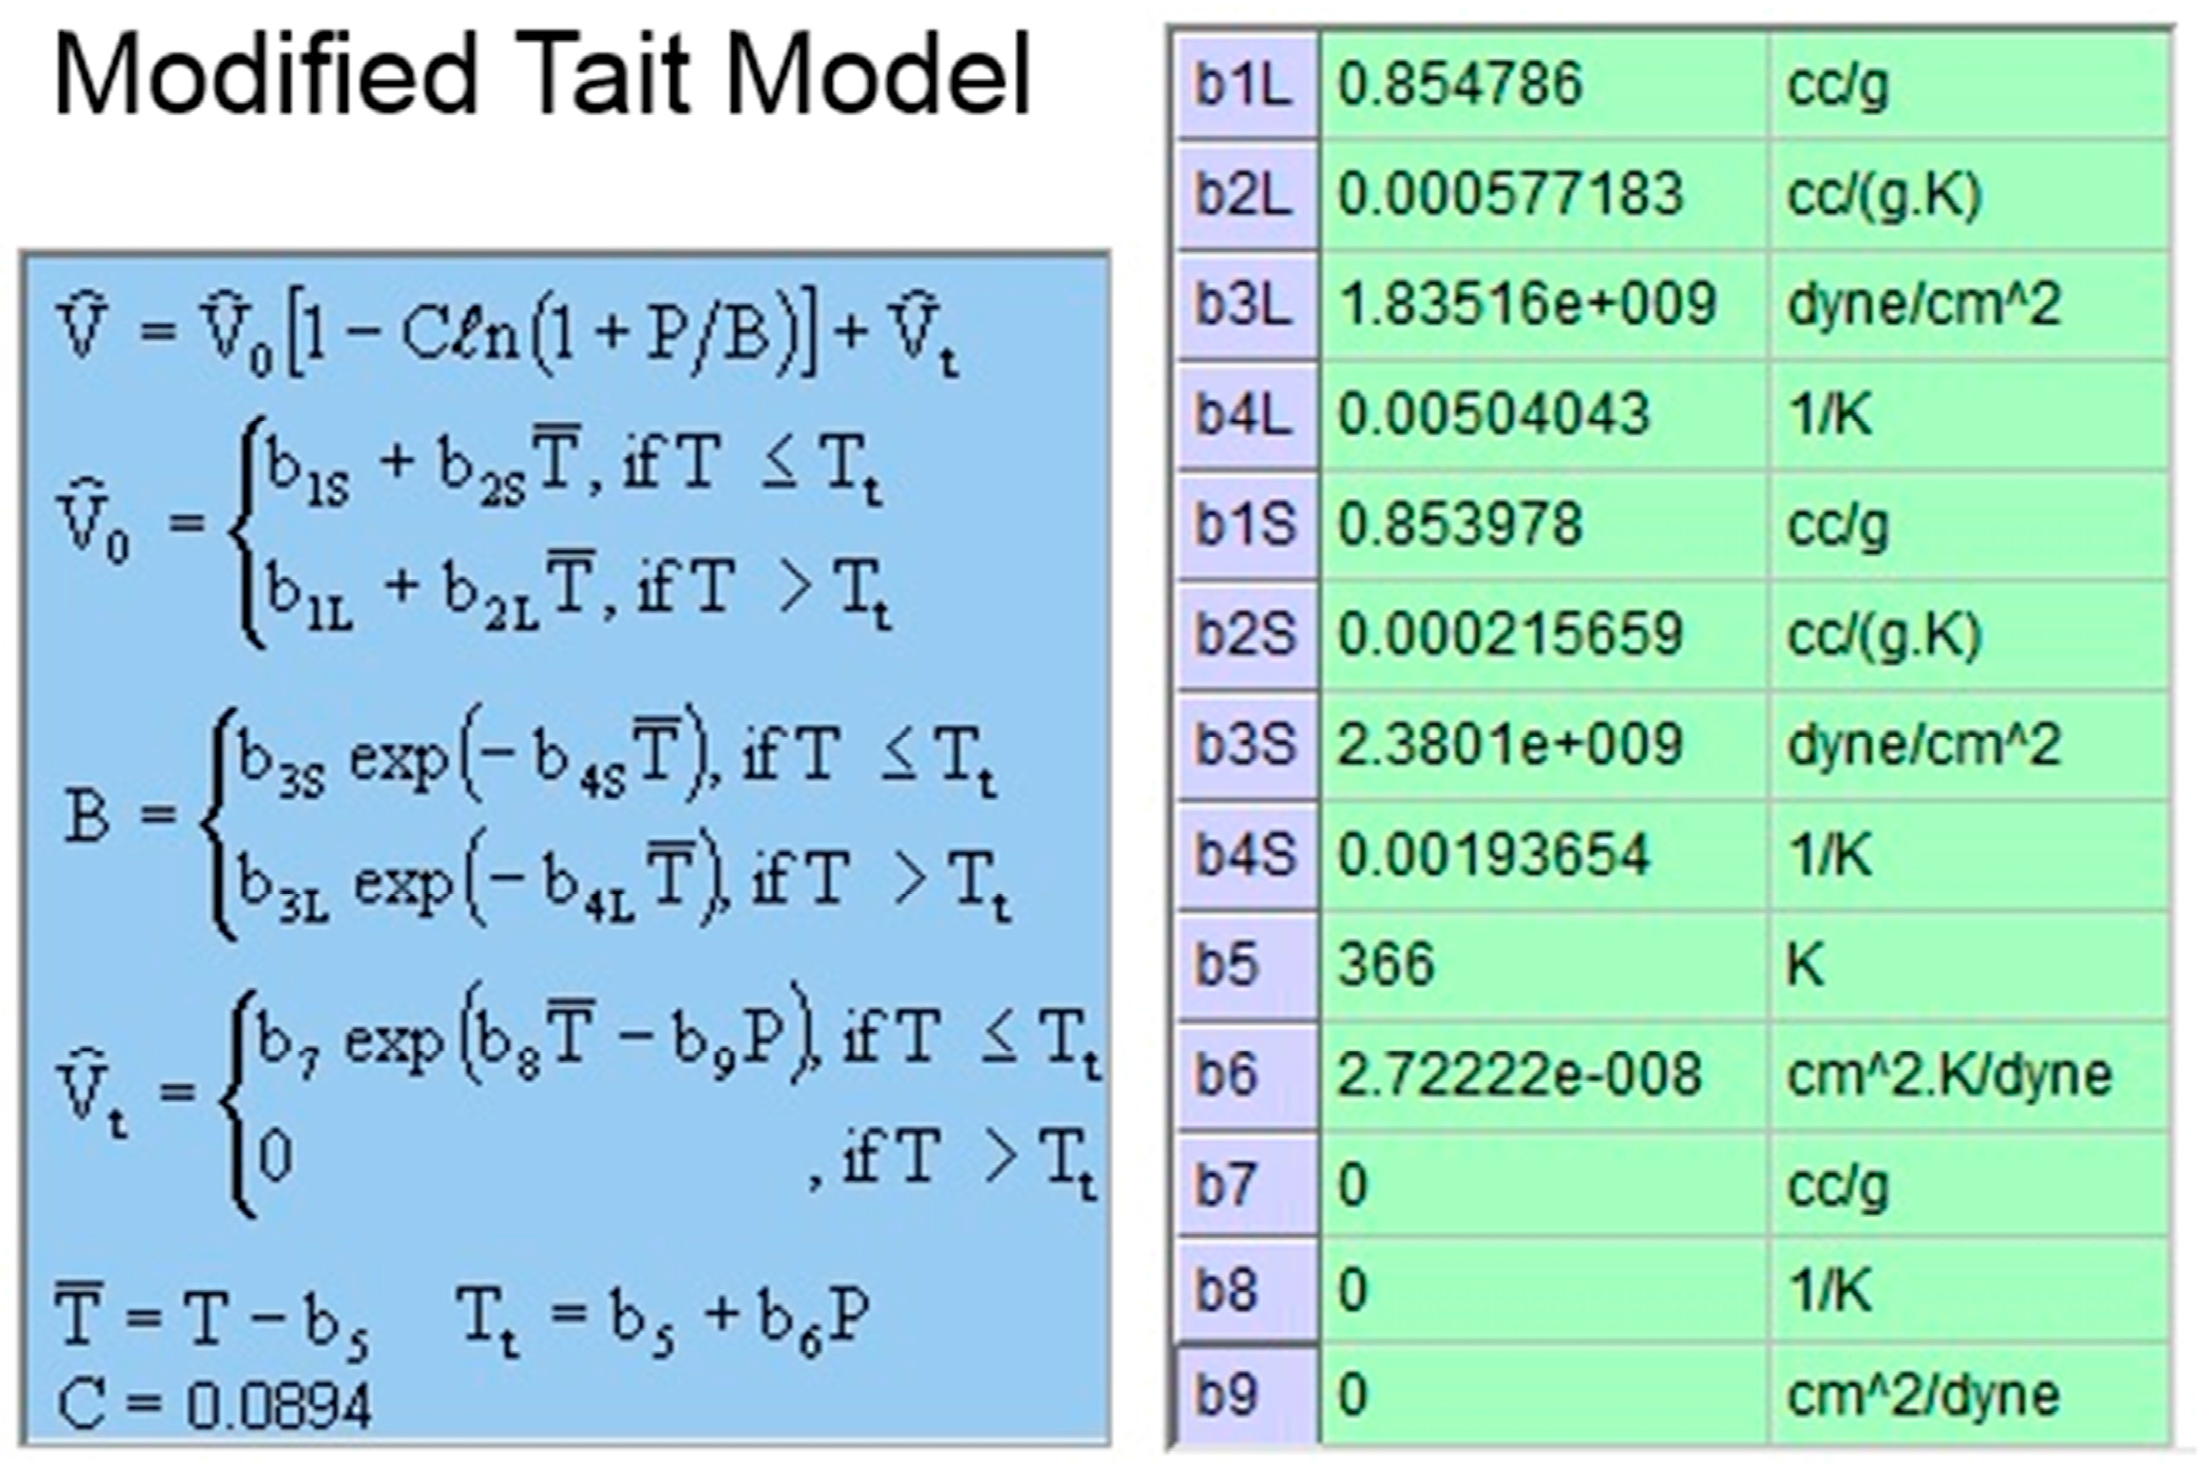
2.3. Material Properties and Process Conditions
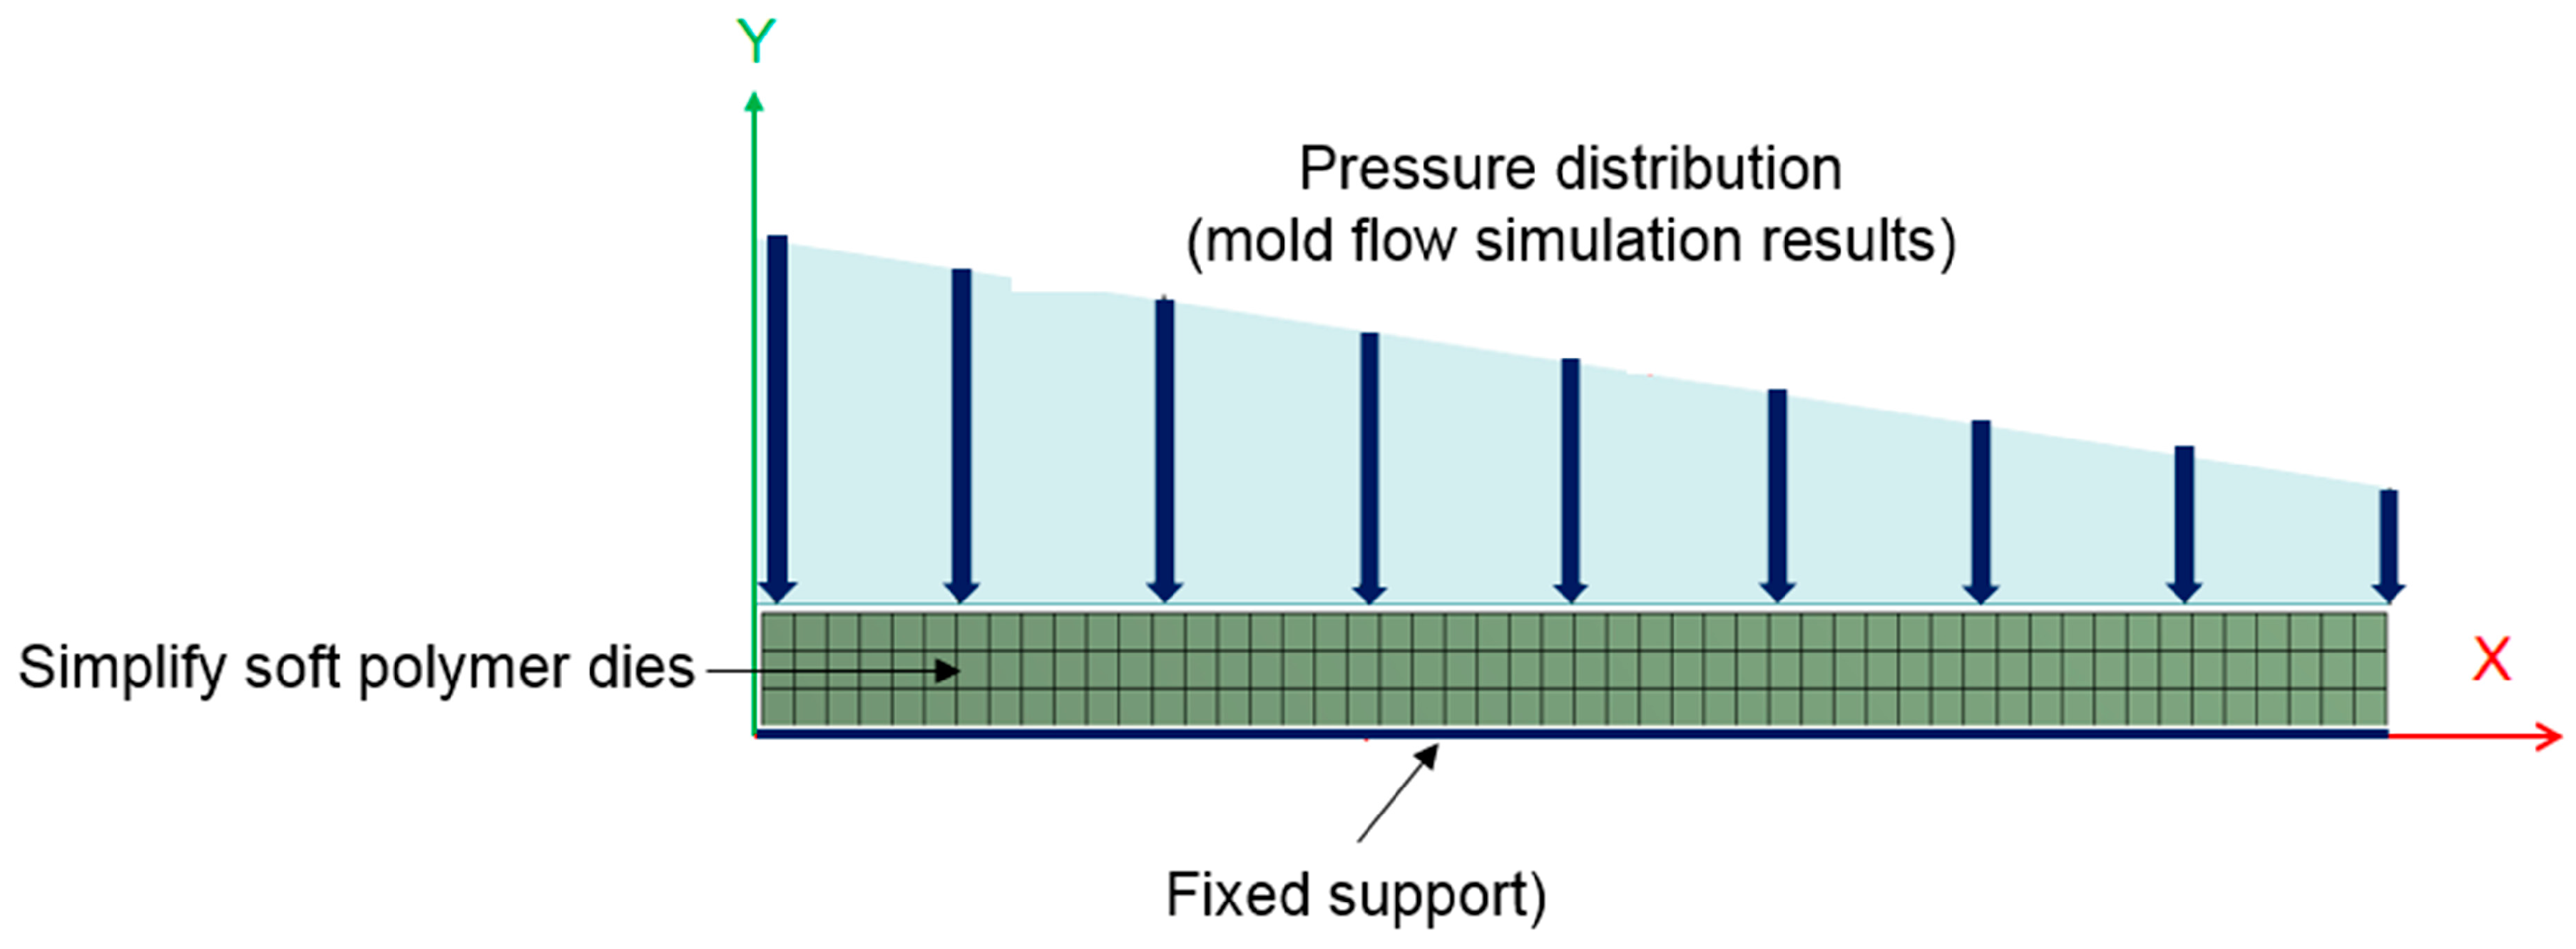
2.4. Boundary Conditions
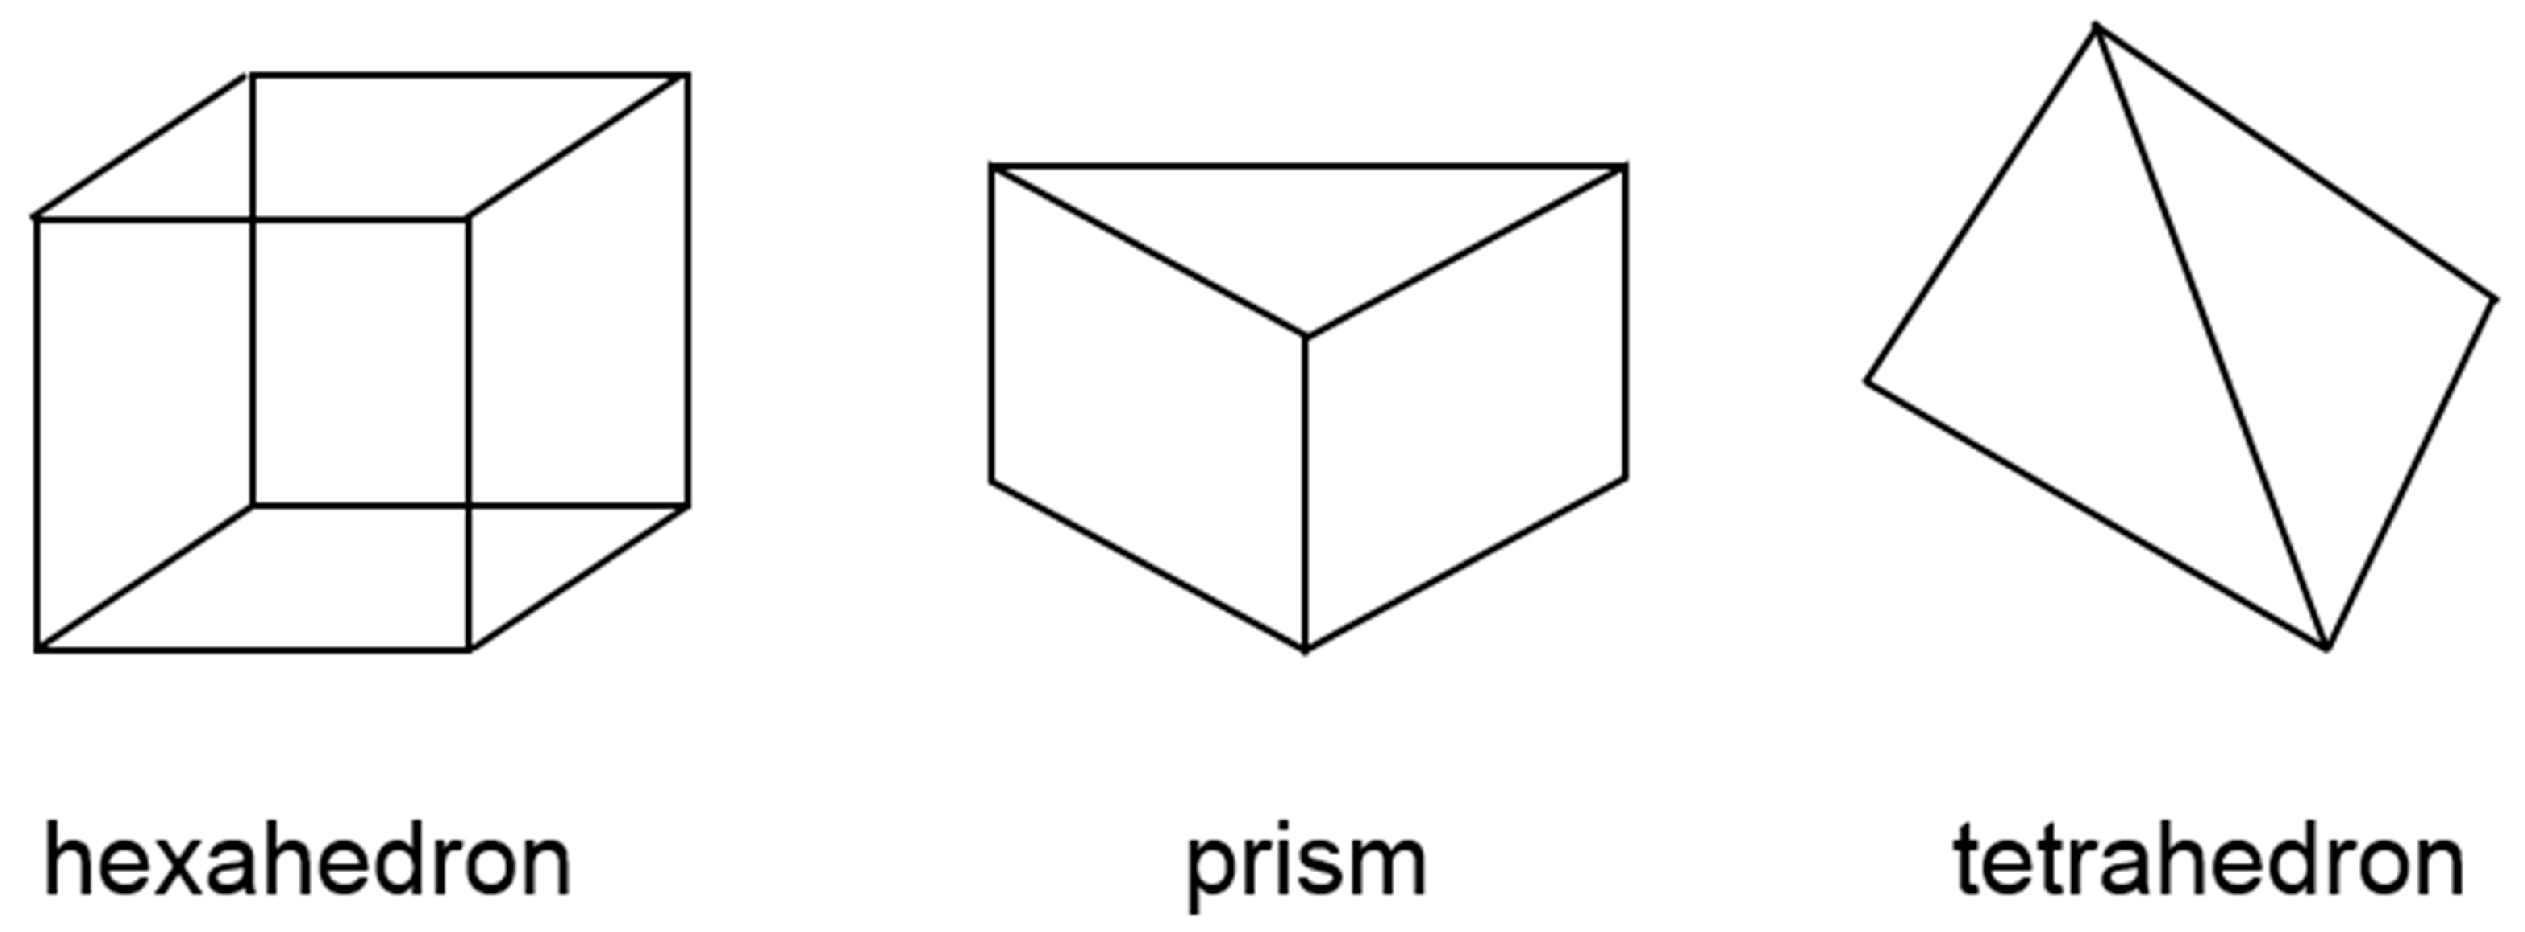
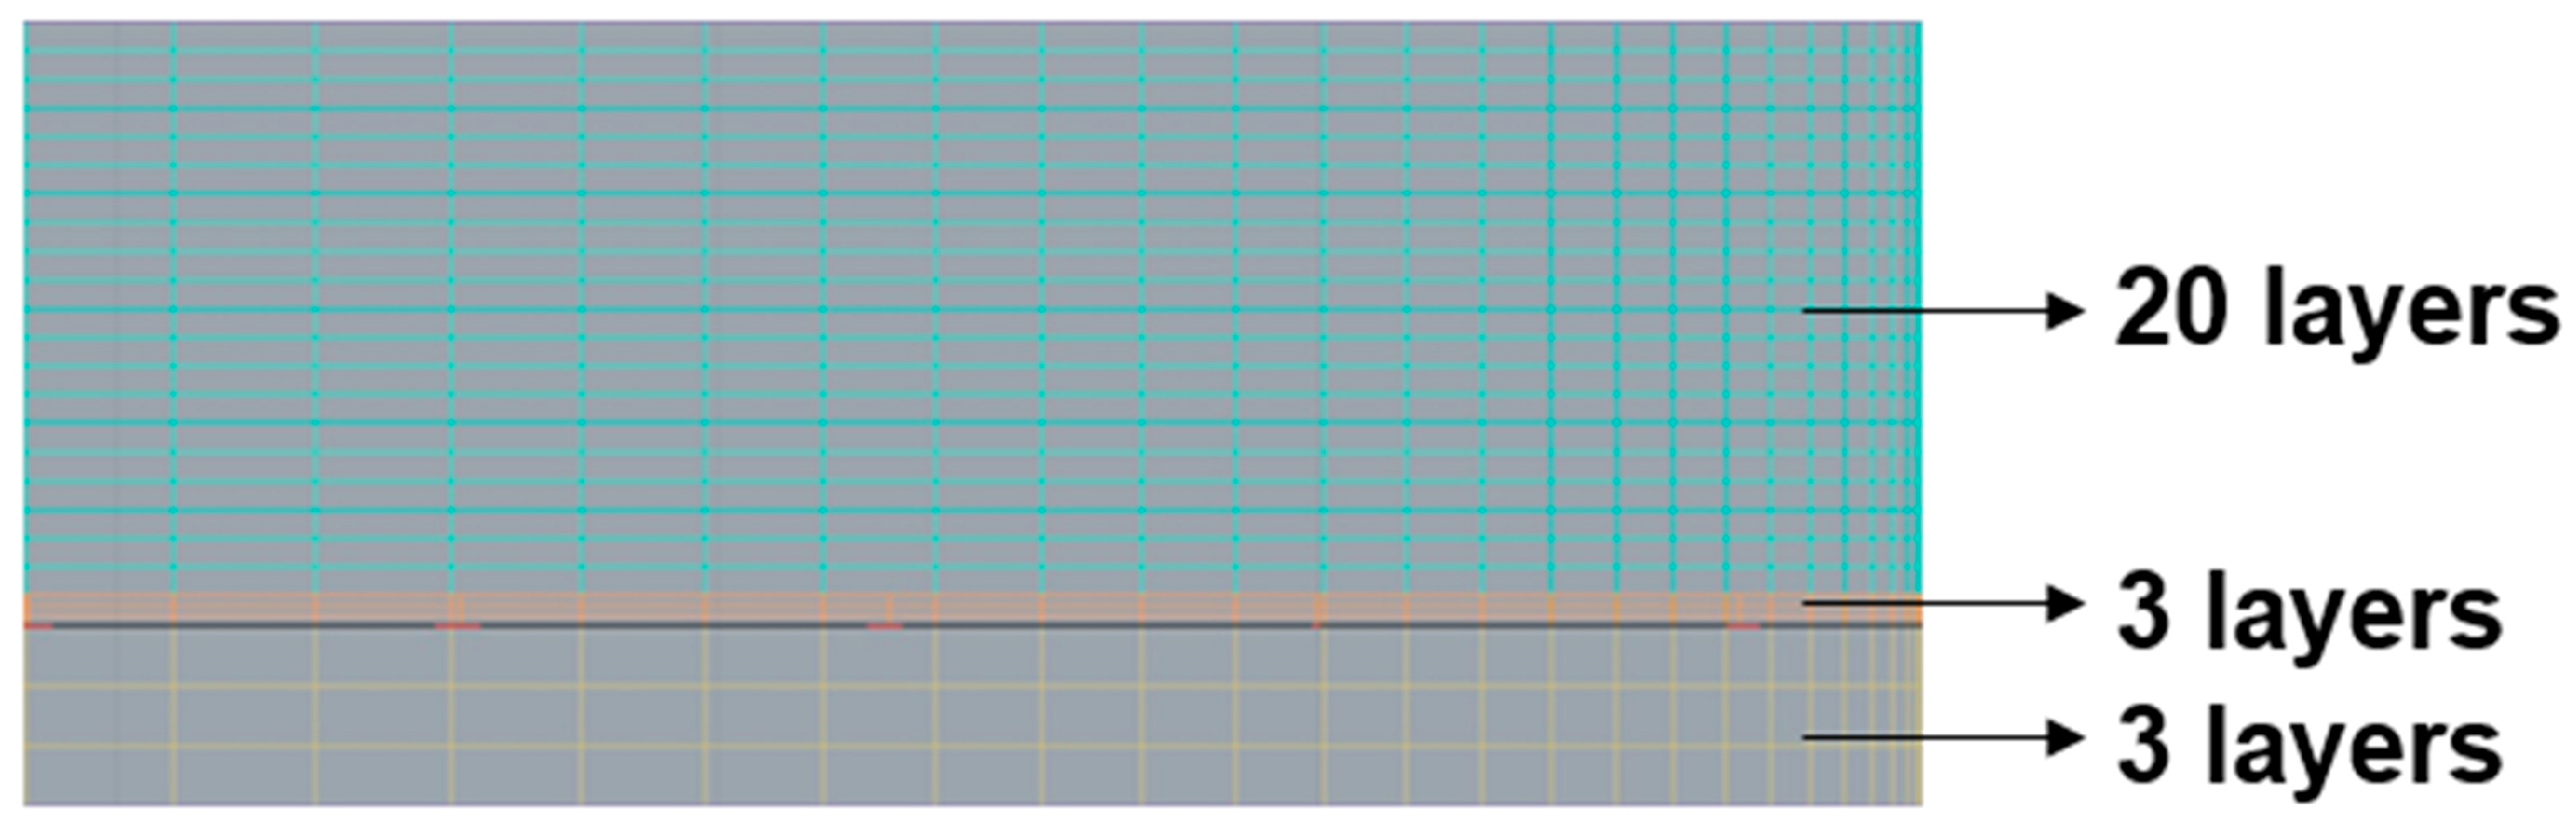
2.5. Mesh Setting
3. Results and Discussion
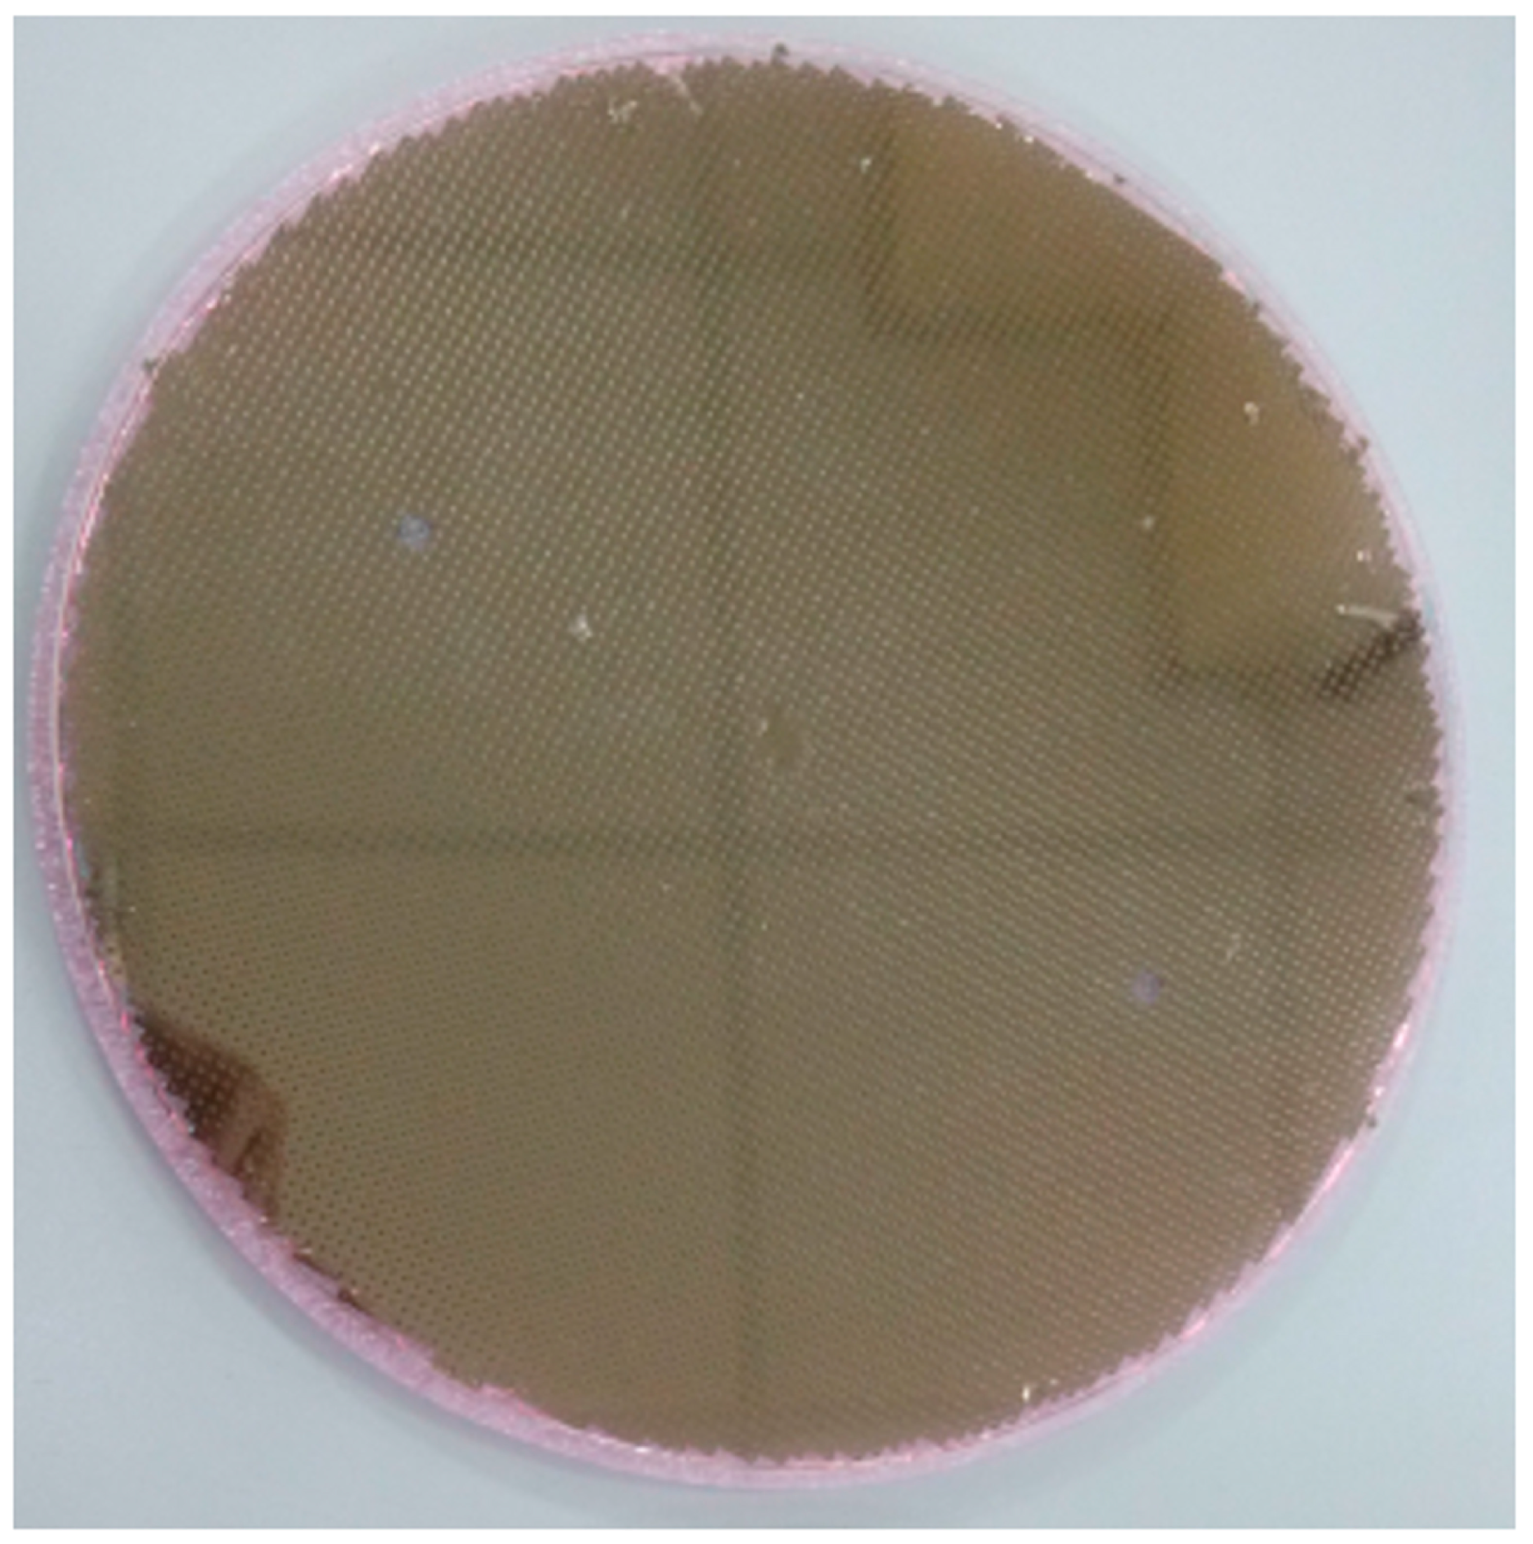
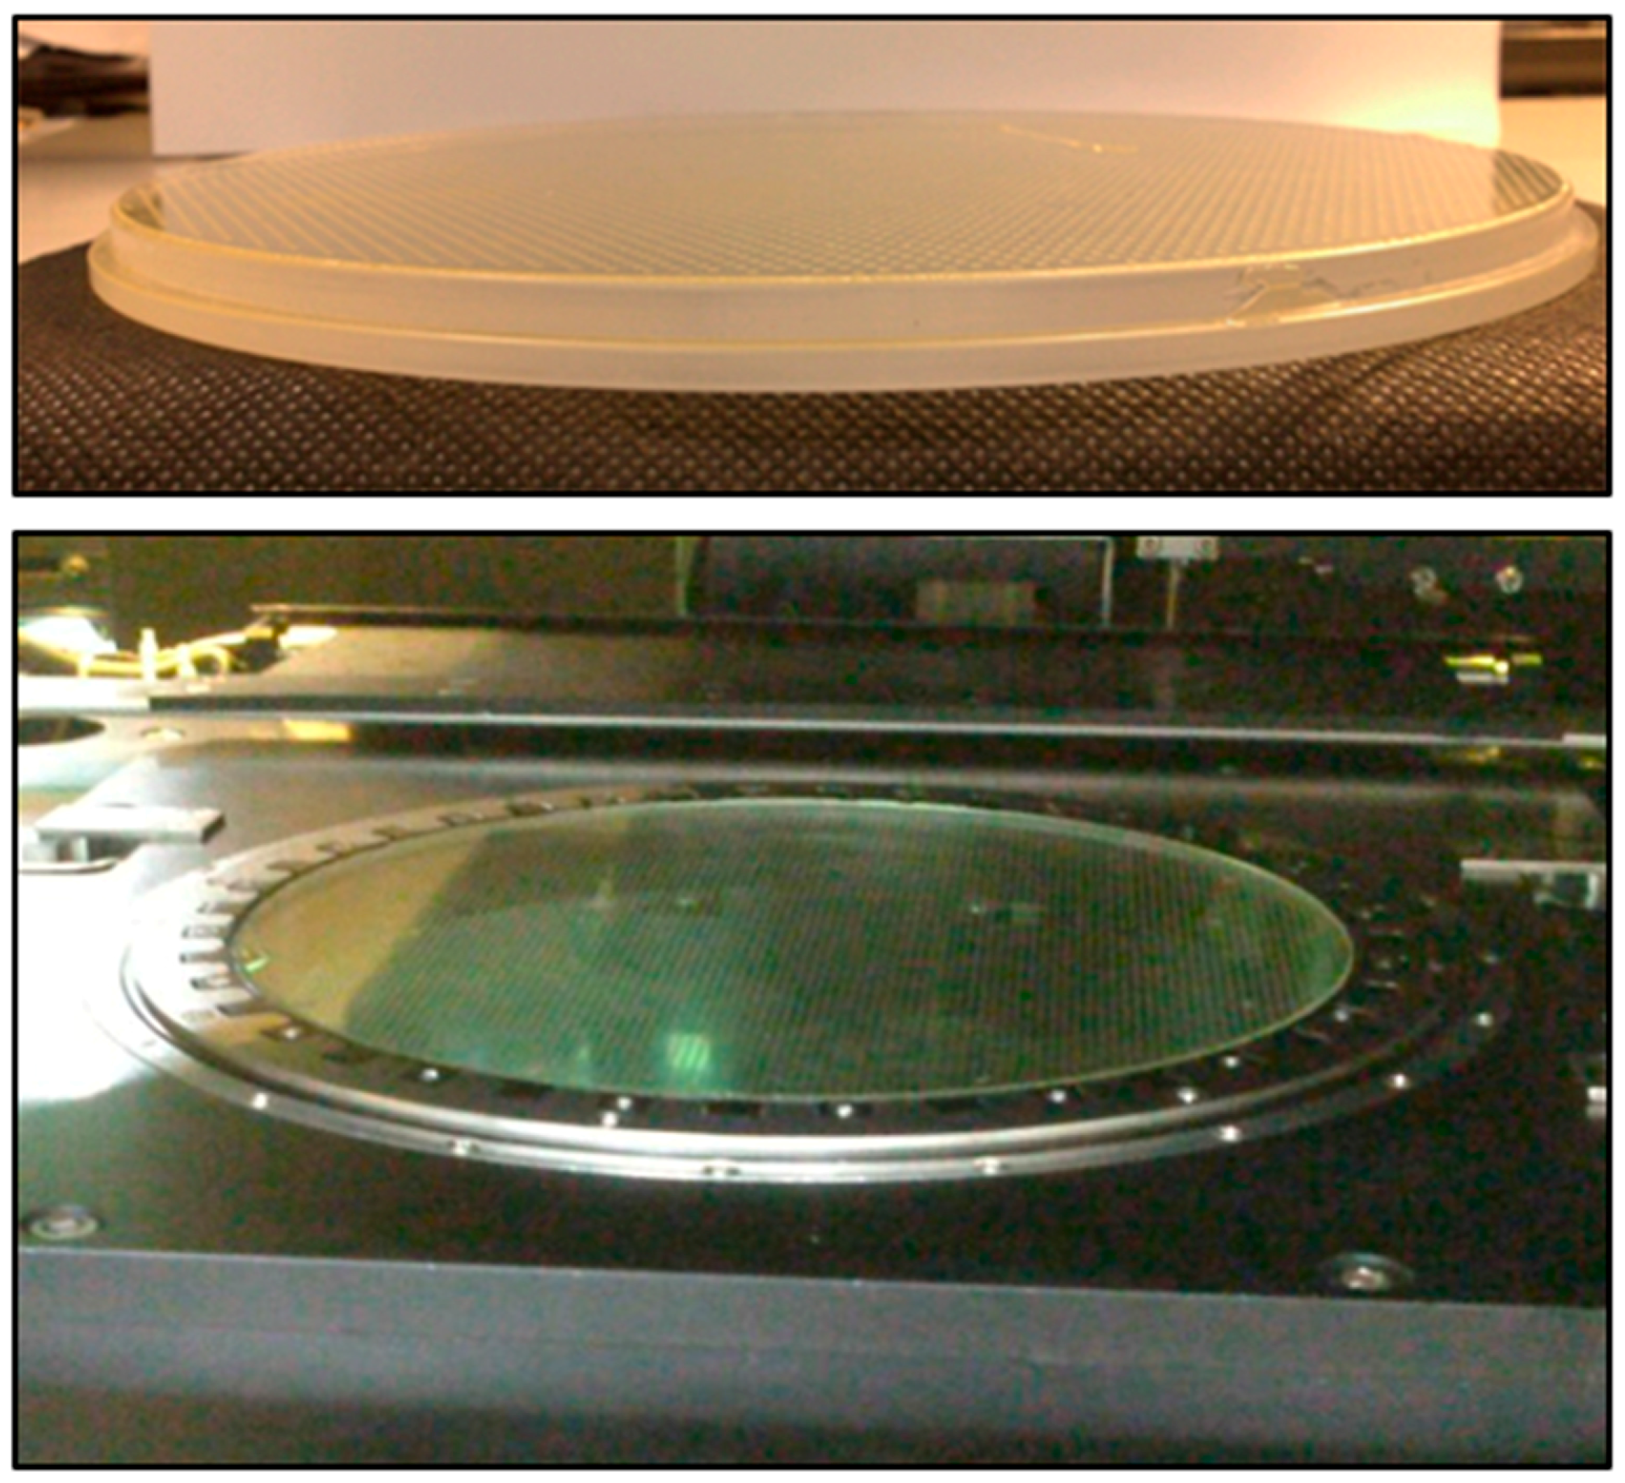
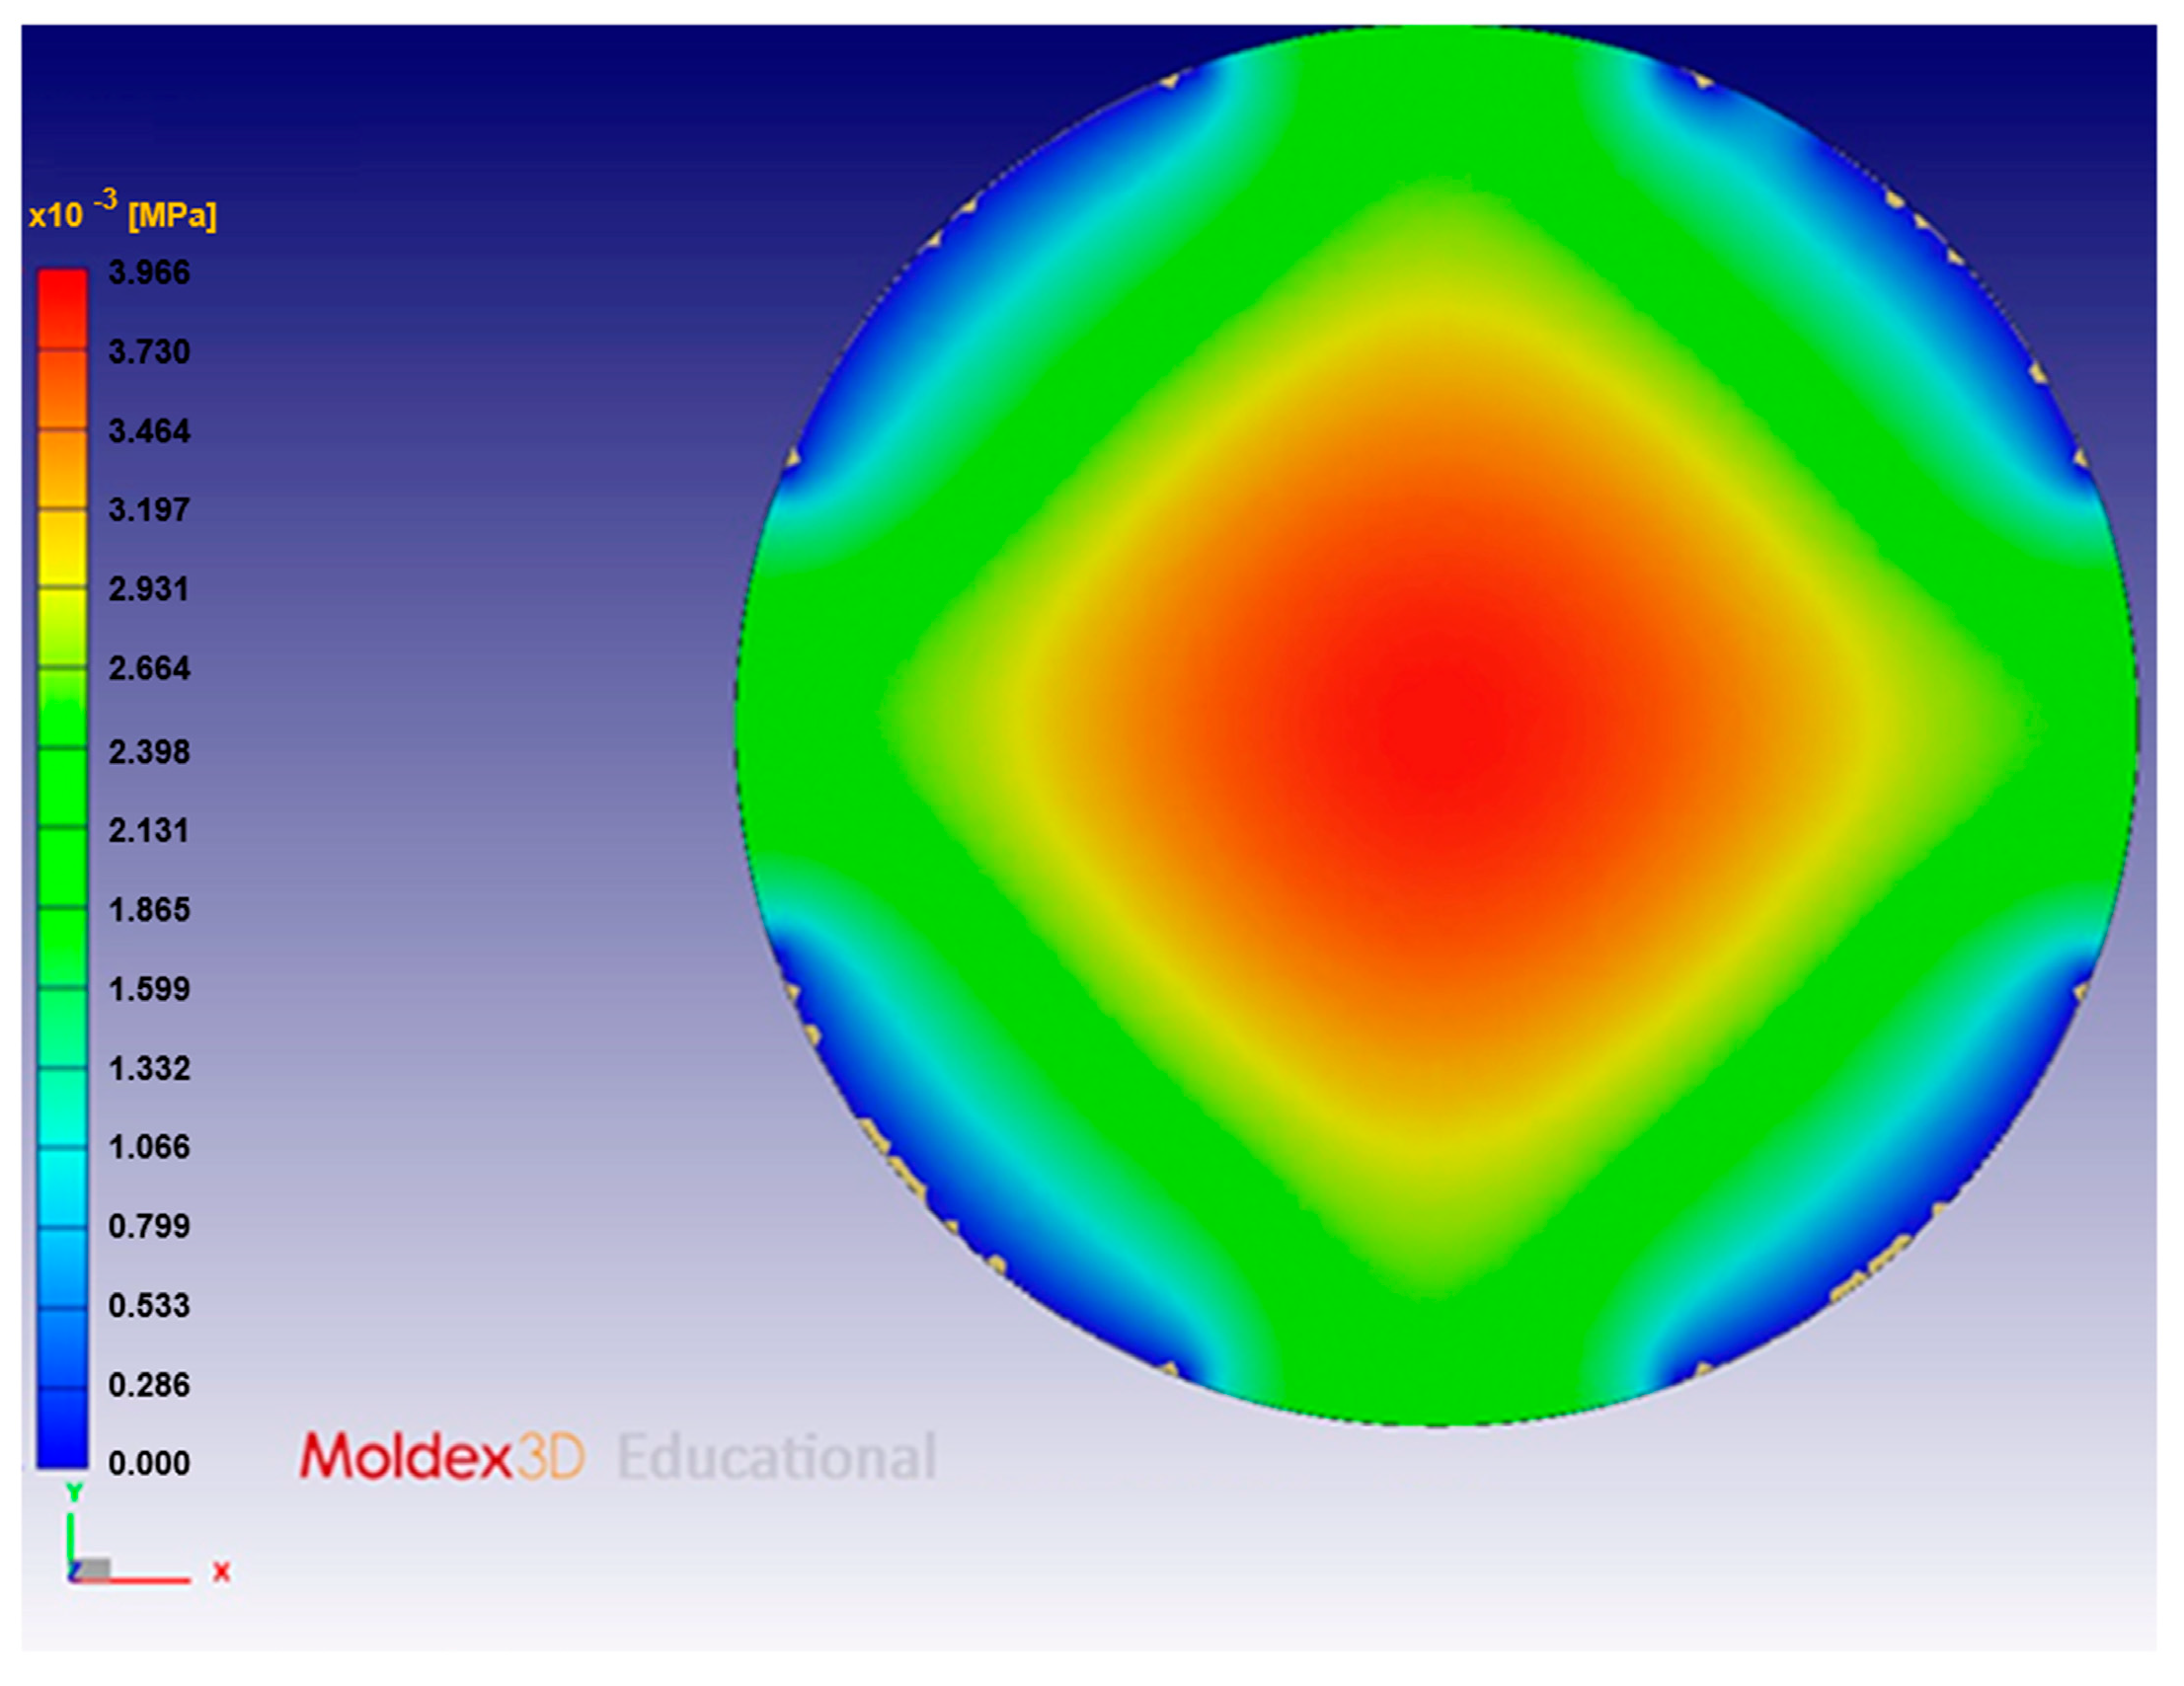
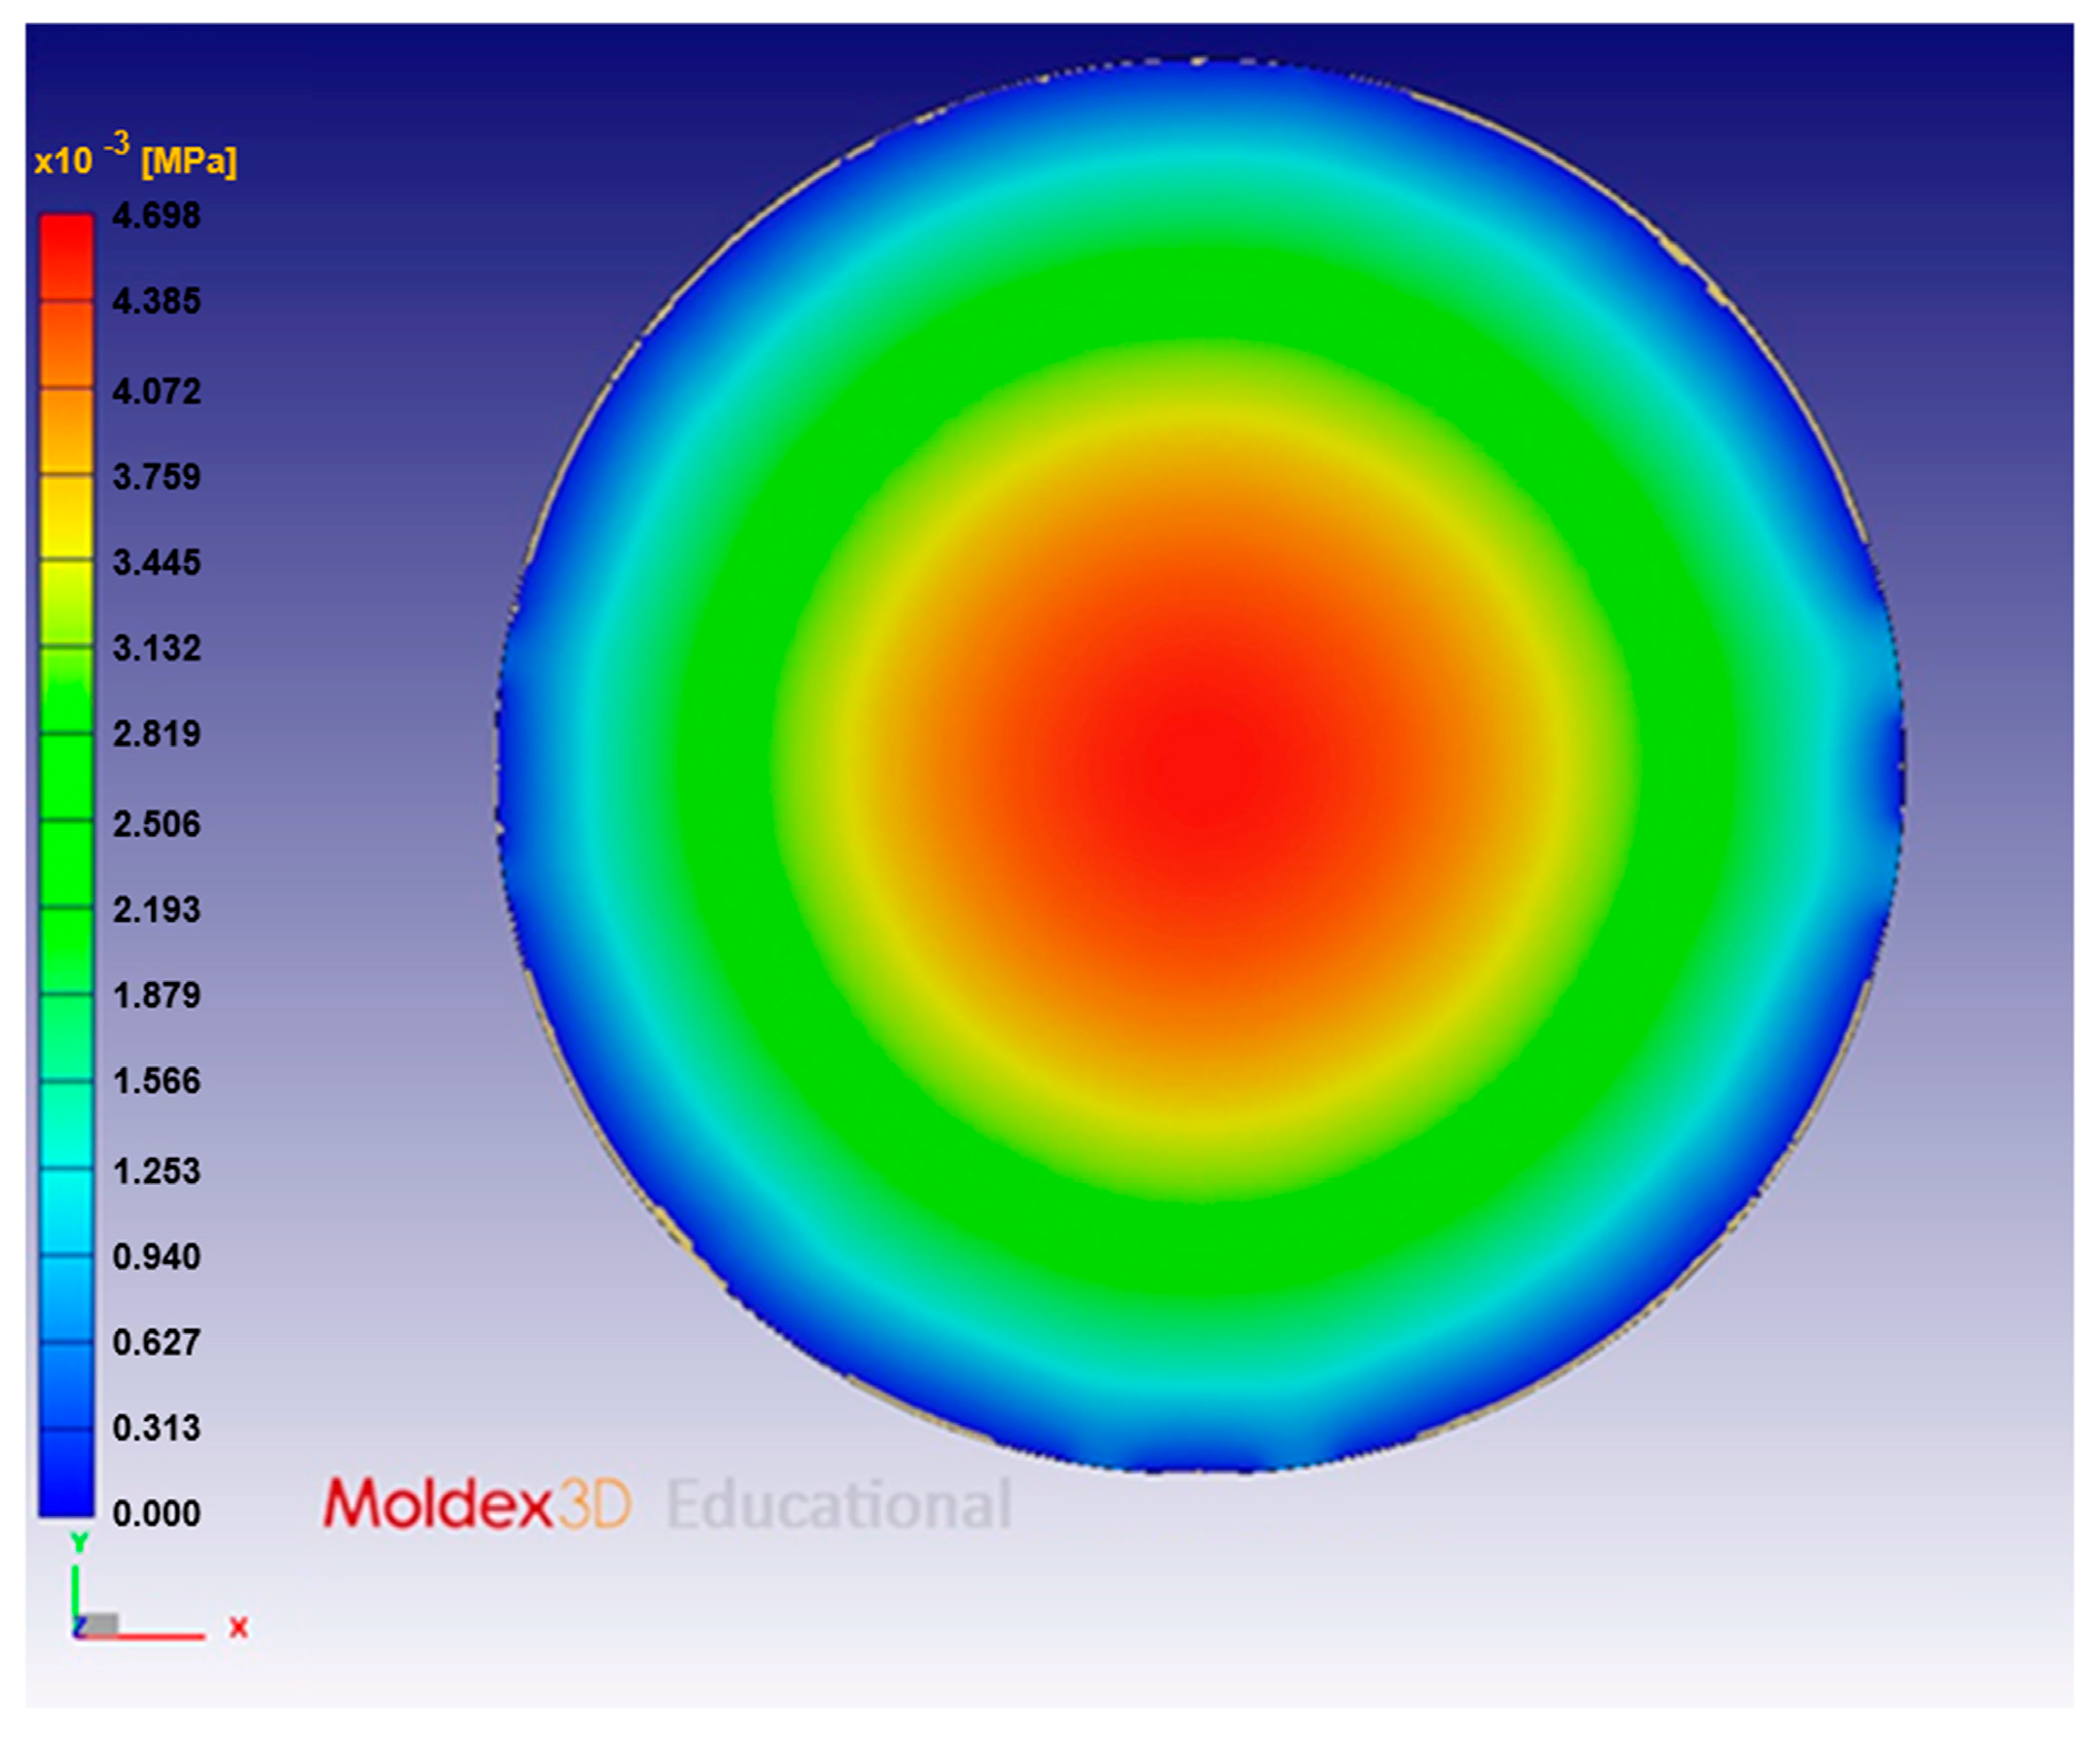
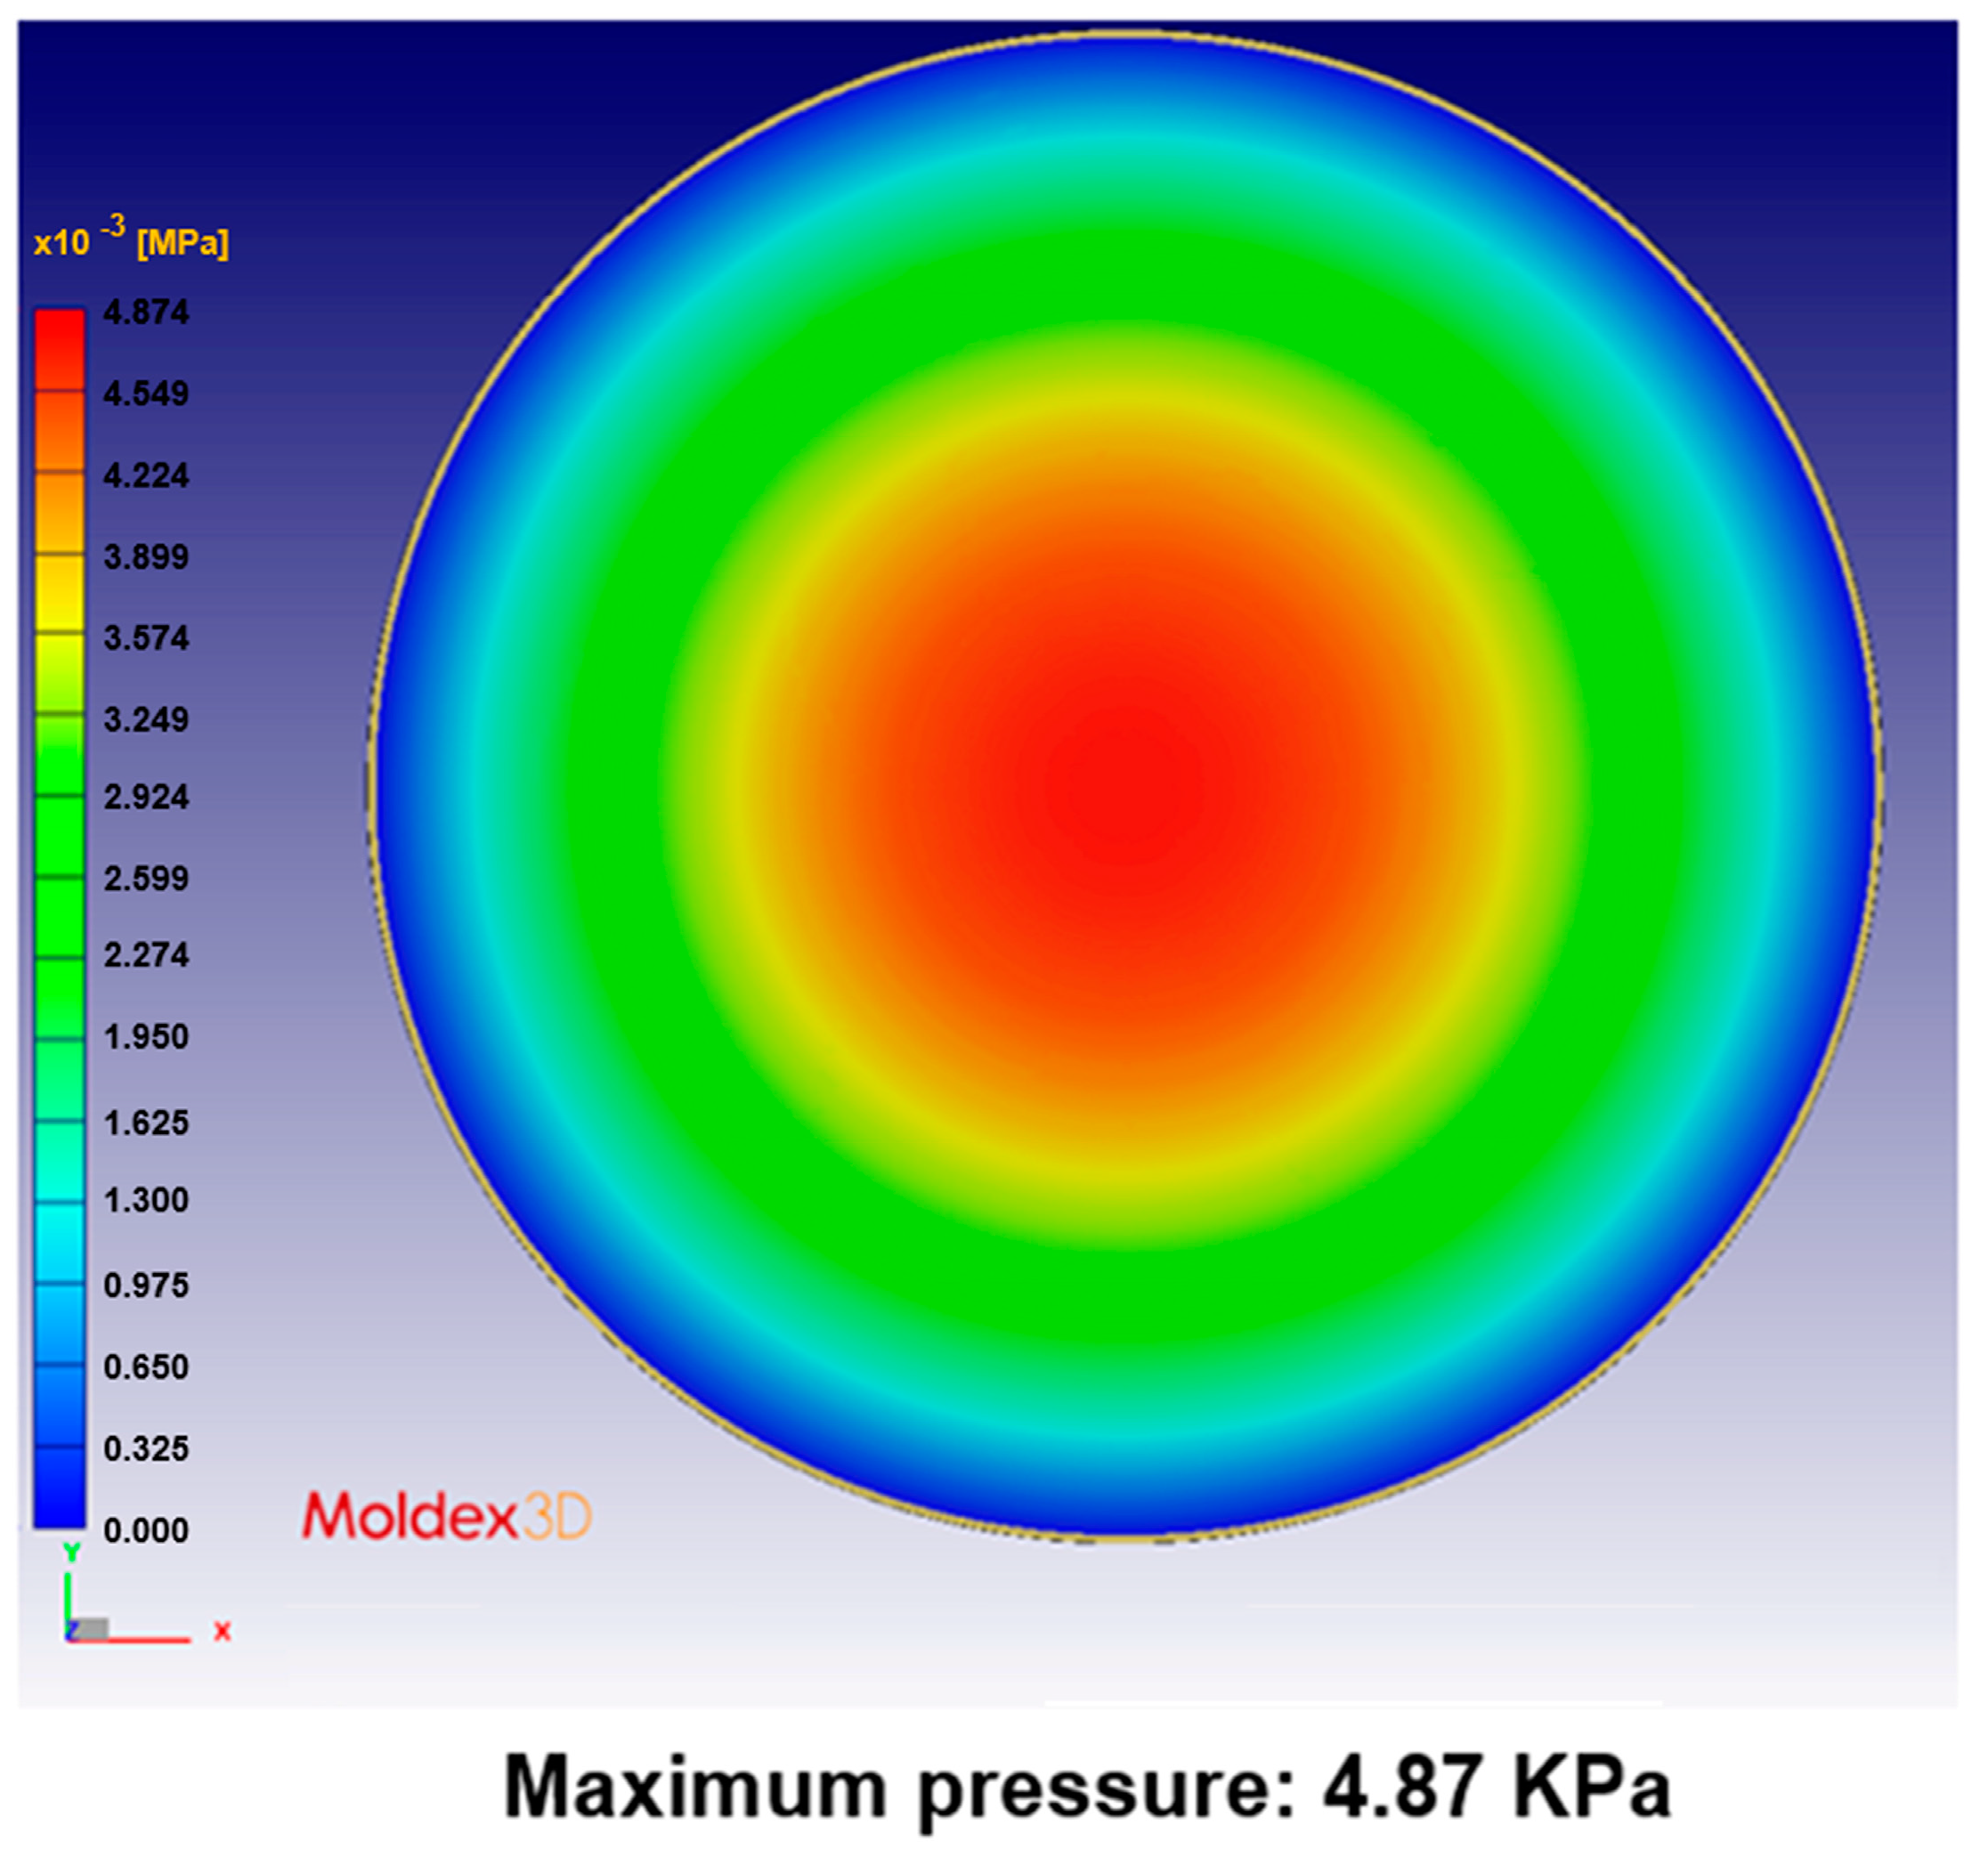
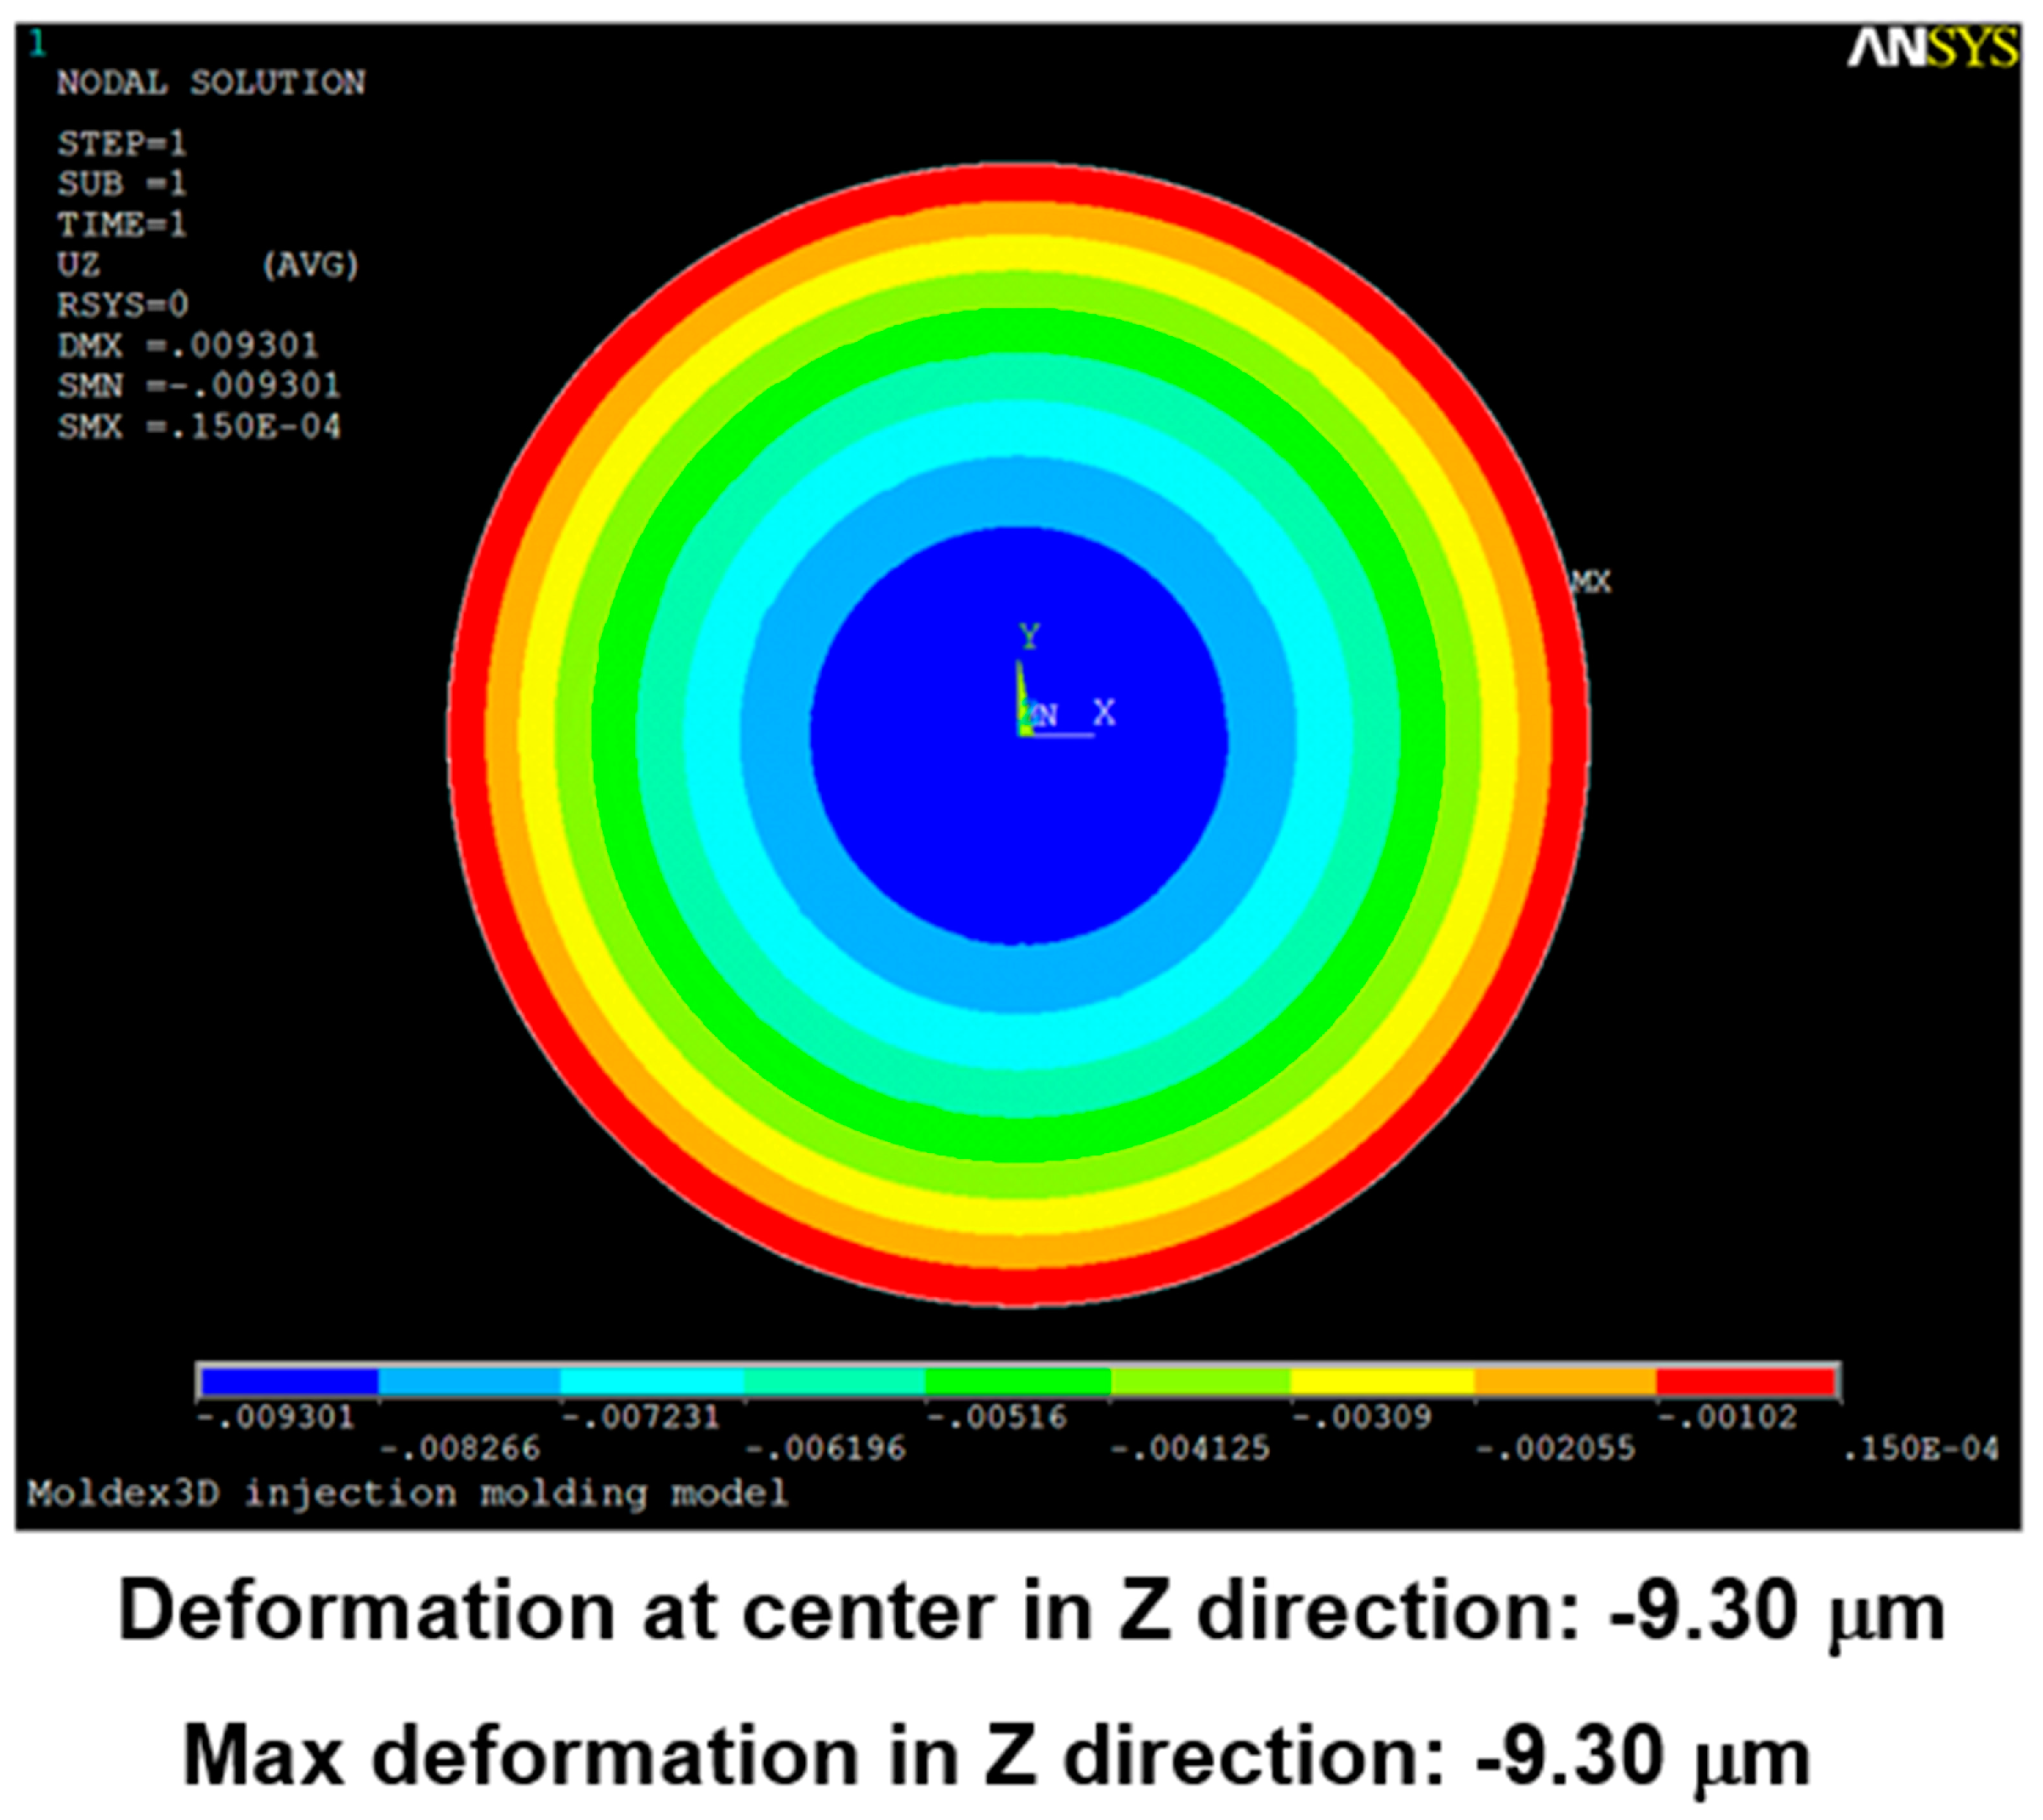
3.1. Simulation and Measurement Results
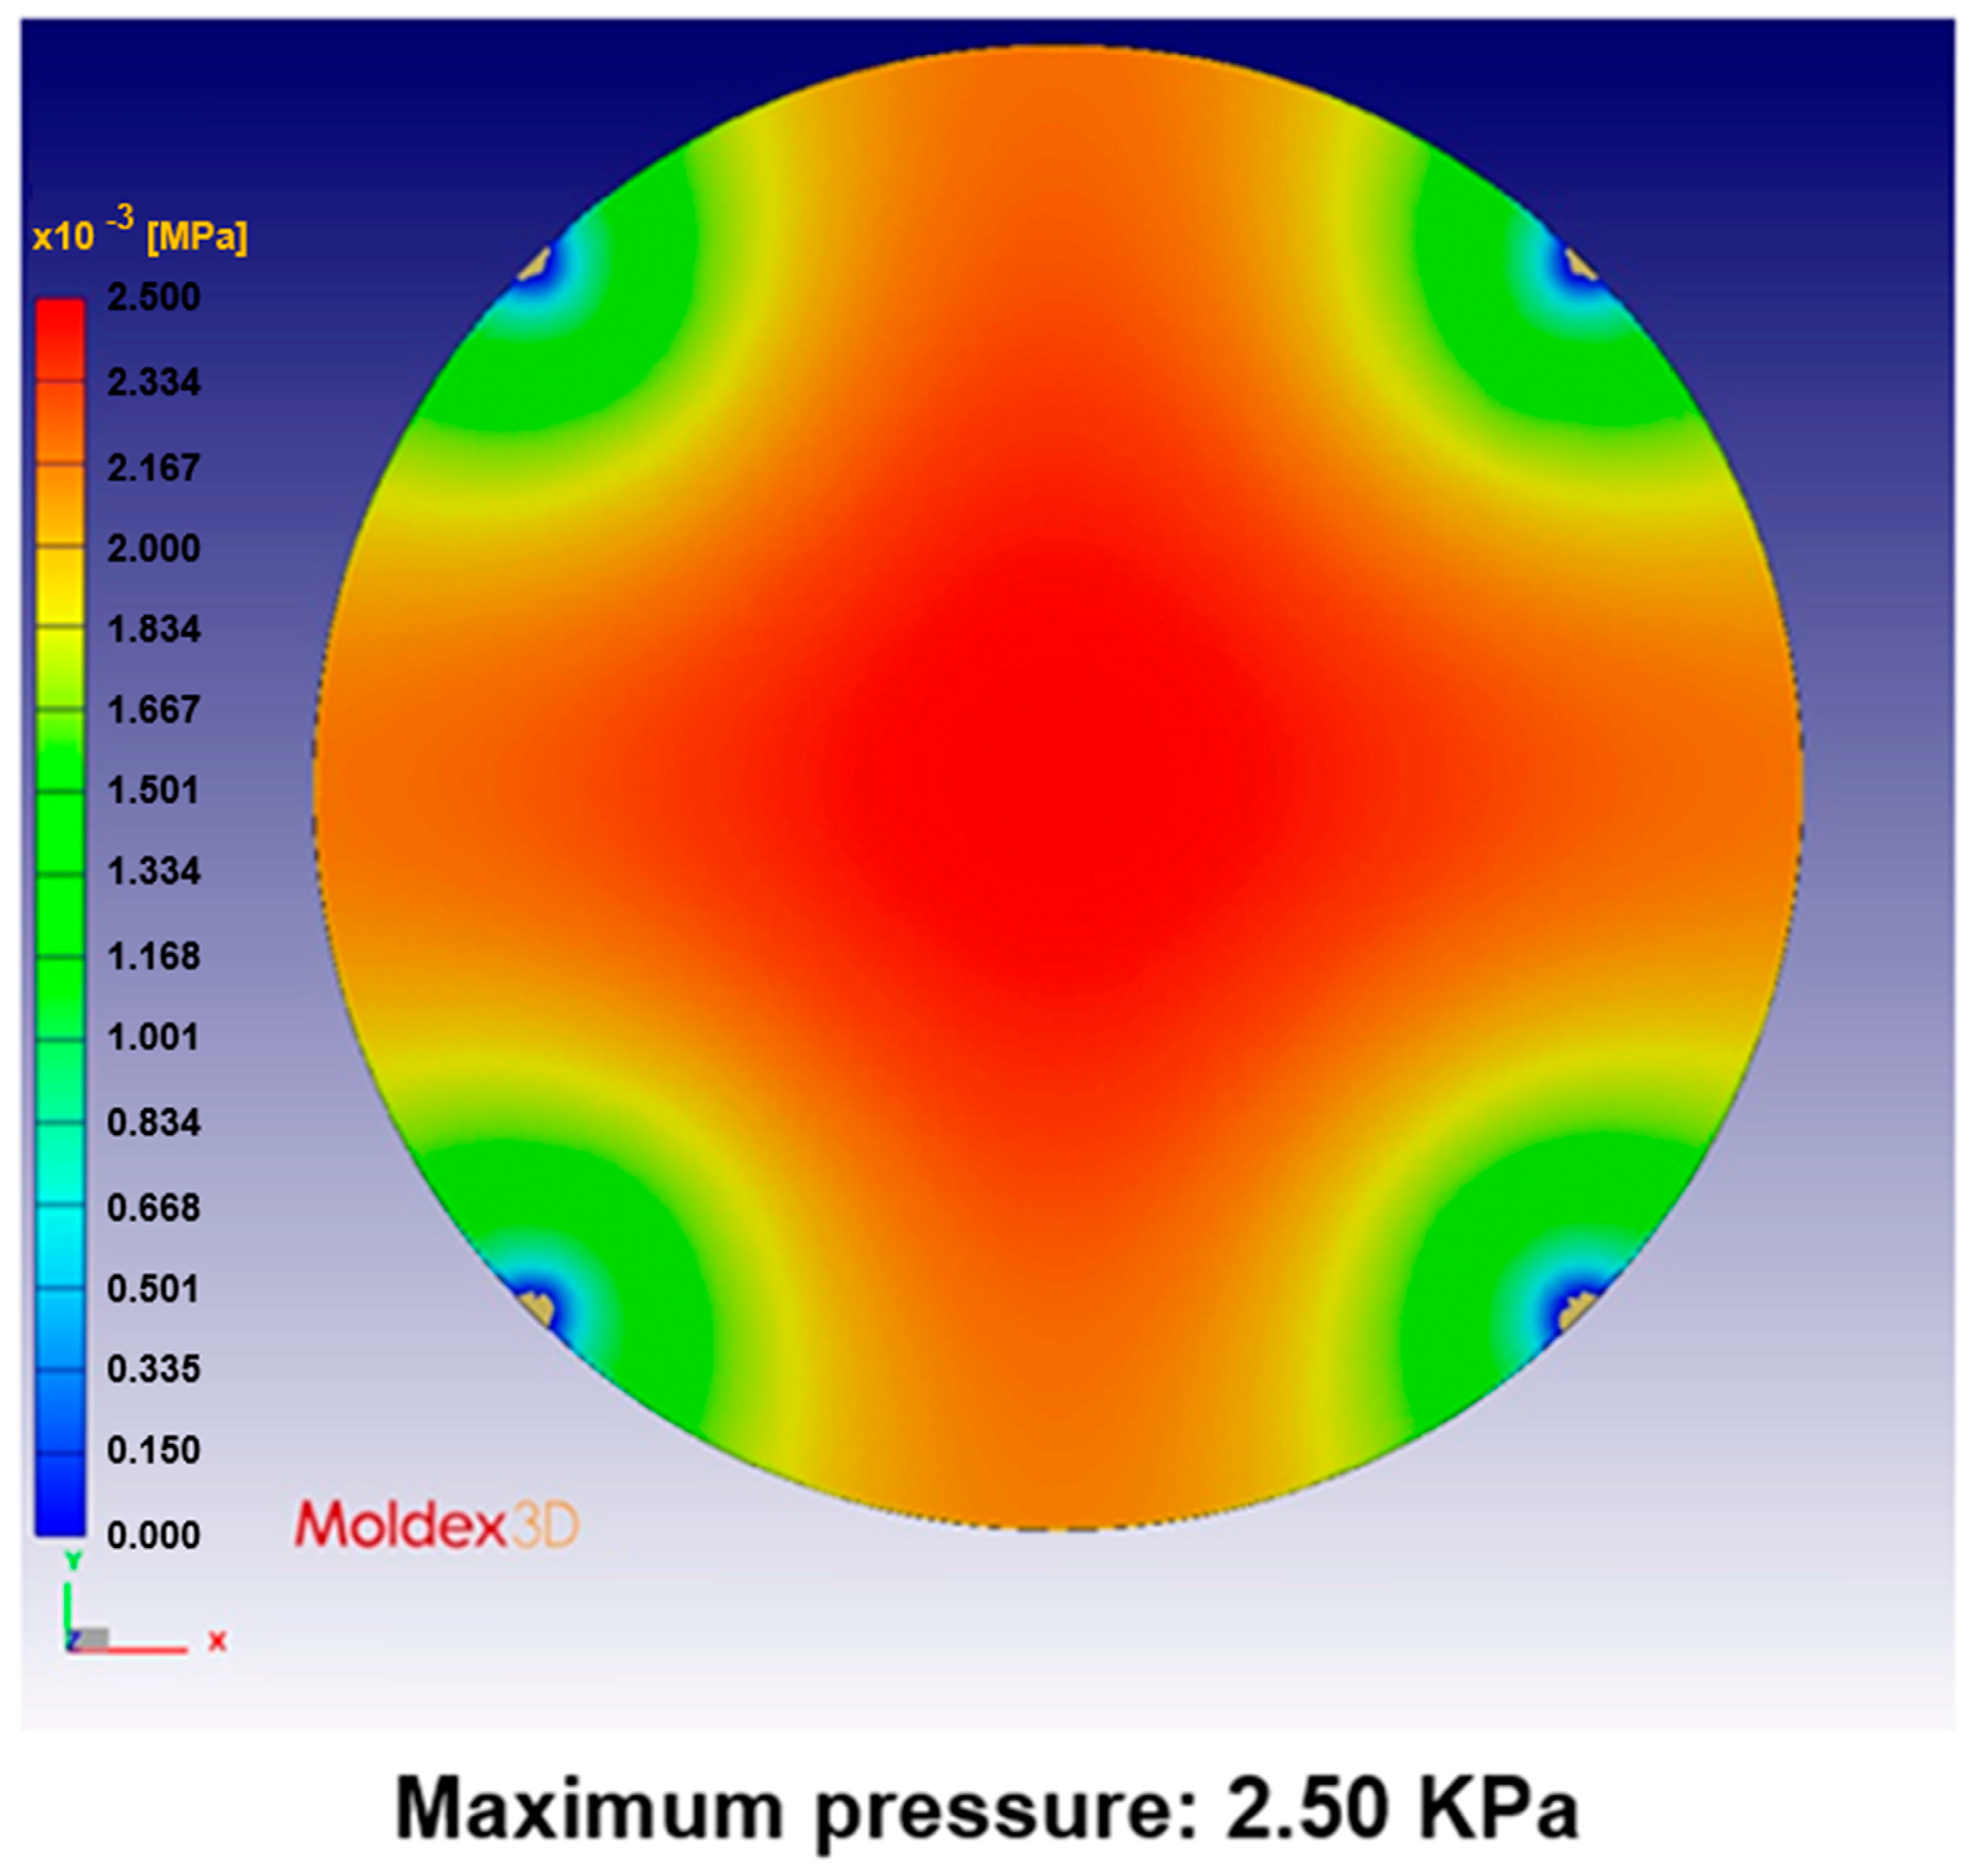
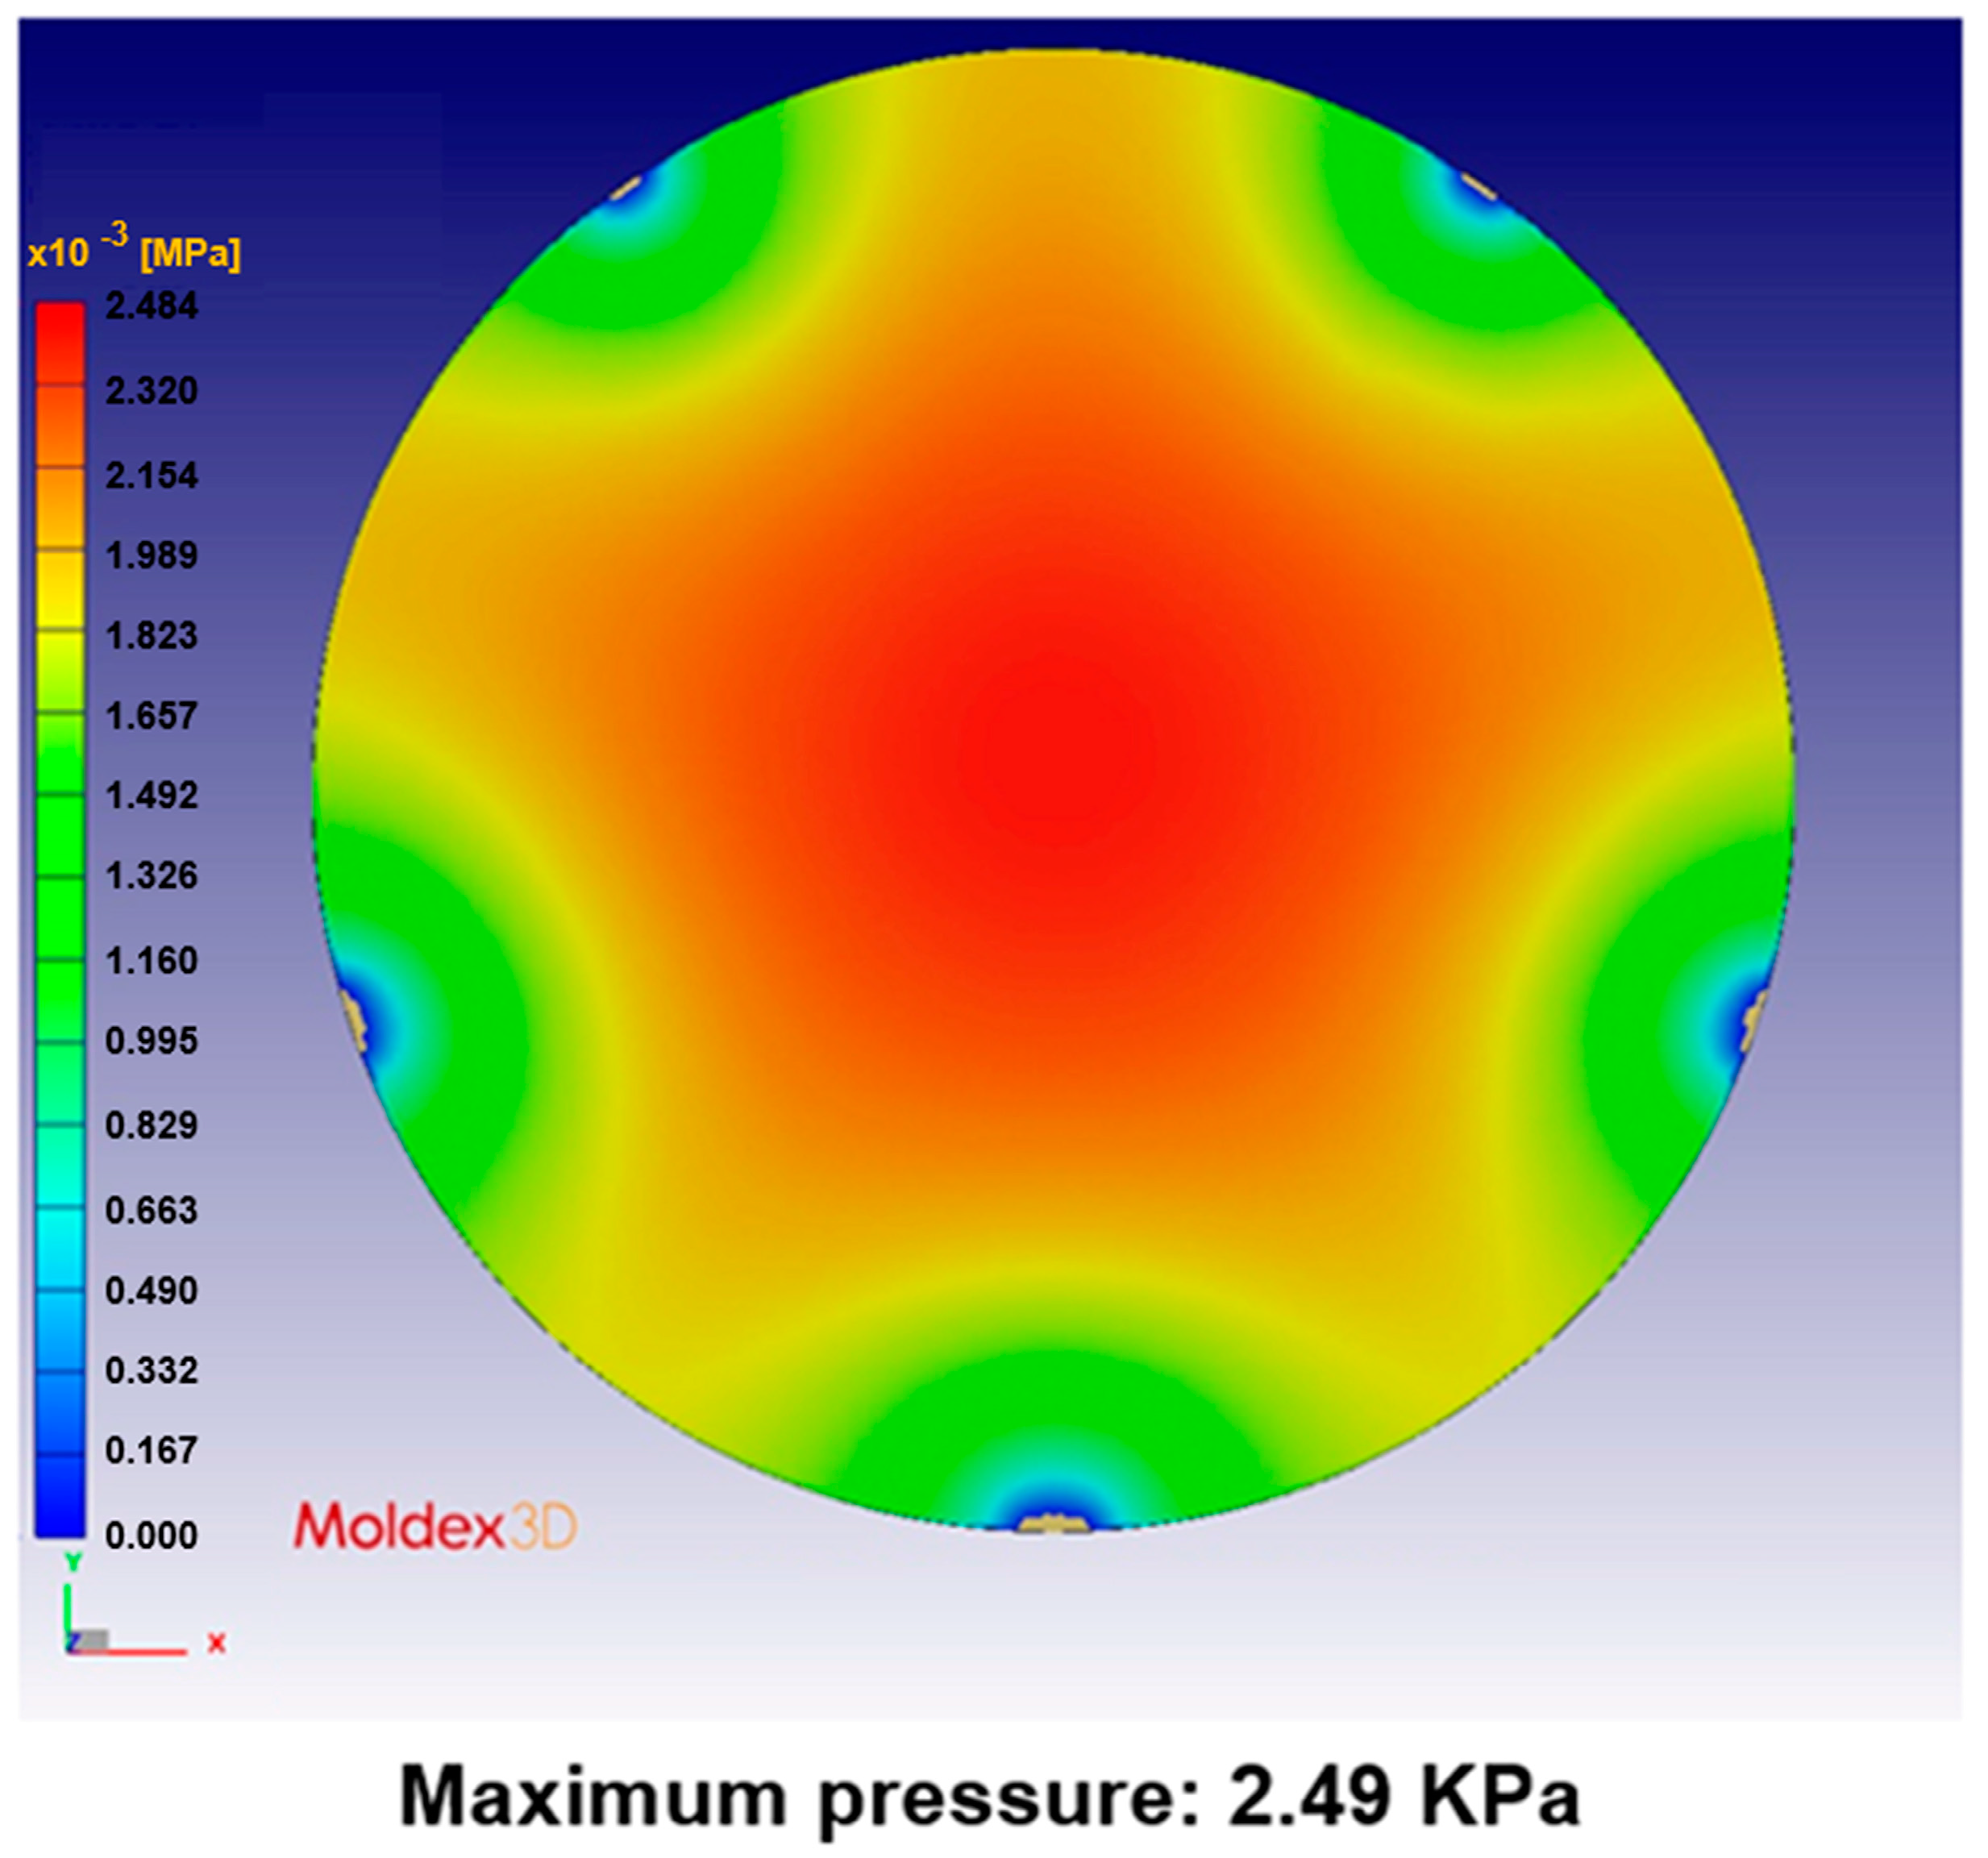
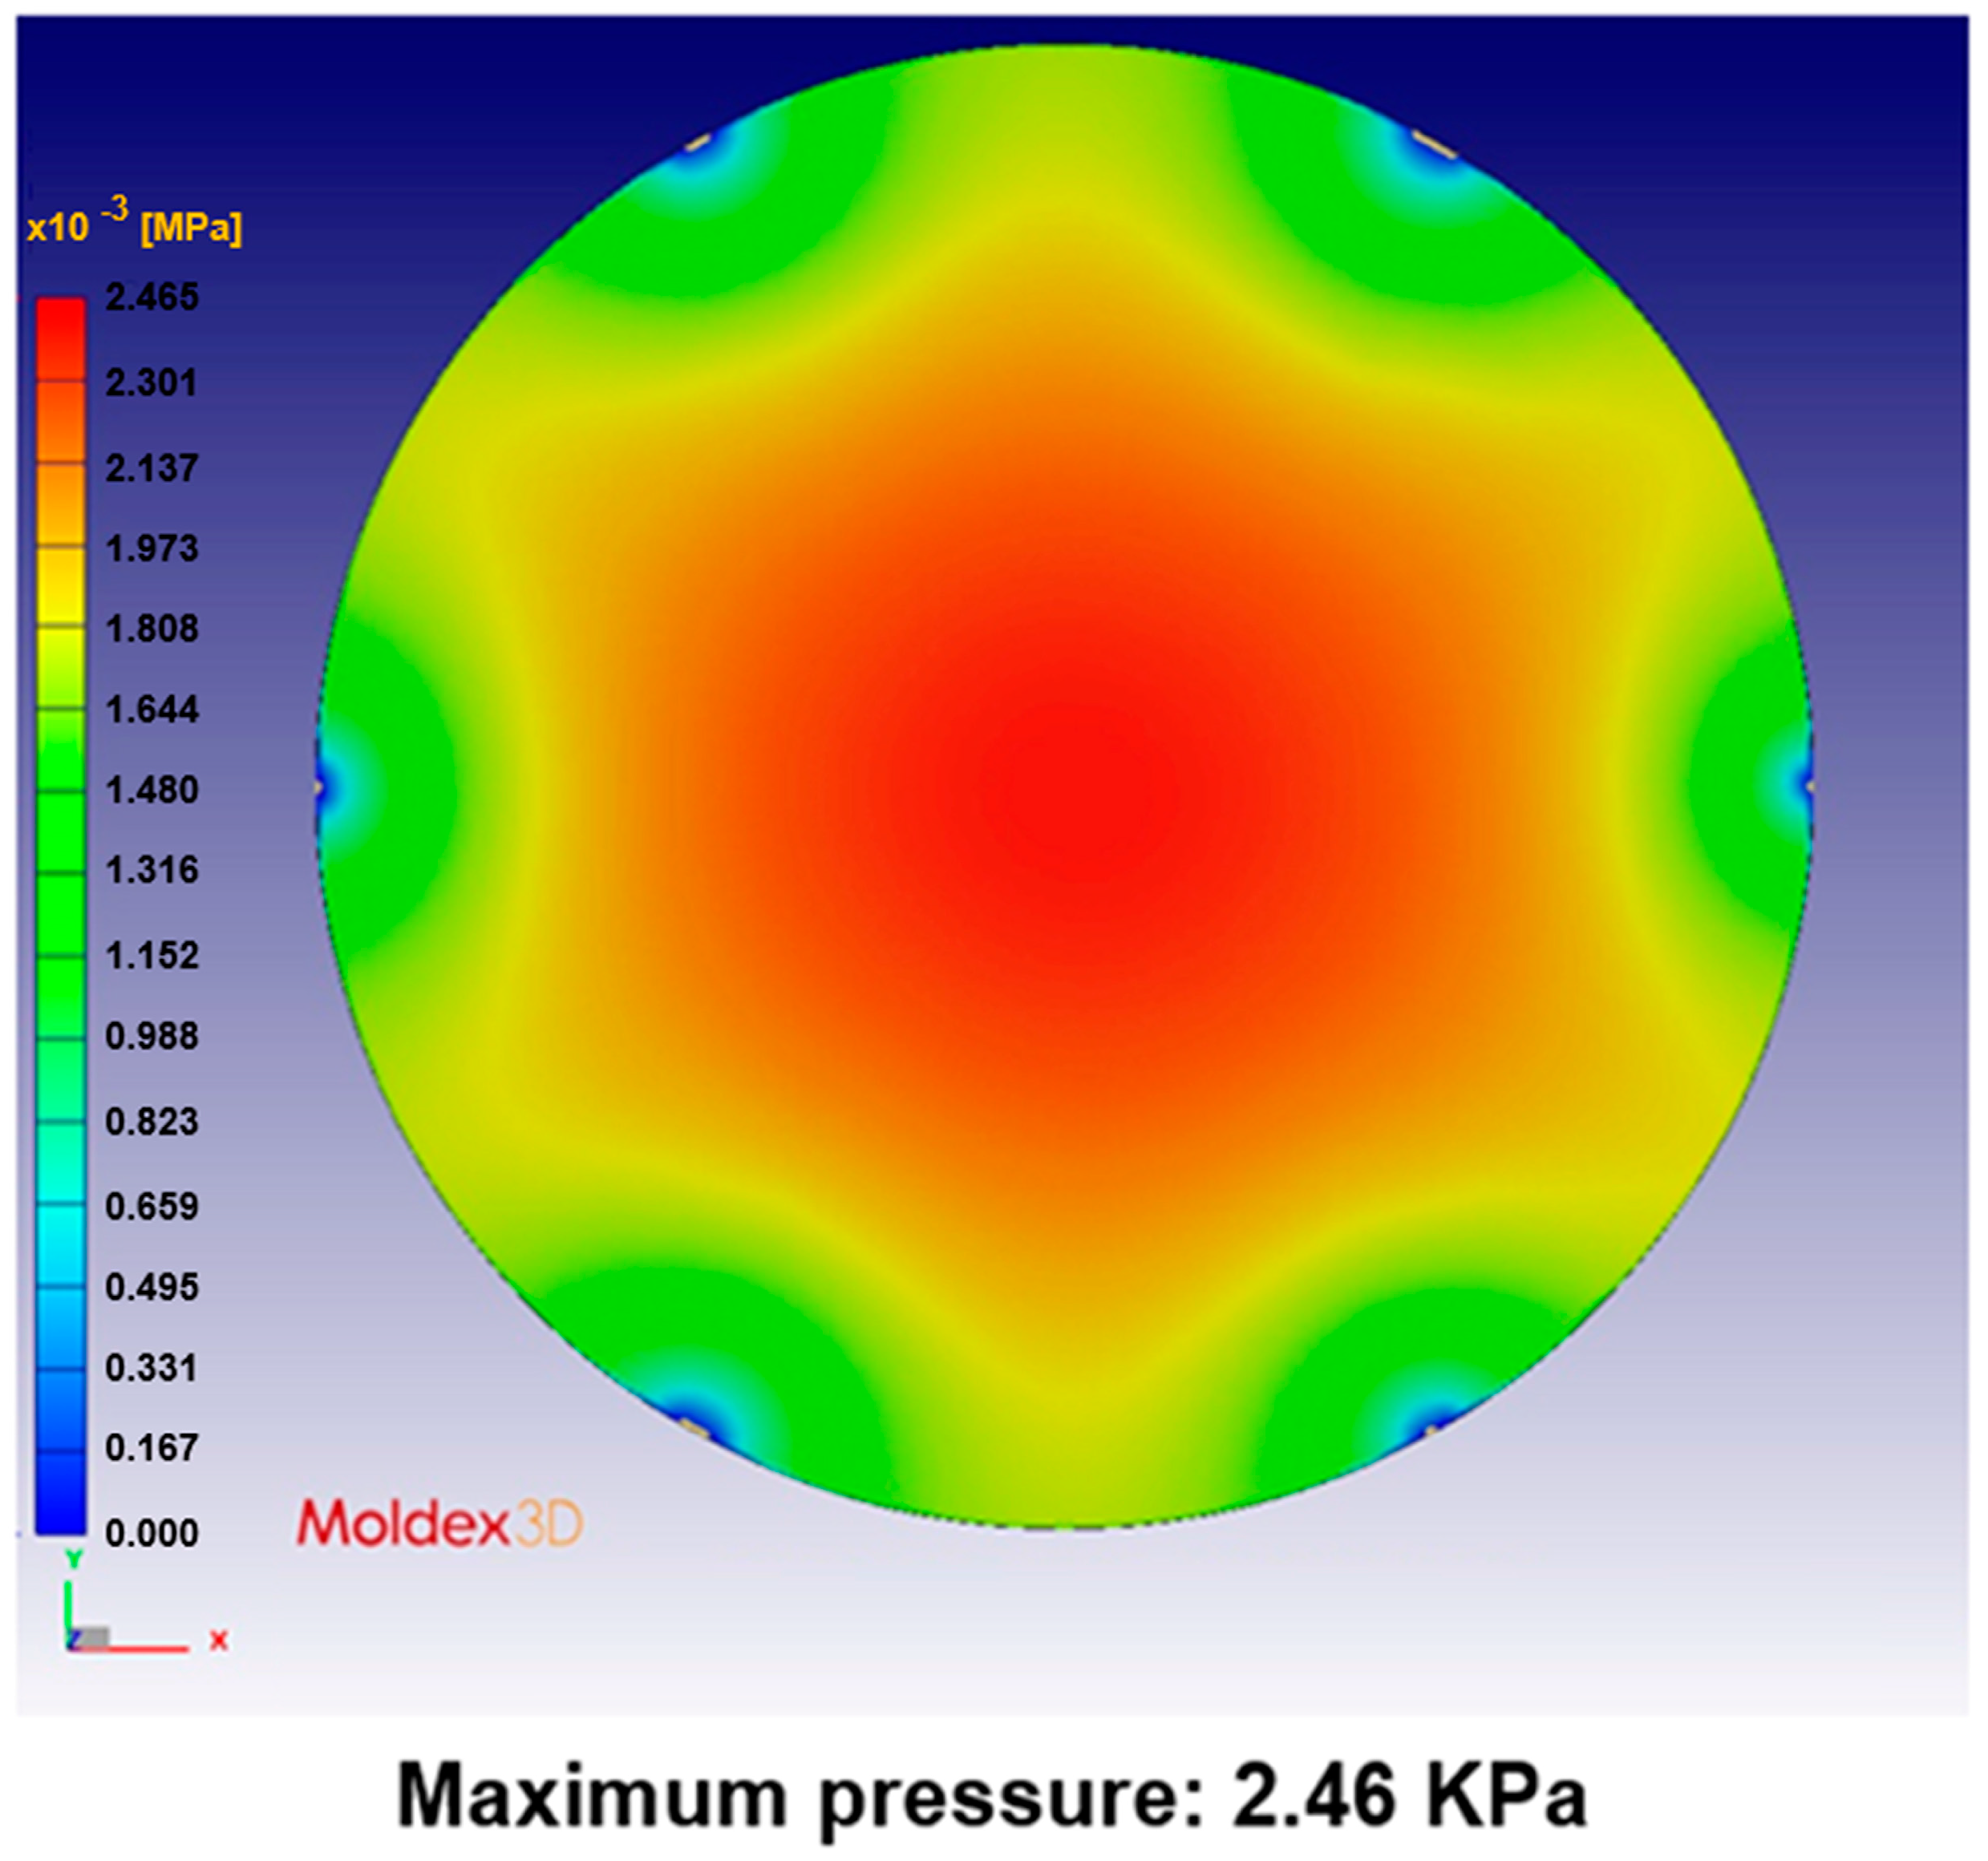
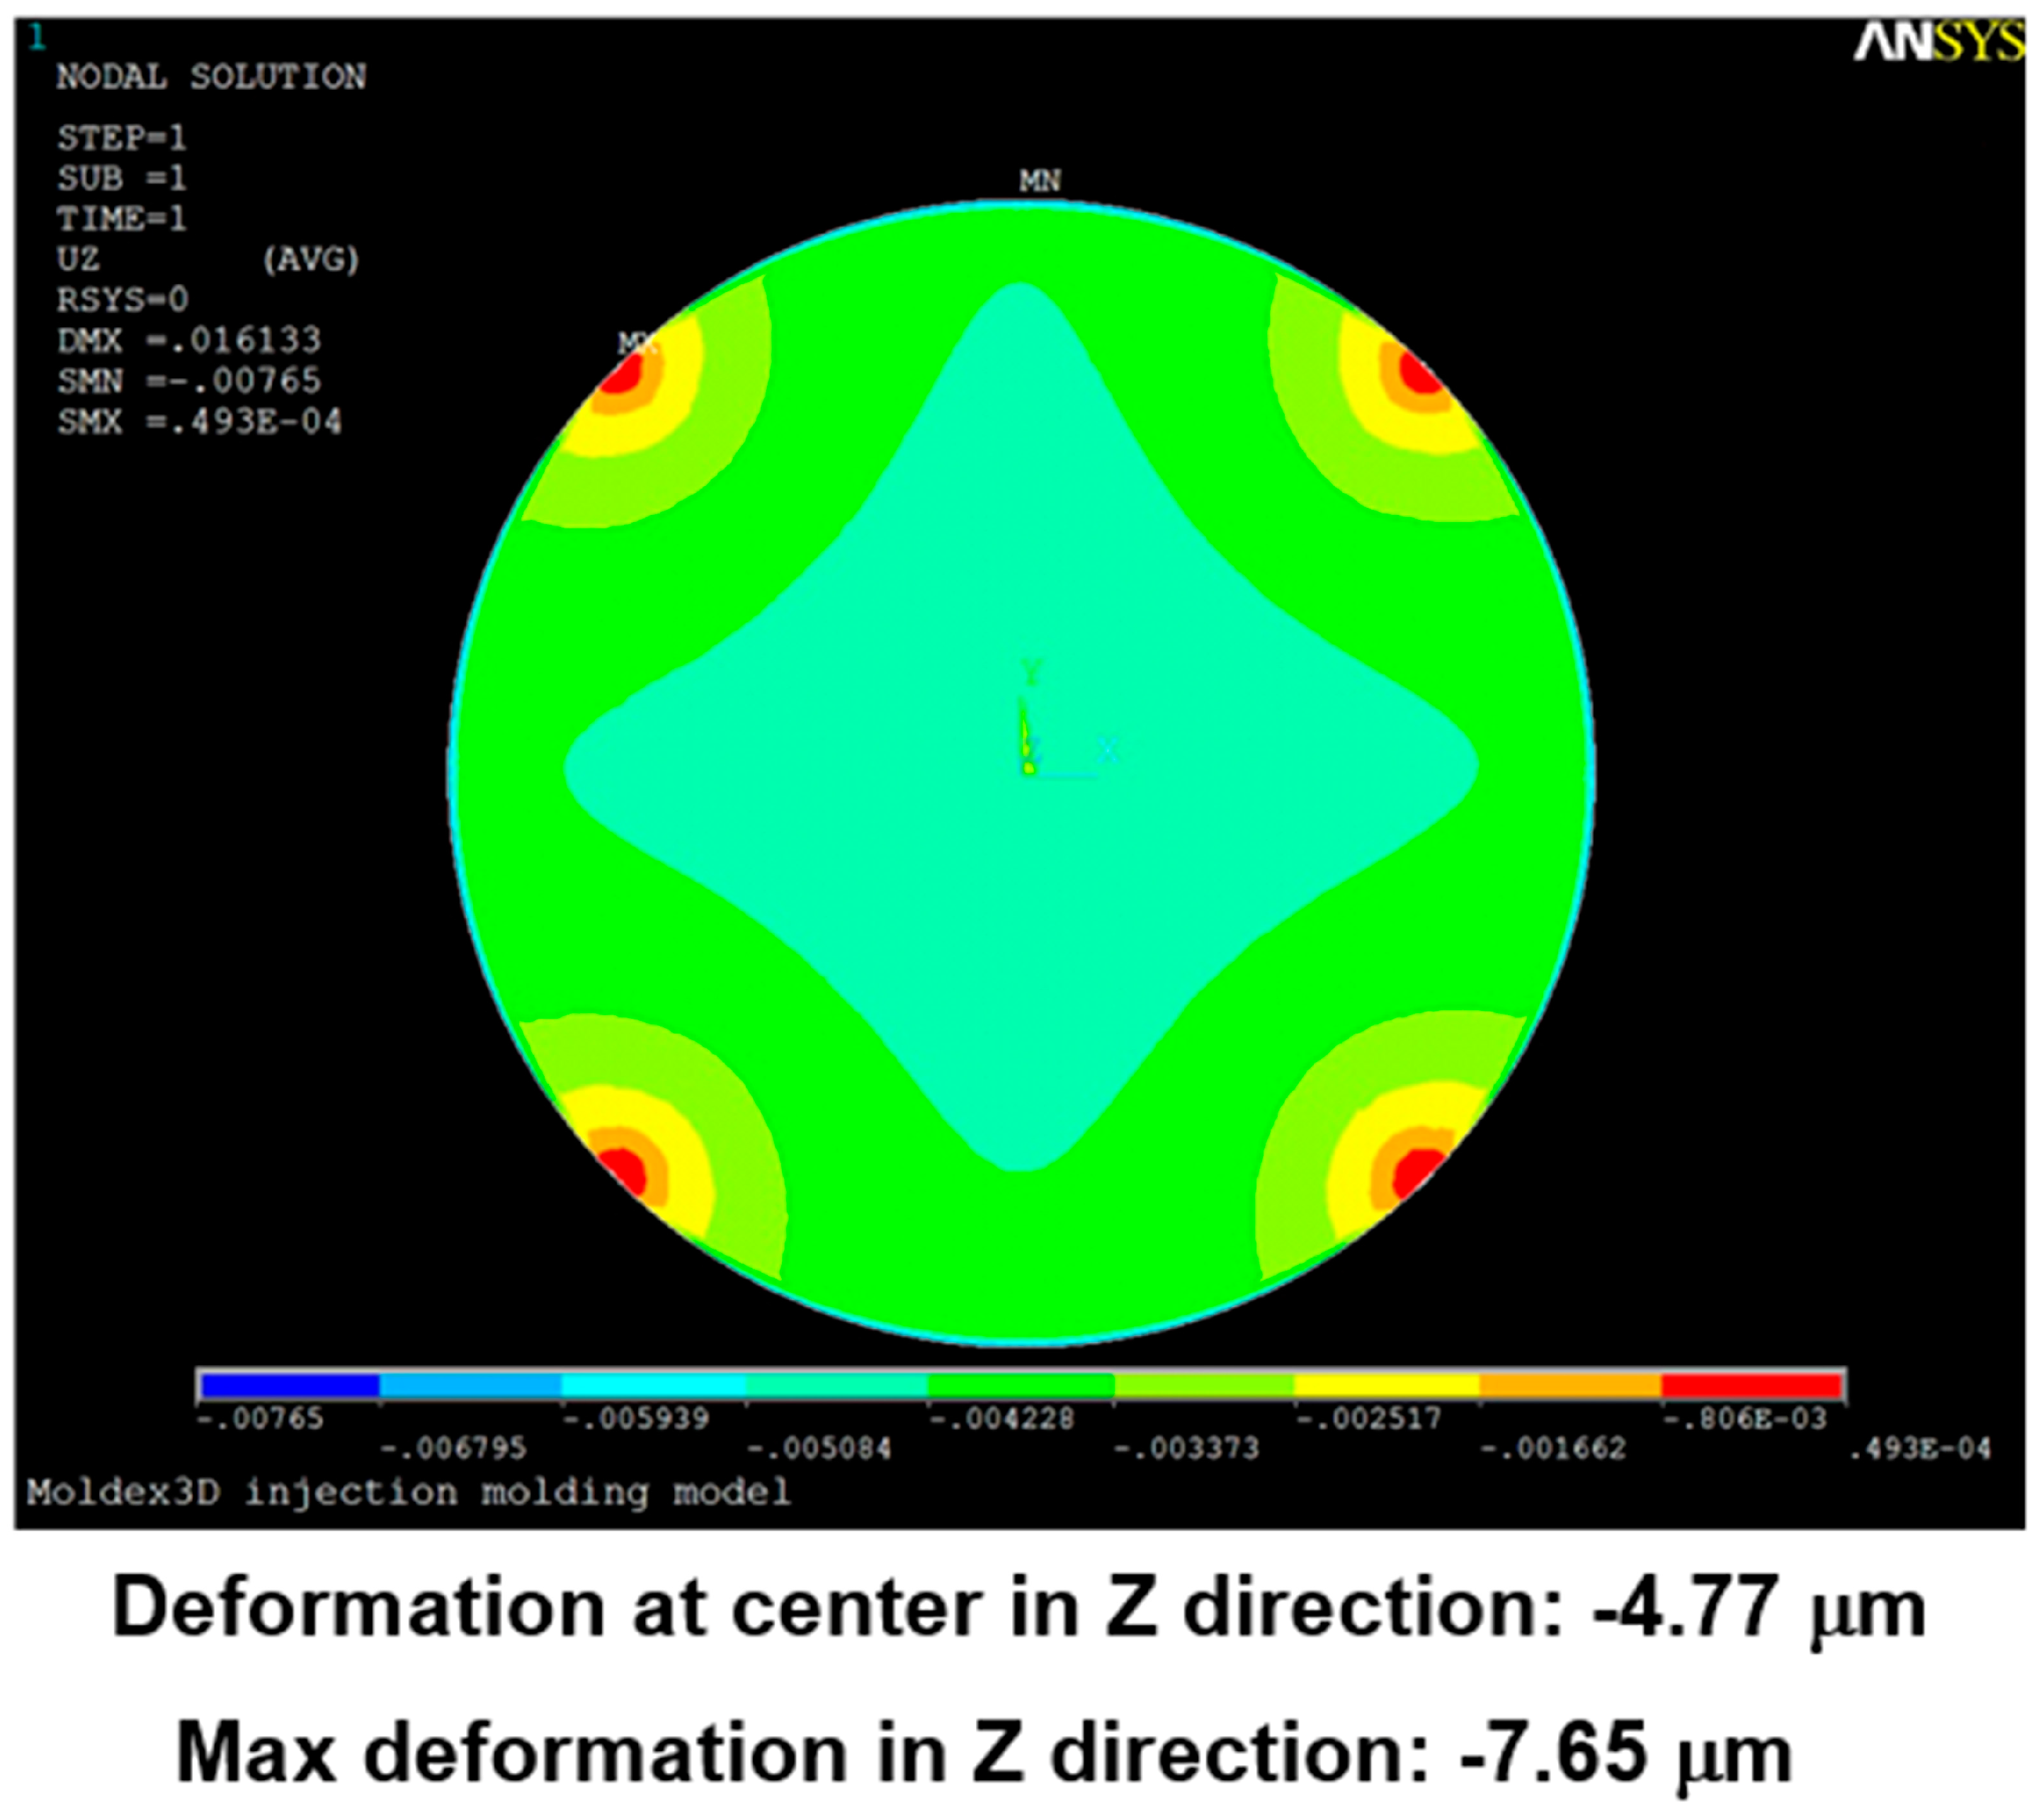
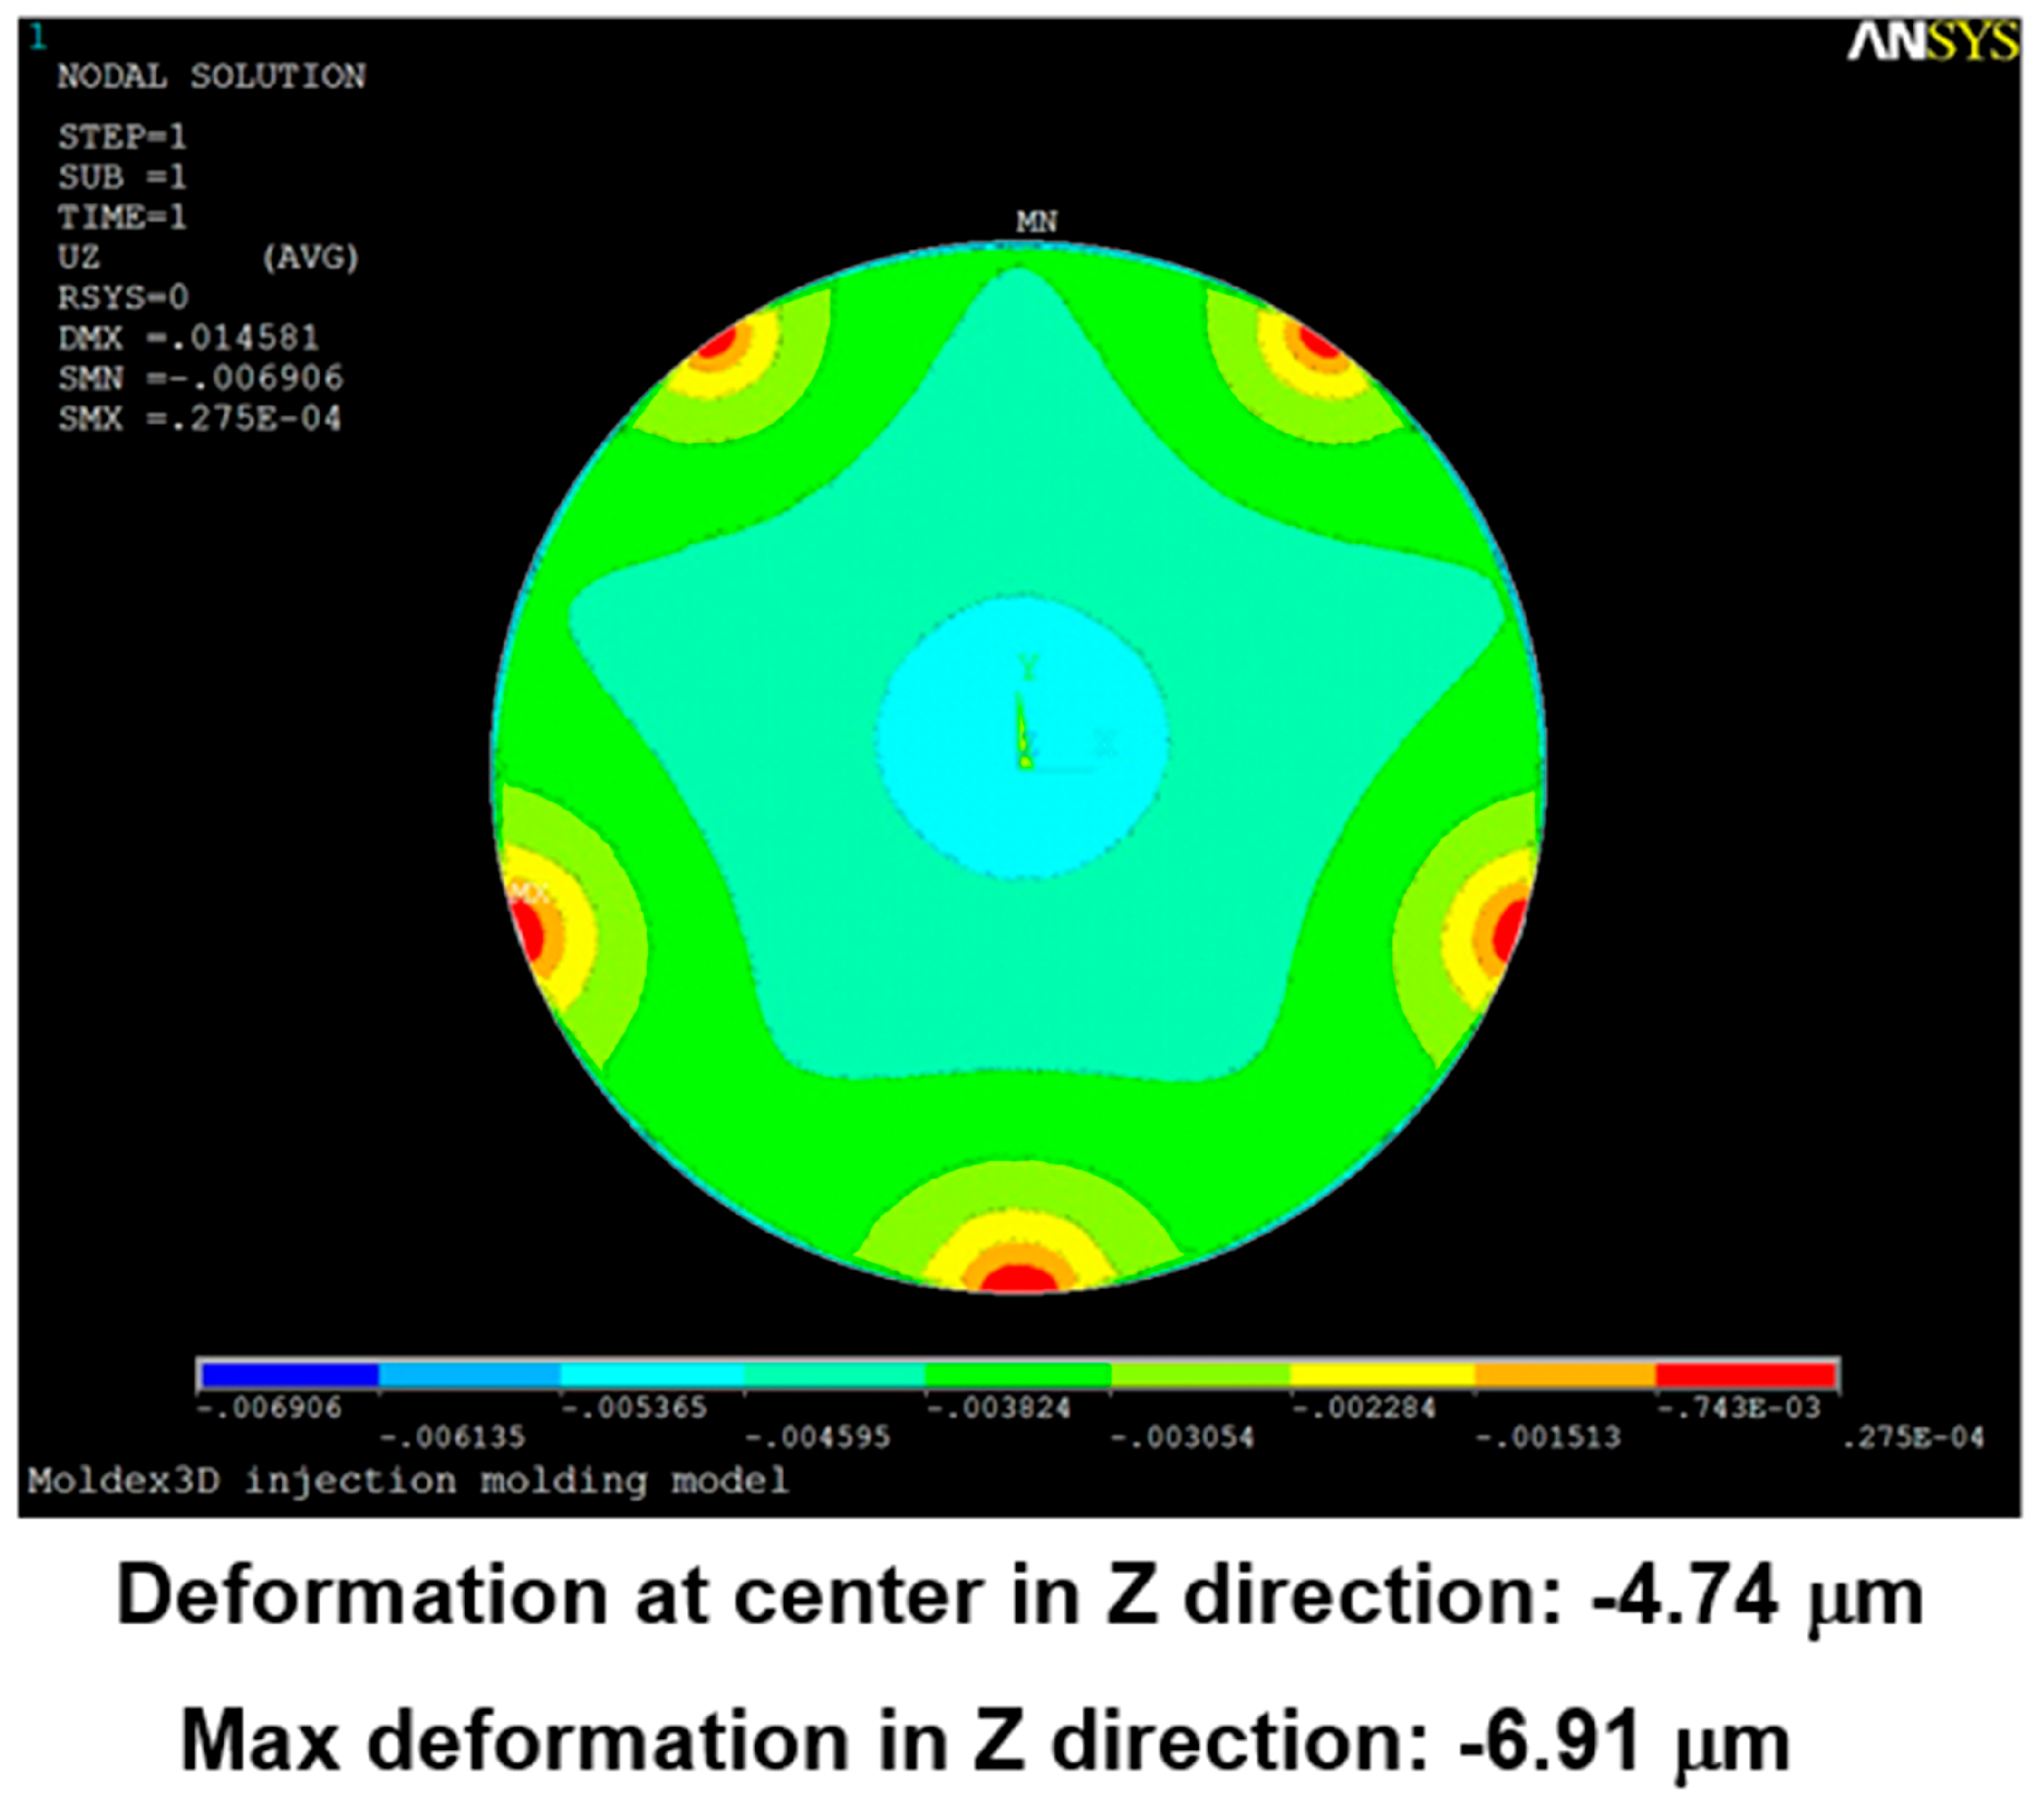
3.2. Varying the Gate Design
4. Discussion
5. Conclusions
Acknowledgments
Author Contributions
Conflicts of Interest
References
- Chou, S.Y.; Krauss, P.R. Imprint lithography with 25-nanometer resolution. Science 1996, 5258, 85–87. [Google Scholar] [CrossRef]
- Qin, D.; Xia, Y.N.; Whitesides, G.M. Soft lithography for micro- and nanoscale patterning. Nat. Protoc. 2010, 5, 491–502. [Google Scholar] [CrossRef] [PubMed]
- Sreenivasan, S.V.; Wilson, C.G. Design of orientation stages for step and flash imprint lithography. Precis. Eng. 2001, 25, 192–199. [Google Scholar]
- Haisma, J.; Verheijen, M.; van den Heuvel, K.; van den Berg, J. Mold-assisted nanolithography: A progress for reliable pattern replication. J. Vac. Sci. Technol. B 1996, 14, 4124–4128. [Google Scholar] [CrossRef]
- Plachetka, U.; Bender, M.; Fuchs, A.; Vratzov, B.; Glinsner, T.; Lindner, F.; Kurz, H. Wafer scale patterning by soft UV-Nanoimprint Lithography. Microelectron. Eng. 2004, 73–74, 167–171. [Google Scholar] [CrossRef]
- Koo, N.; Bender, M.; Plachetka, U.; Fuchs, A.; Wahlbrink, T.; Bolten, J.; Kurz, J. Improved mold fabrication for the definition of high quality nanopatterns by Soft UV-Nanoimprint lithography using diluted PDMS material. Microelectron. Eng. 2007, 84, 904–908. [Google Scholar] [CrossRef]
- Nagato, K.; Hamaguchi, T.; Nakao, M. Injection compression molding of high-aspect-ratio nanostructures. J. Vac. Sci. Technol. B 2011, 29. [Google Scholar] [CrossRef]
- Nagato, K. Injection Compression Molding of Replica Molds for Nanoimprint Lithography. Polymers 2014, 6, 604–612. [Google Scholar] [CrossRef]
- Ohta, T.; Inoue, K.; Ishida, T.; Gotoh, Y.; Satoh, I. Thin injection-molded substrate for high density recording phase-change rewritable disk. Jpn. J. Appl. Phys. 1993, 32, 5214–5218. [Google Scholar] [CrossRef]
- Imai, T.; Shida, N.; Higuchi, T.; Suga, K.; Iida, T.; Yokogawa, F. 25 Gbyte read-only memory disk by injection-compression molding process. Jpn. J. Appl. Phys. 2001, 40, 1661–1665. [Google Scholar] [CrossRef]
- Chen, S.C.; Chen, Y.C.; Cheng, N.T.; Huang, M.S. Simulation of injection-compression mold-filling process. Int. Commun. Heat Mass. 1998, 25, 907–917. [Google Scholar] [CrossRef]
- Chen, S.C.; Chen, Y.C.; Peng, H.S.; Huang, L.T. Simulation of injection-compression molding process, part 3: Effect of process. Adv. Polym. Technol. 2002, 21, 177–187. [Google Scholar] [CrossRef]
- Chang, C.Y. Simulation of mold filling in simultaneous resin injection/compression molding. J. Reinf. Plast. Compost. 2006, 25, 1255–1268. [Google Scholar] [CrossRef]
- Li, Y.; Zhang, Y.; Li, D. Shrinkage Analysis of Injection-Compression Molding for Transparent Plastic Panel by 3D Simulation. Appl. Mech. Mater. 2010, 44, 1029–1033. [Google Scholar] [CrossRef]
- Dwiyantoro, B.A. A Numerical Study of an Injection-compression Molding Process by using a Moving Grid. Appl. Mech. Mater. 2013, 249, 472–476. [Google Scholar] [CrossRef]
- Ho, J.Y.; Park, J.M.; Kang, T.G.; Park, S.J. Three-Dimensional Numerical Analysis of Injection-Compression Molding Process. Polym. Eng. Sci. 2012, 52, 901–911. [Google Scholar] [CrossRef]
- Cao, W.; Hua, S.Z.; Zhang, S.X.; Wang, T.; Wang, Y.M.; Li, H.M.; Liu, C.T.; Shen, C.Y. Three-Dimensional Viscoelastic Simulation for Injection/Compression Molding Based on Arbitrary Lagrangian Eulerian Description. J. Comput. Nonlin. Dyn. 2016, 11, 8. [Google Scholar] [CrossRef]


| Parameters of the Compression-Molding Process | |
|---|---|
| Compression gap | 0.95 mm |
| Compression time | 500 s |
| Maximum compression speed | 1 mm/s |
| Maximum compression force | 0.01 tf |
| Ultraviolet (UV)-Curable Resin | |
|---|---|
| Density | 0.95 mm |
| Viscosity | 600 MPa·s |
| Soft Polymer Dies | |
|---|---|
| Young’s modulus | 41.446 KPa |
| Poisson’s ratio | 0.45 |
| Td (μm) |
|---|
| 10.1 |
| 10.6 |
| 9.8 |
| 9.5 |
| 10.5 |
| Avg. 10.1 |
| Simulation Result | Gate Type | |||
|---|---|---|---|---|
| One Point | Four Points | Five Points | Six Points | |
| Maximum pressure | 4.87 KPa | 2.50 KPa | 2.49 KPa | 2.46 KPa |
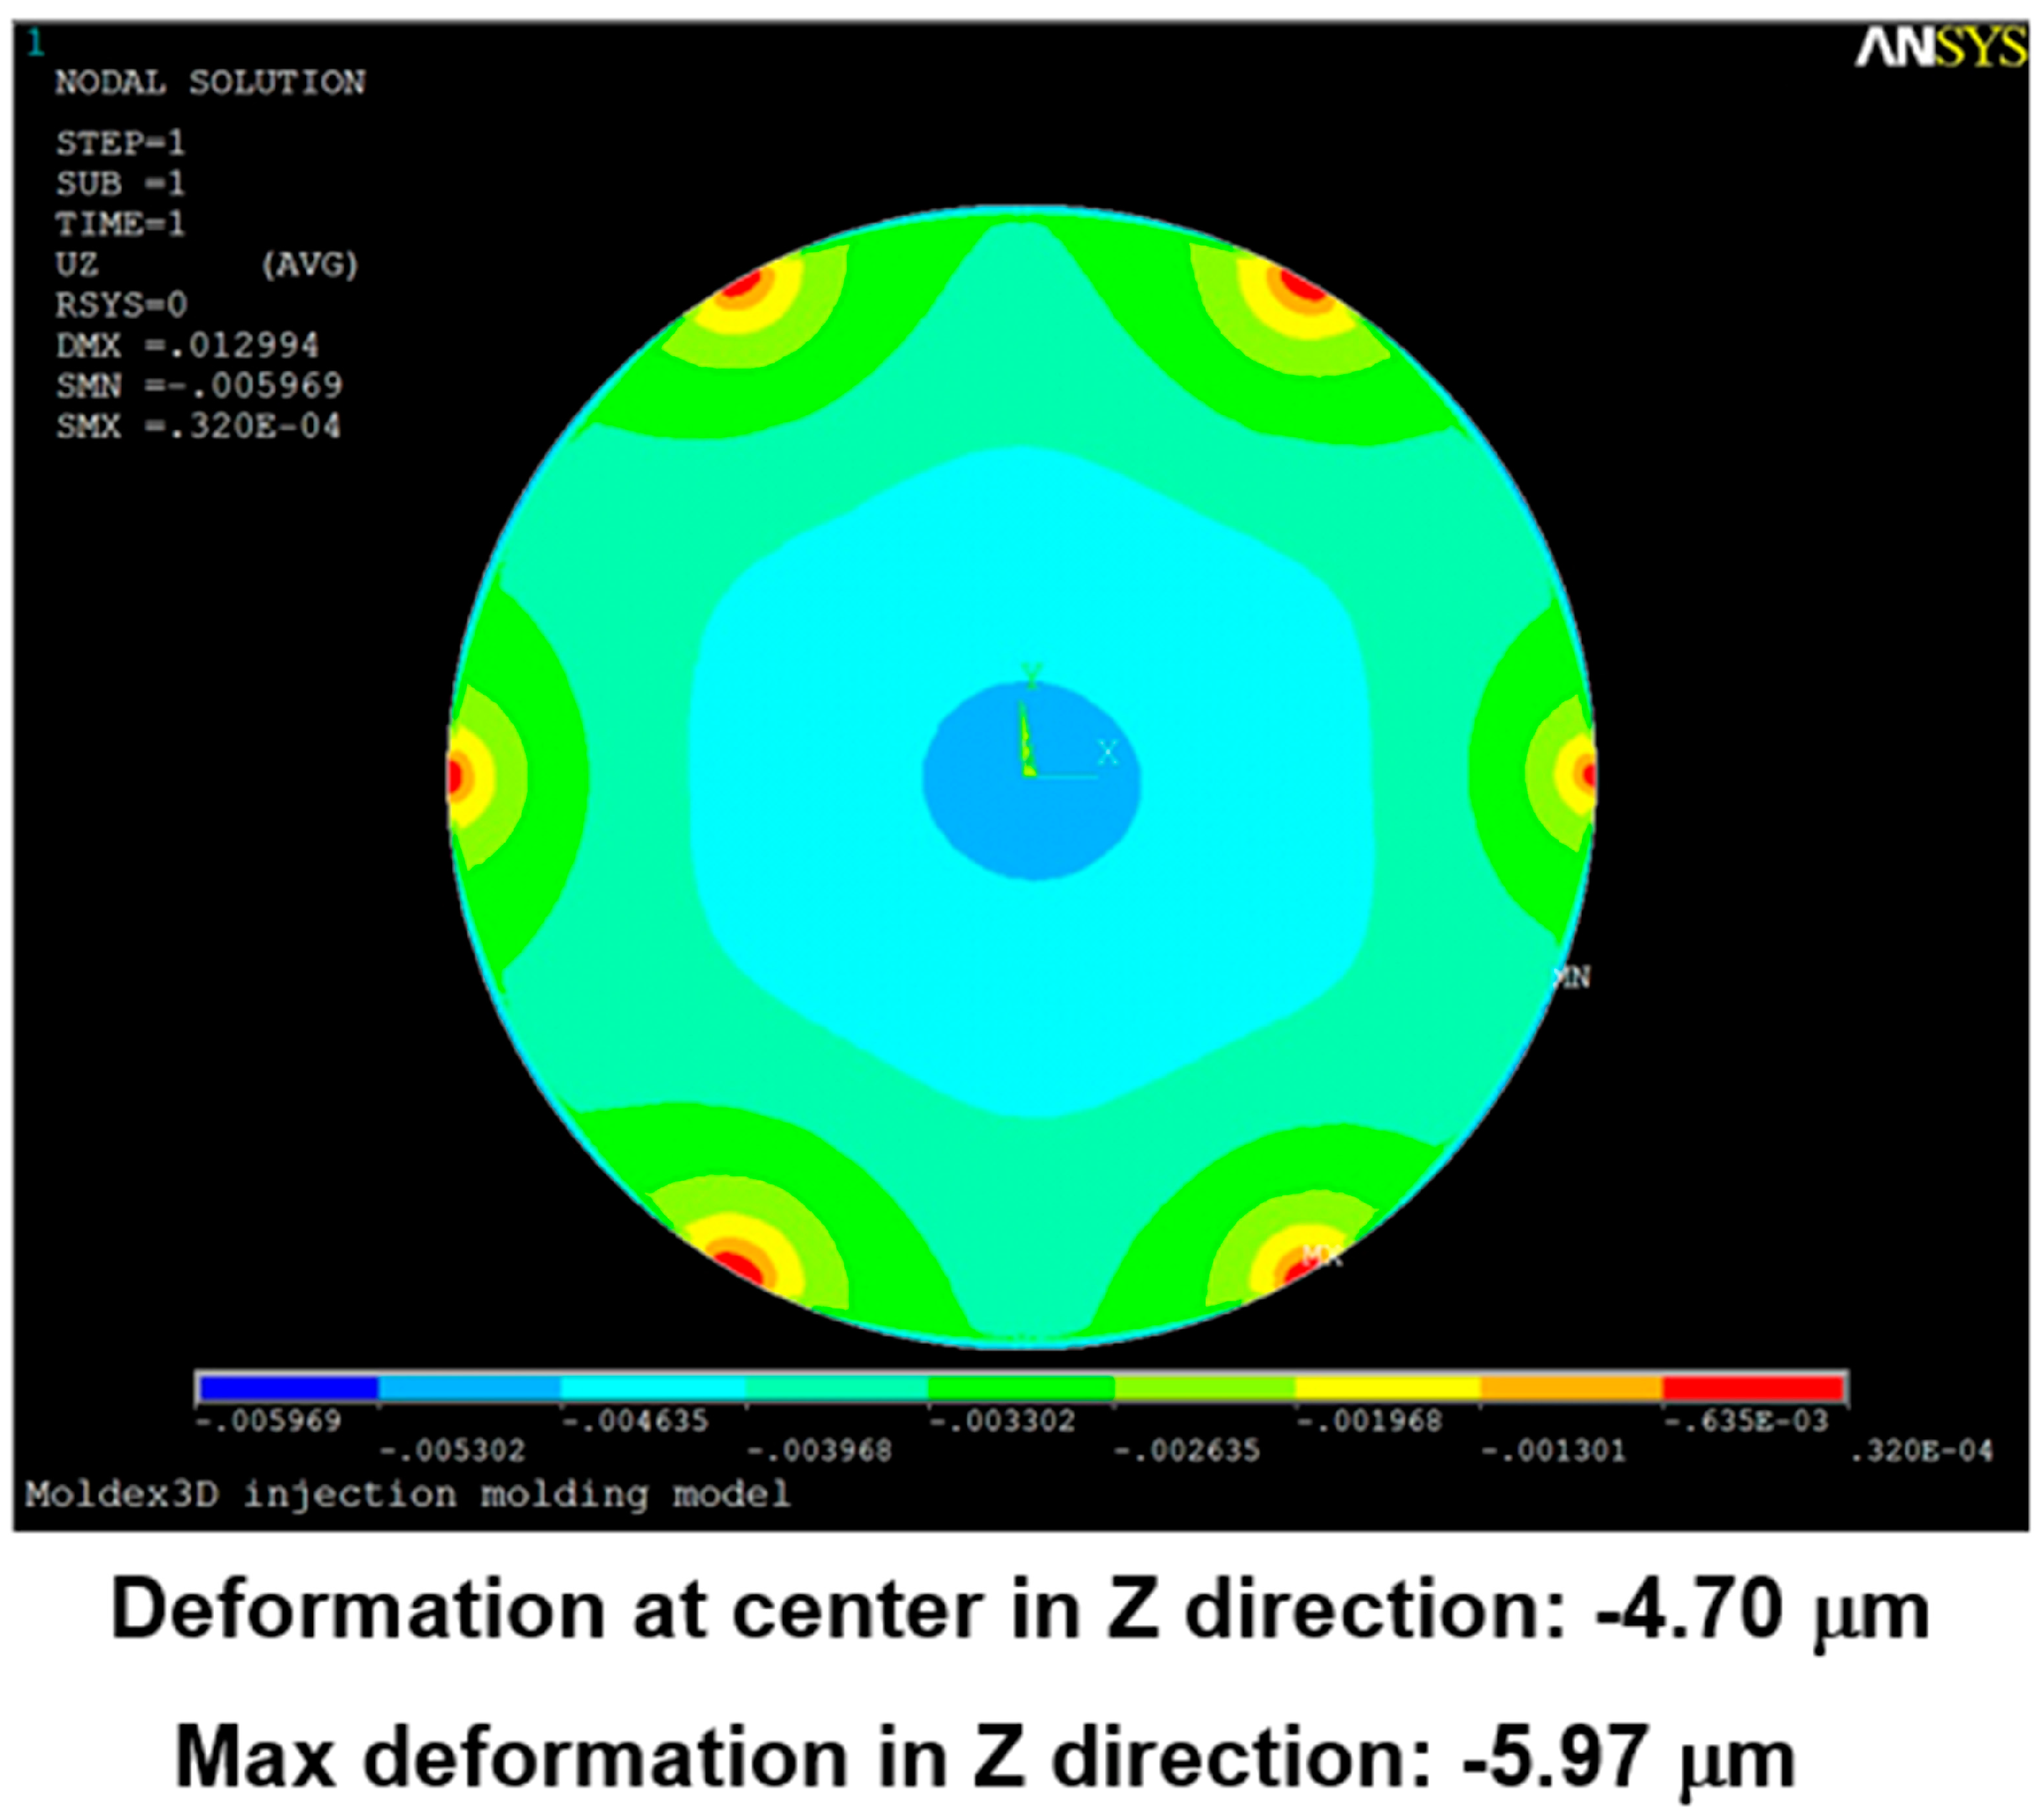
| Maximum deformation in the z-direction | −9.30 μm | −7.65 μm | −6.91 μm | −5.97 μm |
| Deformation at the center in the z-direction | −9.30 μm | −4.77 μm | −4.74 μm | −4.70 μm |
© 2017 by the authors. Licensee MDPI, Basel, Switzerland. This article is an open access article distributed under the terms and conditions of the Creative Commons Attribution (CC BY) license (http://creativecommons.org/licenses/by/4.0/).
Share and Cite
Wu, K.-T.; Hwang, S.-J.; Lee, H.-H. Study of a Compression-Molding Process for Ultraviolet Light-Emitting Diode Exposure Systems via Finite-Element Analysis. Sensors 2017, 17, 1392. https://doi.org/10.3390/s17061392
Wu K-T, Hwang S-J, Lee H-H. Study of a Compression-Molding Process for Ultraviolet Light-Emitting Diode Exposure Systems via Finite-Element Analysis. Sensors. 2017; 17(6):1392. https://doi.org/10.3390/s17061392
Chicago/Turabian StyleWu, Kuo-Tsai, Sheng-Jye Hwang, and Huei-Huang Lee. 2017. "Study of a Compression-Molding Process for Ultraviolet Light-Emitting Diode Exposure Systems via Finite-Element Analysis" Sensors 17, no. 6: 1392. https://doi.org/10.3390/s17061392