
Dynamics of Hierarchical Urban Green Space Patches and Implications for Management Policy


Abstract
:1. Introduction
2. Methods
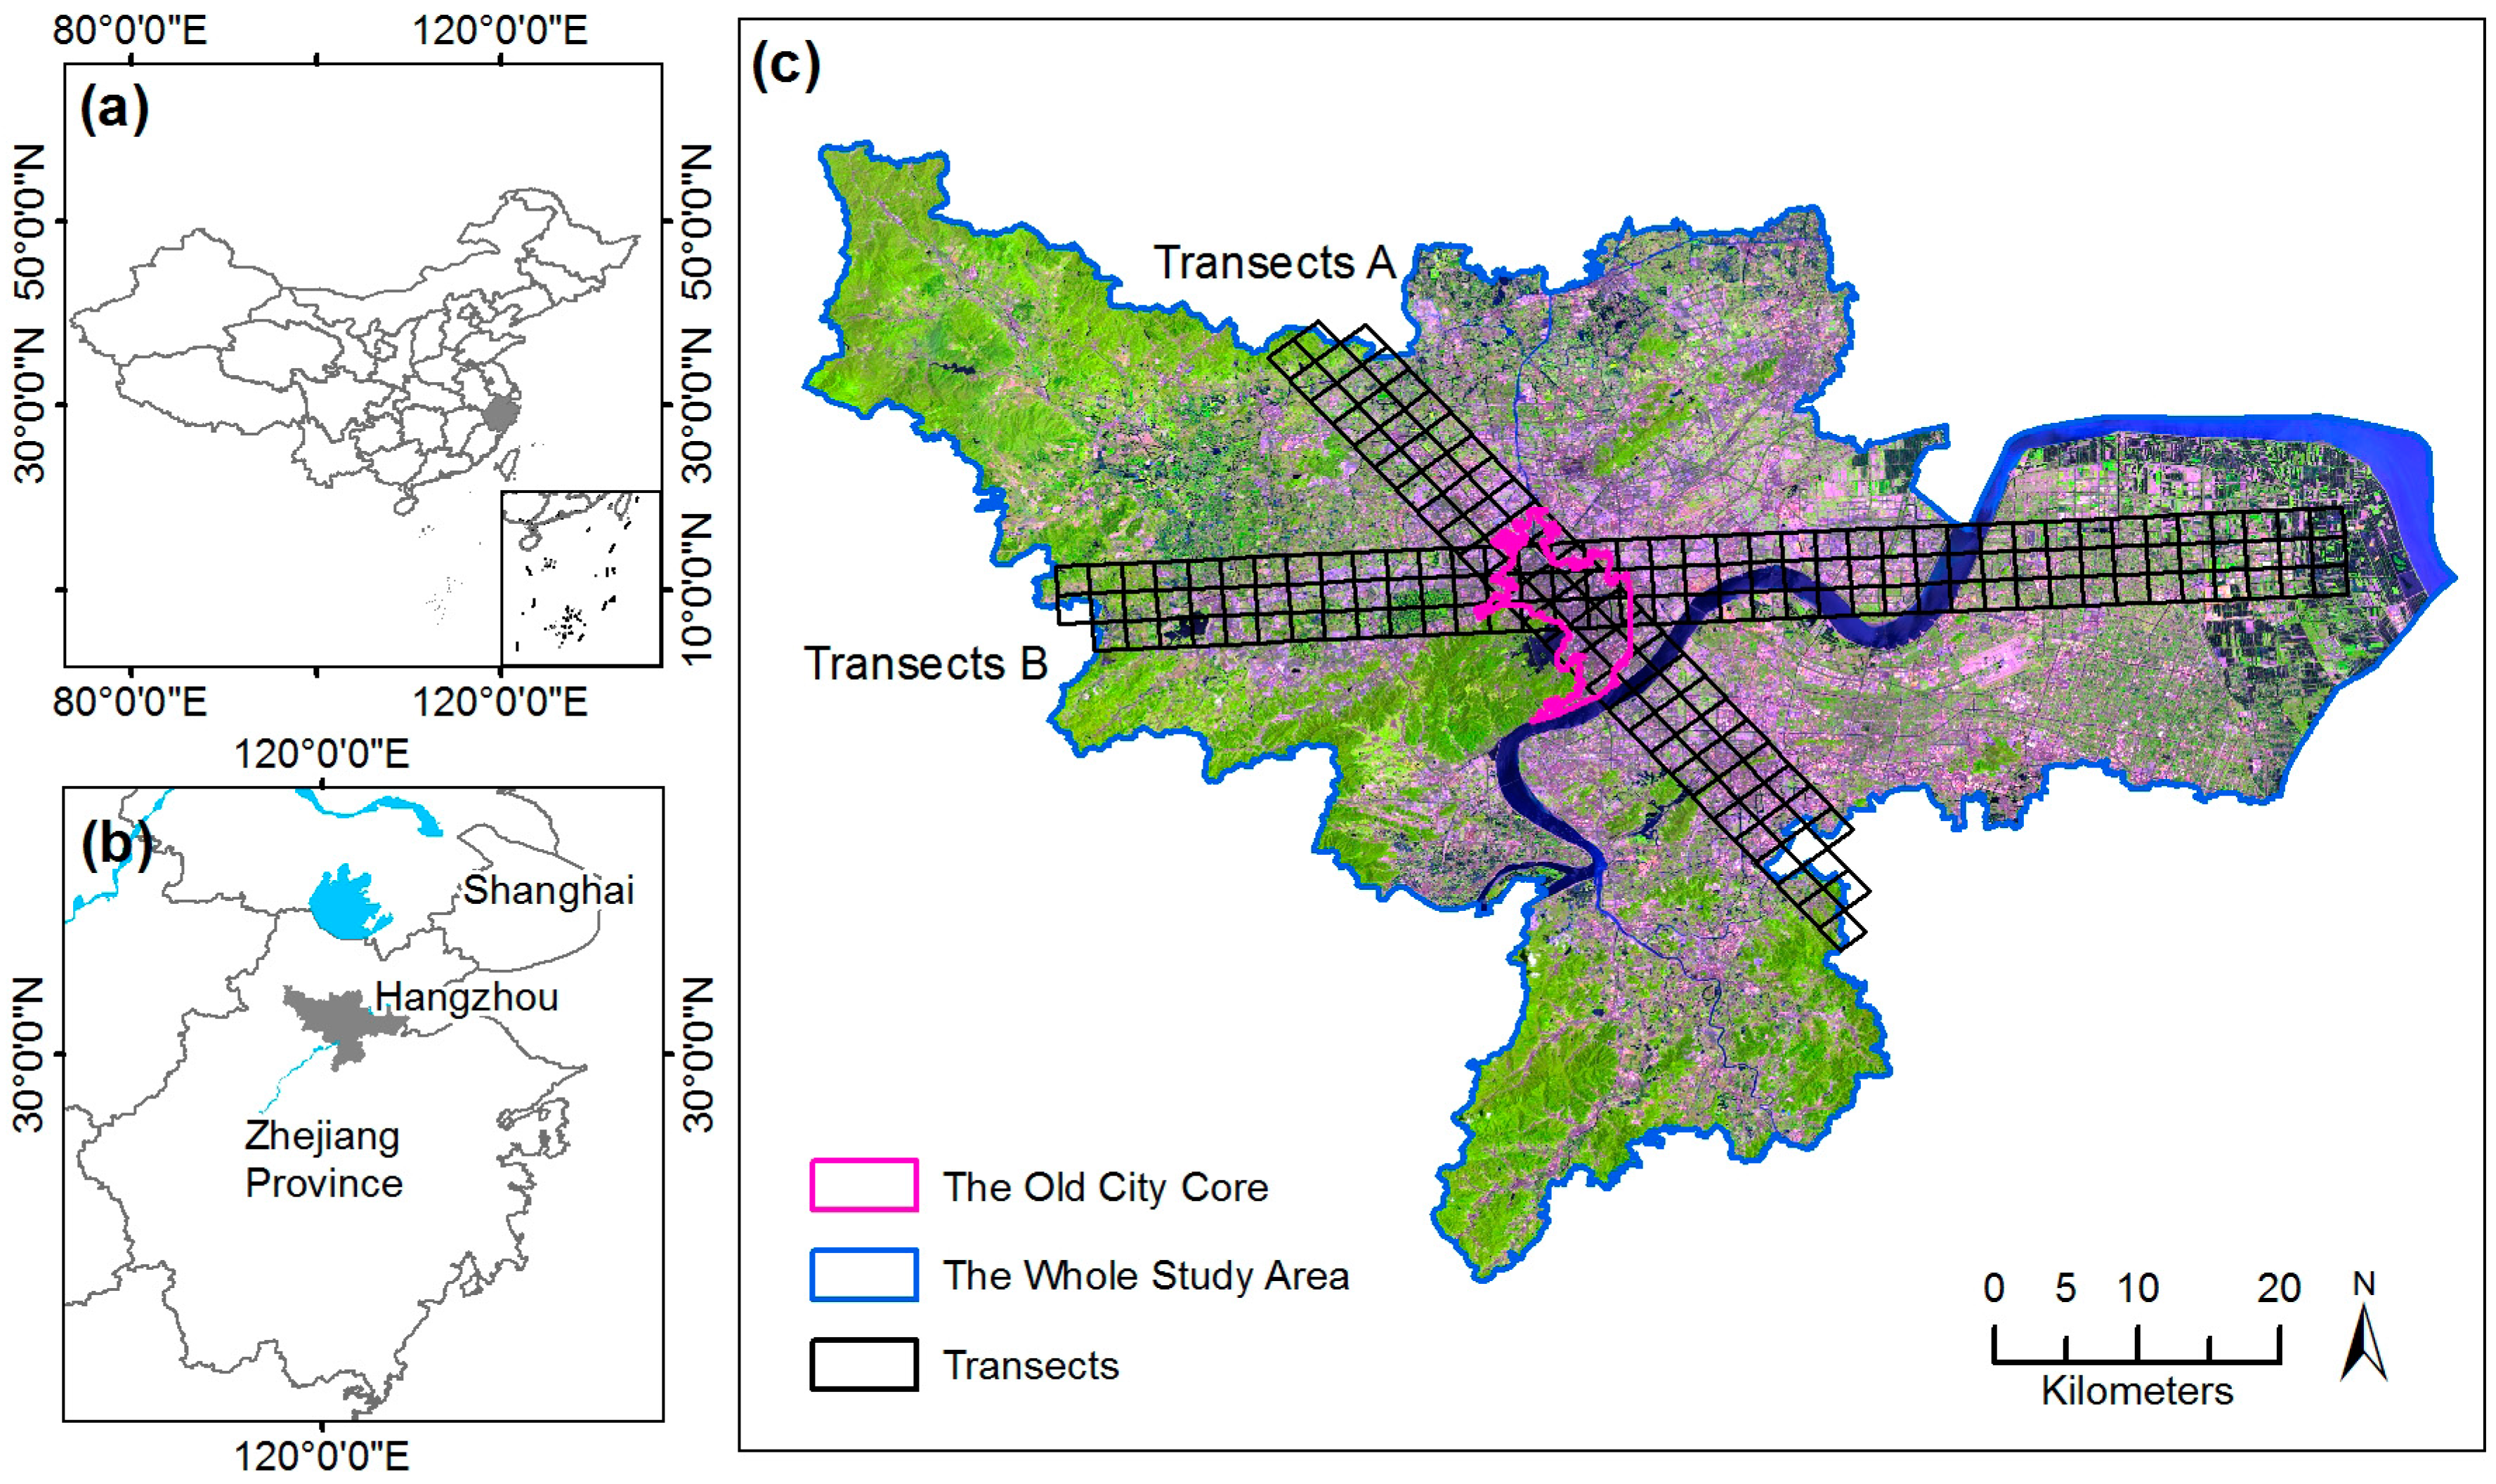
2.1. Study Site
2.2. Data and Preprocessing
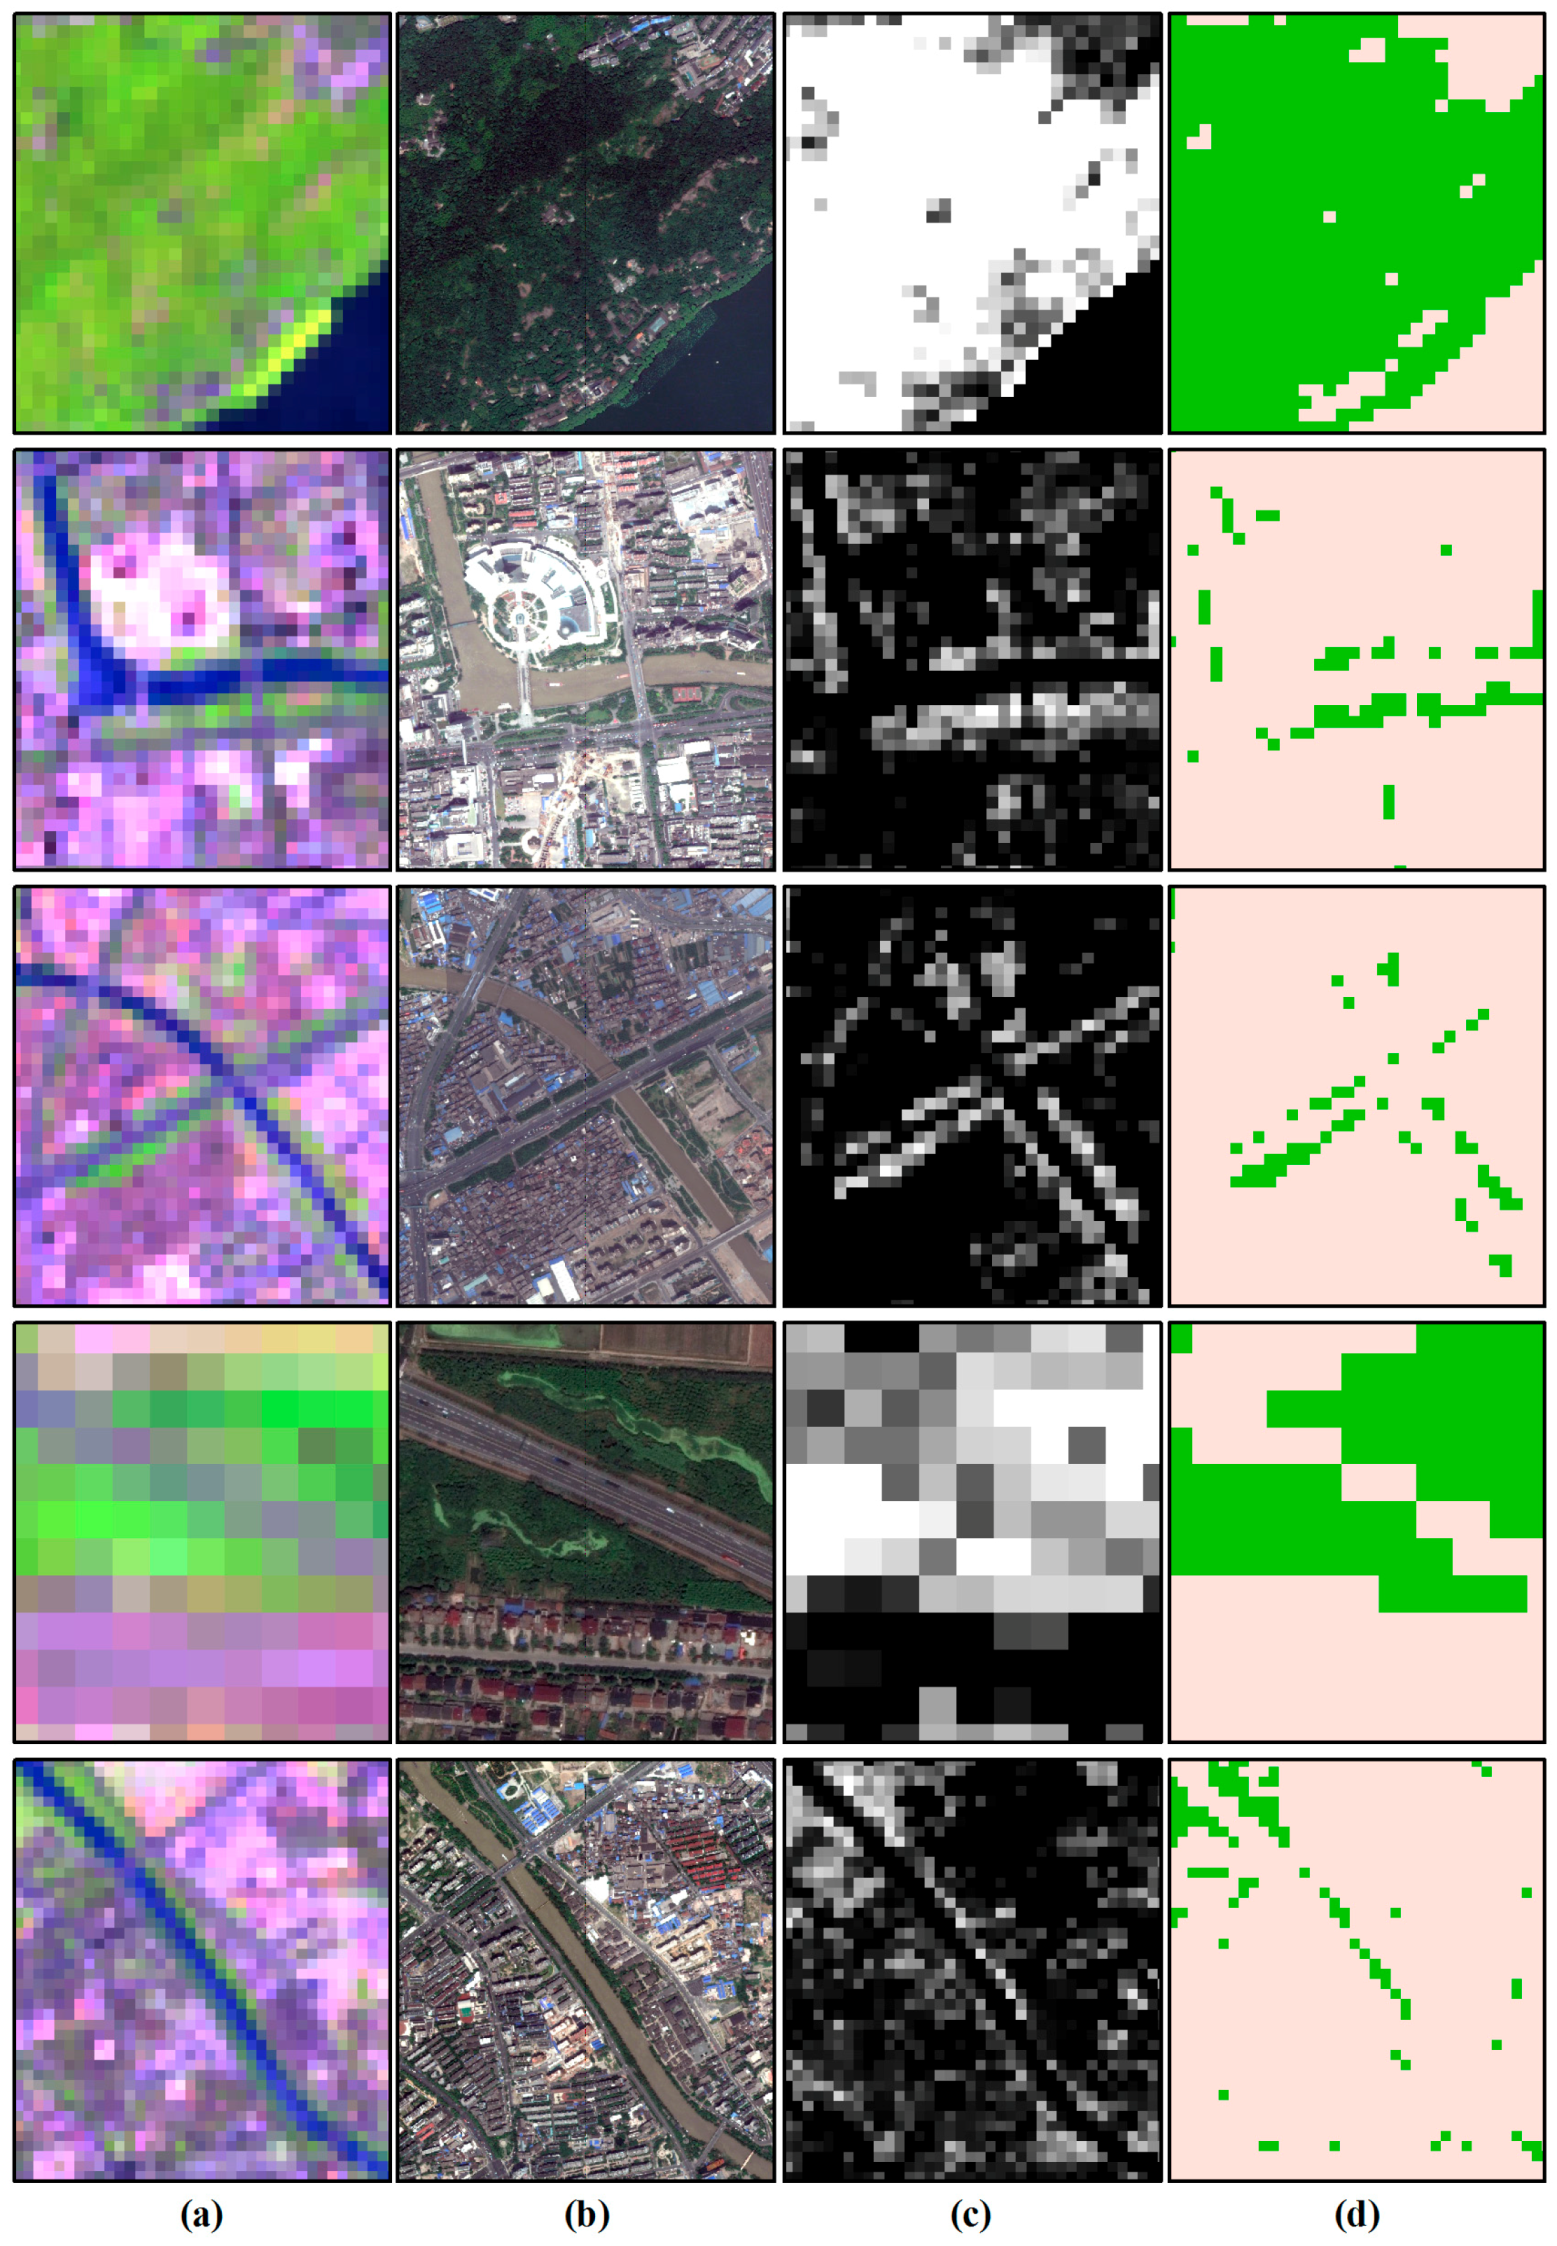
2.3. Vegetation Fraction Retrieval
2.4. Green Space Landscape Metric Analysis
3. Results
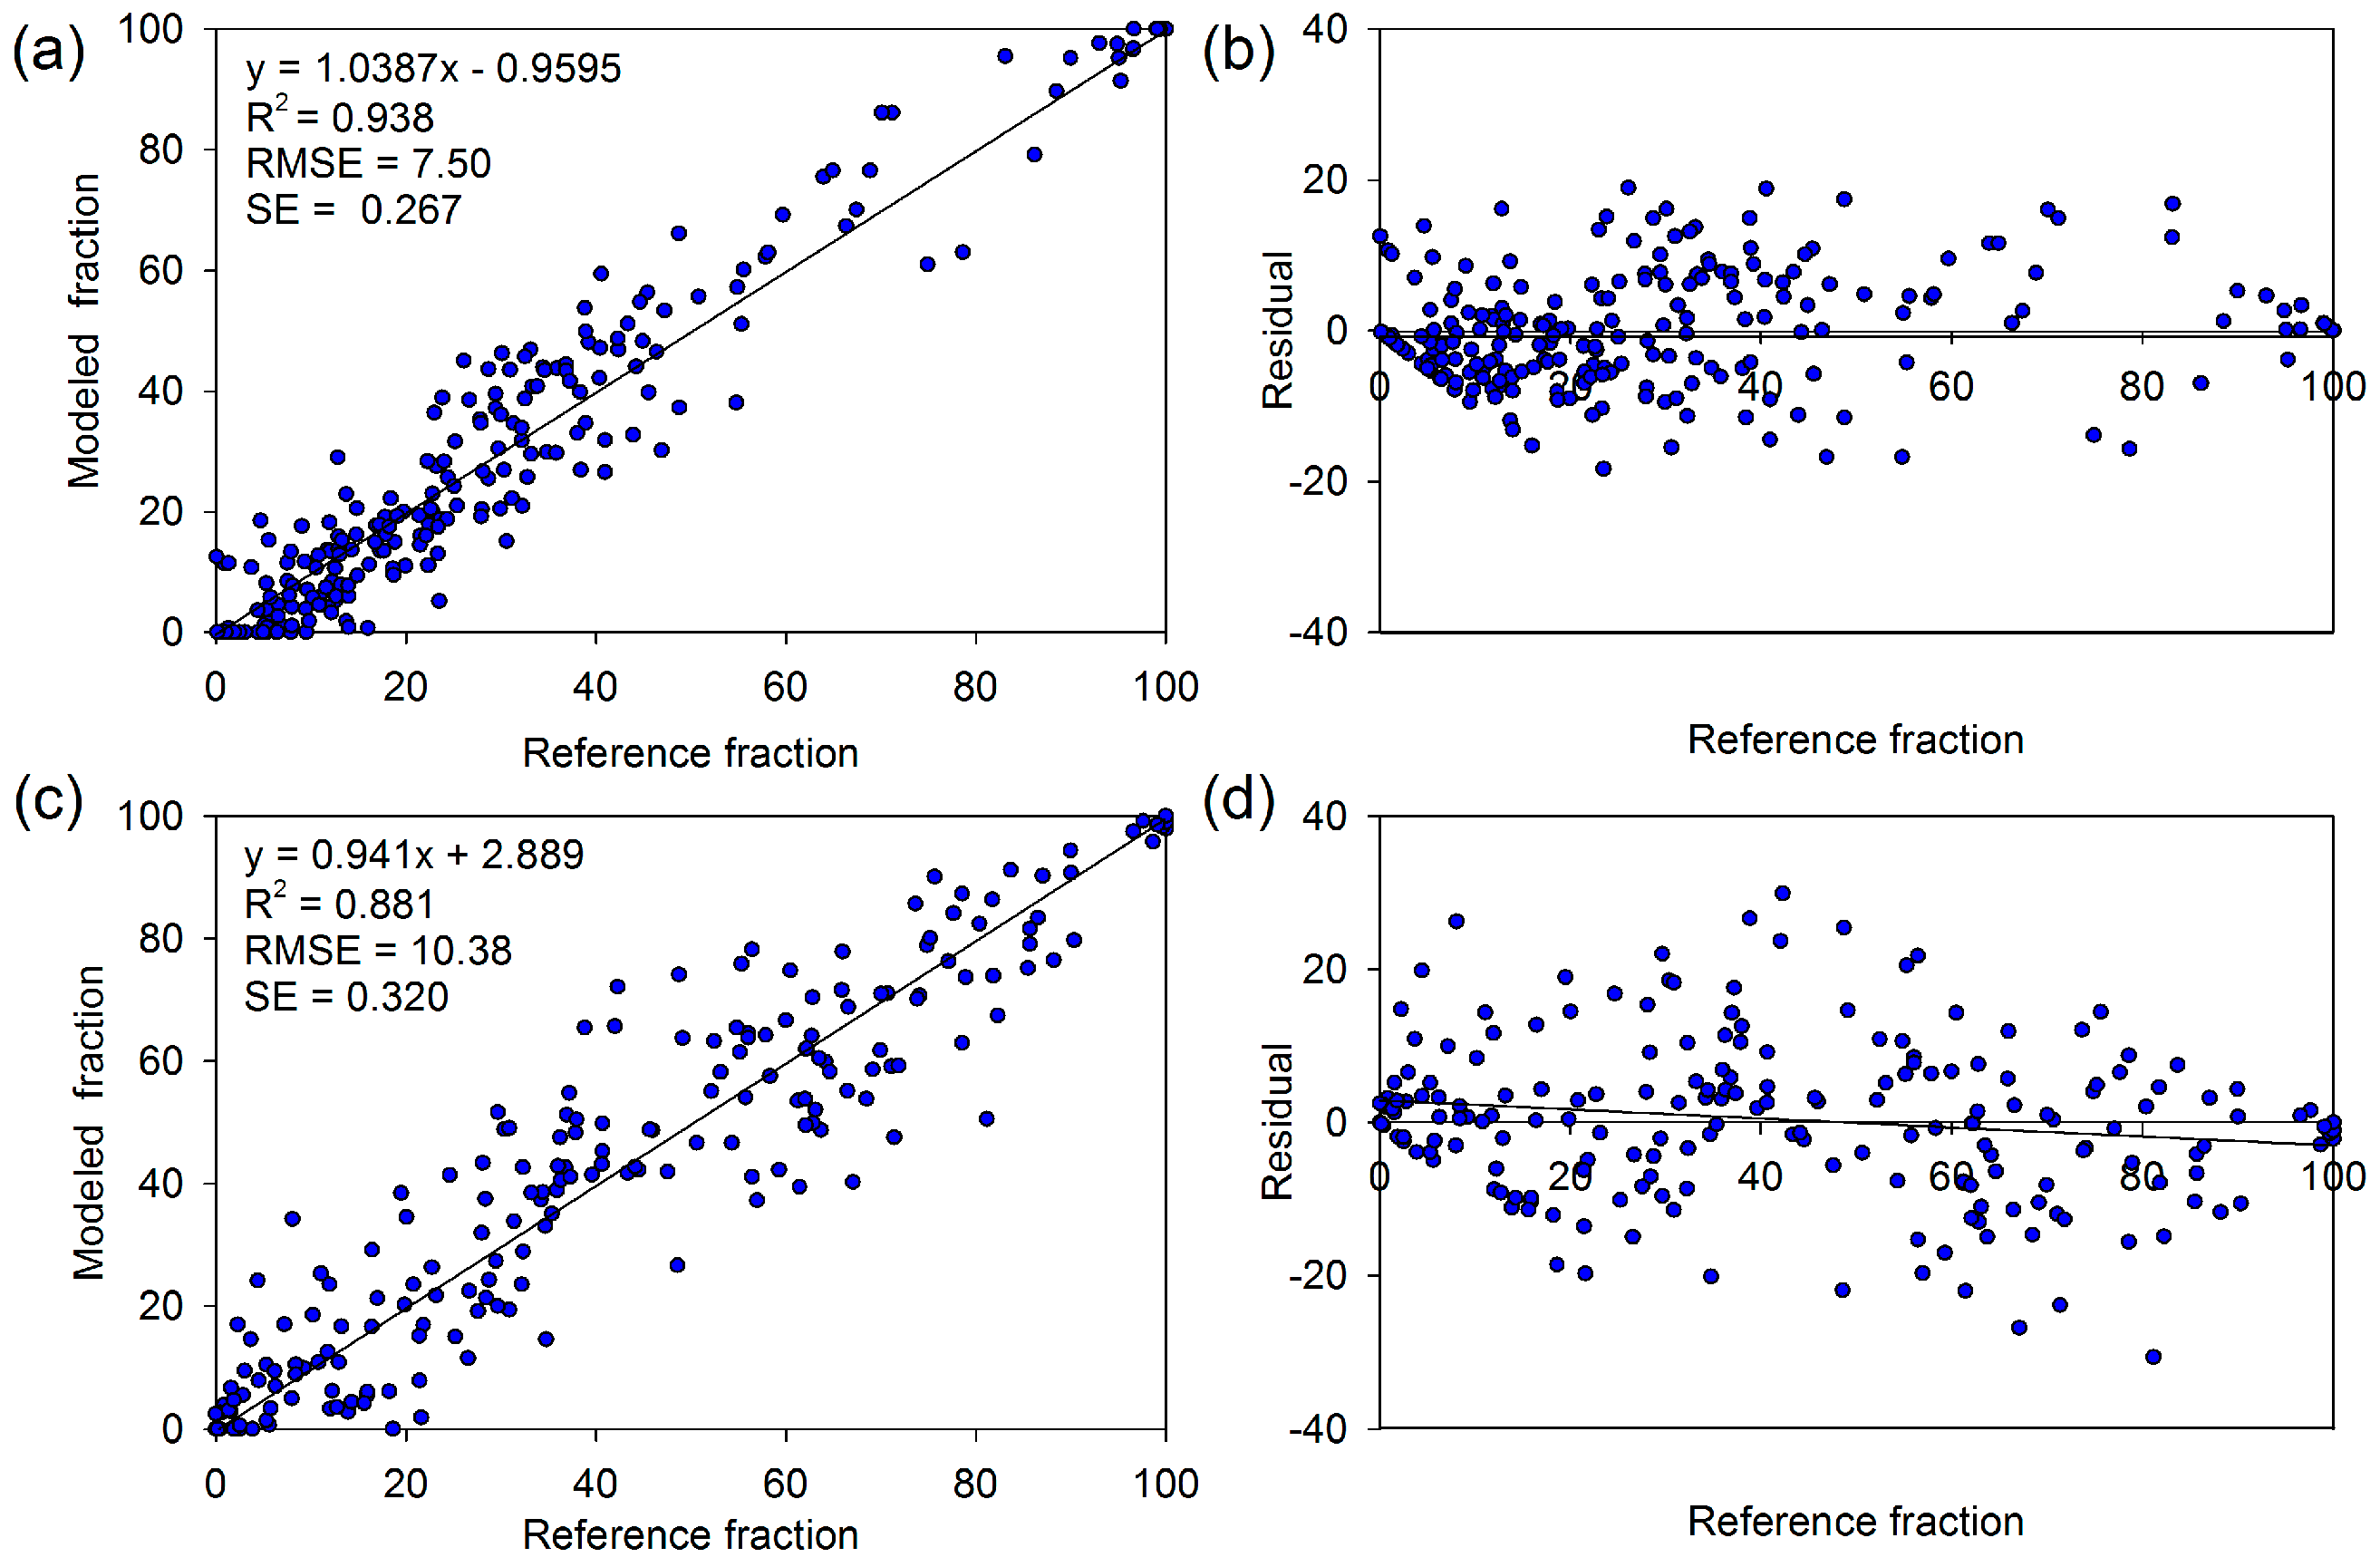
3.1. Accuracy Assessment
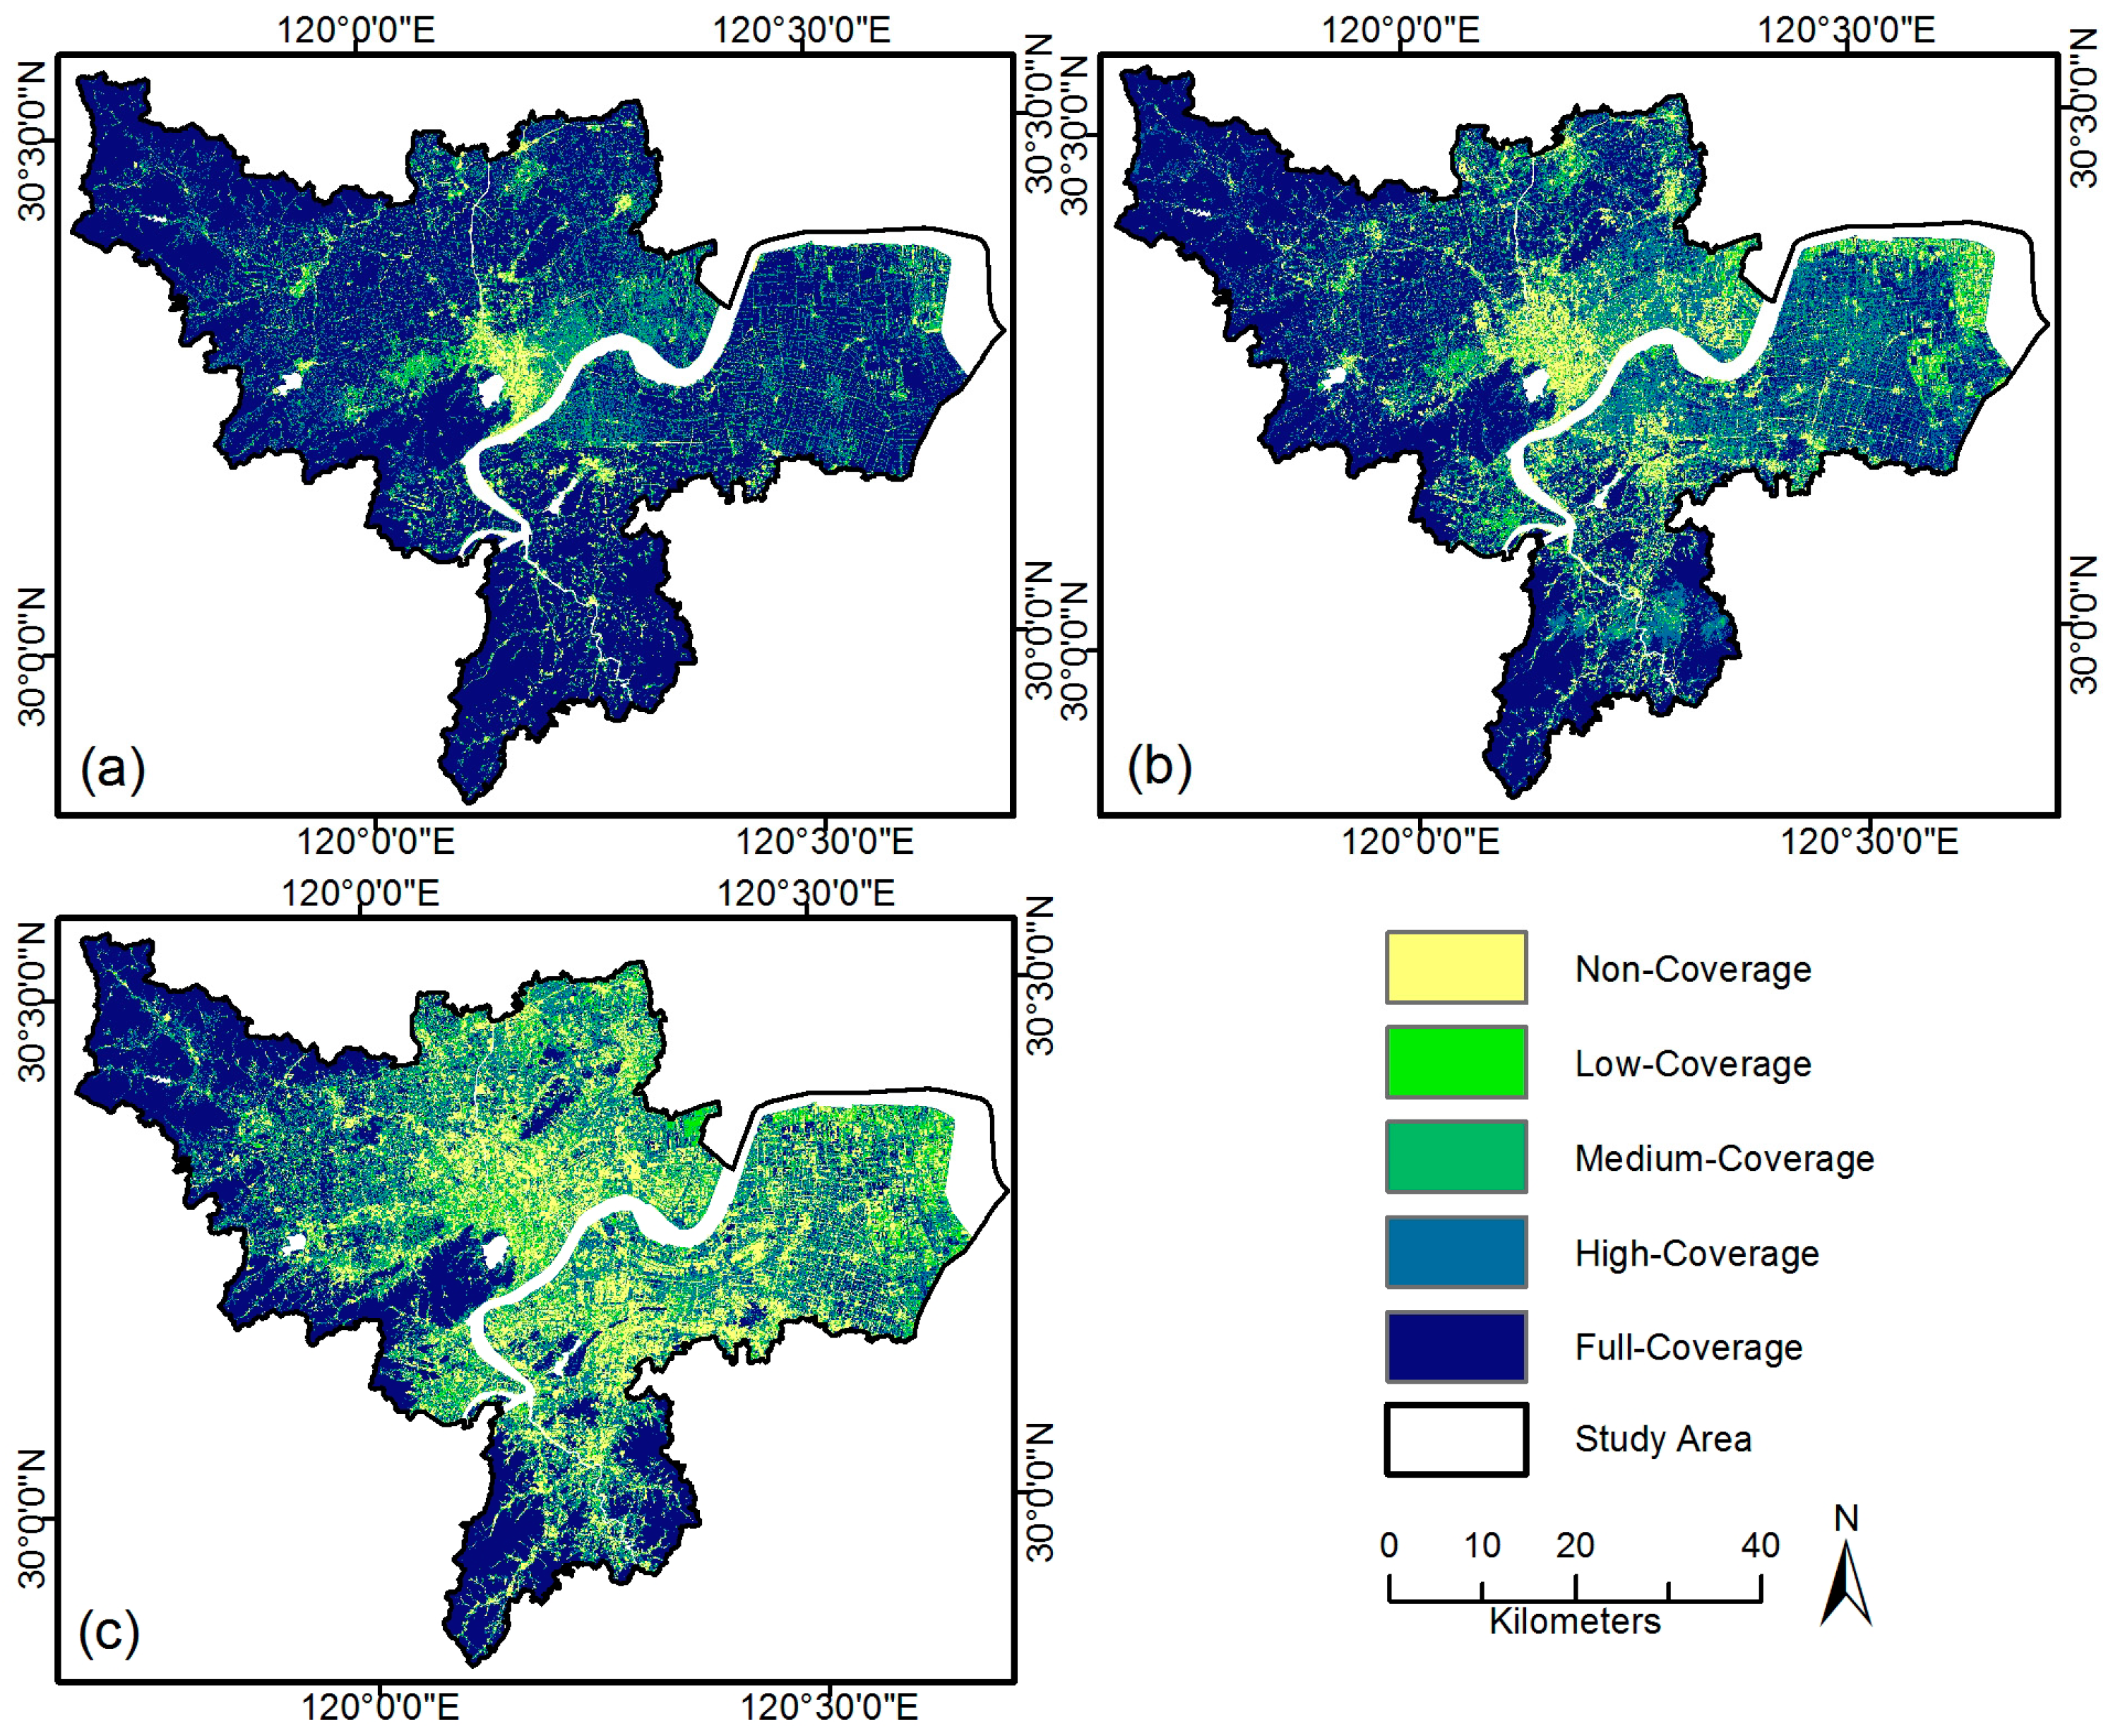
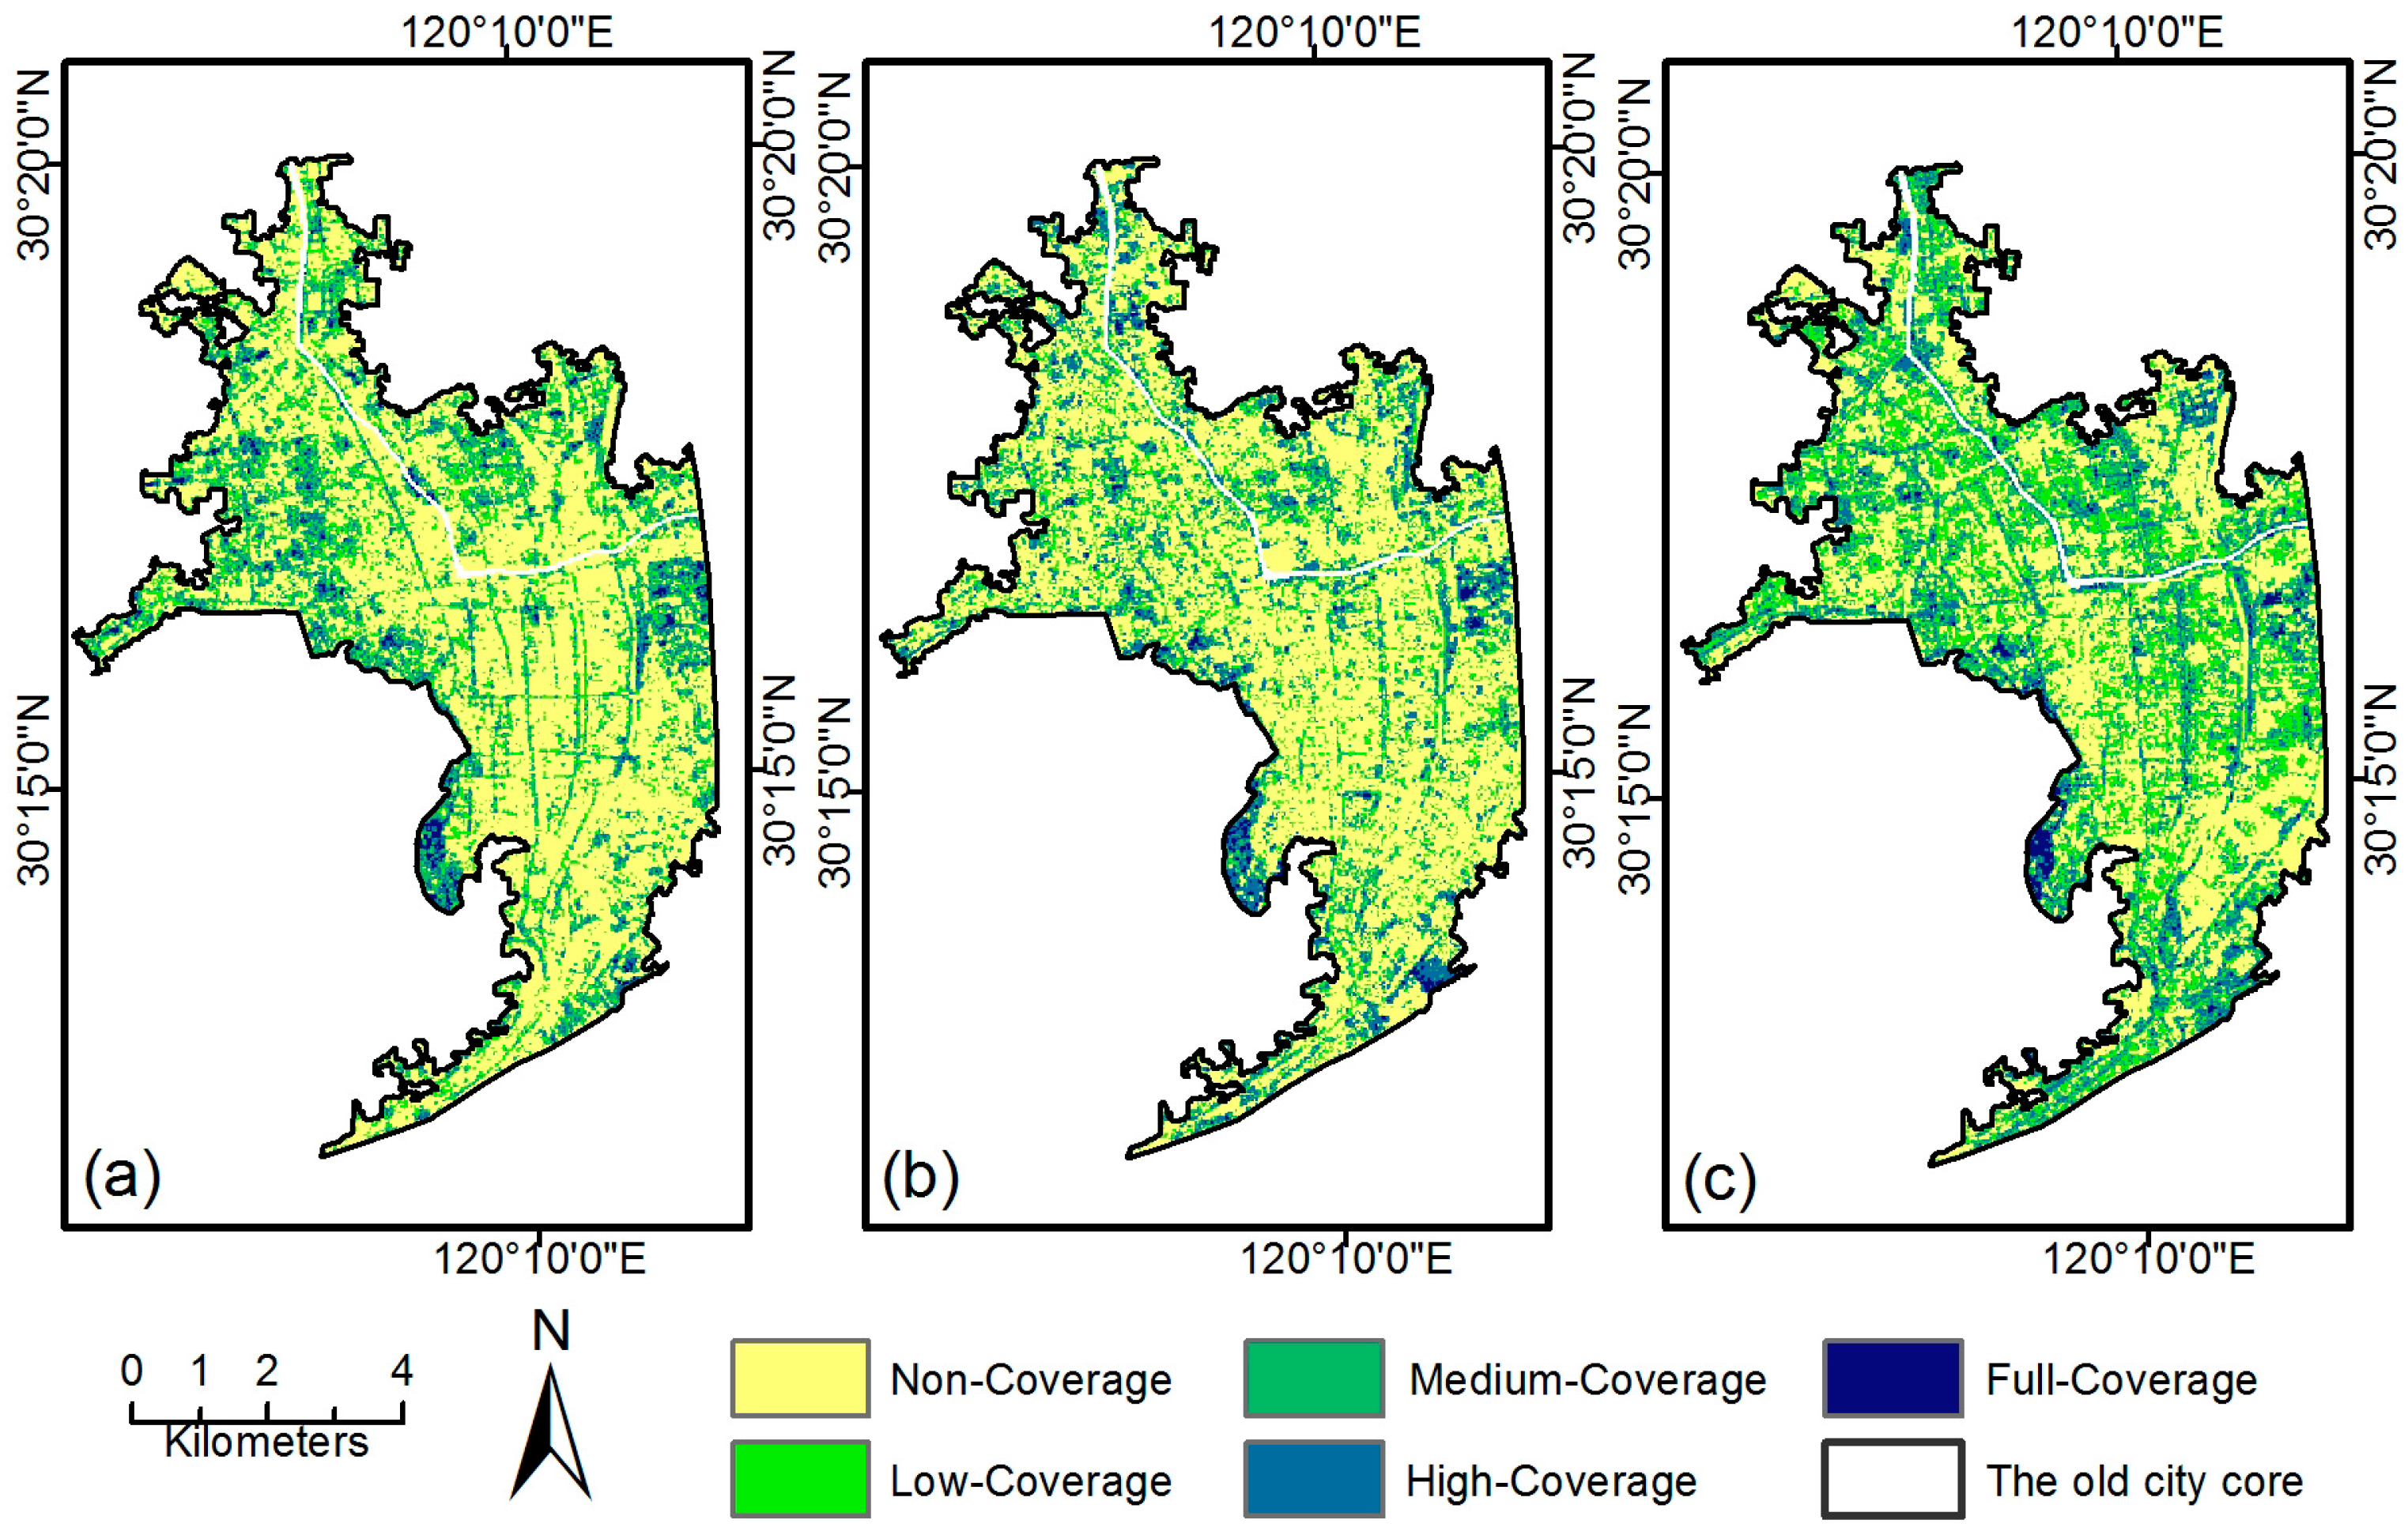
3.2. General Dynamics of Green Space Landscape Pattern in Hangzhou City
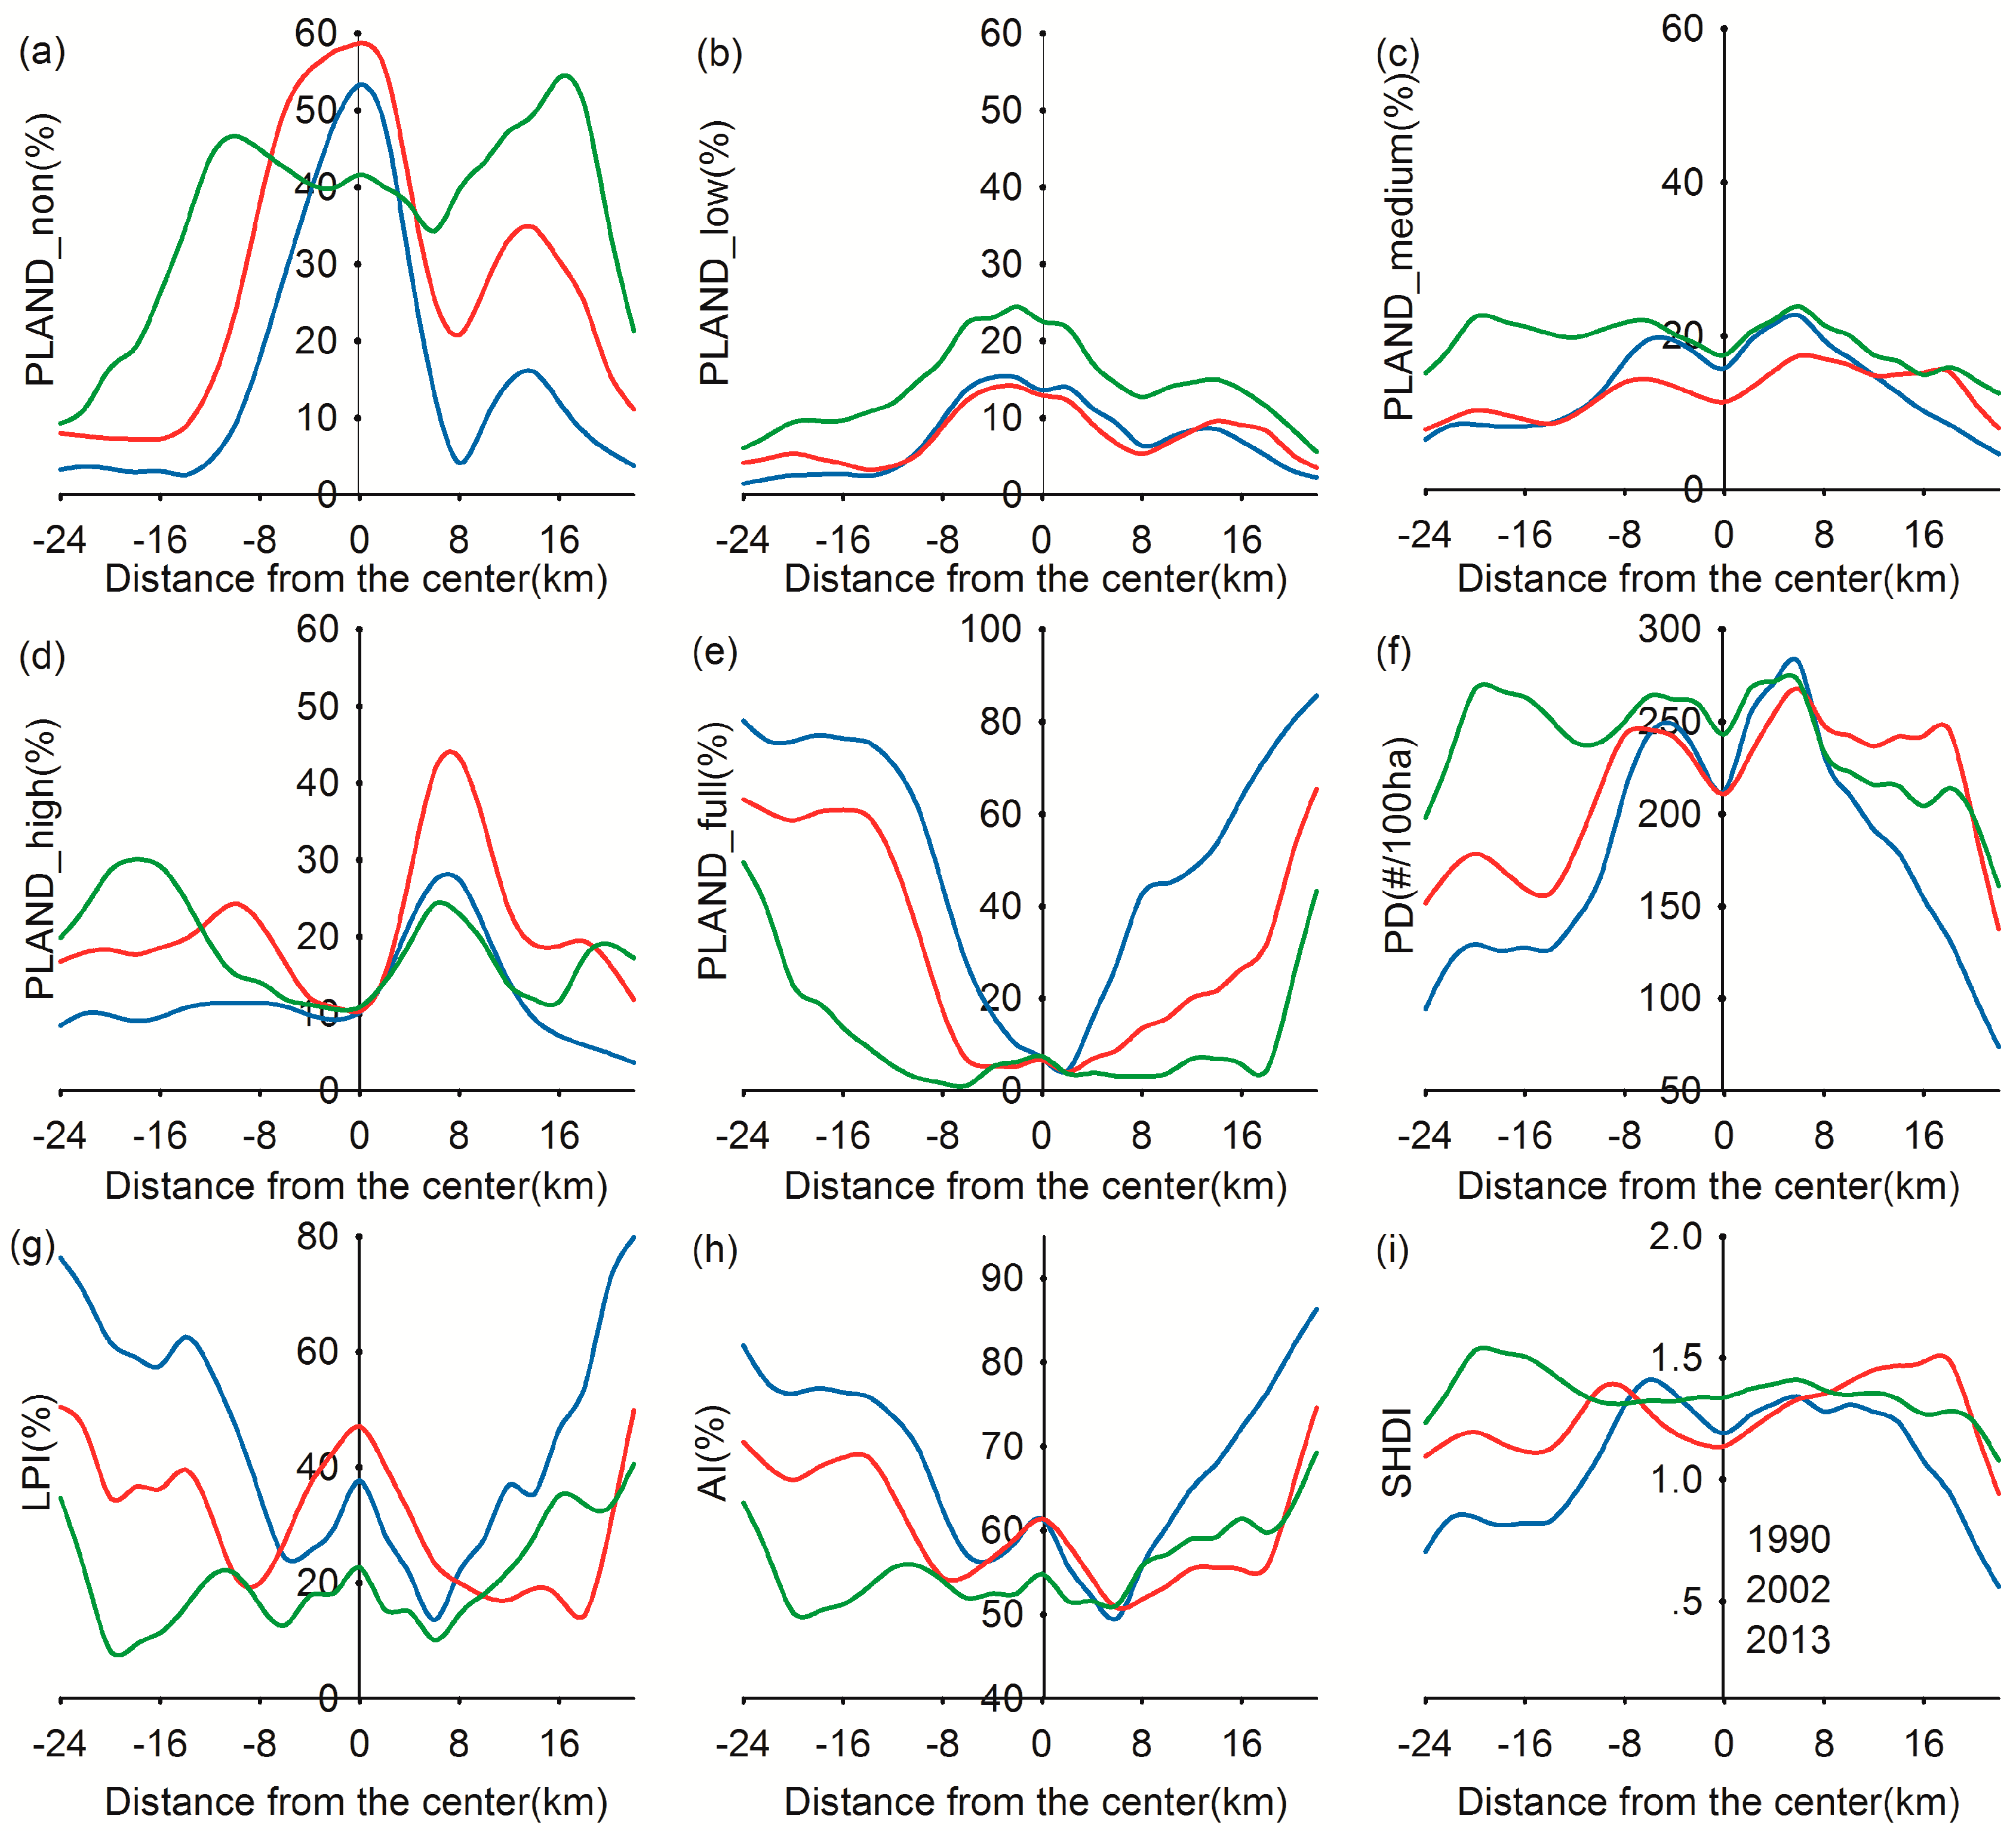
3.3. Gradient Analysis of the Study Area Using Landscape Metrics
4. Discussion
5. Conclusions
Acknowledgments
Author Contributions
Conflicts of Interest
References
- Deng, C.B.; Wu, C.S. Examining the impacts of urban biophysical compositions on surface urban heat island: A spectral unmixing and thermal mixing approach. Remote Sens. Environ. 2013, 131, 262–274. [Google Scholar] [CrossRef]
- Liang, Y.; Jiang, C.; Ma, L.; Liu, L.; Chen, W.; Liu, L. Government support, social capital and adaptation to urban flooding by residents in the Pearl River Delta area, China. Habitat Int. 2017, 59, 21–31. [Google Scholar] [CrossRef]
- Xie, Y.J.; Ng, C.N. Exploring spatio-temporal variations of habitat loss and its causal factors in the Shenzhen River cross-border watershed. Appl. Geogr. 2013, 39, 140–150. [Google Scholar] [CrossRef]
- Bodnaruk, E.W.; Kroll, C.N.; Yang, Y.; Hirabayashi, S.; Nowak, D.J.; Endreny, T.A. Where to plant urban trees? A spatially explicit methodology to explore ecosystem service tradeoffs. Landsc. Urban Plan. 2017, 157, 457–467. [Google Scholar] [CrossRef]
- Davies, R.G.; Barbosa, O.; Fuller, R.A.; Tratalos, J.; Burke, N.; Lewis, D.; Warren, P.H.; Gaston, K.J. City-wide relationships between green spaces, urban land use and topography. Urban Ecosyst. 2008, 11, 269–287. [Google Scholar] [CrossRef]
- Tyrväinen, L.; Pauleit, S.; Seeland, K.; de Vries, S. Benefits and uses of urban forest and trees. In Urban Forests and Trees: A Reference Book; Konijnendijk, C.C., Nilsson, K., Randrup, T., Schipperijn, J., Eds.; Springer: New York, NY, USA, 2005; pp. 81–115. [Google Scholar]
- Akbari, H.; Pomerantz, M.; Taha, H. Cool surfaces and shade trees to reduce energy use and improve air quality in urban areas. Sol. Energy 2001, 70, 295–310. [Google Scholar] [CrossRef]
- Pathak, V.; Tripathi, B.D.; Mishra, V.K. Evaluation of Anticipated Performance Index of some tree species for green belt development to mitigate traffic generated noise. Urban For. Urban Green. 2011, 10, 61–66. [Google Scholar] [CrossRef]
- Nowak, D.J.; Dwyer, J.F. Understanding the Benefits and Costs of Urban Forest Ecosystems. In Handbook of Urban and Community Forestry in the Northeast; Springer: New York, NY, USA, 2000; pp. 25–46. [Google Scholar]
- Thompson, C.W.; Roe, J.; Aspinall, P.; Mitchell, R.; Clow, A.; Miller, D. More green space is linked to less stress in deprived communities: Evidence from salivary cortisol patterns. Landsc. Urban Plan. 2012, 105, 221–229. [Google Scholar] [CrossRef]
- Peters, K.; Elands, B.; Buijs, A.; Bell, S. Social interactions in urban parks: Stimulating social cohesion? Urban For. Urban Green. 2010, 9, 93–100. [Google Scholar] [CrossRef]
- Donovan, G.H.; Butry, D.T.; Michael, Y.L.; Prestemon, J.P.; Liebhold, A.M.; Gatziolis, D.; Mao, M.Y. The Relationship between Trees and Human Health: Evidence from the Spread of the Emerald Ash Borer. Am. J. Prev. Med. 2013, 44, 139–145. [Google Scholar] [CrossRef] [PubMed]
- Everson-Rose, S.A.; Lewis, T.T. Psychosocial factors and cardiovascular diseases. Annu. Rev. Public Health 2004, 26, 469–500. [Google Scholar] [CrossRef] [PubMed]
- Tang, J.M.; Chen, F.; Schwartz, S.S. Assessing spatiotemporal variations of greenness in the Baltimore-Washington corridor area. Landsc. Urban Plan. 2012, 105, 296–306. [Google Scholar] [CrossRef]
- Fuller, R.A.; Gaston, K.J. The scaling of green space coverage in European cities. Biol. Lett. 2009, 5, 352–355. [Google Scholar] [CrossRef] [PubMed]
- Dallimer, M.; Tang, Z.Y.; Bibby, P.R.; Brindley, P.; Gaston, K.J.; Davies, Z.G. Temporal changes in greenspace in a highly urbanized region. Biol. Lett. 2011, 7, 763–766. [Google Scholar] [CrossRef] [PubMed]
- Zhao, J.J.; Chen, S.B.; Jiang, B.; Ren, Y.; Wang, H.; Vause, J.; Yu, H.D. Temporal trend of green space coverage in China and its relationship with urbanization over the last two decades. Sci. Total Environ. 2013, 442, 455–465. [Google Scholar] [CrossRef] [PubMed]
- Yang, J.; Huang, C.; Zhang, Z.; Wang, L. The temporal trend of urban green coverage in major Chinese cities between 1990 and 2010. Urban For. Urban Green. 2014, 13, 19–27. [Google Scholar] [CrossRef]
- Grimm, N.B.; Faeth, S.H.; Golubiewski, N.E.; Redman, C.L.; Wu, J.; Bai, X.; Briggs, J.M. Global change and the ecology of cities. Science 2008, 319, 756–760. [Google Scholar] [CrossRef] [PubMed]
- Lu, Y.; Coops, N.C.; Hermosilla, T. Estimating urban vegetation fraction across 25 cities in pan-Pacific using Landsat time series data. ISPRS J. Photogramm Remote Sens. 2017, 126, 11–23. [Google Scholar] [CrossRef]
- Deng, J.S.; Qiu, L.F.; Wang, K.; Yang, H.; Shi, Y.Y. An integrated analysis of urbanization-triggered cropland loss trajectory and implications for sustainable land management. Cities 2011, 28, 127–137. [Google Scholar] [CrossRef]
- Bai, X.; Shi, P.; Liu, Y. Society: Realizing China’s urban dream. Nature 2014, 509, 158–160. [Google Scholar] [CrossRef] [PubMed]
- Morrison, N. A Green Belt under Pressure: The Case of Cambridge, England. Plan. Pract. Res. 2010, 25, 157–181. [Google Scholar] [CrossRef]
- Tan, P.Y.; Wang, J.; Sia, A. Perspectives on five decades of the urban greening of Singapore. Cities 2013, 32, 24–32. [Google Scholar] [CrossRef]
- Liu, C.; Shi, T.; Kohel, A.; Mlchio, U. Retrospection on Policy Development of Urban Green Space in Japan and Apocalypse of Actual Urban Green Space from the Zoning System. Urban Plan. Forum 2008, 21, 70–76. [Google Scholar]
- Zhou, X.L.; Wang, Y.C. Spatial-temporal dynamics of urban green space in response to rapid urbanization and greening policies. Landsc. Urban Plan. 2011, 100, 268–277. [Google Scholar] [CrossRef]
- Jim, C.Y.; Chen, S.S. Comprehensive greenspace planning based on landscape ecology principles in compact Nanjing city, China. Landsc. Urban Plan. 2003, 65, 95–116. [Google Scholar] [CrossRef]
- Patino, J.E.; Duque, J.C. A review of regional science applications of satellite remote sensing in urban settings. Comput. Environ. Urban Syst. 2013, 37, 1–17. [Google Scholar] [CrossRef]
- Mora, B.; Wulder, M.; White, J.; Hobart, G. Modeling Stand Height, Volume, and Biomass from Very High Spatial Resolution Satellite Imagery and Samples of Airborne LiDAR. Remote Sens. 2013, 5, 2308–2326. [Google Scholar] [CrossRef]
- Zhou, W.; Troy, A.; Grove, M. Object-based Land Cover Classification and Change Analysis in the Baltimore Metropolitan Area Using Multitemporal High Resolution Remote Sensing Data. Sensors 2008, 8, 1613–1636. [Google Scholar] [CrossRef] [PubMed]
- Li, X.M.; Zhou, W.Q.; Ouyang, Z.Y. Relationship between land surface temperature and spatial pattern of greenspace: What are the effects of spatial resolution? Landsc. Urban Plan. 2013, 114, 1–8. [Google Scholar] [CrossRef]
- Qian, Y.; Zhou, W.; Li, W.; Han, L. Understanding the dynamic of greenspace in the urbanized area of Beijing based on high resolution satellite images. Urban For. Urban Green. 2015, 14, 39–47. [Google Scholar] [CrossRef]
- Qian, Y.; Zhou, W.; Yu, W.; Pickett, S.T.A. Quantifying spatiotemporal pattern of urban greenspace: New insights from high resolution data. Landsc. Ecol. 2015, 30, 1165–1173. [Google Scholar] [CrossRef]
- Liu, T.; Yang, X.J. Mapping vegetation in an urban area with stratified classification and multiple endmember spectral mixture analysis. Remote Sens. Environ. 2013, 133, 251–264. [Google Scholar] [CrossRef]
- Michishita, R.; Jiang, Z.B.; Xu, B. Monitoring two decades of urbanization in the Poyang Lake area, China through spectral unmixing. Remote Sens. Environ. 2012, 117, 3–18. [Google Scholar] [CrossRef]
- Powell, R.L.; Roberts, D.A.; Dennison, P.E.; Hess, L.L. Sub-pixel mapping of urban land cover using multiple endmember spectral mixture analysis: Manaus, Brazil. Remote Sens. Environ. 2007, 106, 253–267. [Google Scholar] [CrossRef]
- Feng, Q.; Gong, J.; Liu, J.; Li, Y. Flood Mapping Based on Multiple Endmember Spectral Mixture Analysis and Random Forest Classifier—The Case of Yuyao, China. Remote Sens. 2015, 7, 12539–12562. [Google Scholar] [CrossRef]
- Zhang, Z.; Su, S.; Xiao, R.; Jiang, D.; Wu, J. Identifying determinants of urban growth from a multi-scale perspective: A case study of the urban agglomeration around Hangzhou Bay, China. Appl. Geogr. 2013, 45, 193–202. [Google Scholar] [CrossRef]
- Su, S.; Wang, Y.; Luo, F.; Mai, G.; Pu, J. Peri-urban vegetated landscape pattern changes in relation to socioeconomic development. Ecol. Indic. 2014, 46, 477–486. [Google Scholar] [CrossRef]
- Deng, J.S.; Wang, K.; Hong, Y.; Qi, J.G. Spatio-temporal dynamics and evolution of land use change and landscape pattern in response to rapid urbanization. Landsc. Urban Plan. 2009, 92, 187–198. [Google Scholar] [CrossRef]
- Buyantuyev, A.; Wu, J.; Gries, C. Multiscale analysis of the urbanization pattern of the Phoenix metropolitan landscape of USA: Time, space and thematic resolution. Landsc. Urban Plan. 2010, 94, 206–217. [Google Scholar] [CrossRef]
- USGS Global Visualization Viewer. Available online: http://glovis.usgs.gov/ (accessed on 27 October 2013).
- Roberts, D.A.; Gardner, M.; Church, R.; Ustin, S.; Scheer, G.; Green, R.O. Mapping chaparral in the Santa Monica Mountains using multiple endmember spectral mixture models. Remote Sens. Environ. 1998, 65, 267–279. [Google Scholar] [CrossRef]
- Lu, D.S.; Weng, Q.H. Spectral mixture analysis of the urban landscape in Indianapolis with landsat ETM plus imagery. Photogram. Eng. Remote Sens. 2004, 70, 1053–1062. [Google Scholar] [CrossRef]
- Lu, D.S.; Batistella, M.; Moran, E. Multitemporal spectral mixture analysis for Amazonian land-cover change detection. Can. J. Remote Sens. 2004, 30, 87–100. [Google Scholar] [CrossRef]
- Wu, C.S.; Yuan, F. Seasonal sensitivity analysis of impervious surface estimation with satellite imagery. Photogram. Eng. Remote Sens. 2007, 73, 1393–1401. [Google Scholar] [CrossRef]
- Gan, M.; Deng, J.; Zheng, X.; Hong, Y.; Wang, K. Monitoring Urban Greenness Dynamics Using Multiple Endmember Spectral Mixture Analysis. PLoS ONE 2014, 9, e112202. [Google Scholar] [CrossRef] [PubMed]
- Small, C. Estimation of urban vegetation abundance by spectral mixture analysis. Int. J. Remote Sens. 2001, 22, 1305–1334. [Google Scholar] [CrossRef]
- Elmore, A.J.; Mustard, J.F.; Manning, S.J.; Lobell, D.B. Quantifying Vegetation Change in Semiarid Environments: Precision and Accuracy of Spectral Mixture Analysis and the Normalized Difference Vegetation Index. Remote Sens. Environ. 2000, 73, 87–102. [Google Scholar] [CrossRef]
- McGarigal, K.; Cushman, S.; Neel, M.C.; Ene, E. FRAGSTATS v3: Spatial Pattern Analysis Program for Categorical Maps. Computer Software Program Produced by the Authors at the University of Massachusetts, Amherst. 2002. Available online: http://www.umass.edu/landeco/research/fragstats/fragstats.html (accessed on 5 June 2017).
- Luck, M.; Wu, J. A gradient analysis of urban landscape pattern: A case study from the Phoenix metropolitan region, Arizona, USA. Landsc. Ecol. 2002, 17, 327–339. [Google Scholar] [CrossRef]
- Baycan-Levent, T.; Vreeker, R.; Nijkamp, P. A Multi-Criteria Evaluation of Green Spaces in European Cities. Eur. Urban Reg. Stud. 2009, 16, 193–213. [Google Scholar] [CrossRef]
- Kabisch, N.; Haase, D. Green spaces of European cities revisited for 1990–2006. Landsc. Urban Plan. 2013, 110, 113–122. [Google Scholar] [CrossRef]
- Nowak, D.J.; Greenfield, E.J. Tree and impervious cover change in US cities. Urban For. Urban Green. 2012, 11, 21–30. [Google Scholar] [CrossRef]
- Sun, J.; Wang, X.; Chen, A.; Ma, Y.; Cui, M.; Piao, S. NDVI indicated characteristics of vegetation cover change in China’s metropolises over the last three decades. Environ. Monit. Assess. 2011, 179, 1–14. [Google Scholar] [CrossRef] [PubMed]
- Gao, Y. The Influence of Western Landscape Architecture Art on Modern Hangzhou Parks. Master’s Thesis, Zhejiang Agriculture and Forestry University, Hangzhou, China, 2012. [Google Scholar]
- Li, G. A Study of the Development History of Westlake Landscape in Hangzhou. Master’s Thesis, Nanjing Forestry University, Nanjing, China, 2006. [Google Scholar]
- Wu, K.; Zhang, H. Land use dynamics, built-up land expansion patterns, and driving forces analysis of the fast-growing Hangzhou metropolitan area, eastern China (1978–2008). Appl. Geogr. 2012, 34, 137–145. [Google Scholar] [CrossRef]
- Wolch, J.R.; Byrne, J.; Newell, J.P. Urban green space, public health, and environmental justice: The challenge of making cities ‘just green enough’. Landsc. Urban Plan. 2014, 125, 234–244. [Google Scholar] [CrossRef]
- Yuan, Y.; Han, Y.; Zhang, Z.; Liu, Y. Research on zoning of green area ratio in residential area: Based on panyu district of Guangzhou City. City Plan. Rev. 2015, 39, 97–104. [Google Scholar]
- Kong, F.H.; Nakagoshi, N. Spatial-temporal gradient analysis of urban green spaces in Jinan, China. Landsc. Urban Plan. 2006, 78, 147–164. [Google Scholar] [CrossRef]
- Heynen, N.C. The Scalar Production of Injustice within the Urban Forest. Antipode 2003, 35, 980–998. [Google Scholar] [CrossRef]
- Sandström, U.G.; Angelstam, P.; Mikusiński, G. Ecological diversity of birds in relation to the structure of urban green space. Landsc. Urban Plan. 2006, 77, 39–53. [Google Scholar] [CrossRef]
- Peschardt, K.K.; Schipperijn, J.; Stigsdotter, U.K. Use of Small Public Urban Green Spaces (SPUGS). Urban For. Urban Green. 2012, 11, 235–244. [Google Scholar] [CrossRef]
- Niemelä, J. Ecology of urban green spaces: The way forward in answering major research questions. Landsc. Urban Plan. 2014, 125, 298–303. [Google Scholar] [CrossRef]
- Dreger, C.; Zhang, Y. Is there a Bubble in the Chinese Housing Market? Urban Policy Res. 2013, 31, 27–39. [Google Scholar] [CrossRef]
- Byrne, J.A.; Lo, A.Y.; Yang, J. Residents’ understanding of the role of green infrastructure for climate change adaptation in Hangzhou, China. Landsc. Urban Plan. 2015, 138, 132–143. [Google Scholar] [CrossRef]


| Landscape Metrics | Unit | Range | Justification |
|---|---|---|---|
| Percentage of landscape (PLAND) | Percent | 0–100 | A general index which depicts the relative abundance of each vegetation coverage type |
| Patch density (PD) | Number per 100 hectares | >0 | Index of fragmentation |
| Largest patch index (LPI) | Percent | 0–100 | Index of fragmentation and dominance |
| Aggregation index (AI) | Percent | 0–100 | Index of spatial aggregation |
| Shannon’s diversity index (SHDI) | None | ≥0 | Index of diversity |
| Year | Class | The Whole Study Area | The Old City Core | ||||
|---|---|---|---|---|---|---|---|
| PLAND | PD | LPI | PLAND | PD | LPI | ||
| 1990 | Non | 4.50 | 8.00 | 0.43 | 56.42 | 19.42 | 22.88 |
| Low | 3.80 | 23.46 | 0.00 | 17.00 | 91.97 | 0.09 | |
| Medium | 10.31 | 44.77 | 0.21 | 18.09 | 75.80 | 0.10 | |
| High | 11.63 | 48.32 | 0.03 | 7.05 | 39.06 | 0.14 | |
| Full | 69.76 | 7.28 | 11.69 | 1.44 | 5.80 | 0.08 | |
| 2002 | Non | 11.40 | 17.81 | 0.76 | 59.84 | 20.98 | 29.87 |
| Low | 4.91 | 26.63 | 0.01 | 14.58 | 87.31 | 0.04 | |
| Medium | 10.90 | 54.58 | 0.02 | 13.48 | 78.51 | 0.05 | |
| High | 22.72 | 46.88 | 0.22 | 10.81 | 38.61 | 0.25 | |
| Full | 50.06 | 14.80 | 11.80 | 1.30 | 5.82 | 0.06 | |
| 2013 | Non | 22.08 | 19.76 | 0.69 | 41.77 | 31.46 | 5.60 |
| Low | 9.54 | 46.10 | 0.03 | 24.95 | 84.21 | 0.20 | |
| Medium | 15.69 | 66.07 | 0.01 | 20.16 | 89.40 | 0.08 | |
| High | 18.87 | 45.14 | 0.05 | 11.43 | 48.36 | 0.08 | |
| Full | 33.81 | 13.42 | 4.05 | 1.69 | 7.25 | 0.31 | |
| Region | Year | Spatial Metrics | |||
|---|---|---|---|---|---|
| PD | LPI | AI | SHDI | ||
| The whole study area | 1990 | 131.84 | 11.69 | 47.38 | 1.00 |
| 2002 | 160.71 | 11.60 | 31.31 | 1.32 | |
| 2013 | 190.49 | 4.05 | 21.35 | 1.53 | |
| The city core | 1990 | 232.06 | 22.88 | 57.27 | 1.18 |
| 2002 | 231.23 | 29.87 | 56.82 | 1.16 | |
| 2013 | 260.68 | 5.60 | 50.67 | 1.35 | |
© 2017 by the authors. Licensee MDPI, Basel, Switzerland. This article is an open access article distributed under the terms and conditions of the Creative Commons Attribution (CC BY) license (http://creativecommons.org/licenses/by/4.0/).
Share and Cite
Yu, Z.; Wang, Y.; Deng, J.; Shen, Z.; Wang, K.; Zhu, J.; Gan, M. Dynamics of Hierarchical Urban Green Space Patches and Implications for Management Policy. Sensors 2017, 17, 1304. https://doi.org/10.3390/s17061304
Yu Z, Wang Y, Deng J, Shen Z, Wang K, Zhu J, Gan M. Dynamics of Hierarchical Urban Green Space Patches and Implications for Management Policy. Sensors. 2017; 17(6):1304. https://doi.org/10.3390/s17061304
Chicago/Turabian StyleYu, Zhoulu, Yaohui Wang, Jinsong Deng, Zhangquan Shen, Ke Wang, Jinxia Zhu, and Muye Gan. 2017. "Dynamics of Hierarchical Urban Green Space Patches and Implications for Management Policy" Sensors 17, no. 6: 1304. https://doi.org/10.3390/s17061304
APA StyleYu, Z., Wang, Y., Deng, J., Shen, Z., Wang, K., Zhu, J., & Gan, M. (2017). Dynamics of Hierarchical Urban Green Space Patches and Implications for Management Policy. Sensors, 17(6), 1304. https://doi.org/10.3390/s17061304