Article

Uncertainty Analysis in Humidity Measurements by the Psychrometer Method

Department of Bio-industrial Mechatronics Engineering, National ChungHsing University, Taichung 40227, Taiwan
*
Author to whom correspondence should be addressed.
Sensors 2017, 17(2), 368; https://doi.org/10.3390/s17020368
Submission received: 11 December 2016 / Revised: 4 February 2017 / Accepted: 9 February 2017 / Published: 14 February 2017
(This article belongs to the Special Issue Humidity Sensors)

Abstract

:
The most common and cheap indirect technique to measure relative humidity is by using psychrometer based on a dry and a wet temperature sensor. In this study, the measurement uncertainty of relative humidity was evaluated by this indirect method with some empirical equations for calculating relative humidity. Among the six equations tested, the Penman equation had the best predictive ability for the dry bulb temperature range of 15–50 °C. At a fixed dry bulb temperature, an increase in the wet bulb depression increased the error. A new equation for the psychrometer constant was established by regression analysis. This equation can be computed by using a calculator. The average predictive error of relative humidity was <0.1% by this new equation. The measurement uncertainty of the relative humidity affected by the accuracy of dry and wet bulb temperature and the numeric values of measurement uncertainty were evaluated for various conditions. The uncertainty of wet bulb temperature was the main factor on the RH measurement uncertainty.

1. Introduction

Humidity is an important factor not only in various industries [1], but also in indoor environmental quality [2,3], in environment control processing [3], and in the assessment of heat stress, health and productivity for workers [4,5]. It affects evaporation and disease development in plants and the quality of food, chemicals and pharmaceuticals [1]. Accurate and reliable measurement of humidity is a key point for civil building [2,6] and health risks [7]. Typically, the amount of vapor contained in a moist air sample is expressed in terms of relative humidity (RH) [3].
Many sensors have been developed to measure RH. Popular commercial devices are chilled mirror hygrometers, electrical sensors and dry and wet bulb psychrometers [1,8]. The mirror hygrometer is the most accurate and it is commonly used for calibration of other instruments. Limitations of this equipment are its expense, sensitivity to contaminants and the requirement for skilled staff for its maintenance. Two types of electrical humidity sensors are resistive and capacitive sensors. Both types feature a fast response, good stability and little hysteresis [9]. The capacitive polymer sensor has a wider measurement range than the resistive type, however, the sensing elements of capacitive plates are exposed to condensation with high humidity and are then damaged. The main disadvantages of electrical sensors are that they are sensitive to contaminants, affected by ambient temperature and feature nonlinear calibration curves [9,10]. With careful calibration, the measurement uncertainty of these electrical sensors is >1.3% RH [11].
Because of the low cost and ease of use, psychrometry has been a popular method for measuring RH for a long time. This device involves a pair of electrical thermometers for measuring dry and wet bulb temperatures. The wet bulb thermometer is enclosed with a wick material that is maintained under wet conditions with distilled water. According to ISO standard 7726 [12], the wet thermometer should be ventilated at a sufficient velocity, generally at least 4 m/s to 5 m/s. In this way, the wet bulb temperature is close to the thermodynamic wet bulb temperature. The RH of air is then calculated by the dry and wet bulb temperature.
To ensure the accuracy of any humidity measurement, the factors affecting performance need to be considered. These factors include the accuracy of the two thermometers, the wind speed passing over the thermometers, the maintenance of the wetted condition for the wick materials surrounding the wet bulb thermometer, the care in shielding both sensors from radiation [13] and the selection of calculation equations. The choice of thermometers and maintenance of wet bulb conditions are the basic needs for measurements. However, the effect of calculation equations on RH needs to be studied. The measurement uncertainty of RH by the psychrometer method needs to be evaluated.
The calculation of RH by using dry and wet bulb temperature can be traced with thermodynamic theory. Theoretical formulas were proposed by ASHRAE [14,15]. These equations are derived from thermodynamic reasoning involving complex iterative calculation and require computer software for their calculation. Singh et al. [16] proposed a numerical calculation of psychrometric properties with a calculator, but the calculation of RH with dry and wet bulb temperature was still complex. Bahadori et al. [17] proposed a predictive tool to estimate RH using dry and wet bulb temperature that could be easily applied by an engineer without extensive mathematical ability. However, the equations still needed to be solved by iterative calculation.
Harrison and Wood [18] evaluated the effect of wind speed passing over the wet bulb temperature on the error sources of the humidity measurement and recommended that 2 m wind speeds should be >3 m/s. Ustymczuk and Giner [19] studied the effect of the performance of temperature sensors on the RH error and found that error increased linearly with increasing RH and decreased exponentially with increasing dry bulb temperature. The atmospheric pressure had only a slight effect on error. Mathioulakis et al. [20] demonstrated an evaluation method to calculate measurement uncertainties with indirect humidity measurement. Because of the strong non-linear characteristic of these calculation equations, the authors suggested using the Monte Carlo simulation for evaluation. Some empirical equations have been proposed to simplify the calculation of RH with dry and wet bulb temperature [21,22,23,24,25,26,27].
The RH value calculated with dry and wet bulb temperatures is called the indirect measurement. The difference between the actual and indirect measurement RH is defined as the error. Error is an idealized parameter, and the quantifying factors that affect it are difficult to determine. The measurement uncertainty was defined first in the ISO Guide [28]. The evaluation method has been described in detail [28,29,30]. According the ISO GUM, the measurement uncertainty was divided into A (by statistical method) and B type (by other information). The difference in error and uncertainty was defined clearly. The advantages of measurement uncertainty included the identification of the dispersion of results, estimated with a statistical method and quantification of the contribution of the uncertainty sources.
In this study, the predictive performance of these empirical equations was compared. The psychrometer coefficient of the empirical equation was calculated by an inverse technique. The relationship between this coefficient and dry and wet bulb temperatures was then established by regression analysis. The validity of the new empirical equation is reported. The ISO GUM concept was used to study the effect of the uncertainty of dry bulb temperature (Td) and wet bulb temperature (Tw) on the measurement uncertainty of RH.

2. Theoretical Background

Equations for Determining Psychrometric Constant

The empirical equation for calculating RH with dry and wet bulb temperatures is as follows:
Pw = Pws(Tw) − A × P × (Td − Tw)
where Pw is the partial pressure of water vapor in air in kPa, Pws(Tw) is the saturation vapor pressure of water at temperature Tw in kPa, Td is the dry bulb temperature in °C, Tw is the wet bulb temperature in °C, P is the standard atmosphere pressure in kPa, and A is the psychrometer coefficient in °C−1·kPa−1. The difference between Td and Tw is called wet bulb depression.
RH is calculated as follows:
RH = Pw/Pws (Td) × 100%
where RH is the relative humidity, and Pws (Td) is the saturation vapor pressure of water at temperature Td in kPa.
For calculating Pws, a simple equation was used with a the range of 0–100 °C [14]:
P ws = 0.61078 × Exp [ 17.2694 T T   +   237.3 ]
where T is the air temperature in °C.
The standard atmosphere pressure P is considered in this study [6]:
P = 101.325 kPa
Equation (1) then could be expressed as follows:
Pw = Pws (Tw) − As × (Td − Tw)
where As is the psychrometer constant in standard atmosphere pressure in °C−1.
Some empirical equations have been proposed [21,22,23,24,25,26,27]. The Sensiron recommended the As value in the range of 6.4 × 10⁻⁴ to 6.8 × 10⁻⁶ °C−1 [12,21]. Other equations are listed as Table 1.
To evaluate the predictive performance of the above equations, the predictive error of empirical equations is defined as follows:
E = RHsta − RHcal
where E is the predictive error of the empirical equation in a percentage, RHsta is the RH value calculated from the ASHRAE formula, and RHcal is the RH value calculated from these empirical equations.
Besides the minimum and maximum E values, Emax and Emin, a statistic | E | ave is defined as a criterion for evaluating the predictive ability:
| E | ave = | E | / n
where | E | is the absolute value of E, and n is the number of data.
To establish the new RHcal equation, the psychrometer efficient at standard atmosphere is defined as As. As was determined by rearranging Equations (1) and (2) as follows:
A s = Pws ( T w )   P W T d T ω
The calculation of As by Equation (8) was called the inverse technique. The evaluation of the measurement uncertainty is listed in Appendix A.

3. Materials and Methods
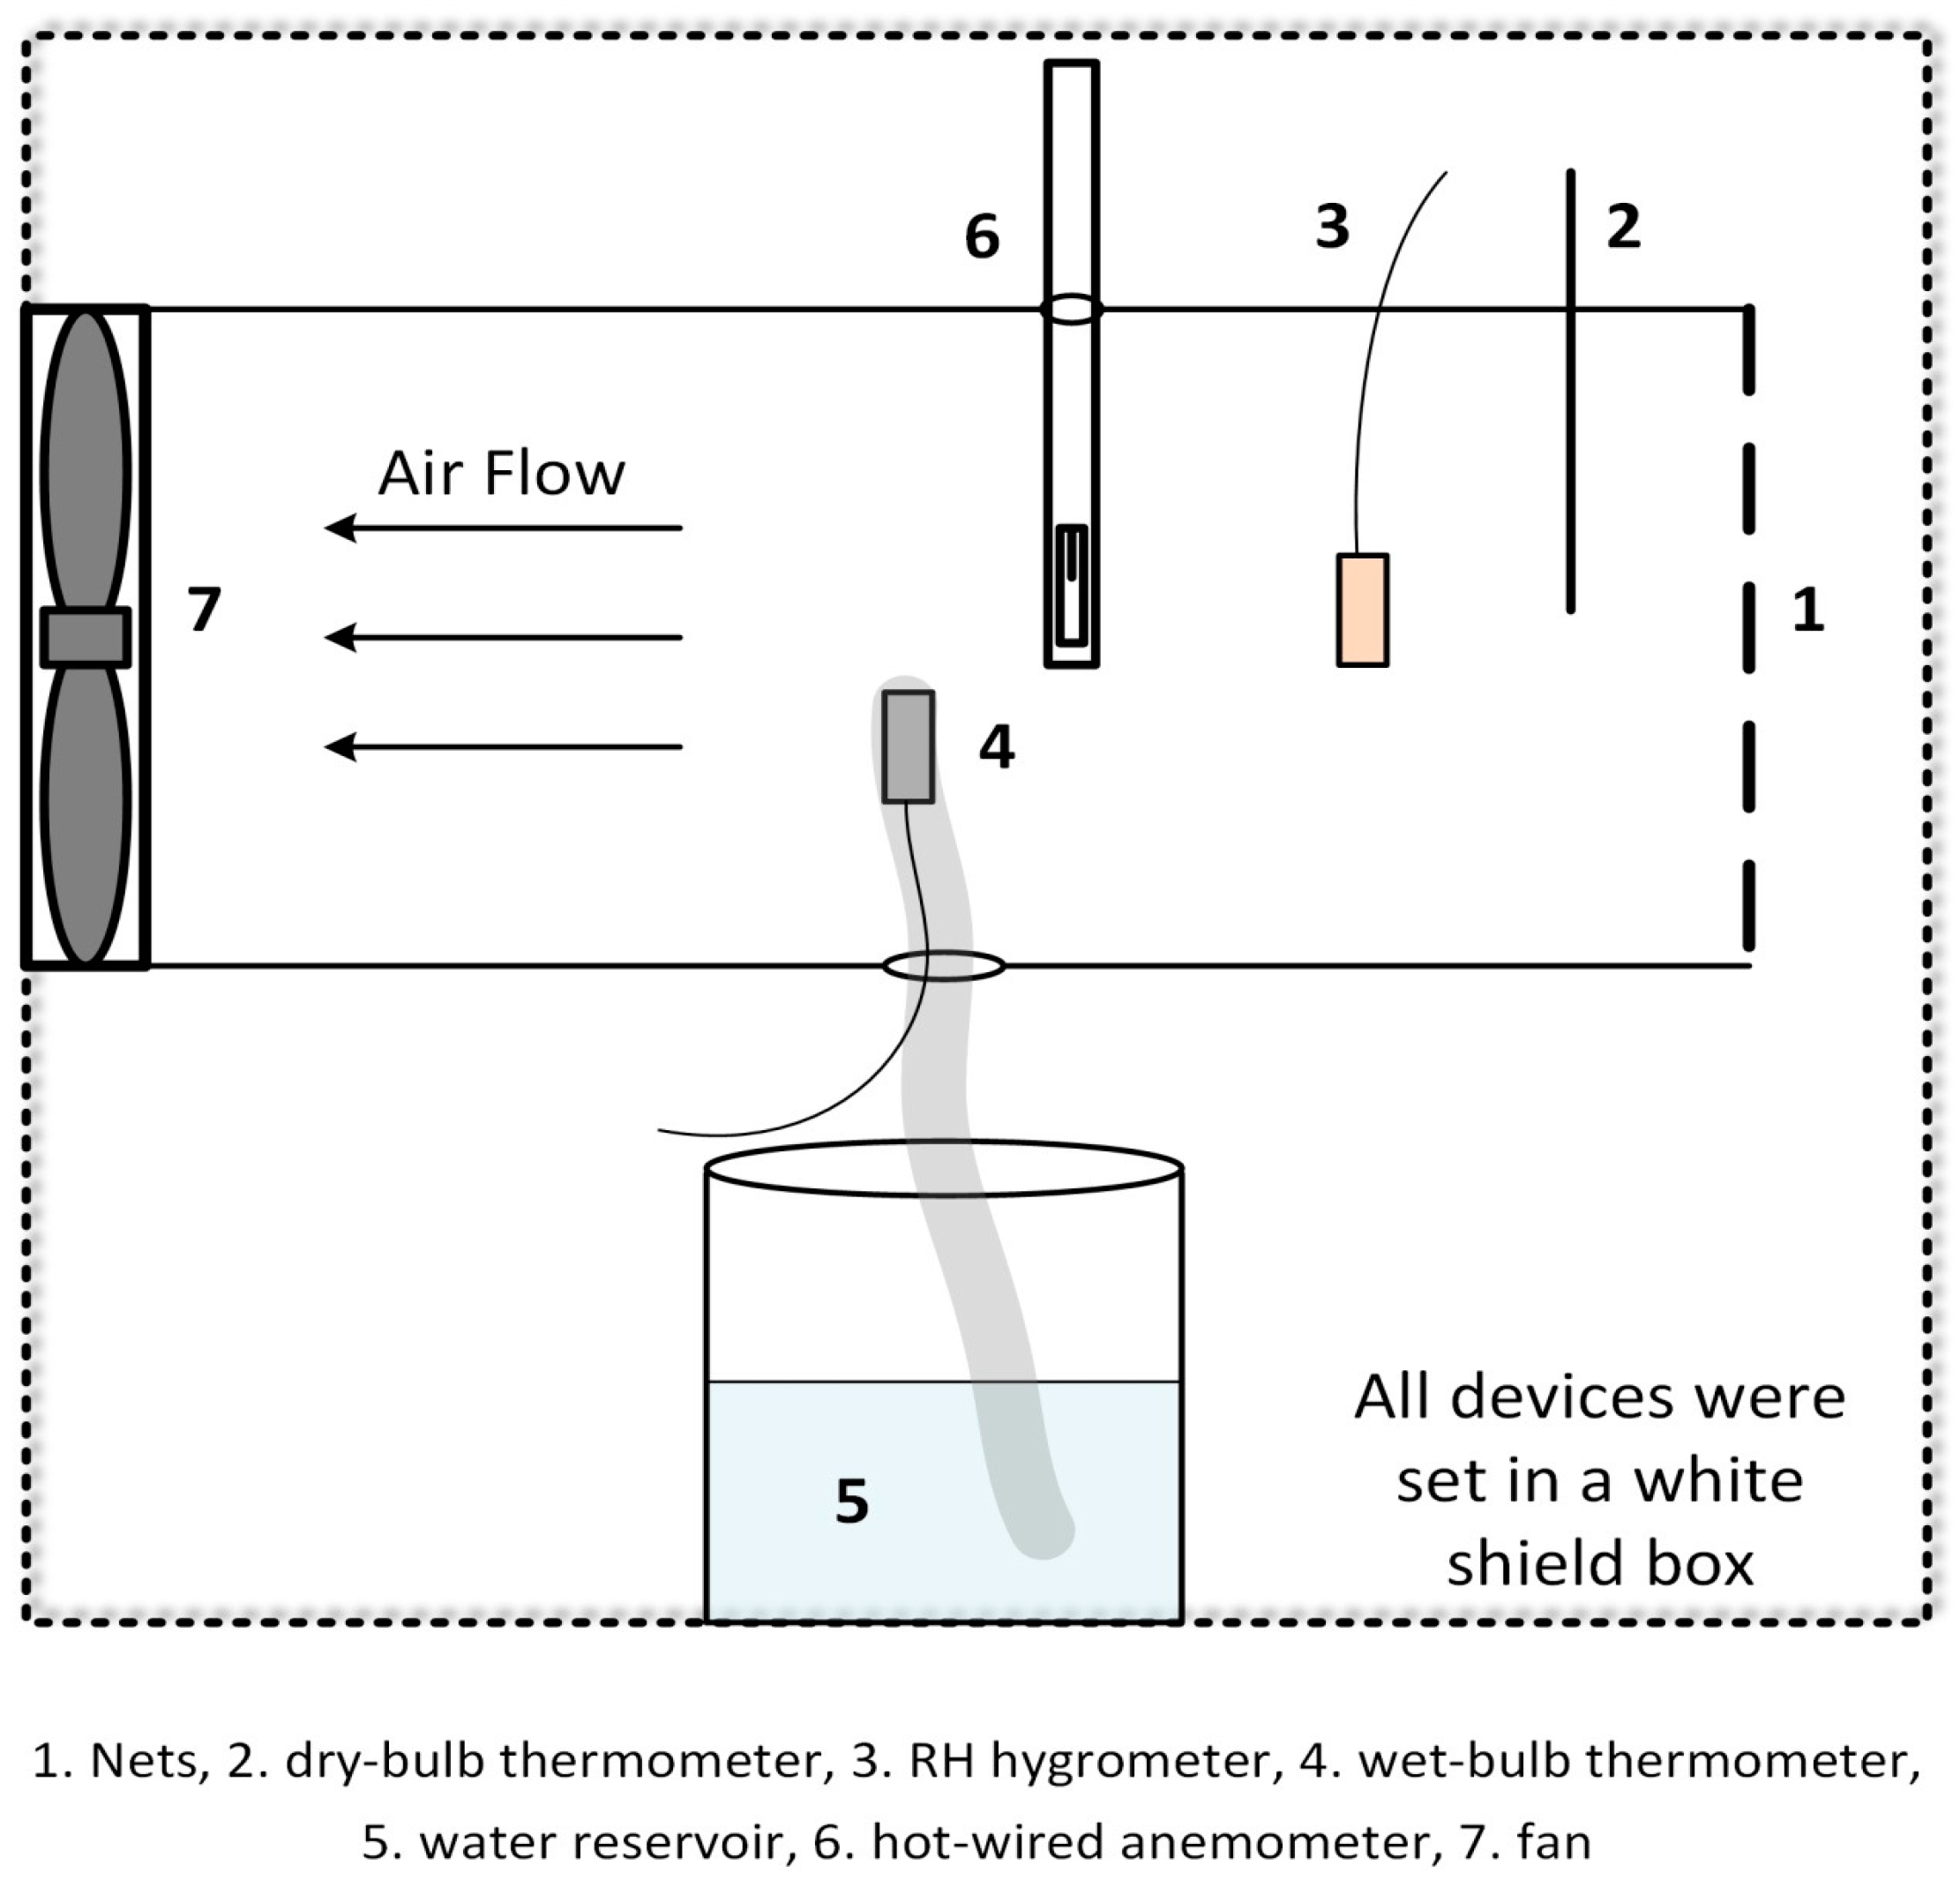
3.1. Equipment

The effect of air velocity on the measurement of wet bulb temperature was used as an example. The schematic of the experimental device is shown in Figure 1. The air was sucked into a wind tunnel by use of an adjustable fan. Two thermometers were used to measure the dry and wet bulb temperatures. The wet condition of the wet bulb thermometer was maintained with a wick and water reservoir. A resistant hygrometer served as the standard for RH measurement.
The air velocities were measured at several points to ensure the flow turbulence. Nets were used to filter particles and favoring the turbulence. The air velocity was adjusted by adjusting the fan speed. Air velocity was measured near the wet bulb thermometer by a hot-wired anemometer. A cotton wick 5 cm in length was attached to the wet bulb thermometer to maintain sufficient water to cool the sensor during aspiration. The measuring box was regularly maintained for each test. The wick must be clean and the de-ionized water was used as reservoir.

3.2. Sensors

The temperature was measured with use of the Sentron D9 temperature transmitter (Sentron Co., Taipei, Taiwan). This transmitter contains a Pt100 element. The error of this thermometer was 0.15 °C after calibration.
The RH was measured using a THT-B121 resistive transmitter (Shinyei Kalsha, Tokyo, Japan). The error of this RH sensor was 0.5% RH after calibration with several saturated salt solutions.
The air velocity passing over the wet-bulb thermometer was detected by use of the KANOMAX Hot-wired 6004 Anemometer (Kanomax USA, Andover, NJ, USA). The error was ±5% according to the manufacturer’s specifications.

3.3. Experimental Method

The experiment was performed in the laboratory. During the test, the air velocity was adjusted from 0 to 5 m/s. At each air velocity, the reading values of Td, Tw, RH and wind velocity were recorded by use of a data logger (Delta-T, Cambridge, UK). The sampling frequency was 1 s until the reading values of Tw were stable. There were three measurements for each wind velocity. The actual Tw value was calculated with the measurement values of Td and RH.

4. Results

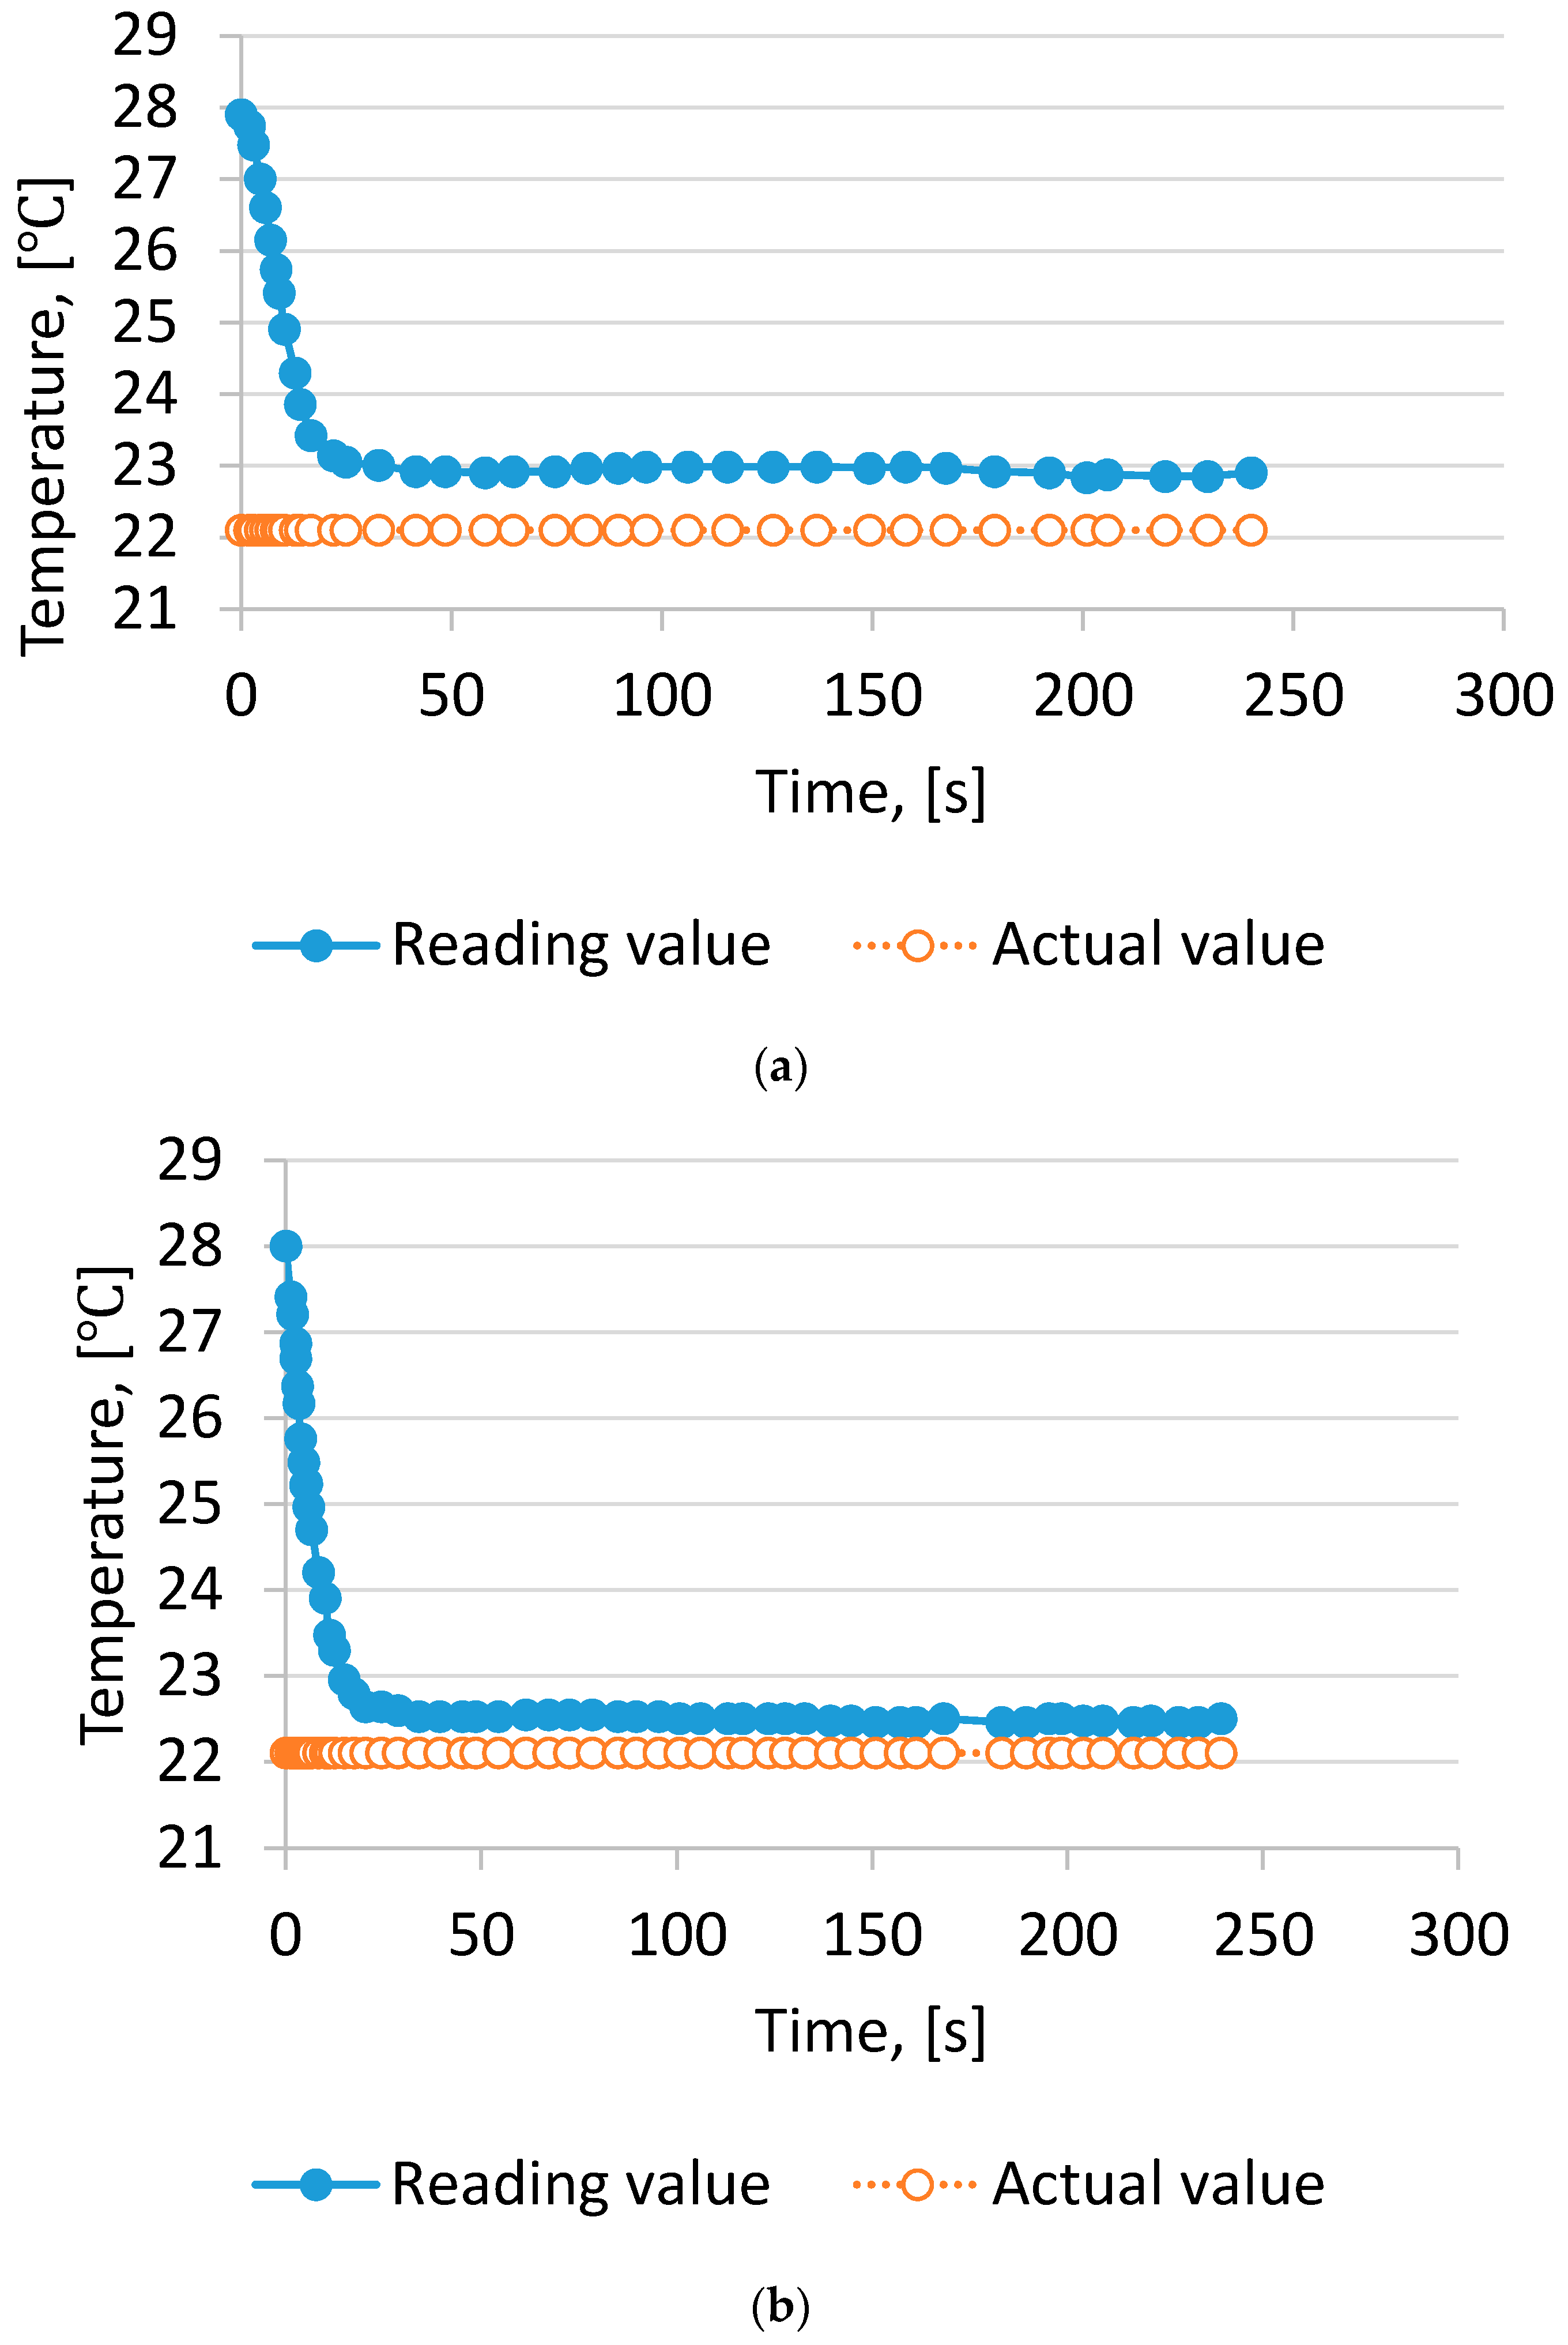
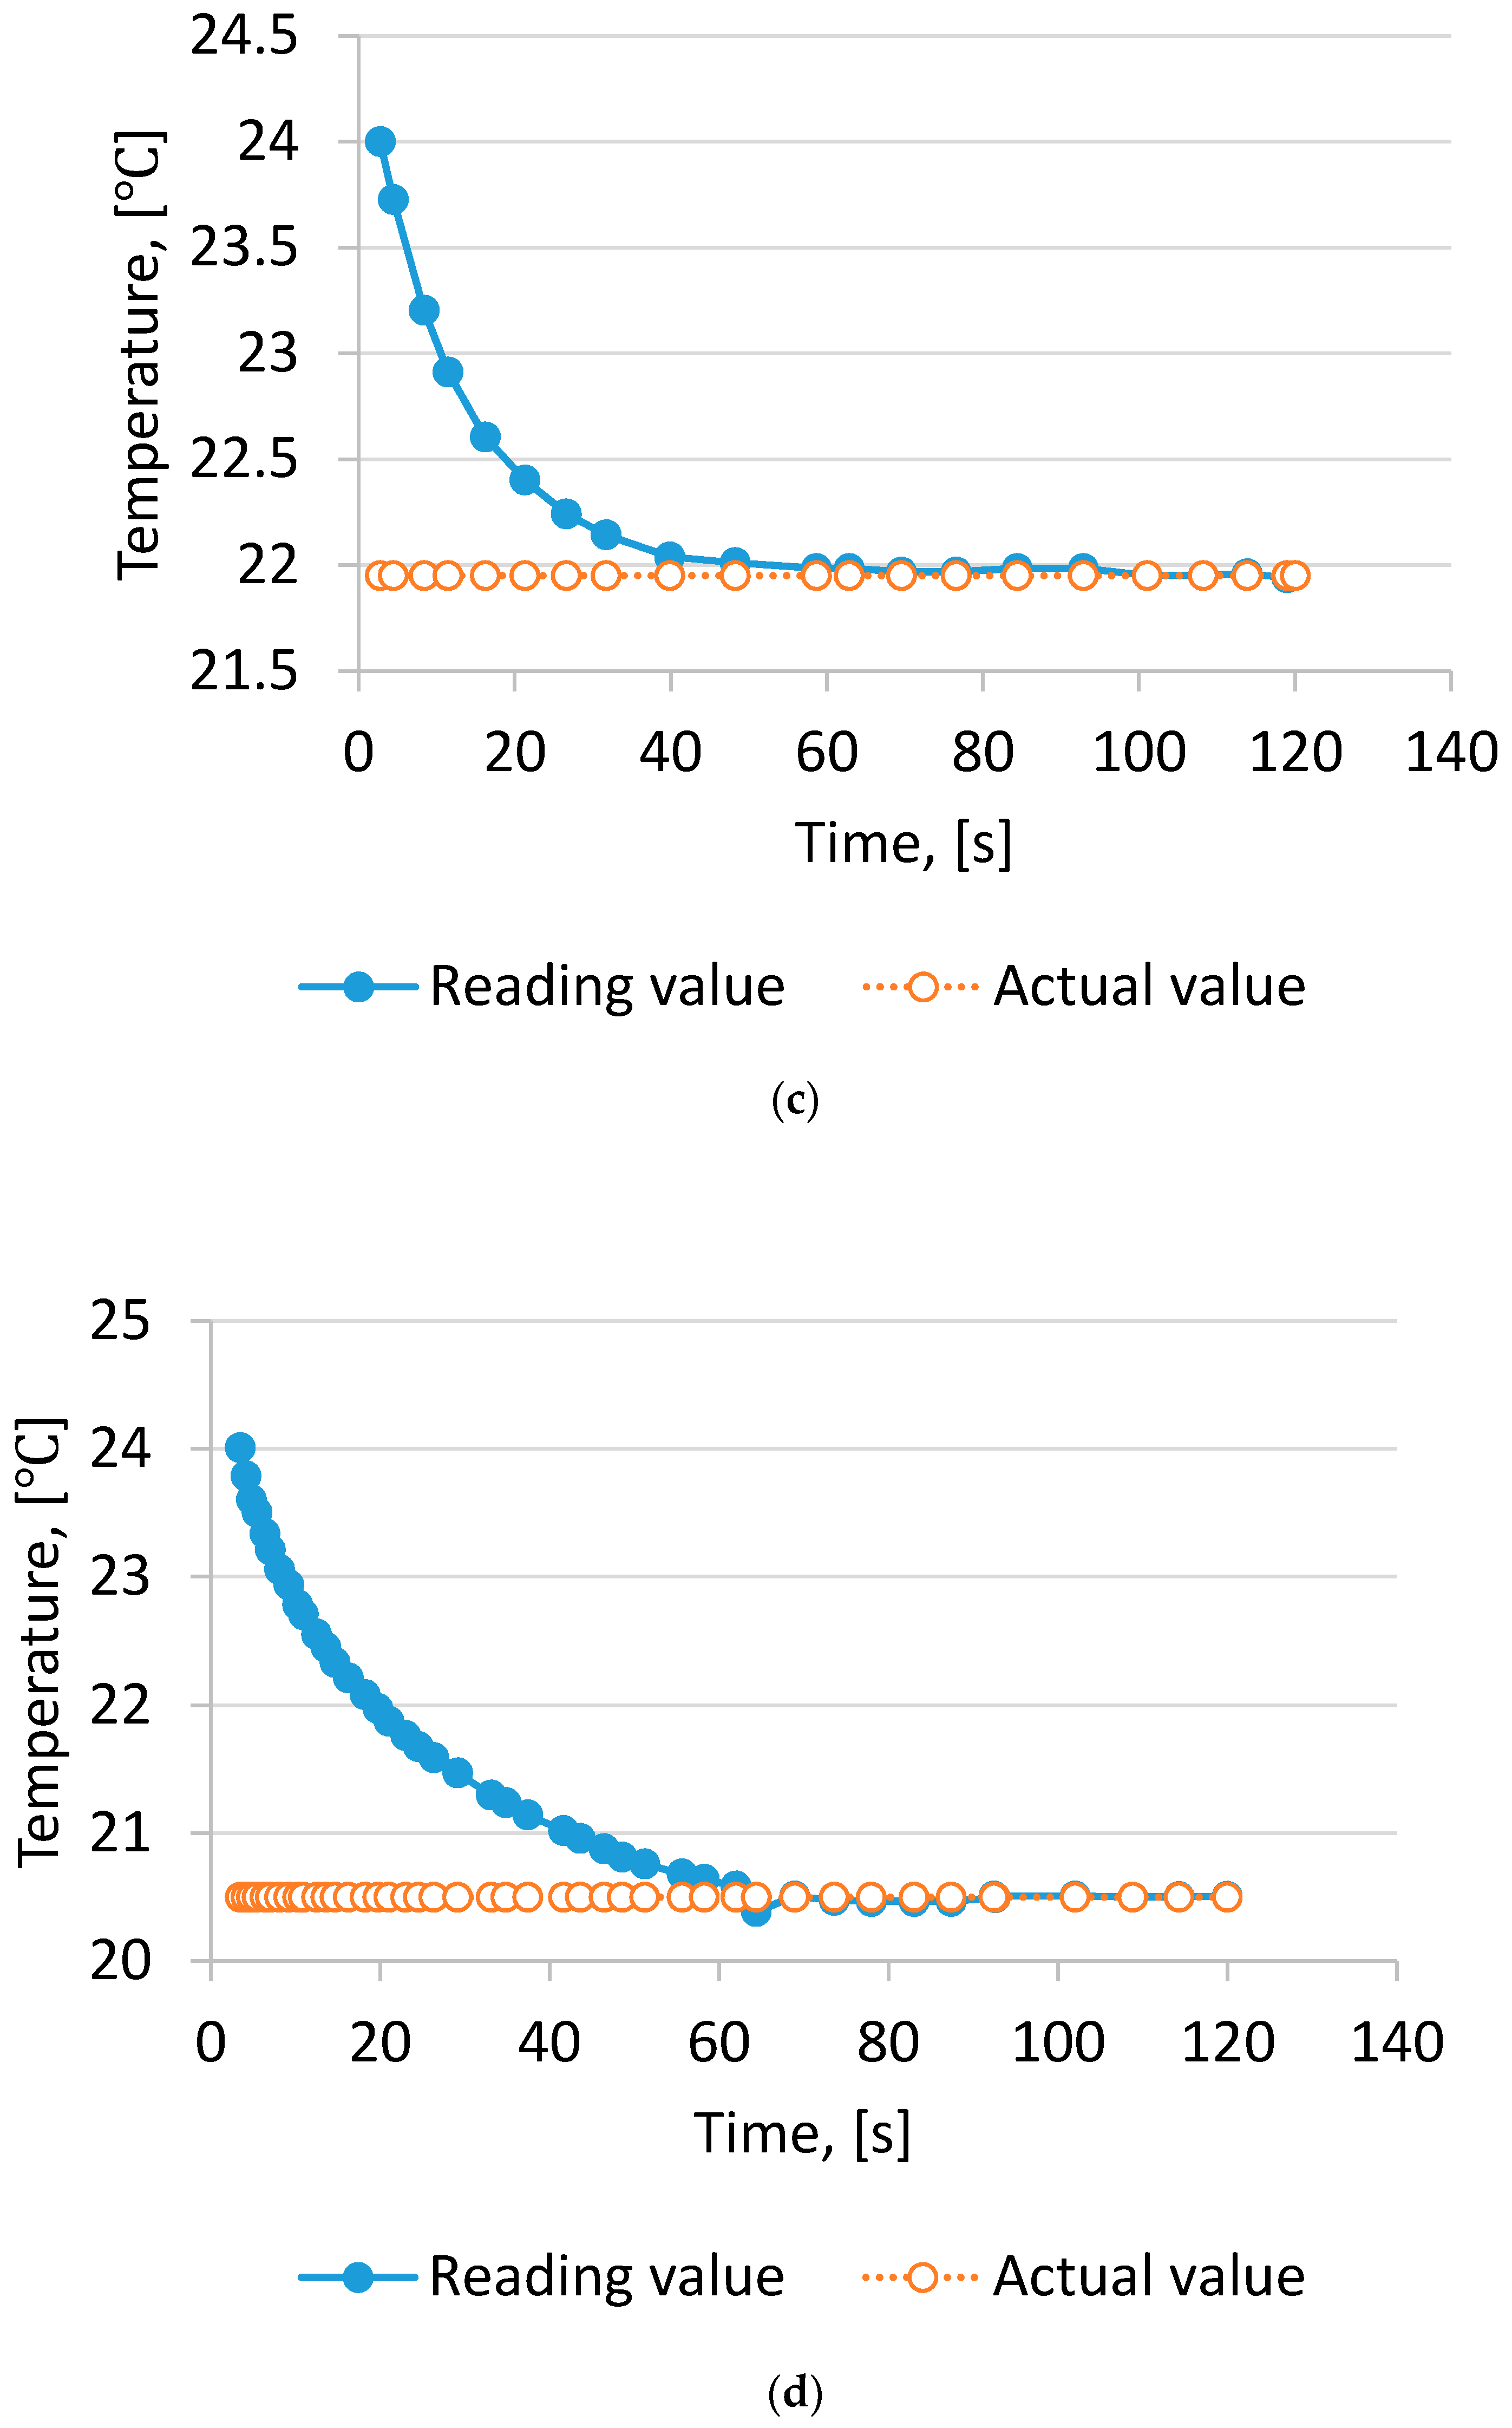
4.1. Effect of Air Velocity on Tw

The effect of the air velocity on Tw measurement is shown in Figure 2. With 1.0 m/s, the deviation between reading values and actual values calculated by RH measurement of Tw was close to 0.8 °C.
The result could be explained by the lower air velocity passing the wet-bulb thermometer, the difference being due to the fact that Tw is not a thermodynamic quantity but only an indicator of the thermodynamic wet bulb temperature [15]. On increasing the air velocity to 2.0 m/s, the difference ranged from 0.3 °C to 0.4 °C. If the air velocity was >3.0 m/s, the measurement Tw was close to the actual value. The result was similar to findings by Harrison and Wood [18].
The error sources of the Tw measurement include the thermometer performance and the velocity of the air passing the wet bulb thermometer. The combined errors in this study ranged from 0.15 °C to 0.9 °C. If other factors were involved, the errors of Tw measurement may range from 0.2 °C to 1.0 °C. According to the study of Barber and Gu [31] ±0.5 °C was a common error for an aspirated psychrometer.

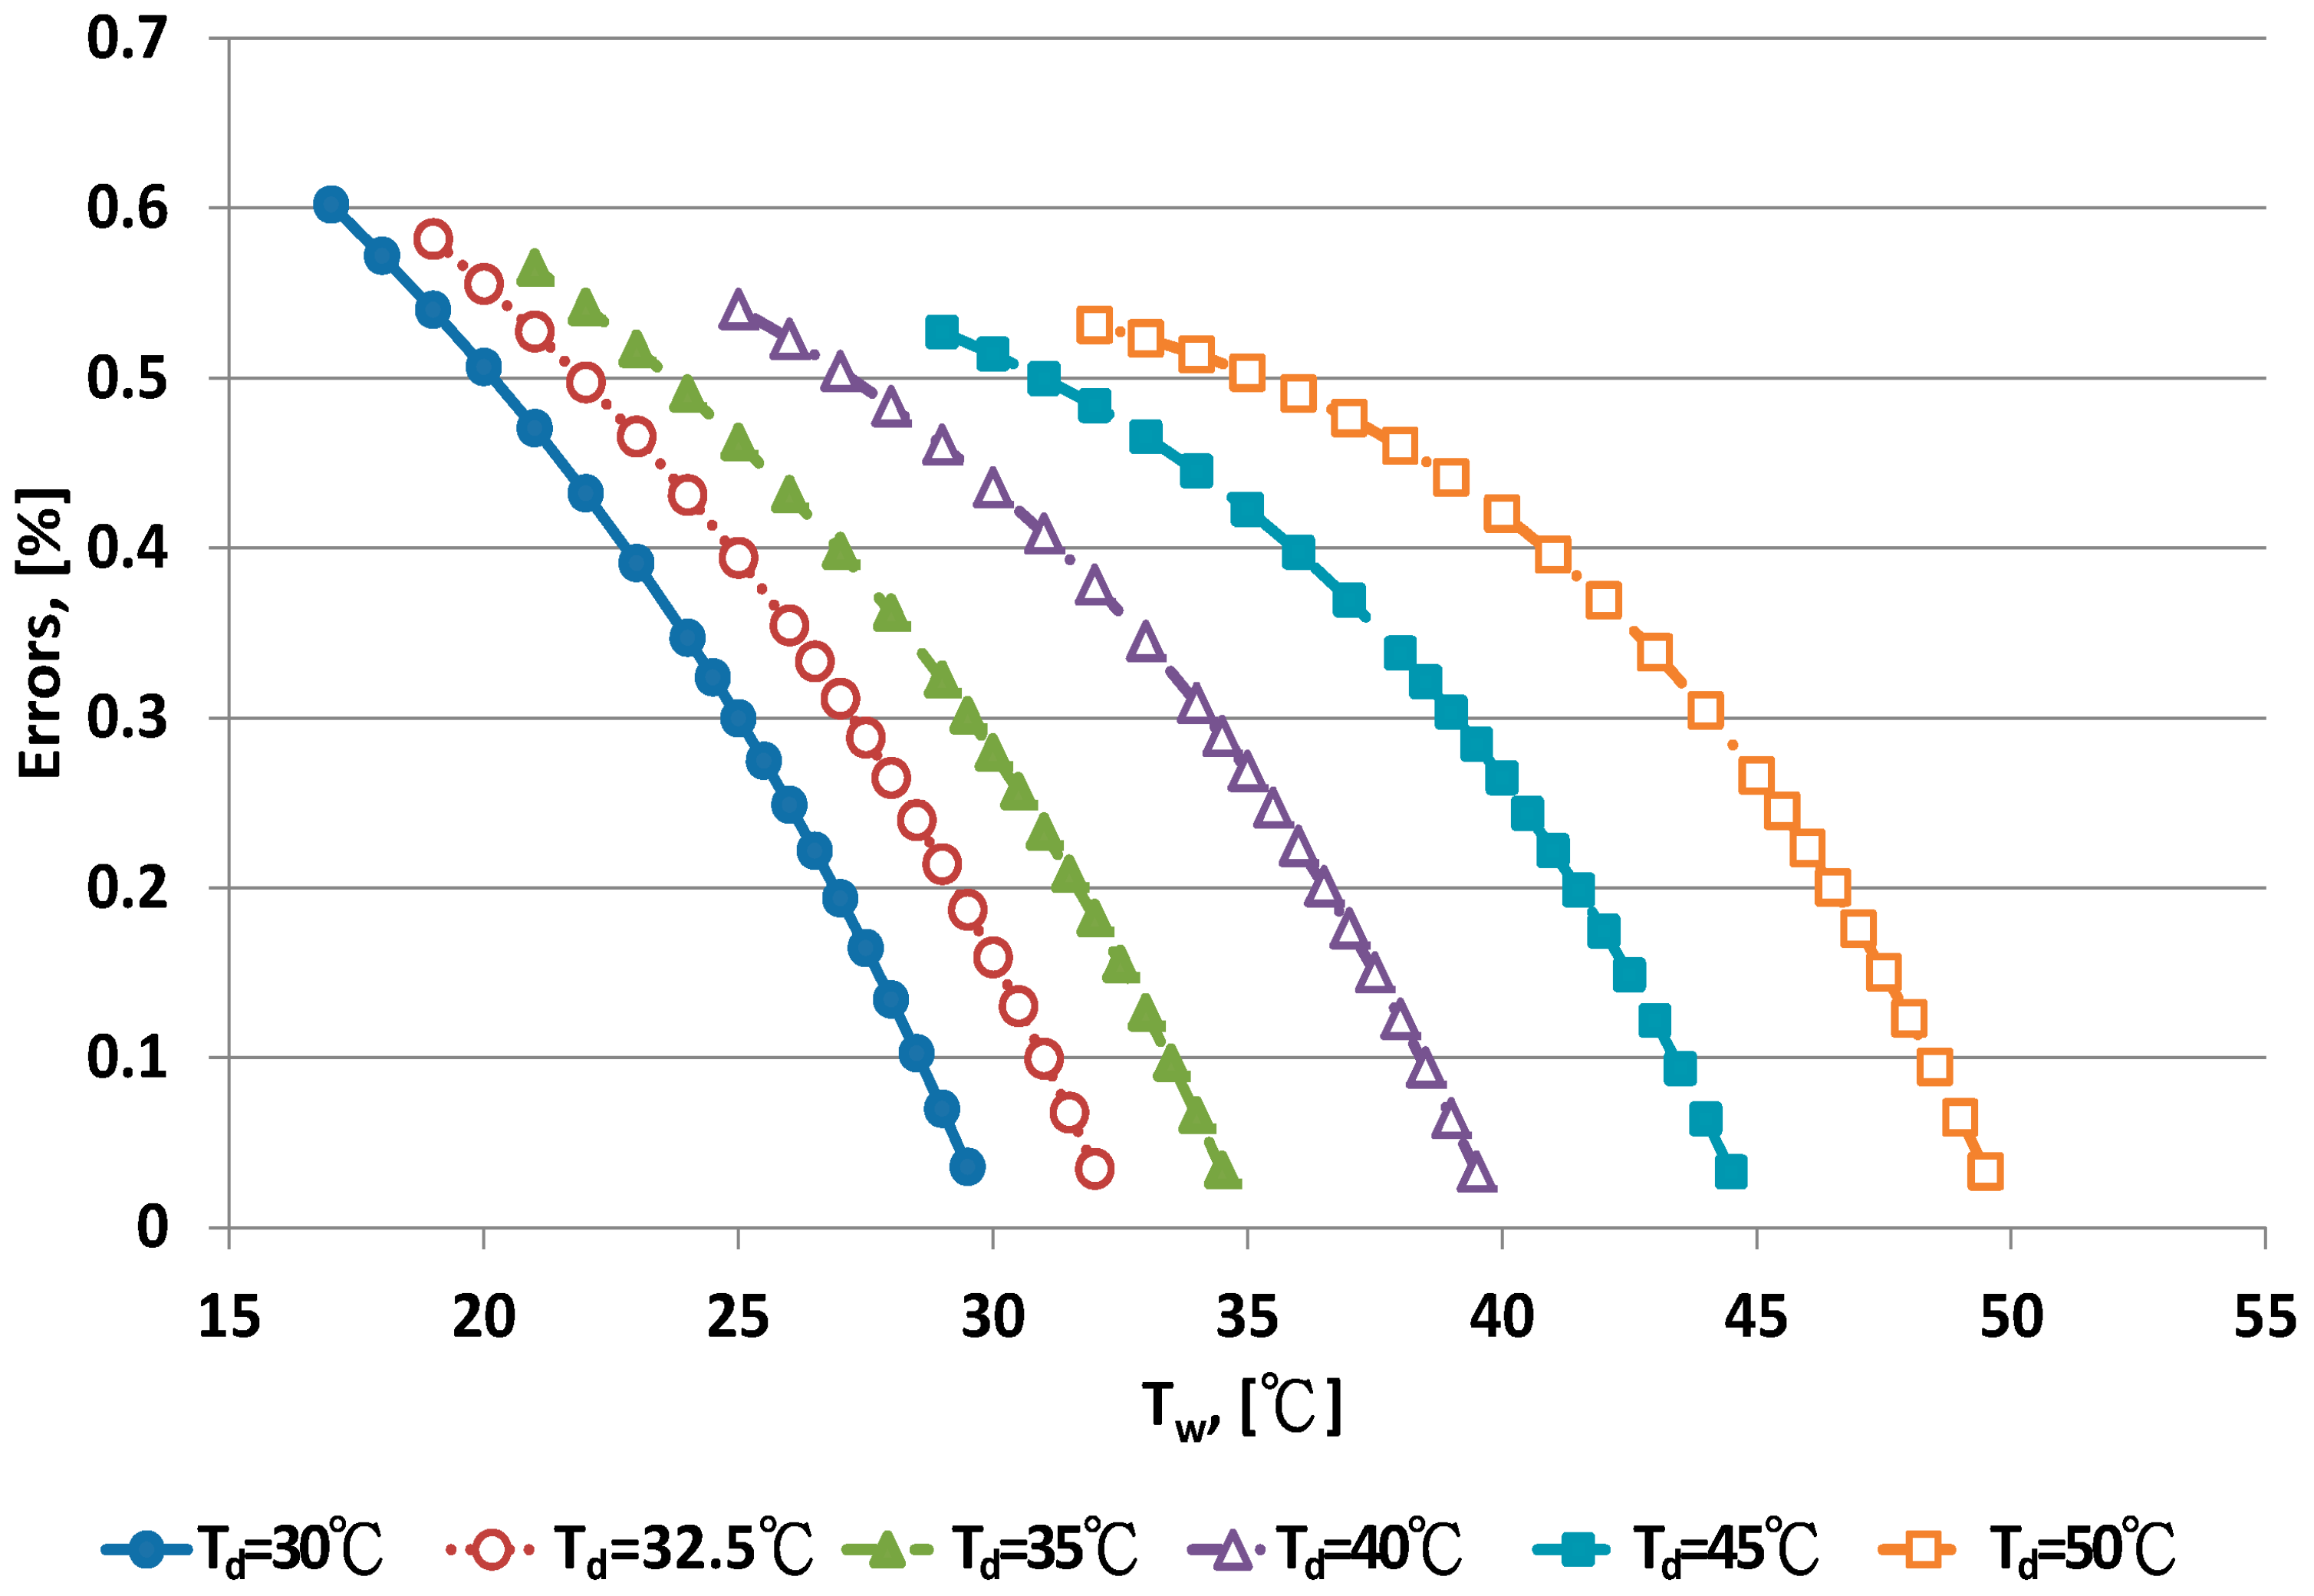
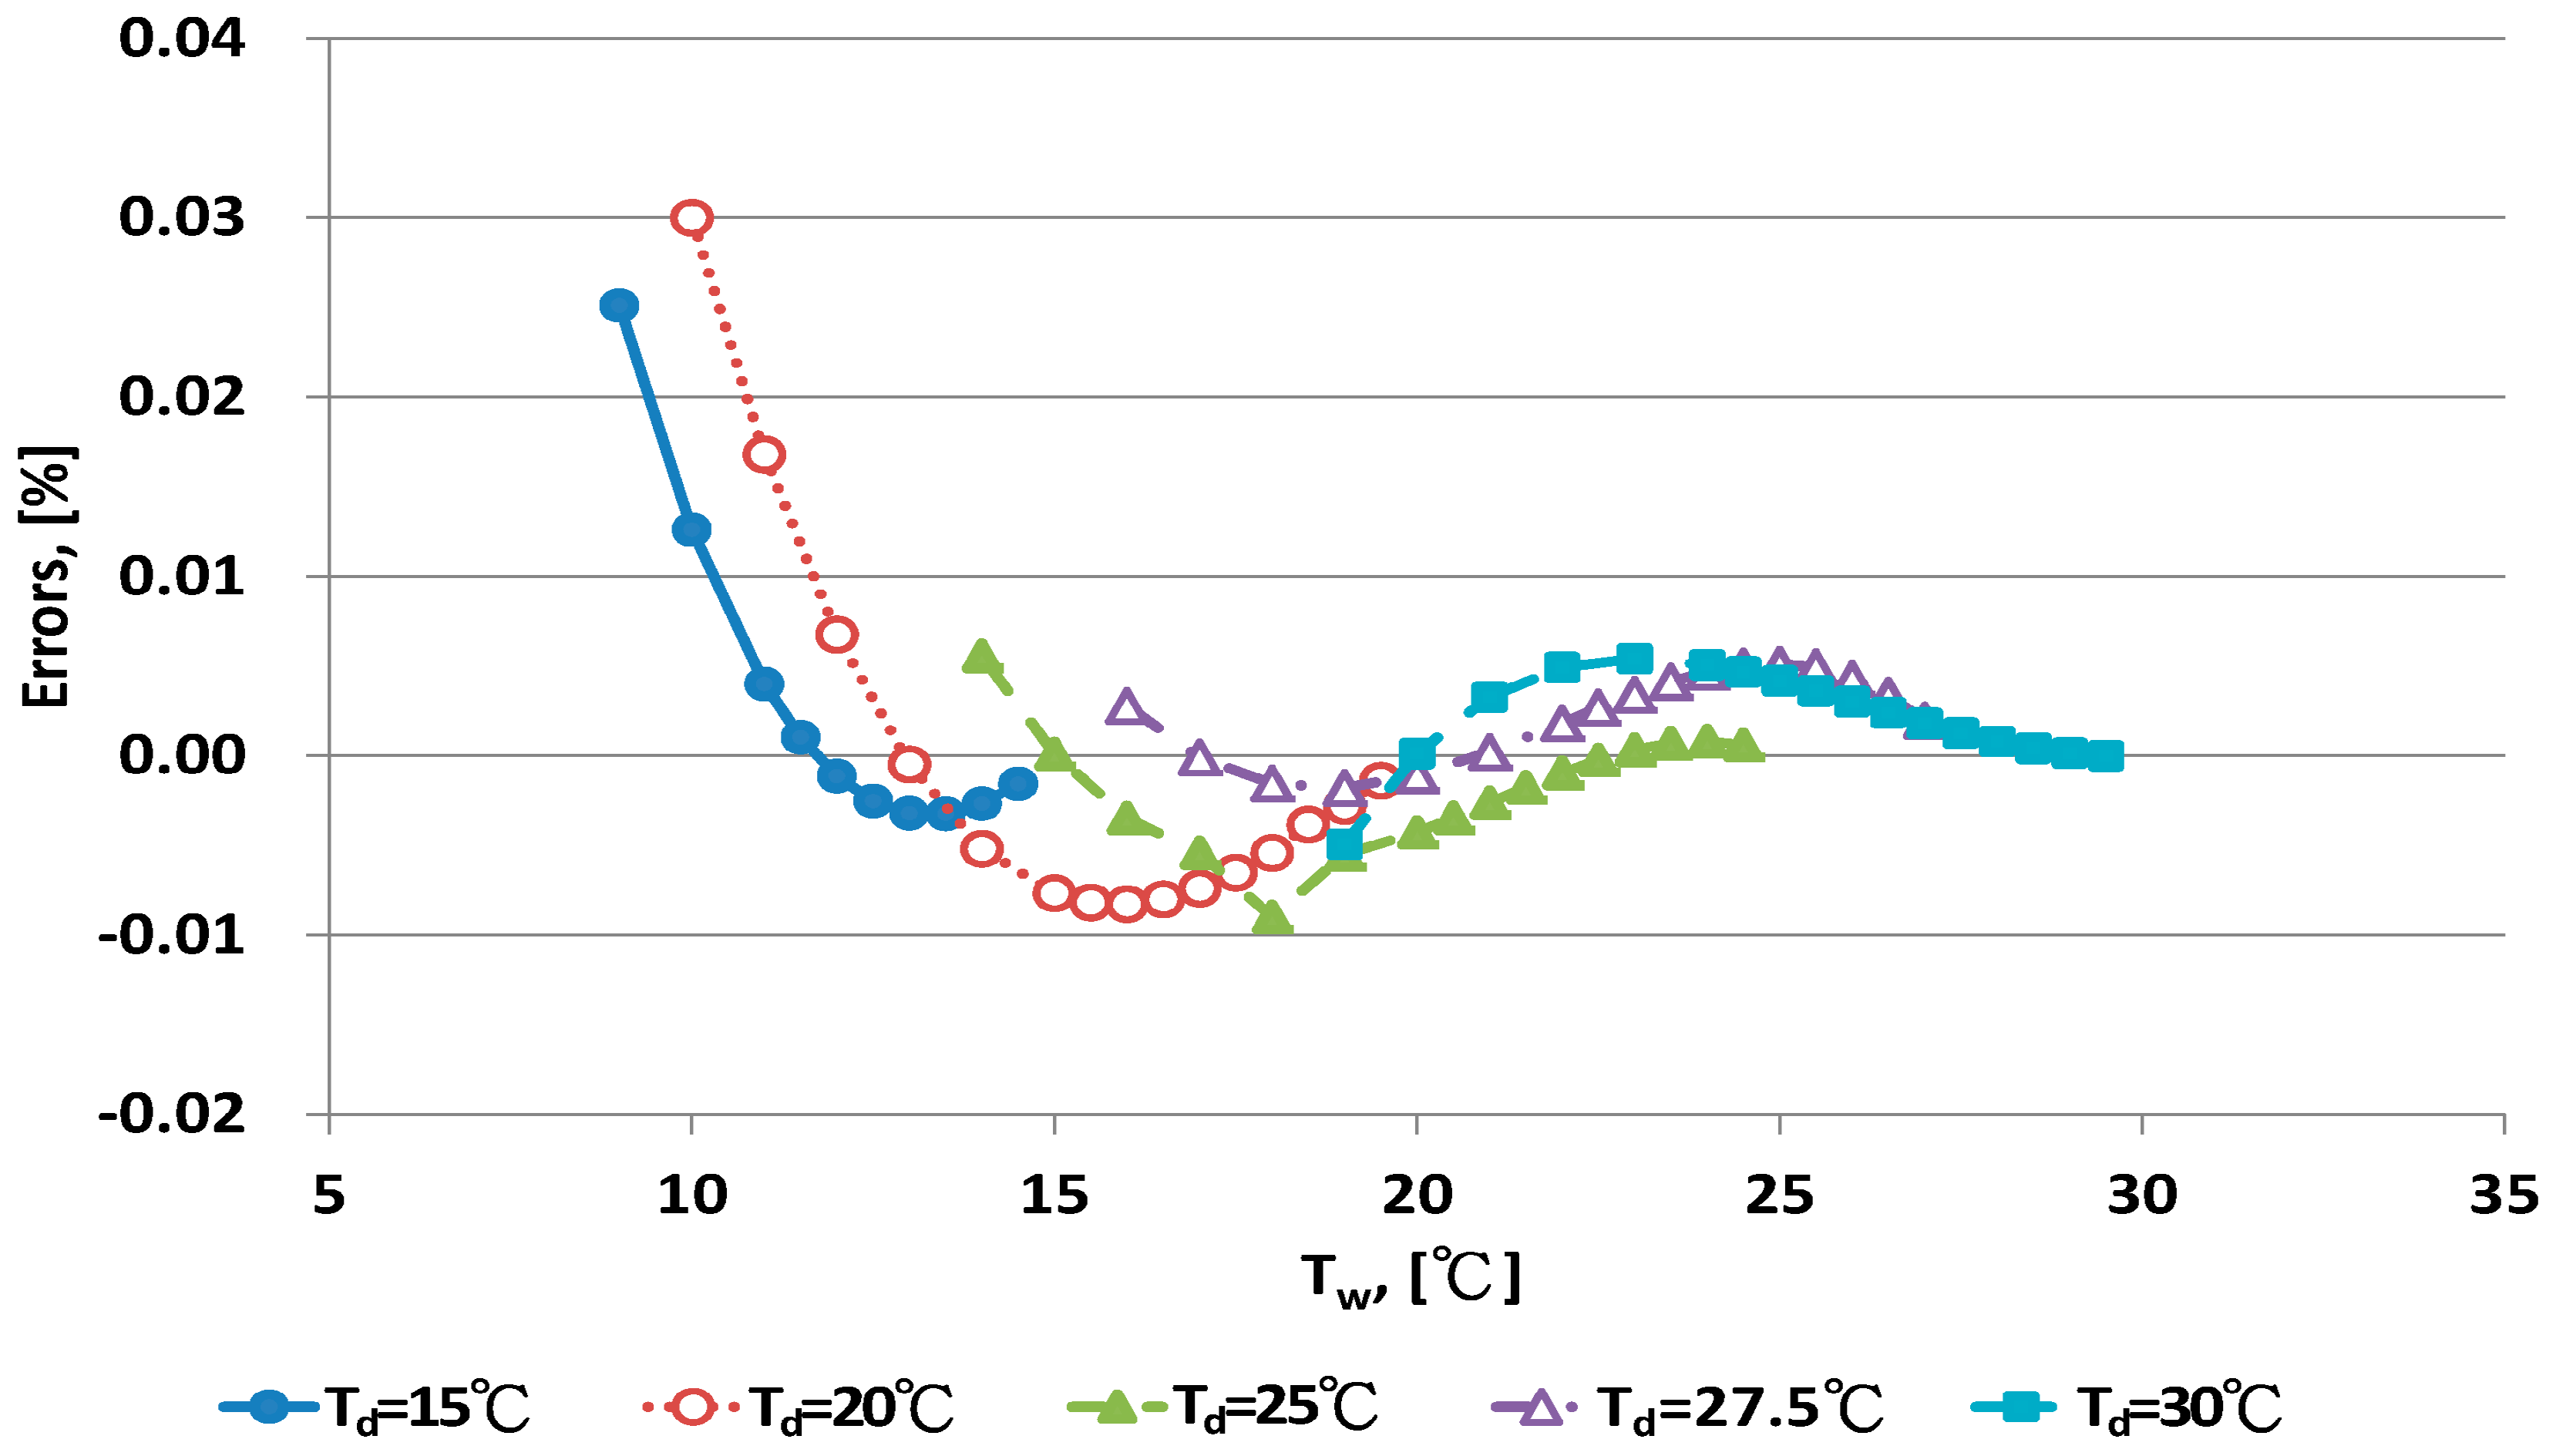
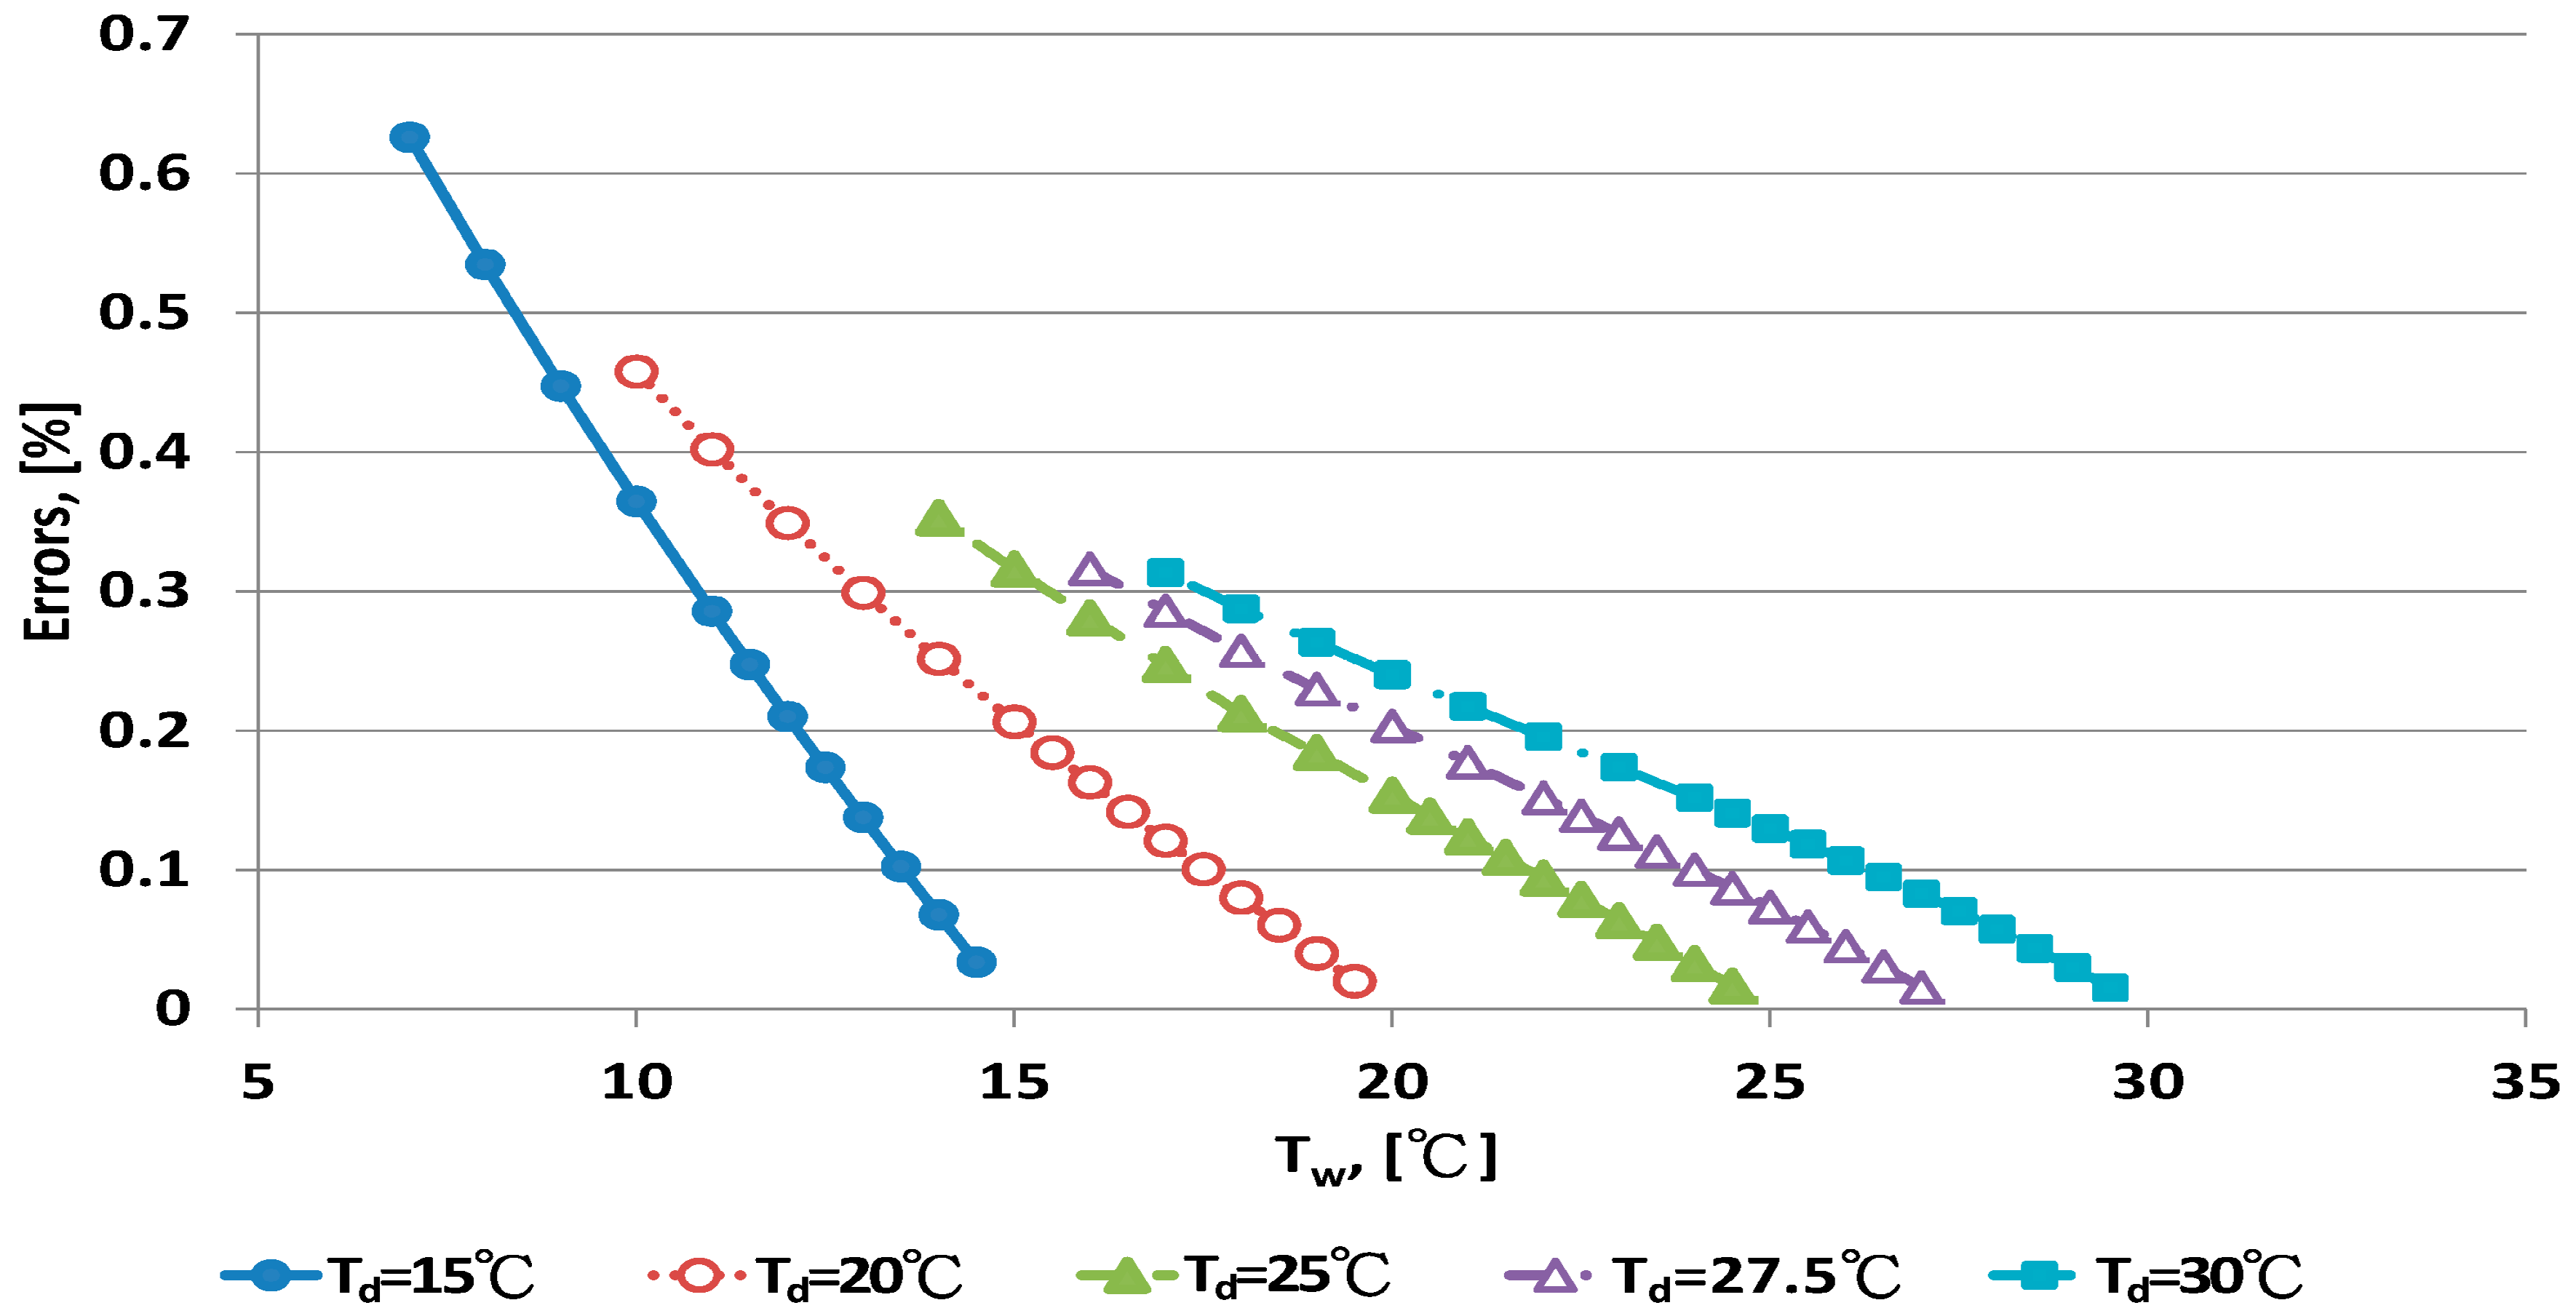
4.2. Comparison of Predictive Performance of Six Empirical Equations

The criteria for comparing the predictive performance of six empirical equations are given in Table 2. The | E | ave was used to evaluate predictive performance. Emax and Emin show range of errors. From numerical values in Table 2, the Neiva et al. equation had the largest values for Emax, Emin and | E | ave., so it was not adequate for RH calculation.
As values for three equations, Penman, BUT and Goff-Cratch, were constant. The criteria for predictive errors was higher for the Goff-Cratch equation than for the Penman and BUT equations. In the case of the Penman and BUT equations, the As value was 0.664 and 0.666 °C−1, respectively. Numeric values for As for the two equations were close. However, the criteria for predictive performance differed. The Penman equation had better performance than the BUT equation. The result indicated the sensitivity of the As value for the predictive performance of RH equations.
The As for three equations, Harrison, WMO and Neiva et al., all involved a linear relationship with Tw value. Emin was larger for the WMO than the Harrison equation for Td < 40 °C, and | E | ave values were smaller for the WMO than the Harrison equation for all 10 dry bulb temperatures. The Penman equation had the smallest values for Emin, Emax and | E | ave. Therefore, the Penman equation had the best predictive performance among the six empirical equations.
The error distribution of the Penman equation with 10 dry bulb temperatures is shown in Figure 3 and Figure 4. Error increased with decreasing wet bulb temperature at fixed dry bulb temperature. The data distribution of errors was curved. When the wet bulb temperature was close to the dry bulb temperature, that is, when RH increased to saturation, the predicted error decreased.
The Penman equation had better predictive ability at high than low RH. The limitation of electrical sensors is poor performance with high RH. The psychrometer method can be used for high RH measurement. The error distribution for the WMO equations under dry bulb temperatures is shown in Figure 5 and Figure 6. When the wet bulb temperature was near the dry bulb temperature, errors decreased. The error distribution patterns were similar to those for the Penman equation.

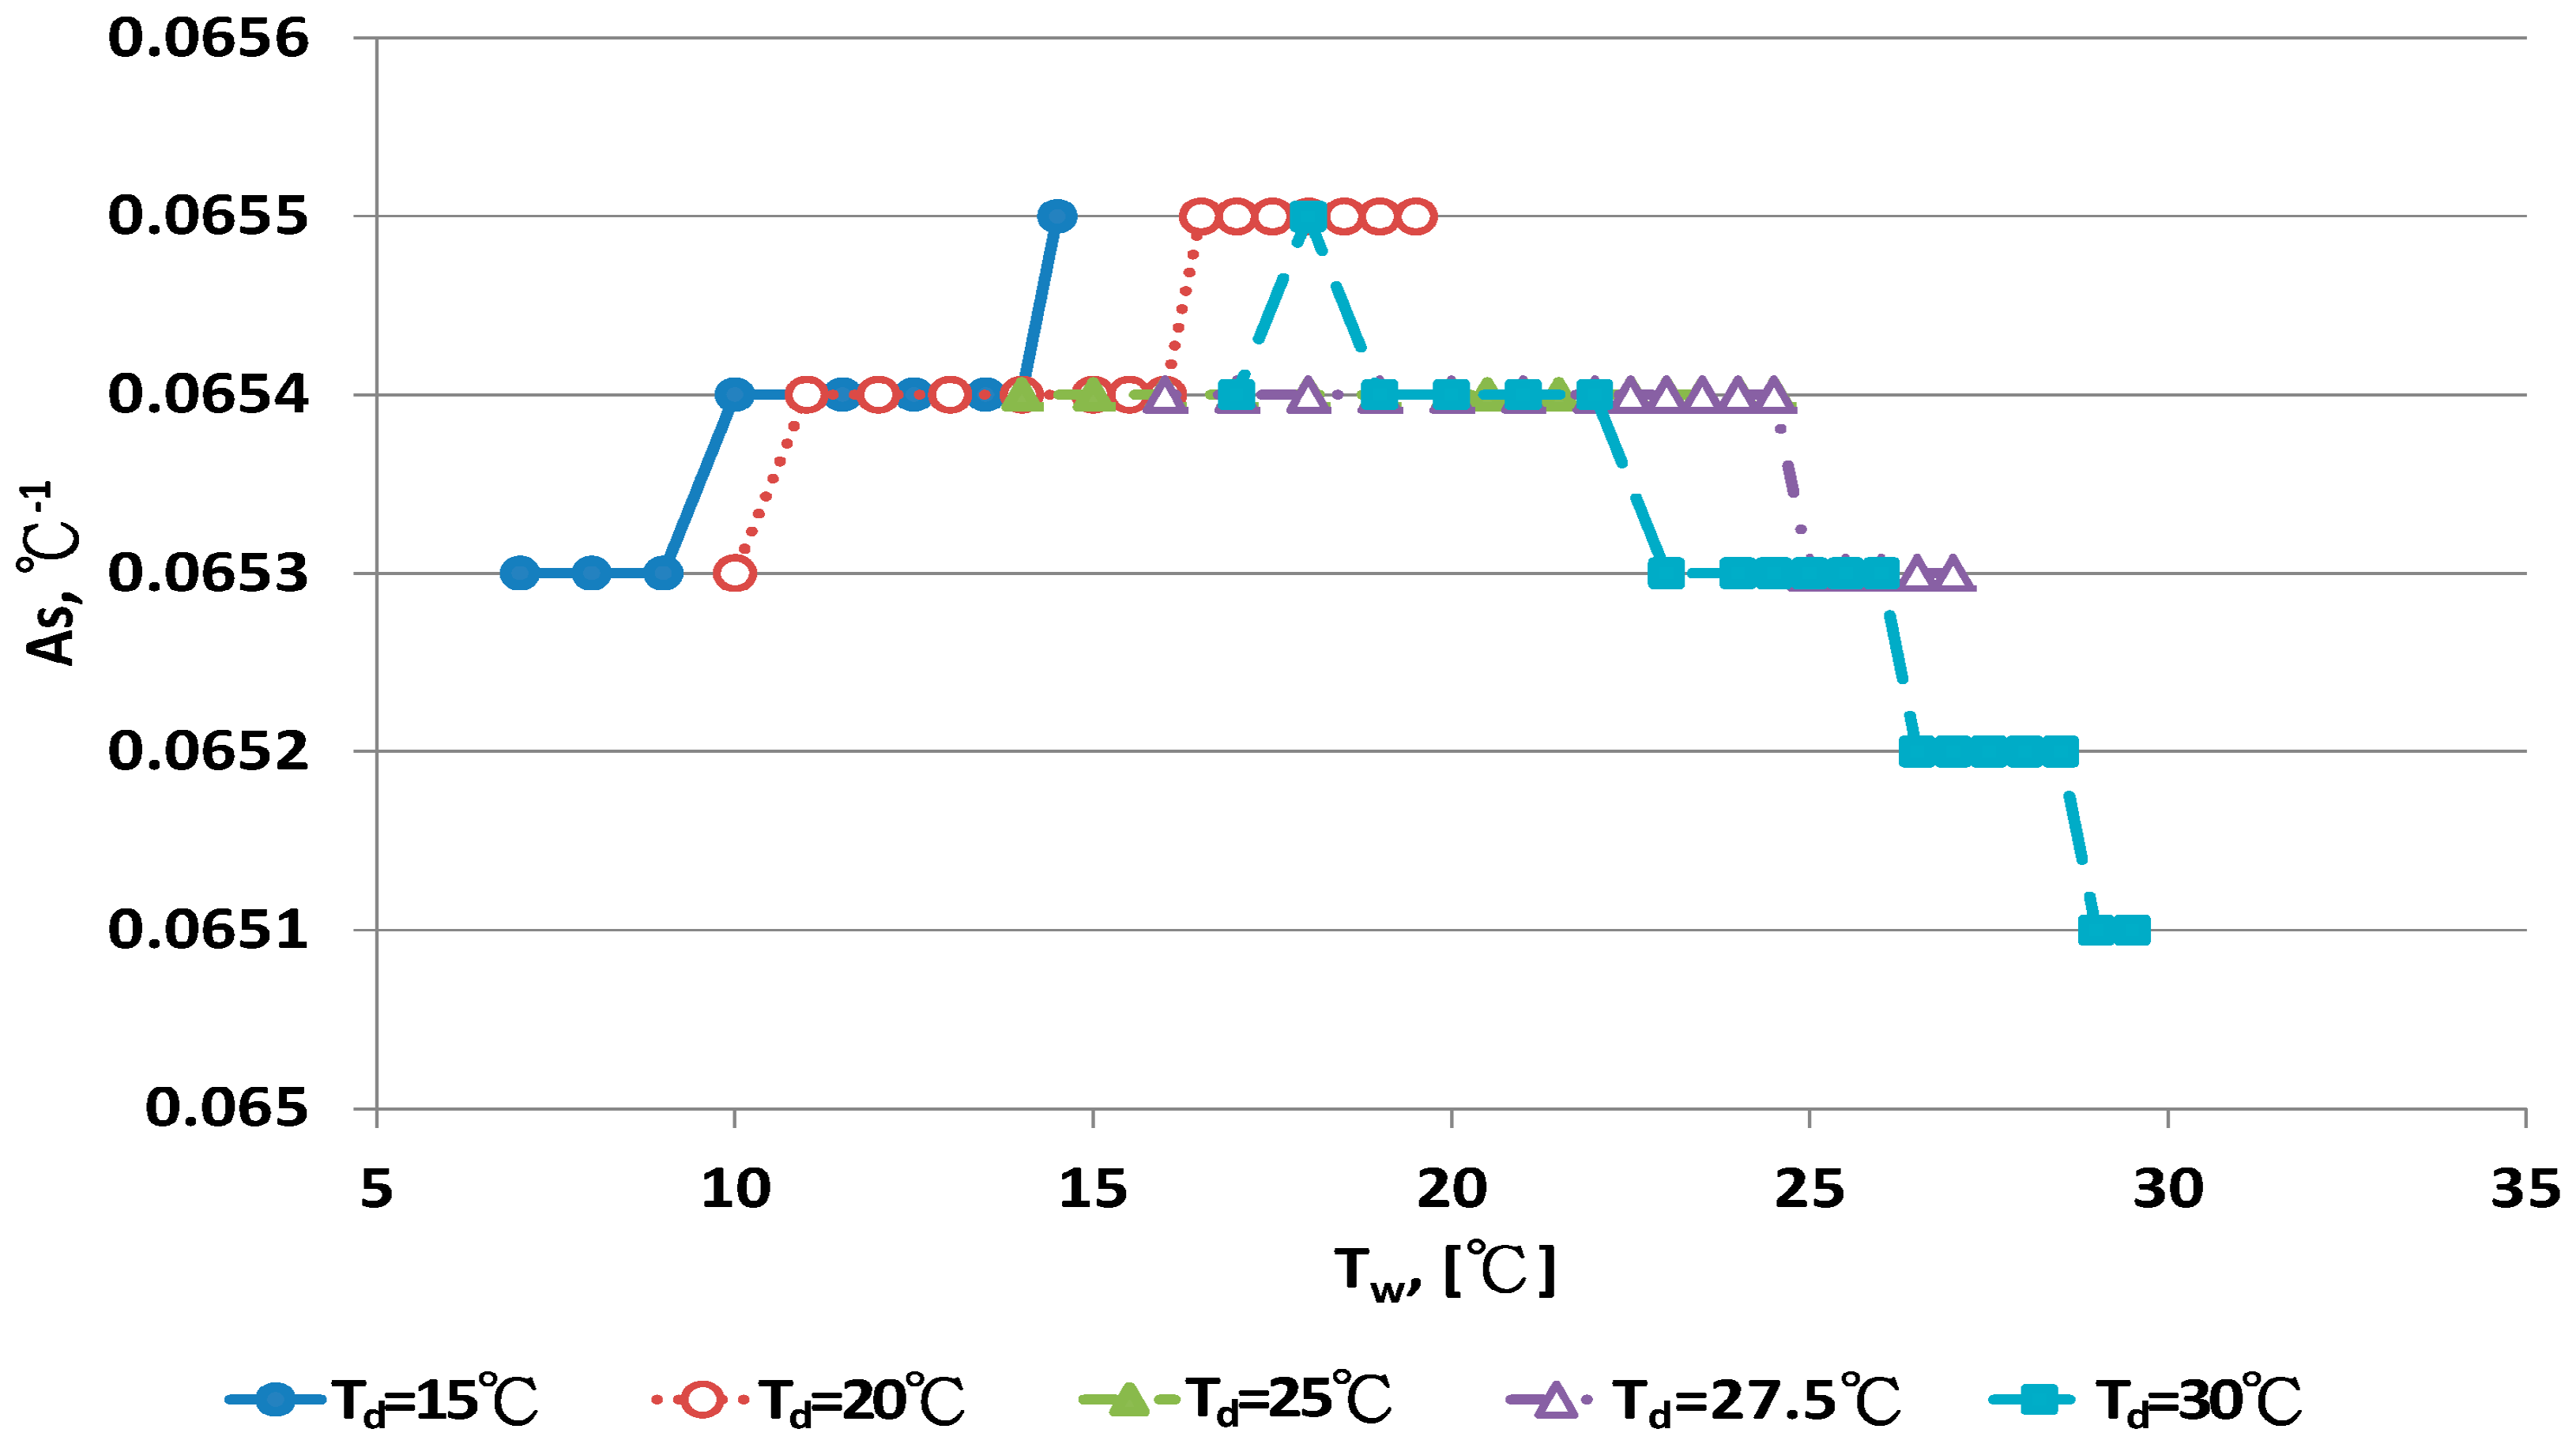
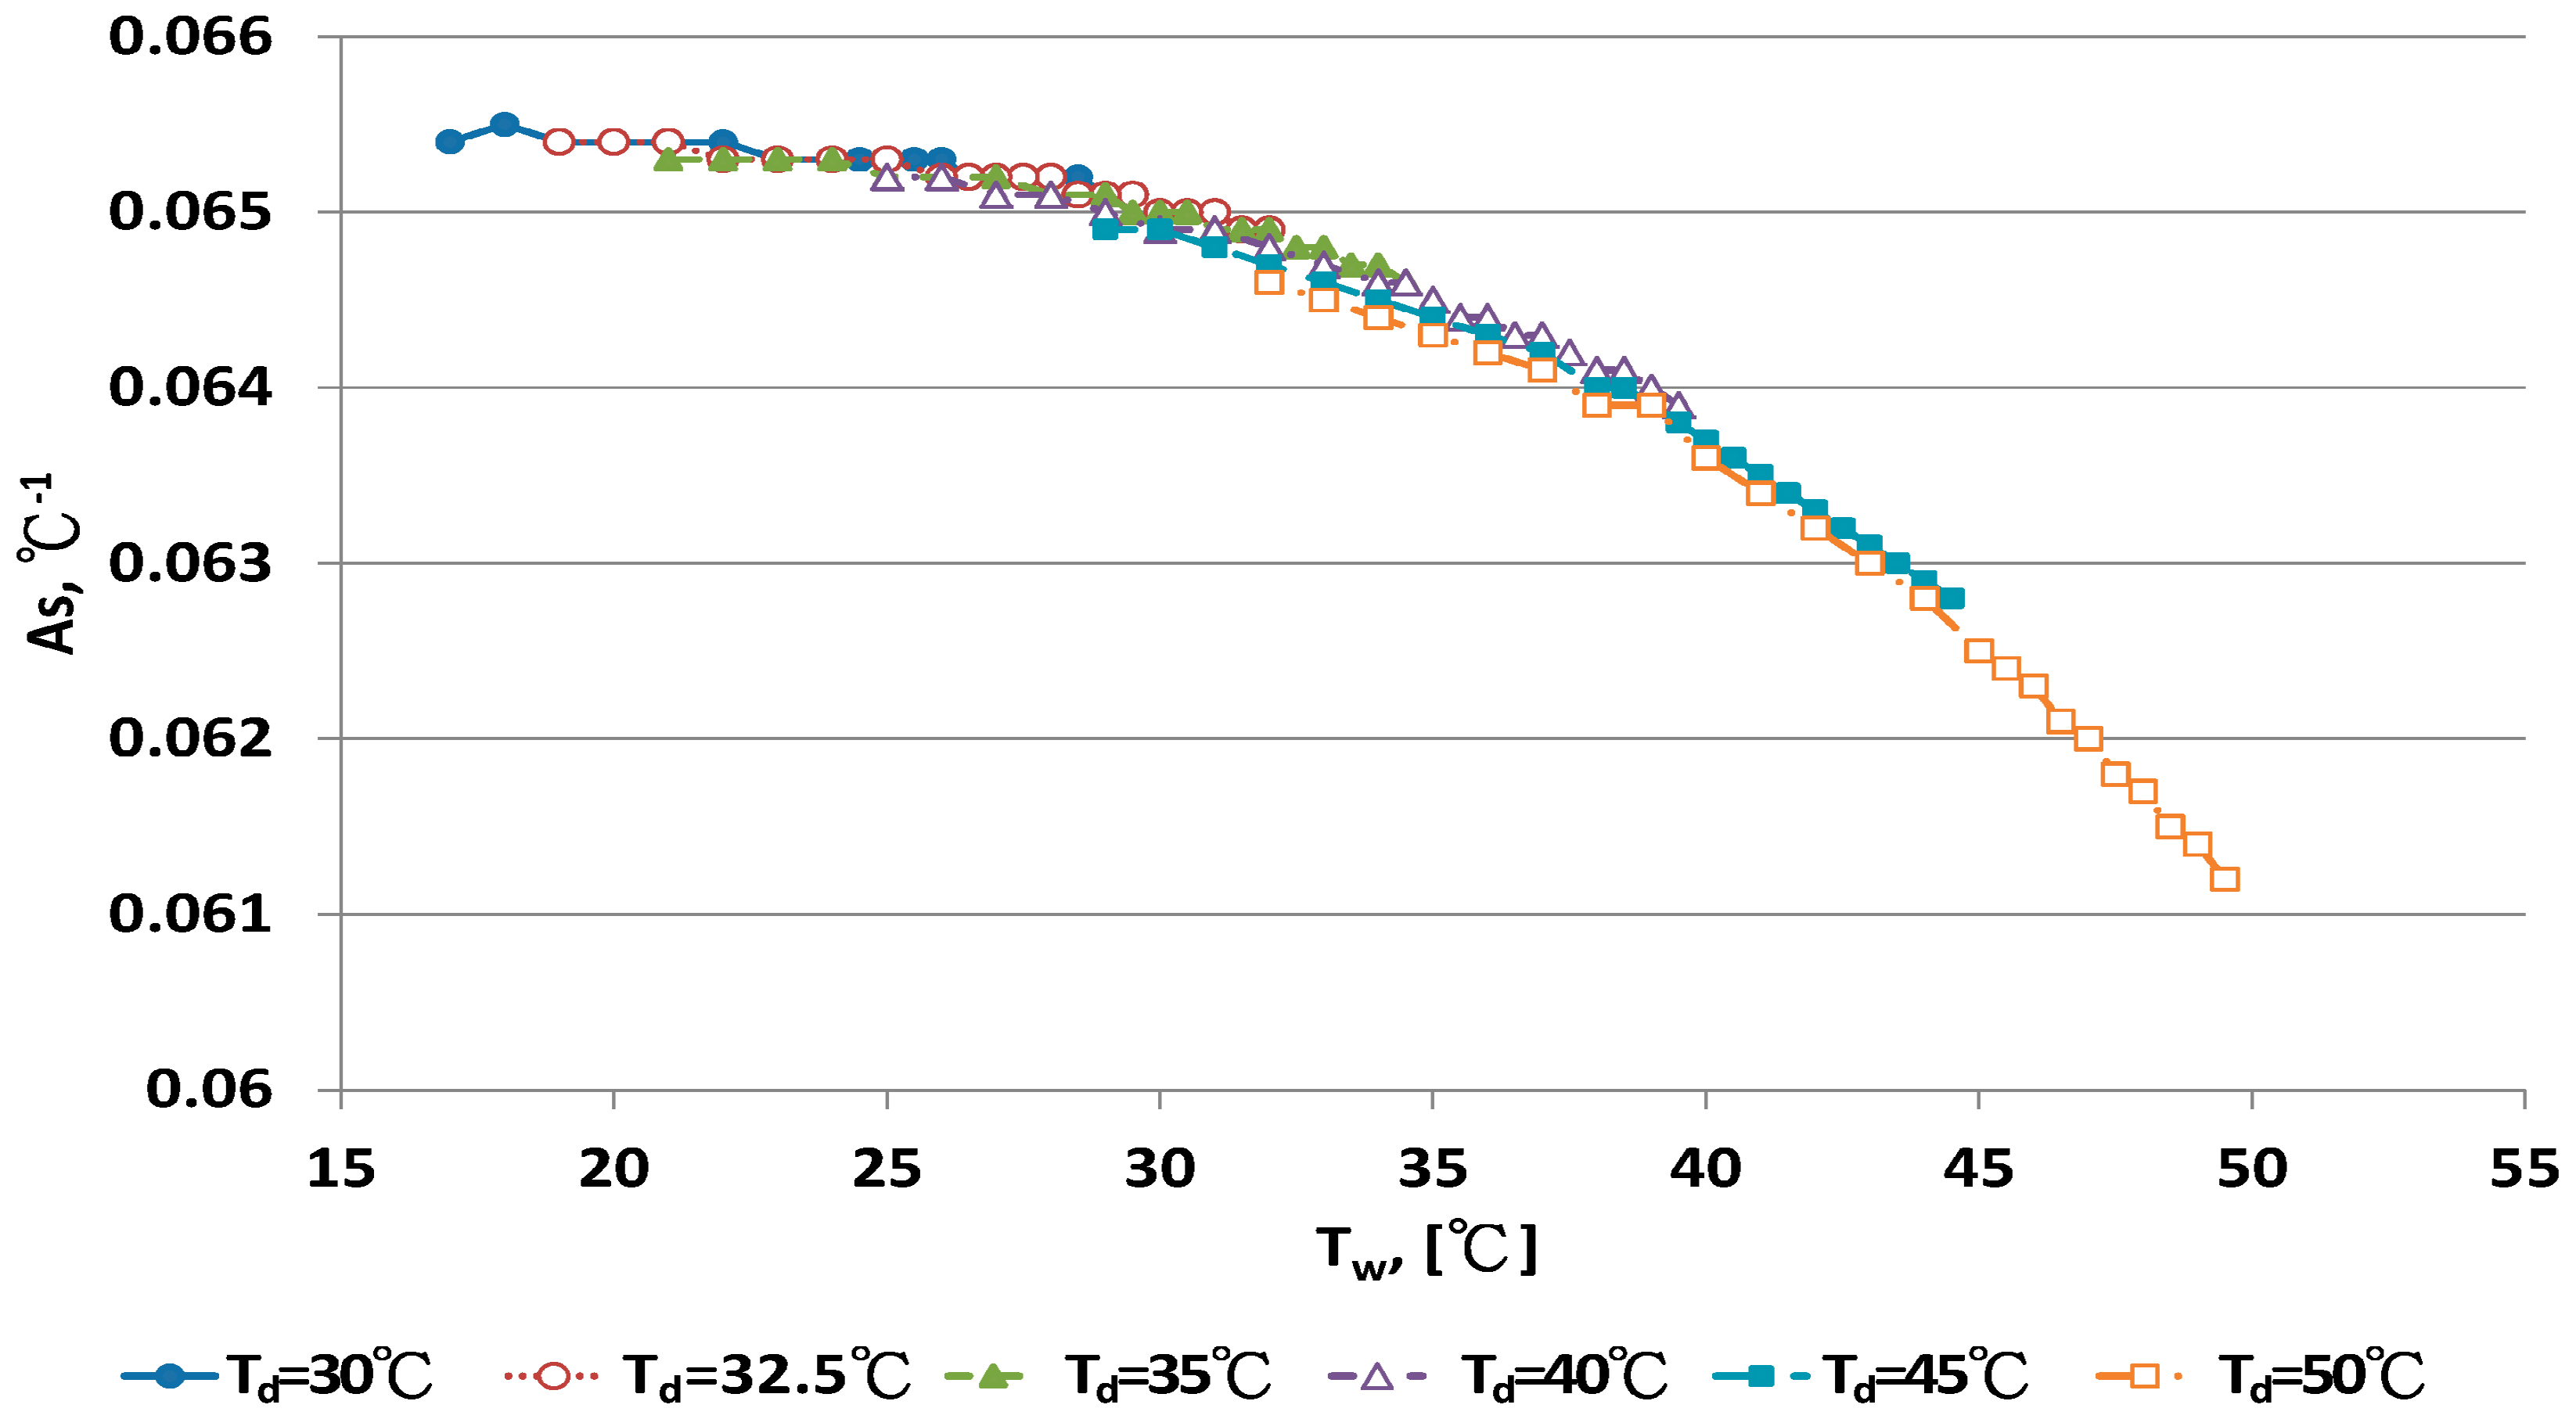
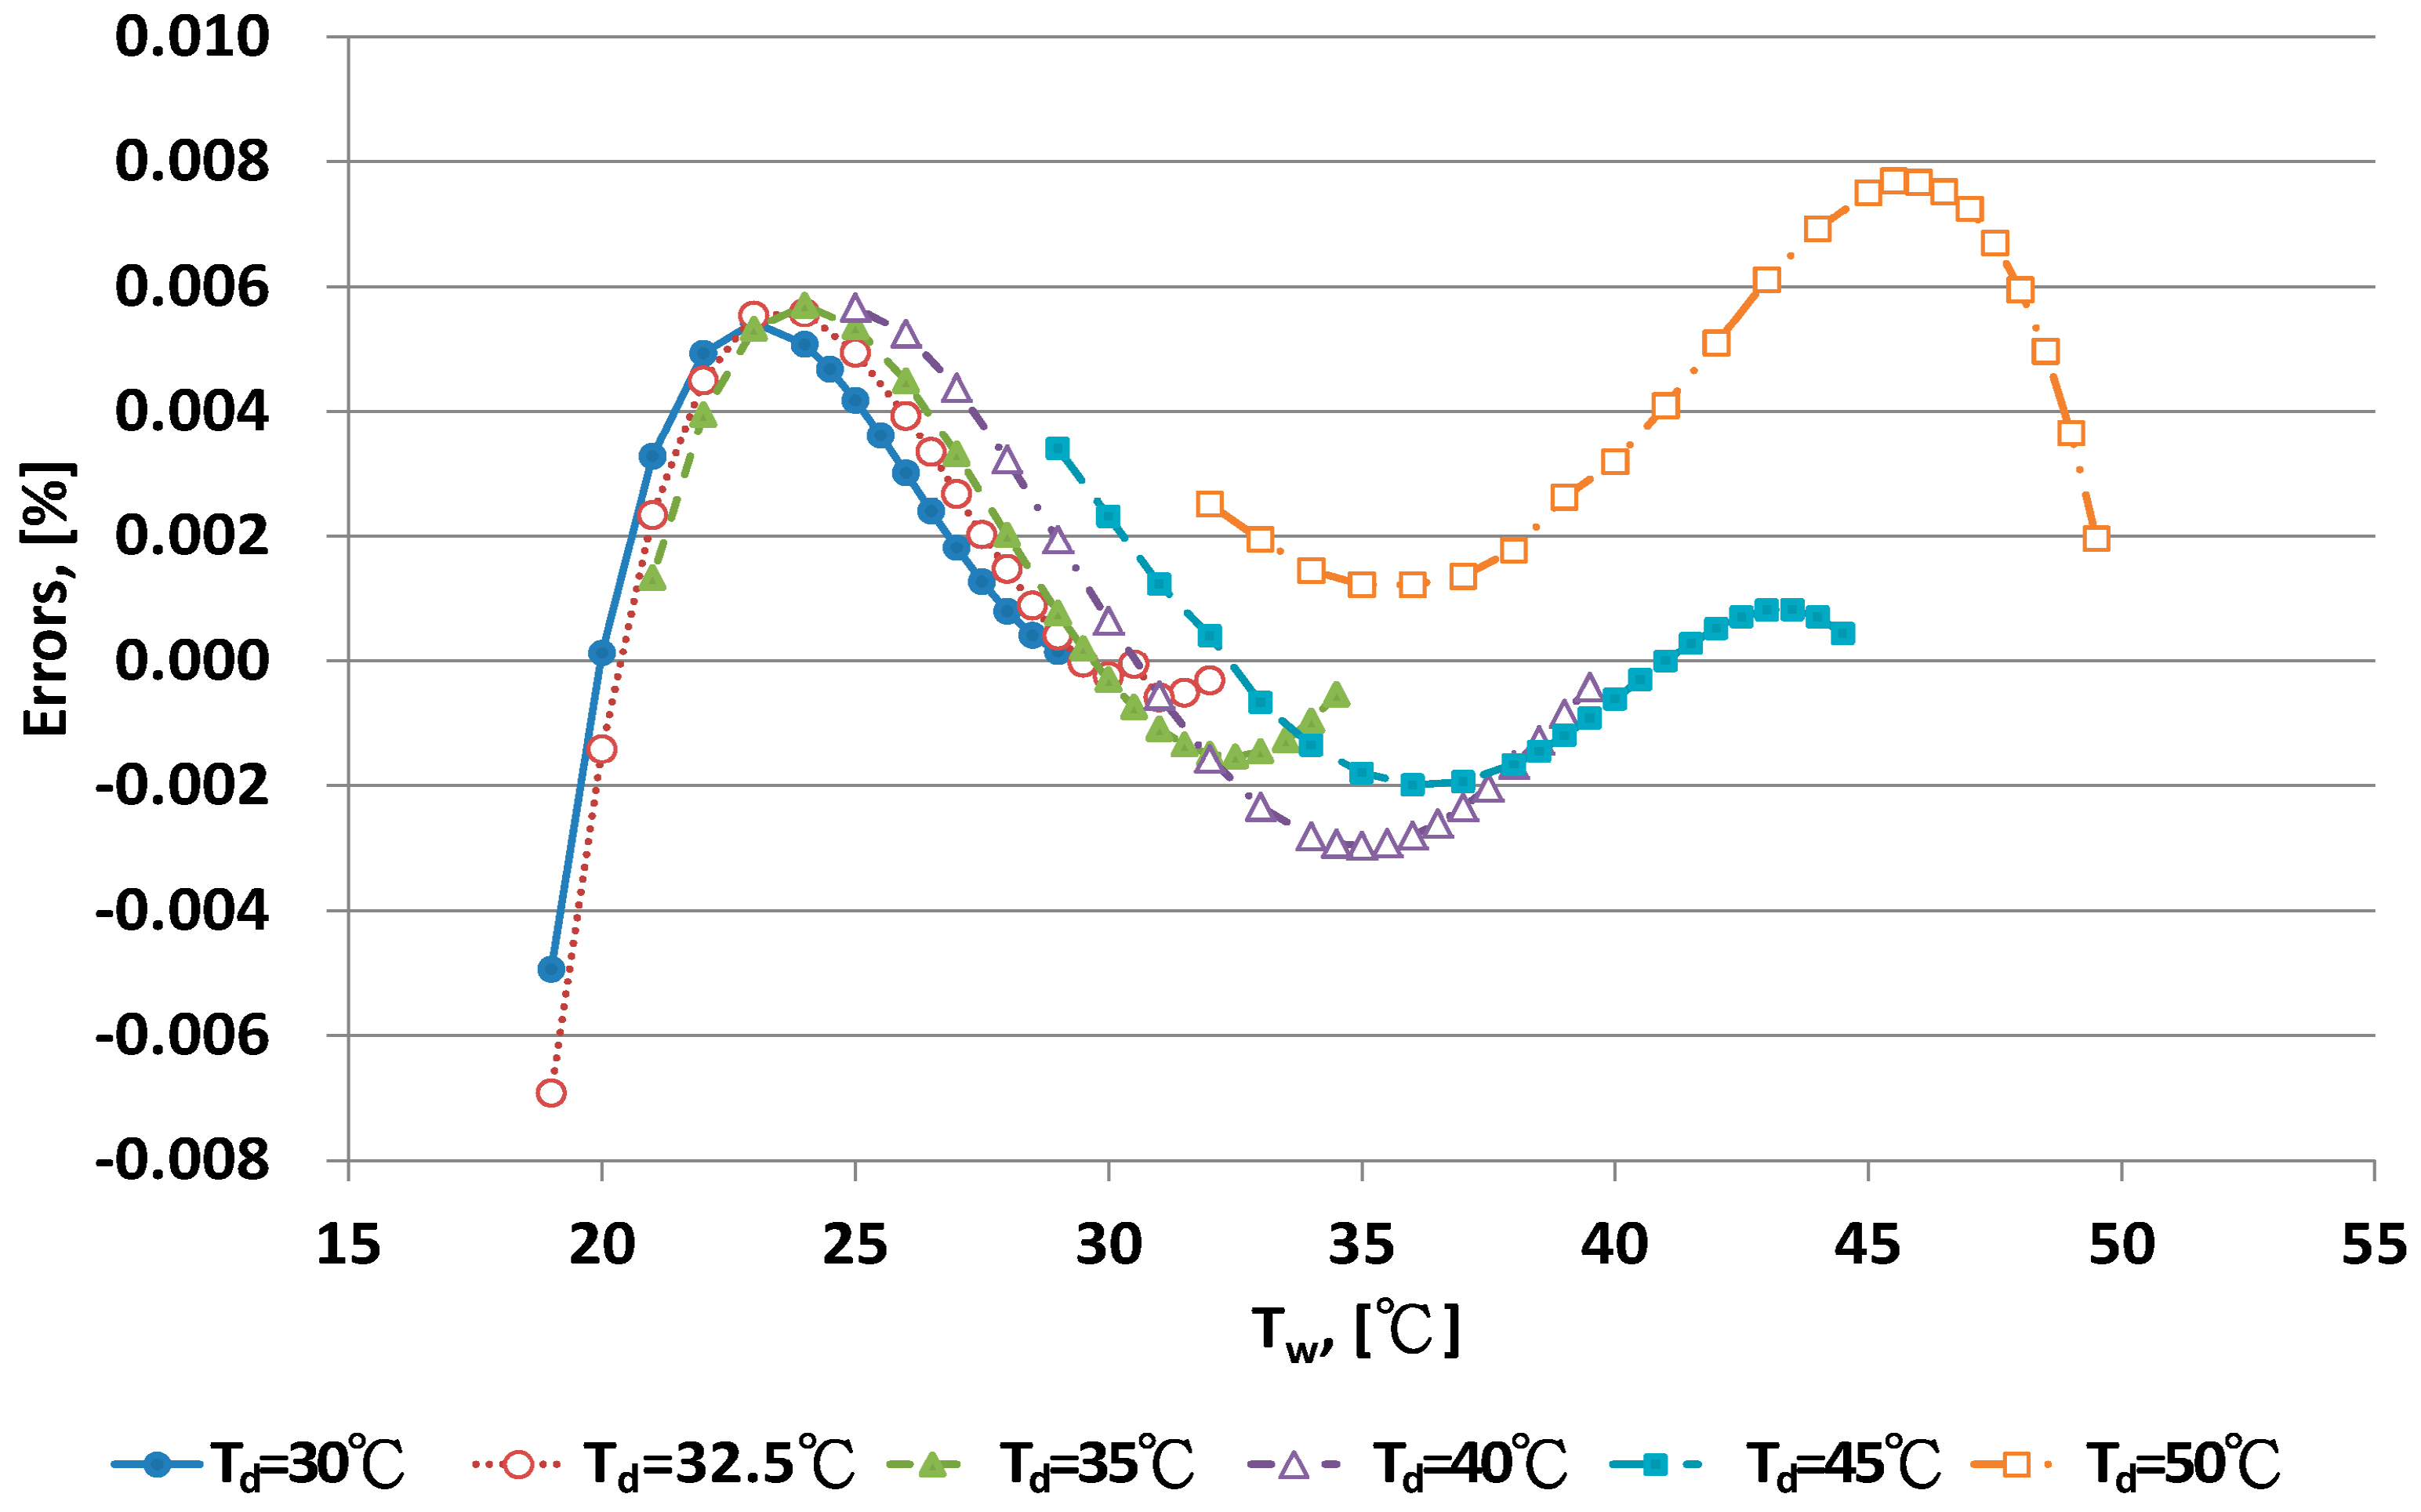
4.3. Development of a New As Equation

As values at fixed dry bulb temperature and different wet bulb temperature were calculated by the inverse technique from Equation (14). The relationship between As and wet bulb temperatures under 10 dry bulb temperatures is illustrated in Figure 7 and Figure 8. Figure 7 shows that As was nearly constant for dry bulb temperatures <30 °C. As was close to 0.0654 °C−1. The data distribution for As with Td > 30 °C in Figure 7 presents a clear curve shape. As strongly depended on the wet bulb temperature, Tw, and weakly on dry bulb temperature, Td. The relationship for As and the two temperatures were evaluated by regression analysis:
As = 0.0654 °C1, Td < 30 °C
As = 0.0637485 + 0.000187508 Tw − 4.376670 × 10⁻⁶ Tw2 − 1.21851 × 10⁻⁵ Td
R2 = 0.99483, s = 4.73762 × 10⁻⁵, Td > 30 °C,
The new As equation was incorporated into Equation (1). Predictive errors for this new As equation are in Table 1. Three criteria, Emin, Emax and | E | ave, were lower for the new As equation than other empirical equations. At Td = 15 °C, | E | ave for the new As, Penman and WMO equations was 0.0988%, 0.2261% and 0.3331%, respectively. At Td = 30 °C, | E | ave for the above three equations was 0.0058%, 0.1422% and 0.3016%, respectively. At Td = 50 °C, | E | ave for the above three equations was 0.00458%, 0.1719% and 0.3190%, respectively. The predictive errors of the new As equation improved significantly.
The error distribution for the new As equation for different dry bulb temperatures is shown in Figure 9 and Figure 10. With Td < 25 °C, larger errors were found at the lower range of Tw. With Td > 30 °C, error distributions were curved. With a more complex form of the As model, for example, when higher order polynomial equations were used, the error distribution of the curve shapes could be improved. However, the new As equation, Equation (10), could be easily computed with a calculator. The predictive value of errors was <0.1% RH. This error could be acceptable in term of practical application for humidity measurement [1,8], so Equation (10) is recommended as the adequate As equation.
Simoes-Moreire found that most of the empirical equations for the psychrometer coefficient of A were presented in a fixed range or as a constant [32]. Some researchers have proposed a linear relationship for the A value and wet bulb temperature [25,26,27]. However, the linear Tw model for As did not improve the predicted values of RH. The new As model proposed in this study can significantly improve the predictive ability for RH measurement.

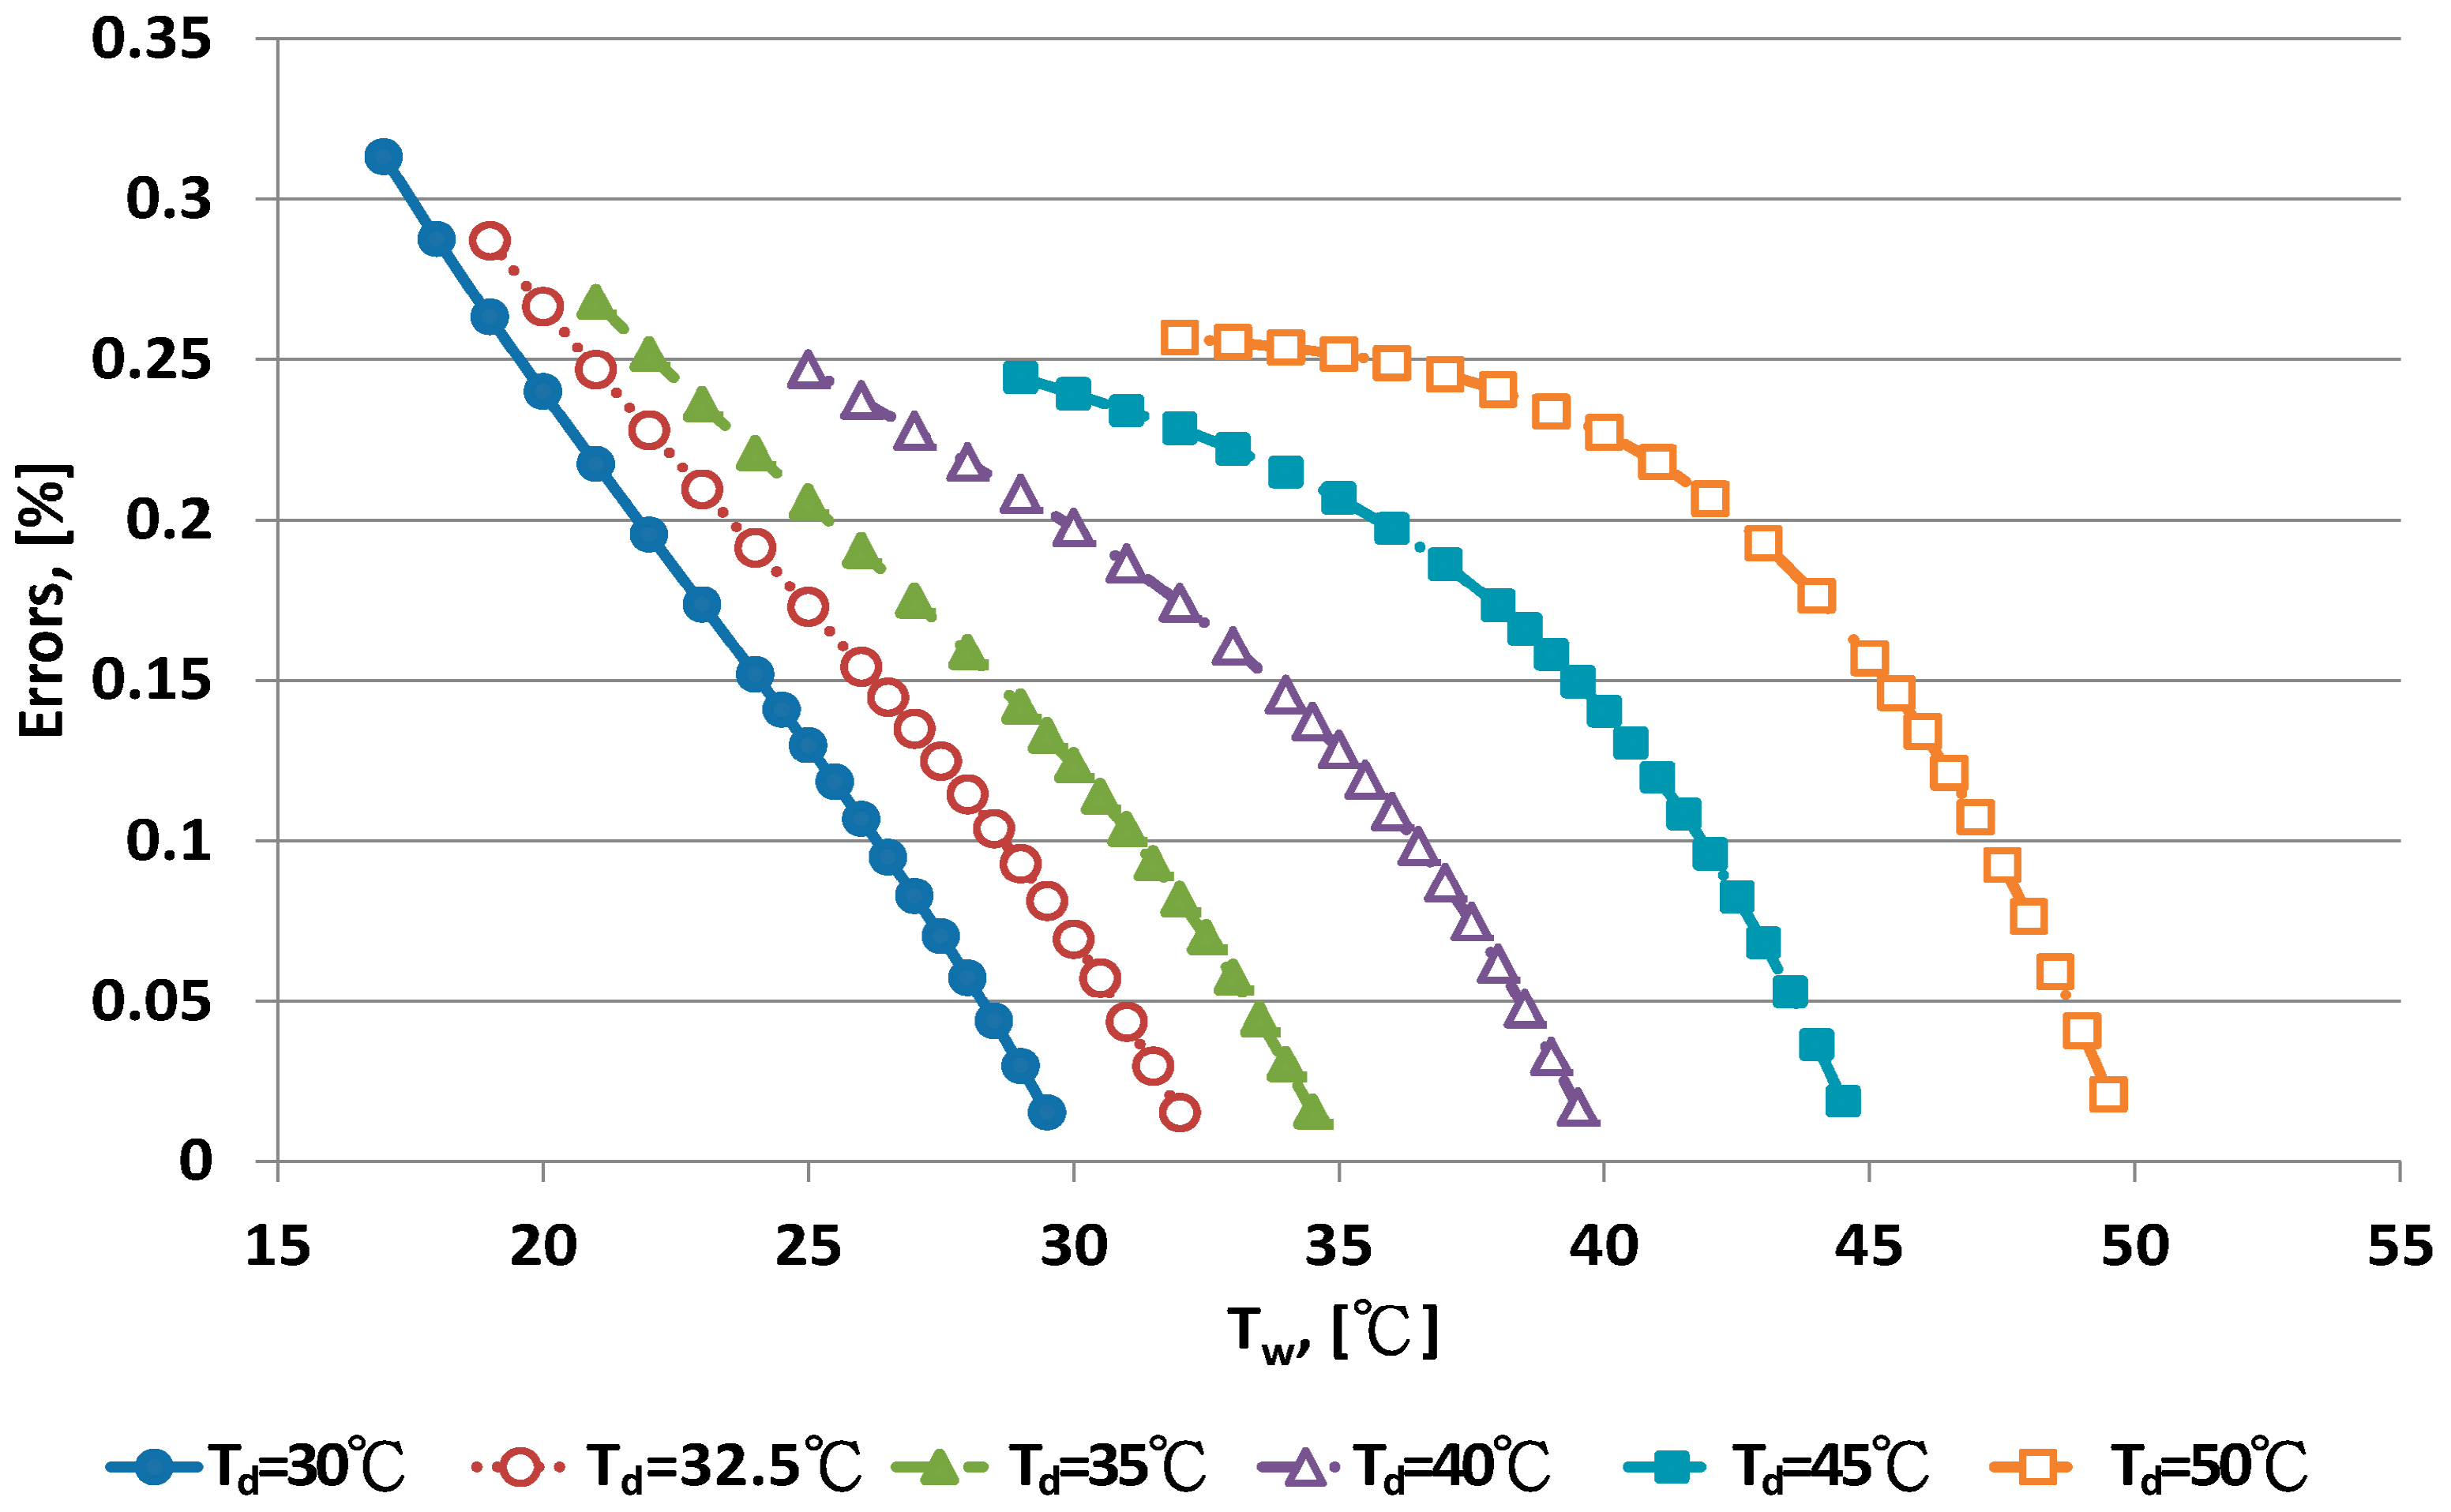
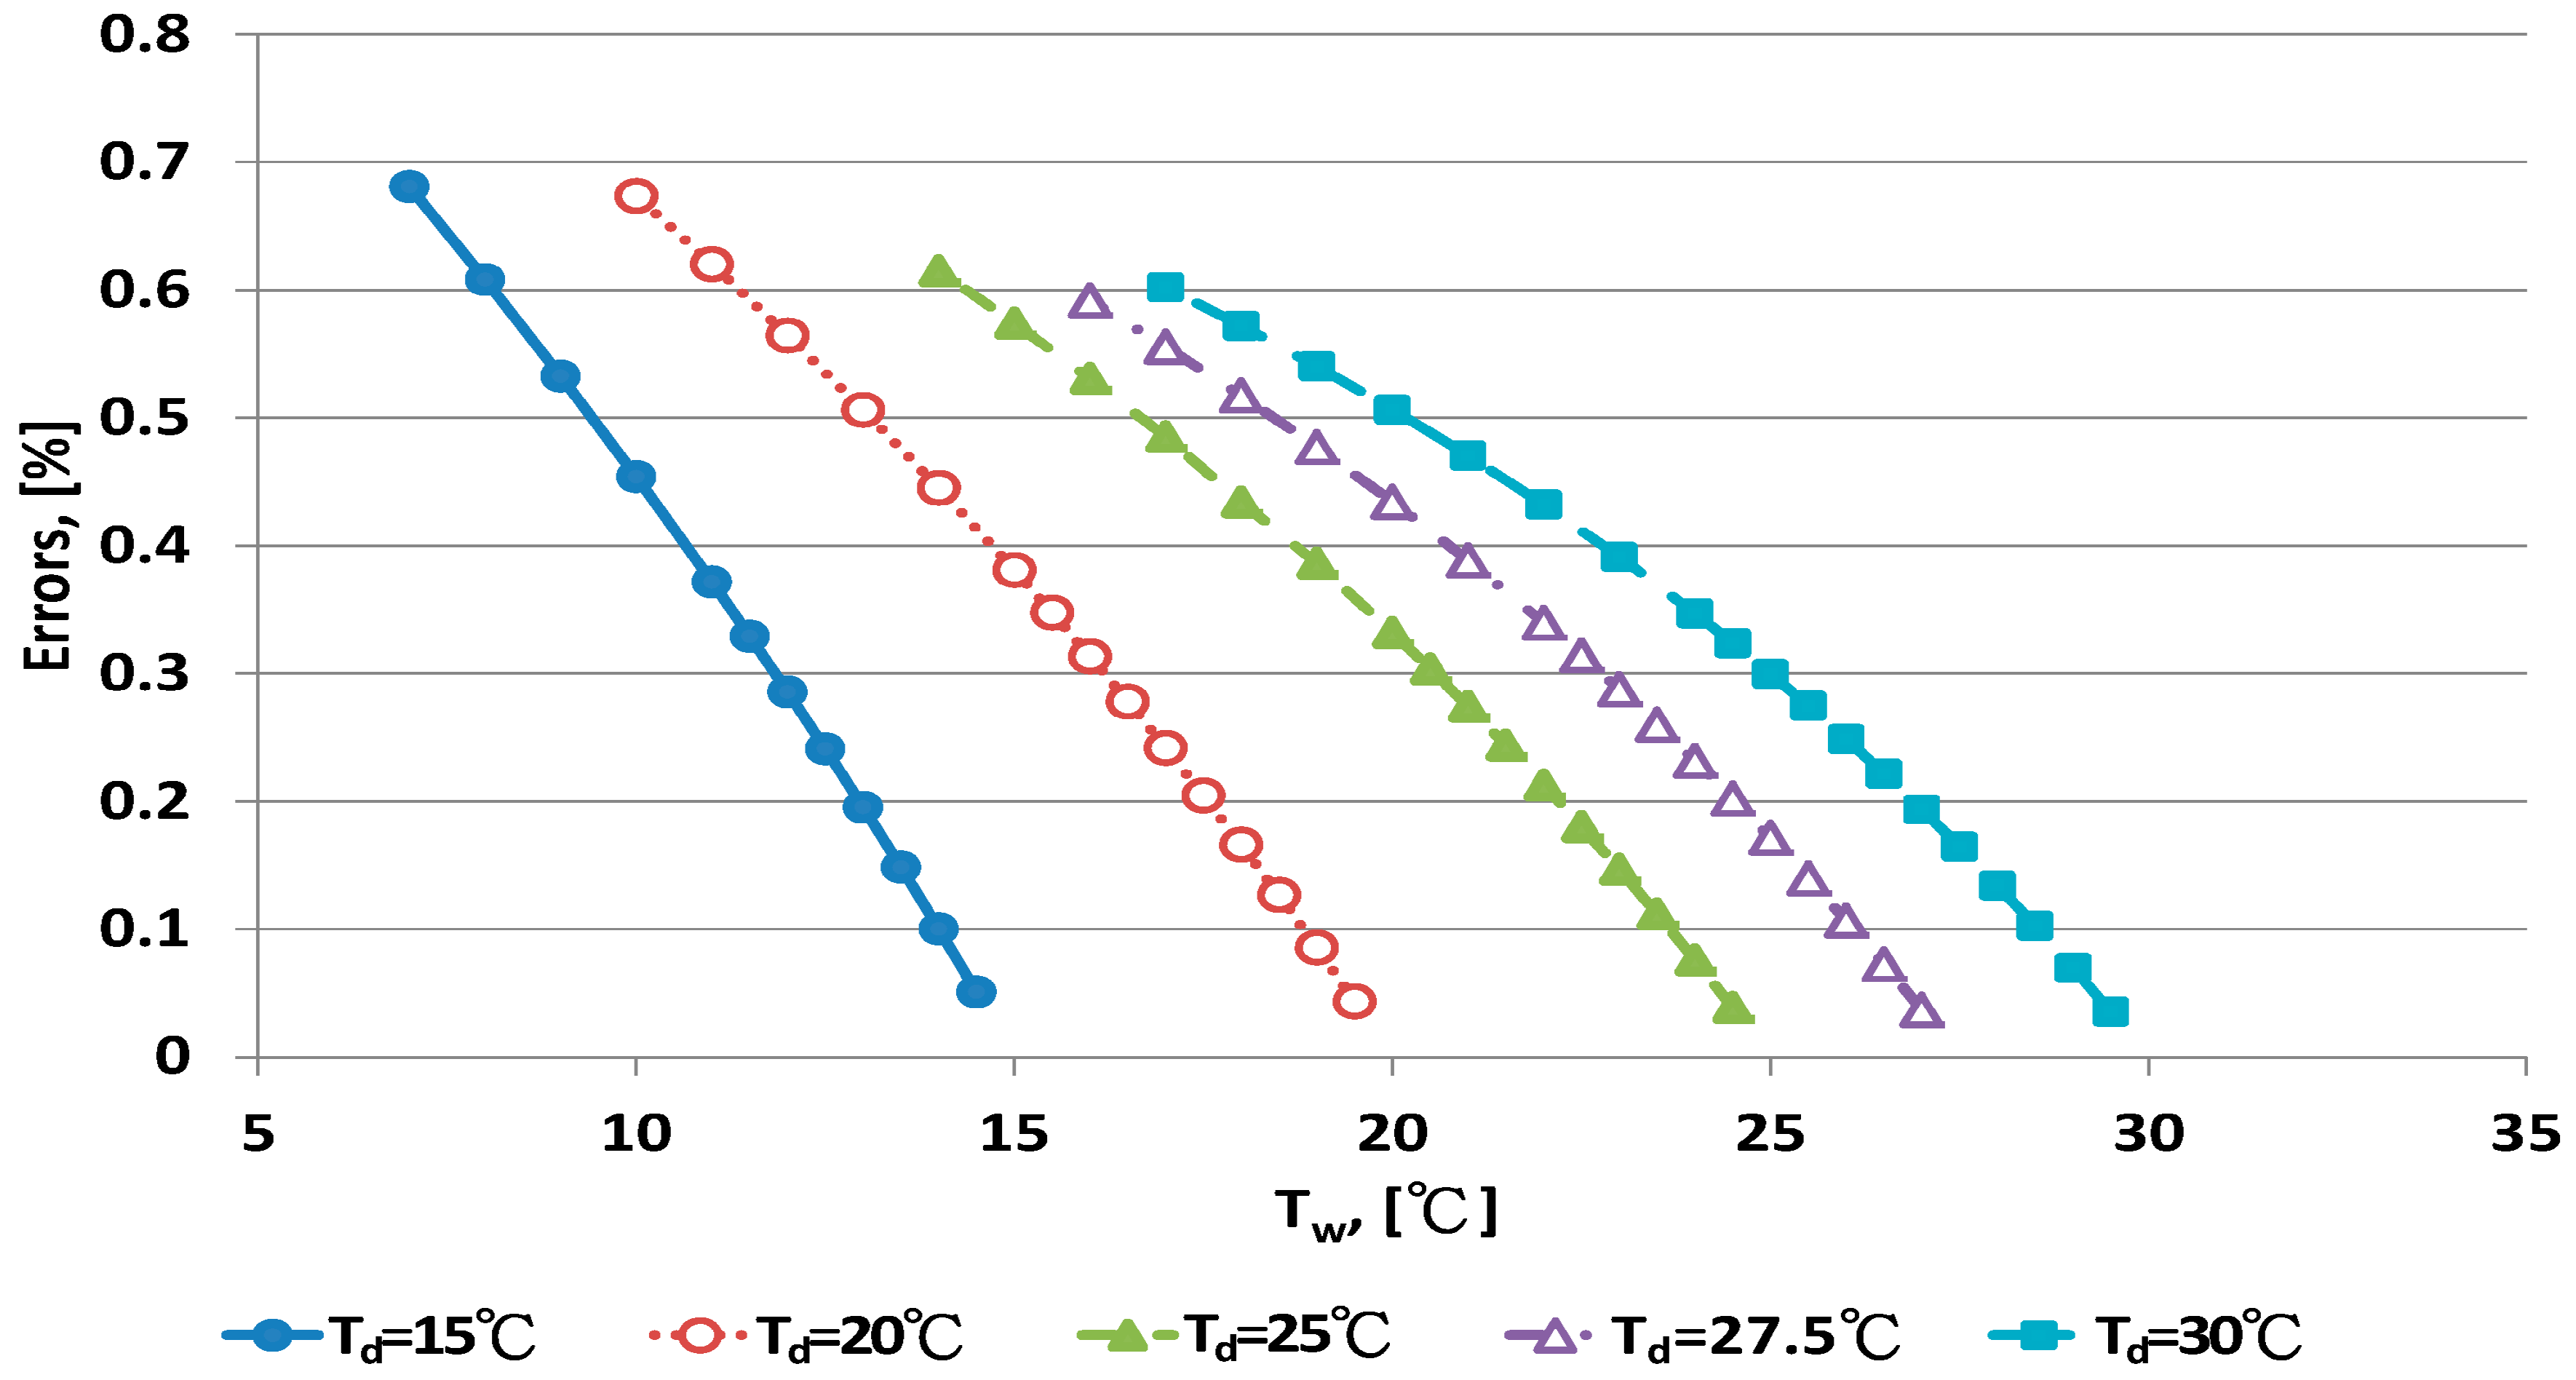
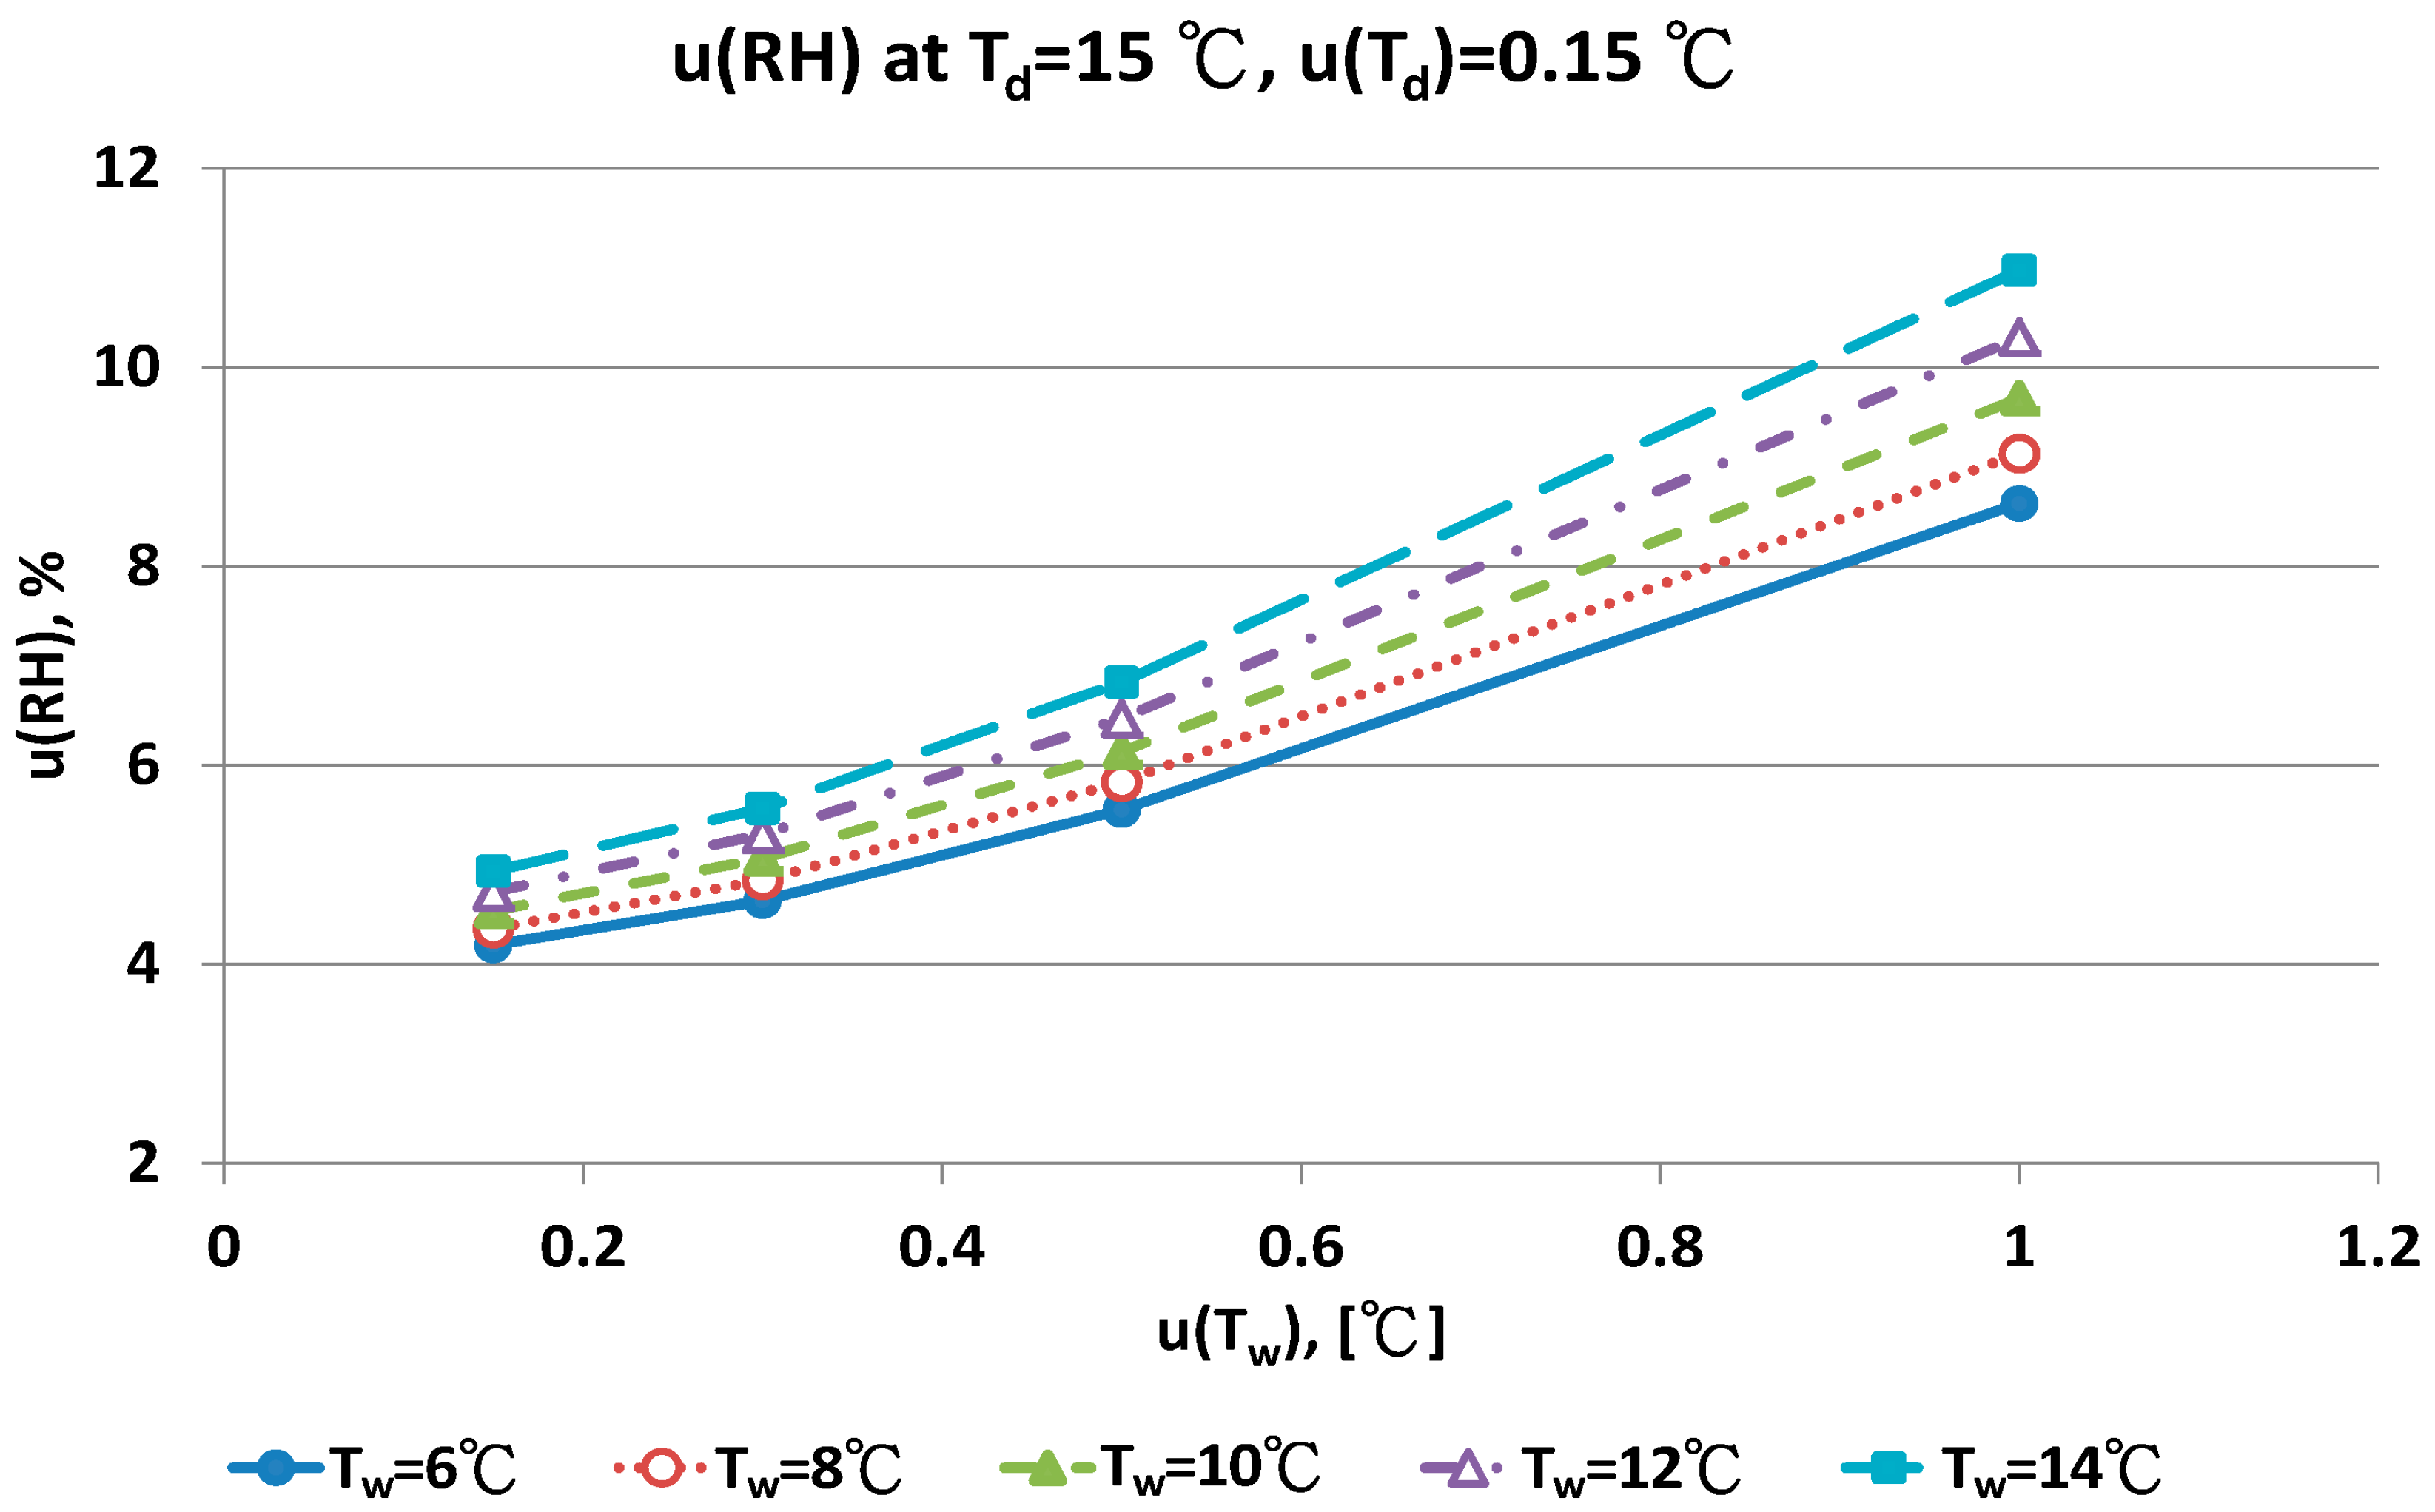
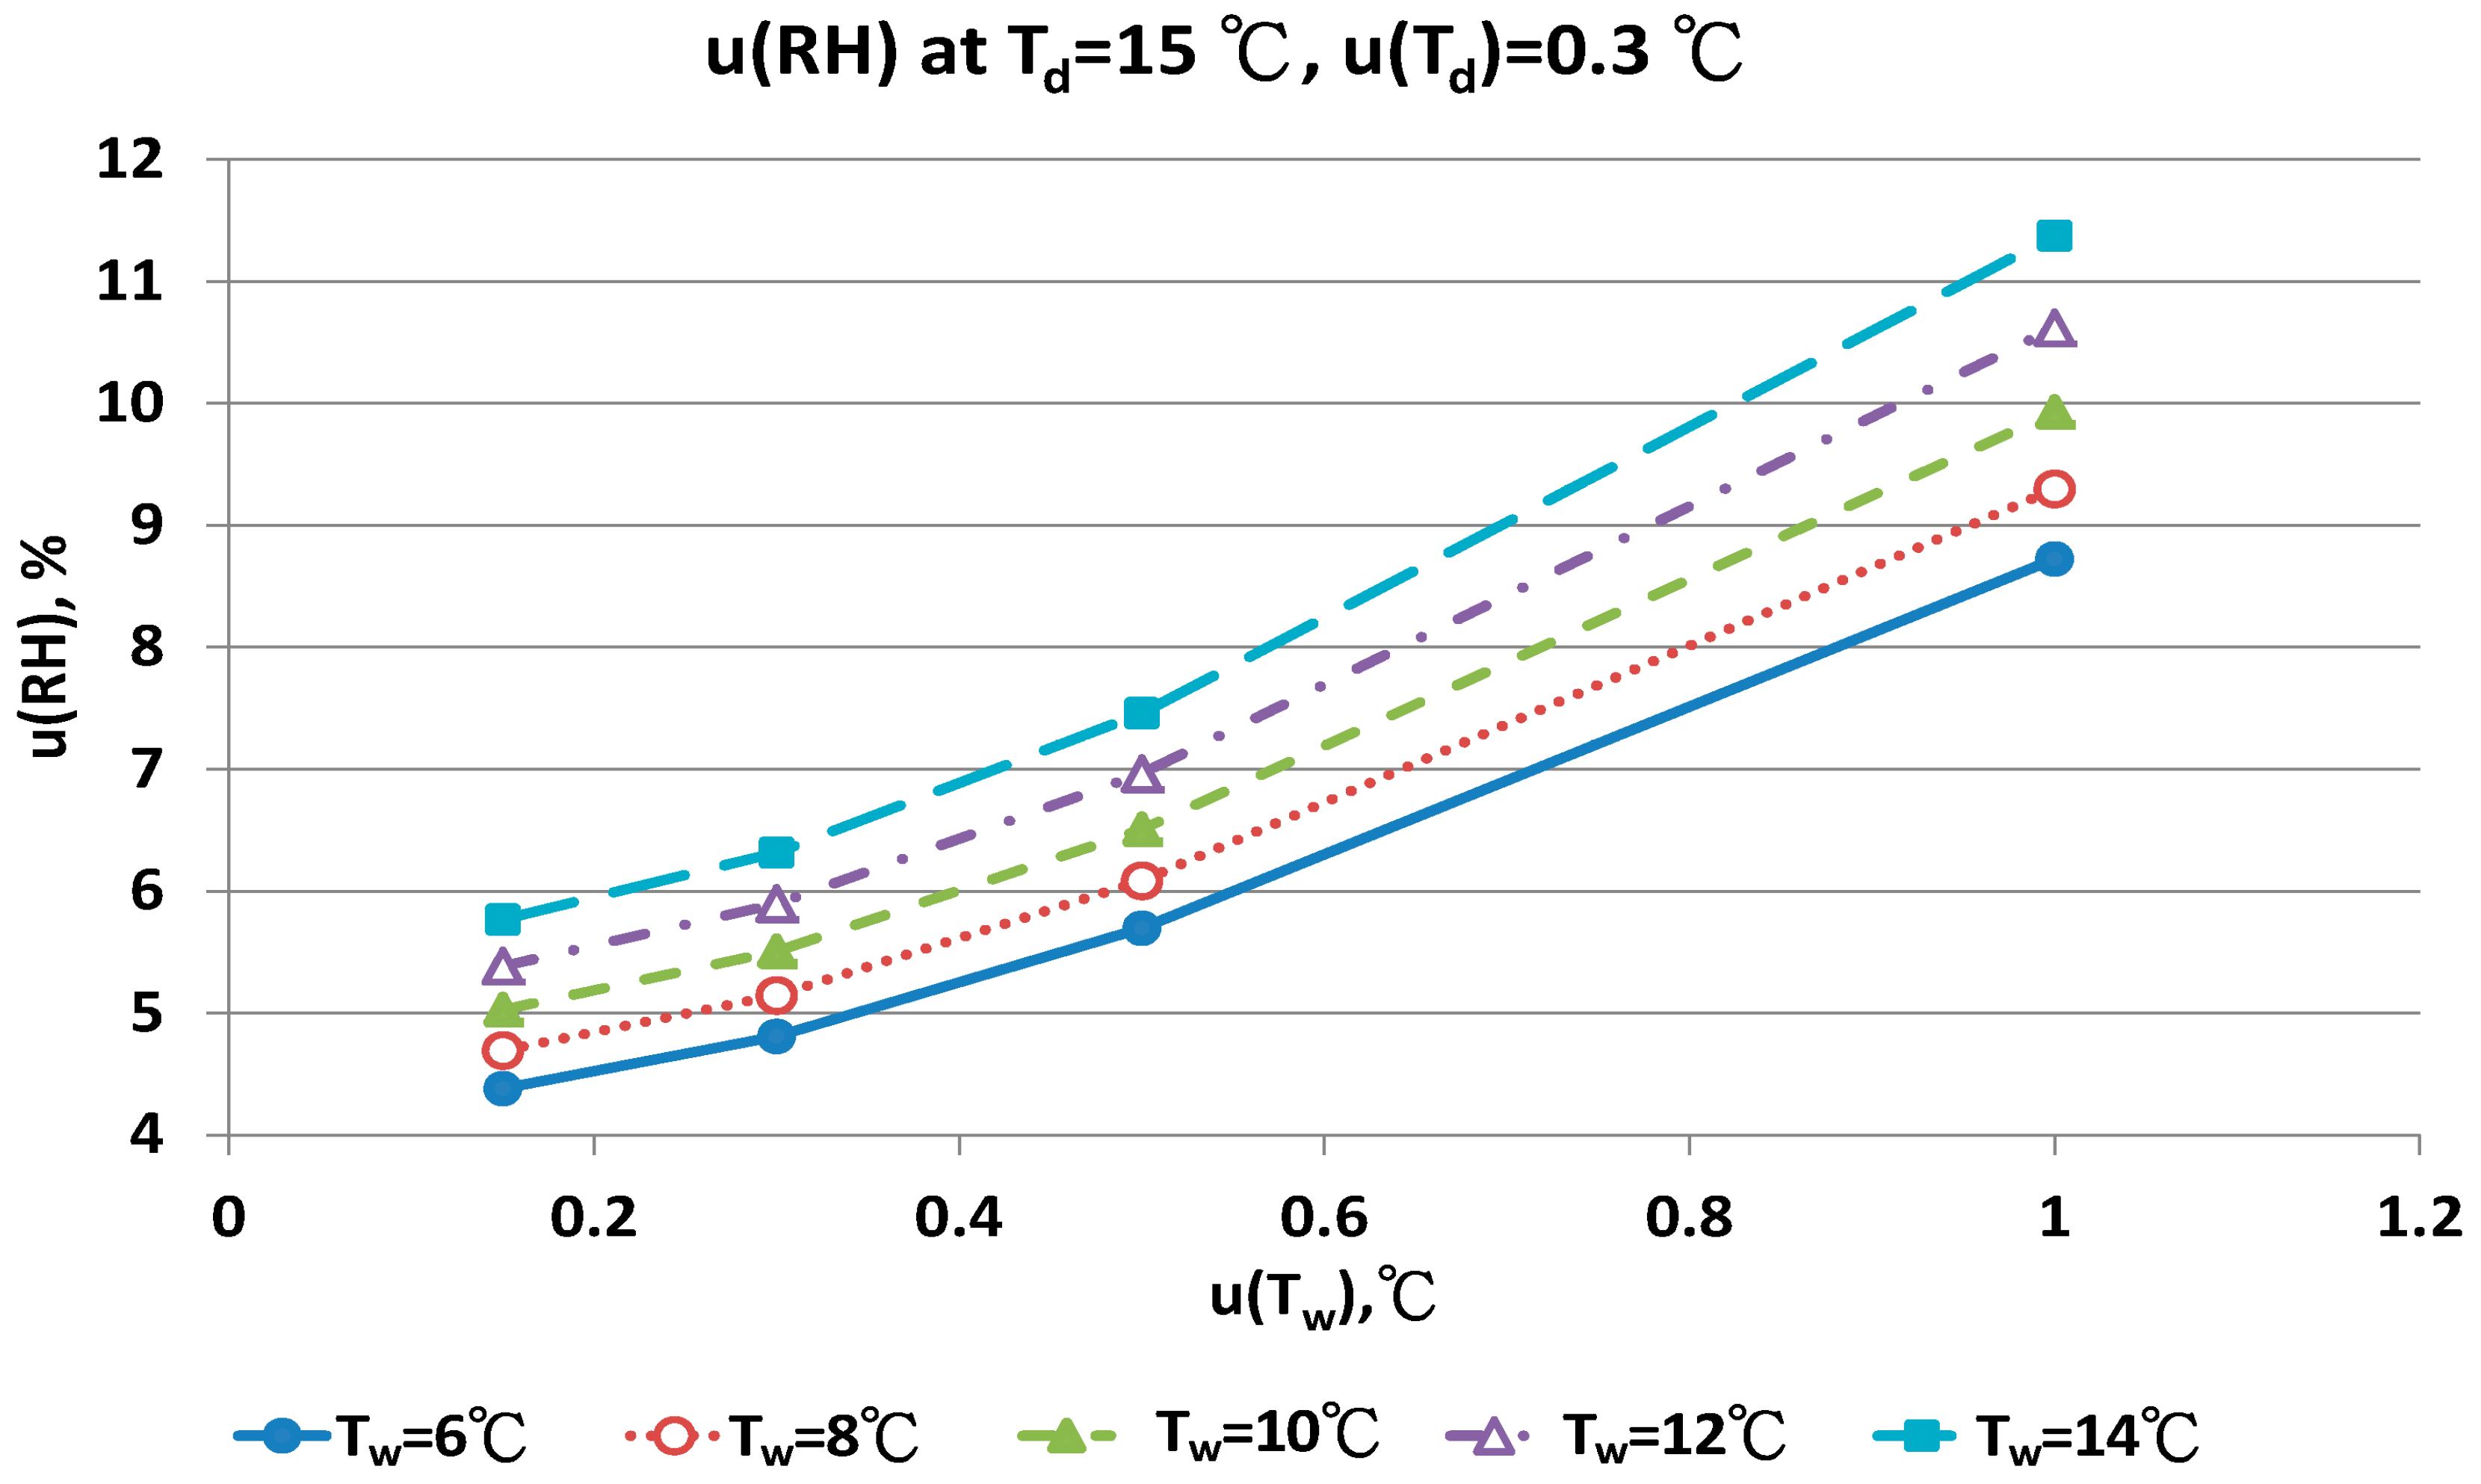
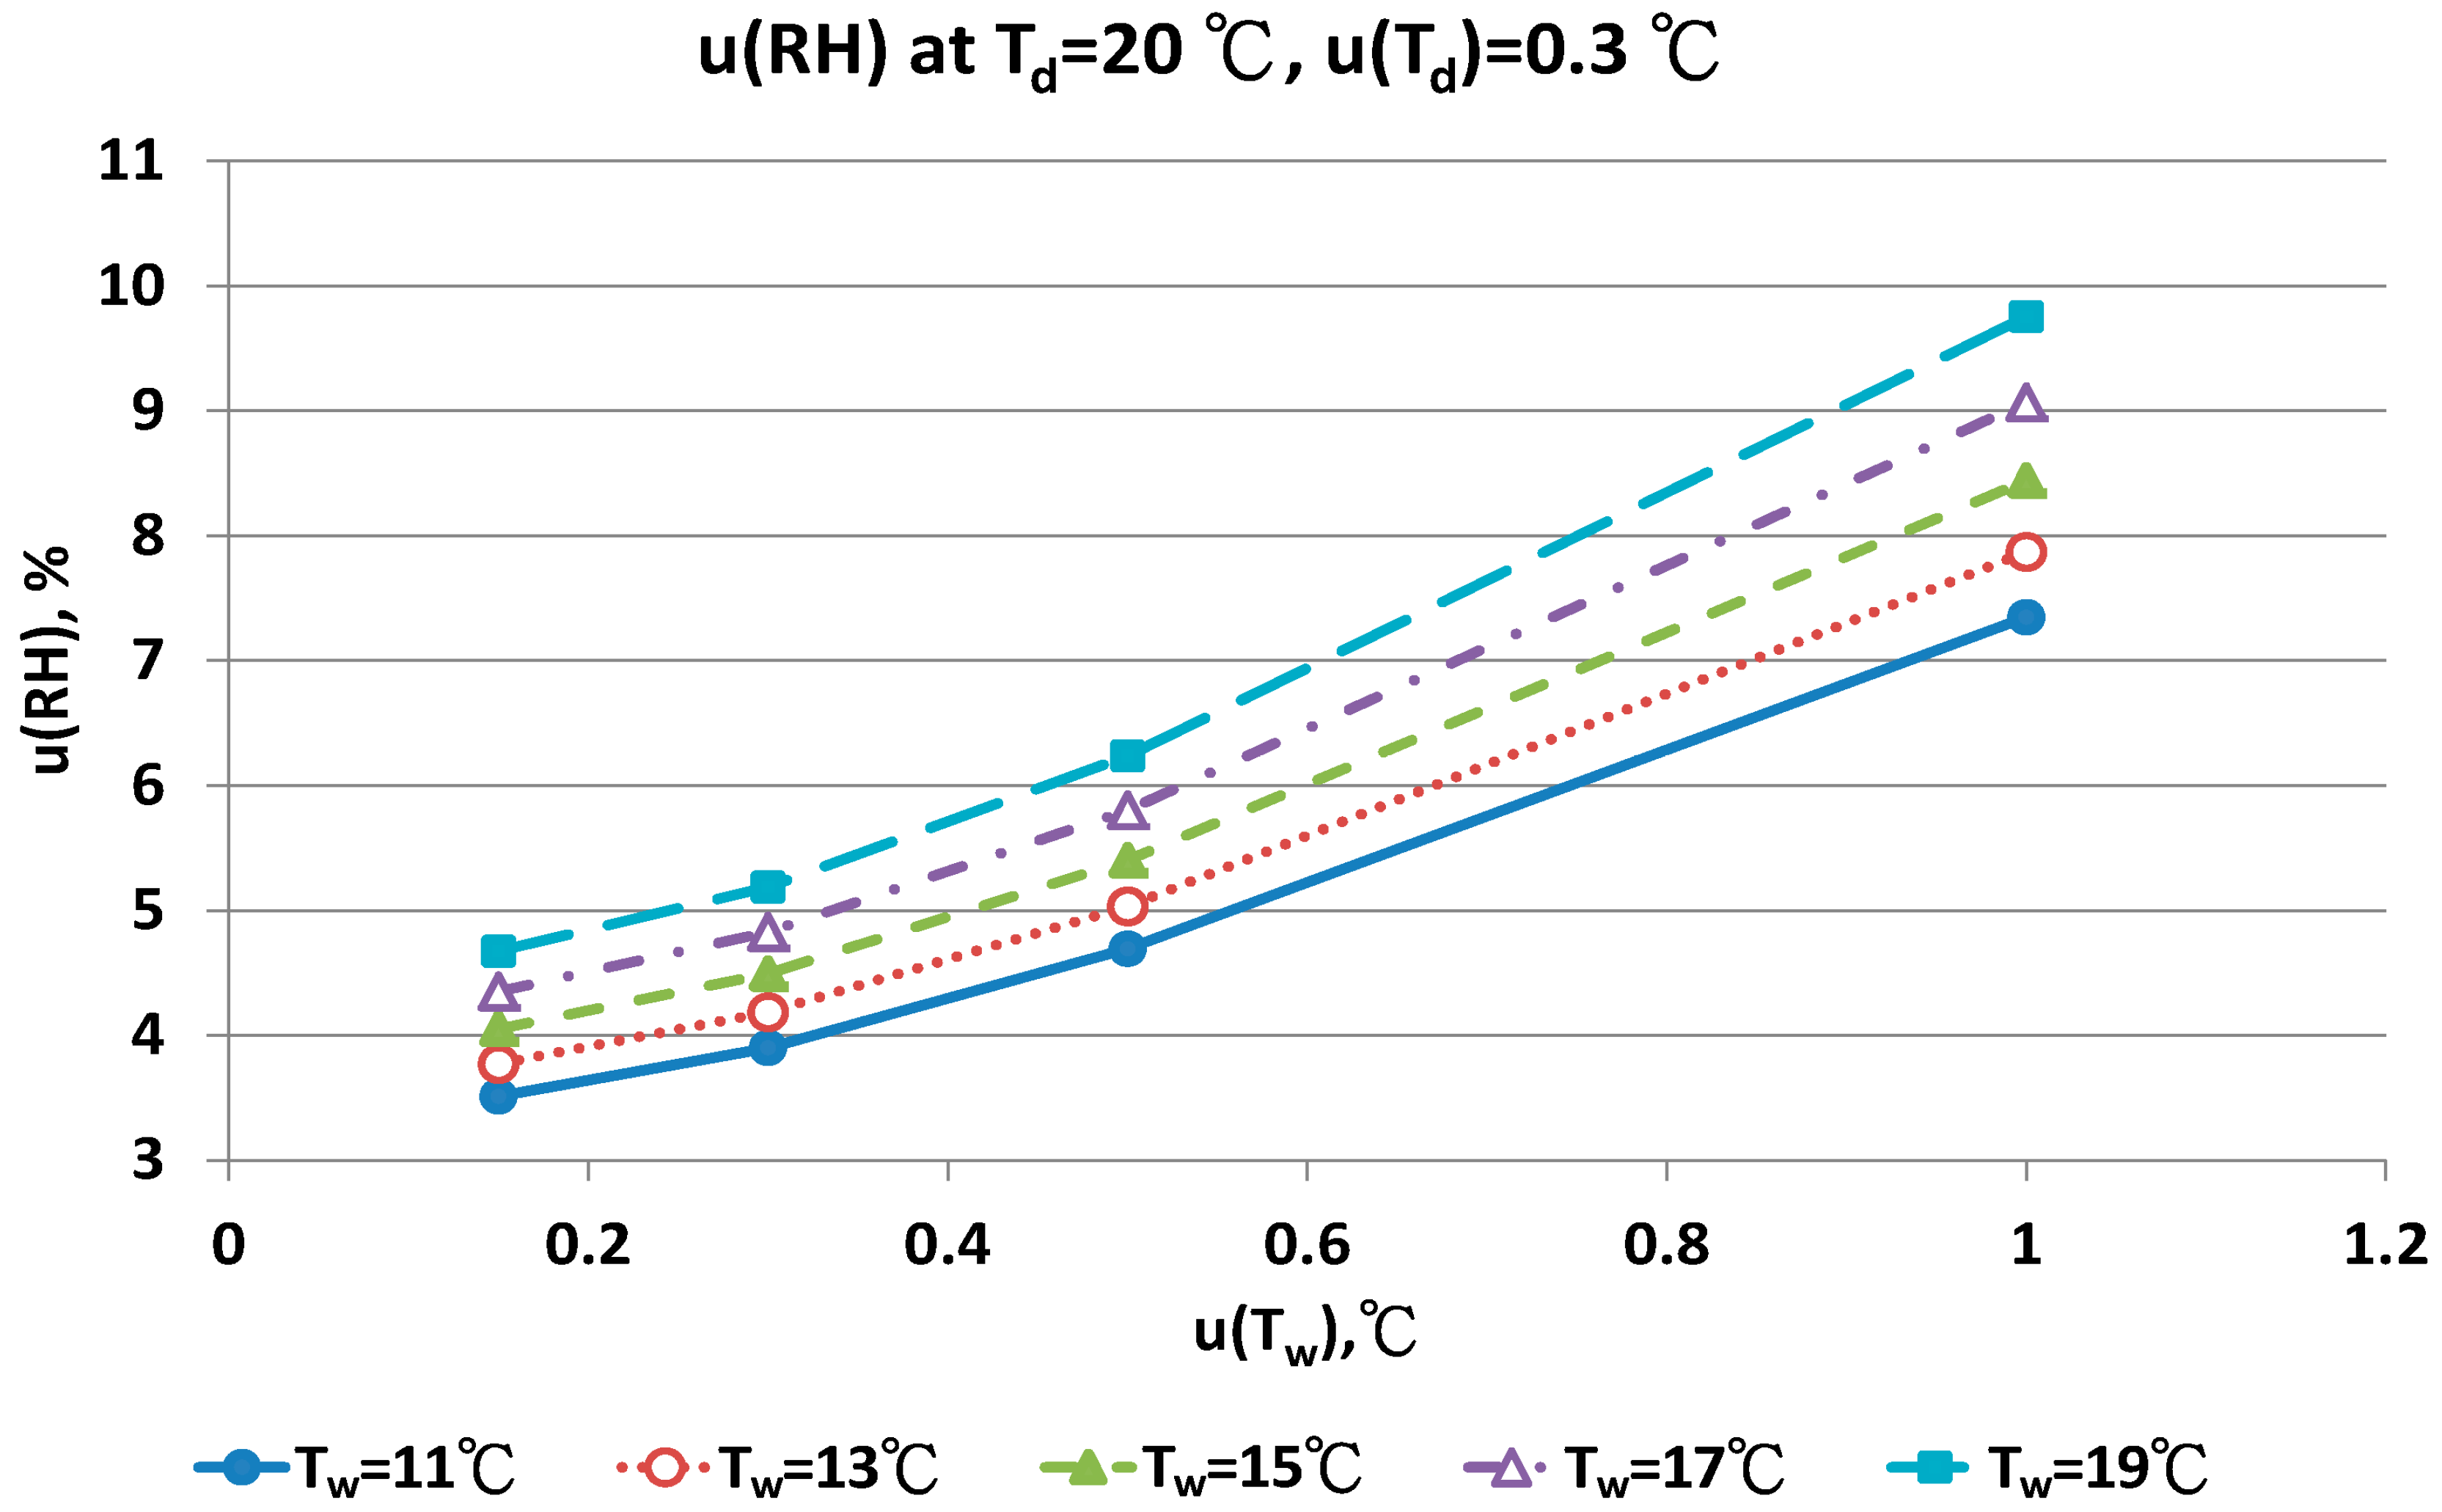
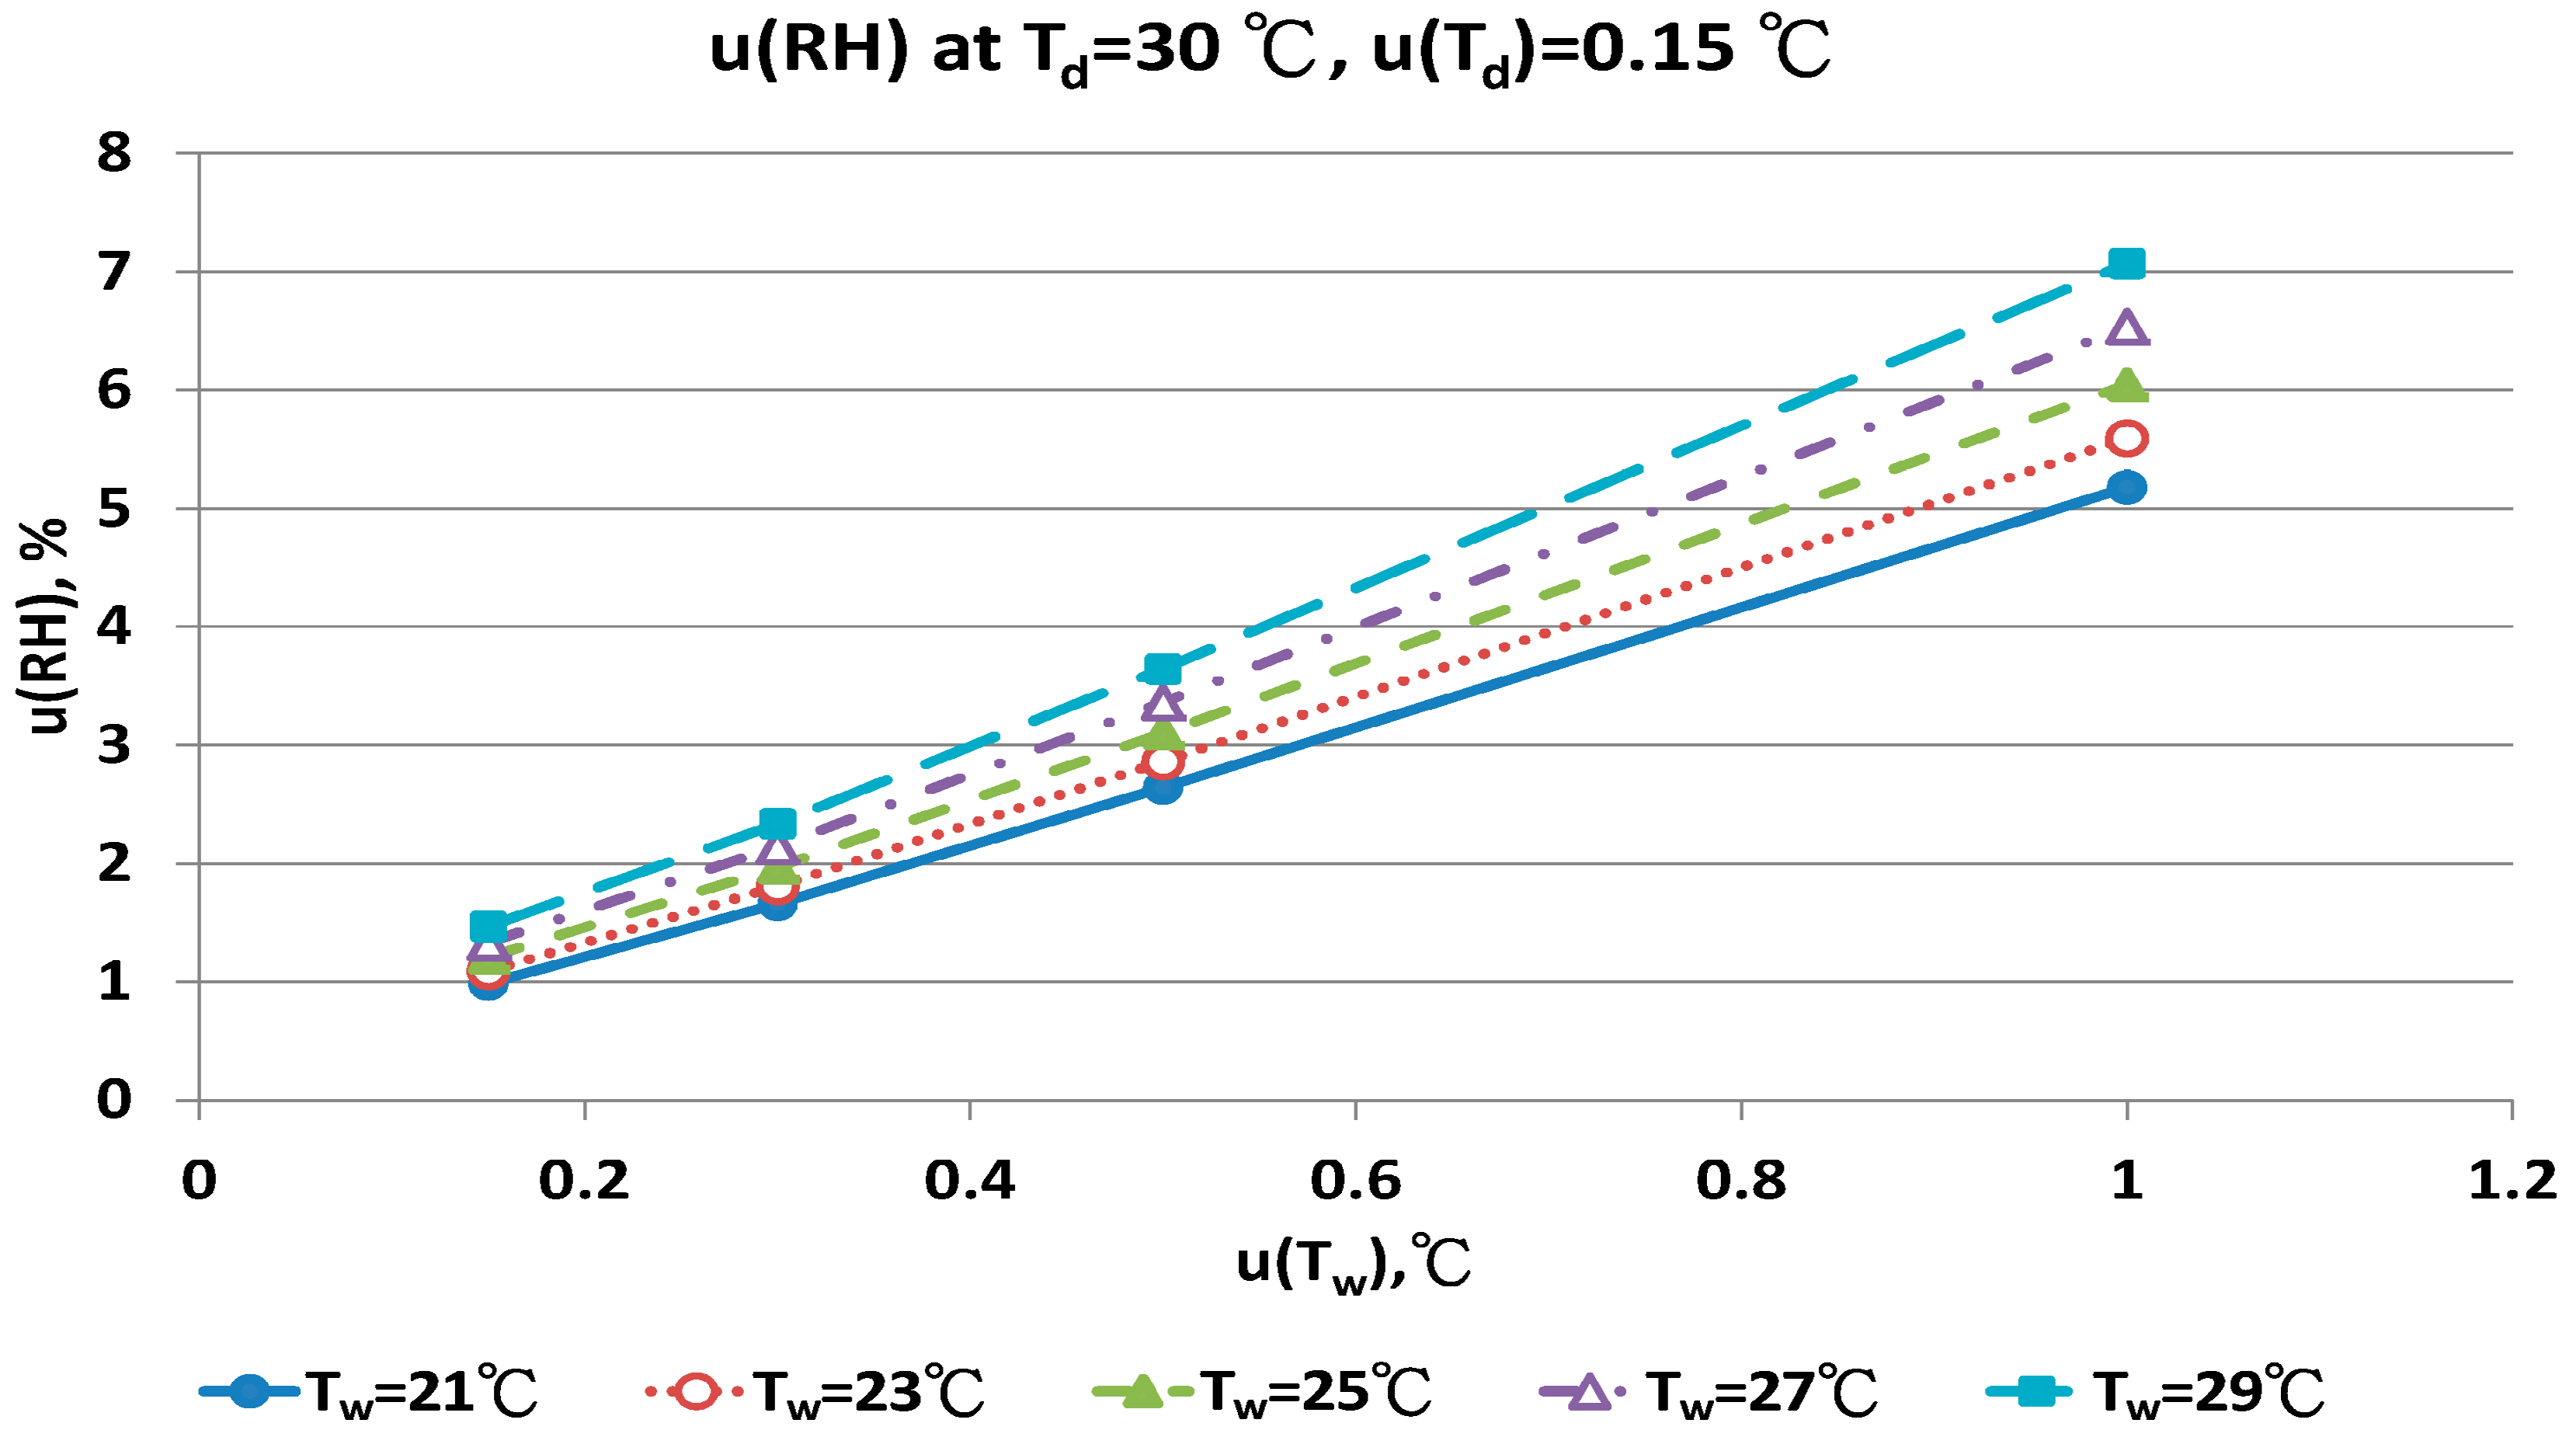
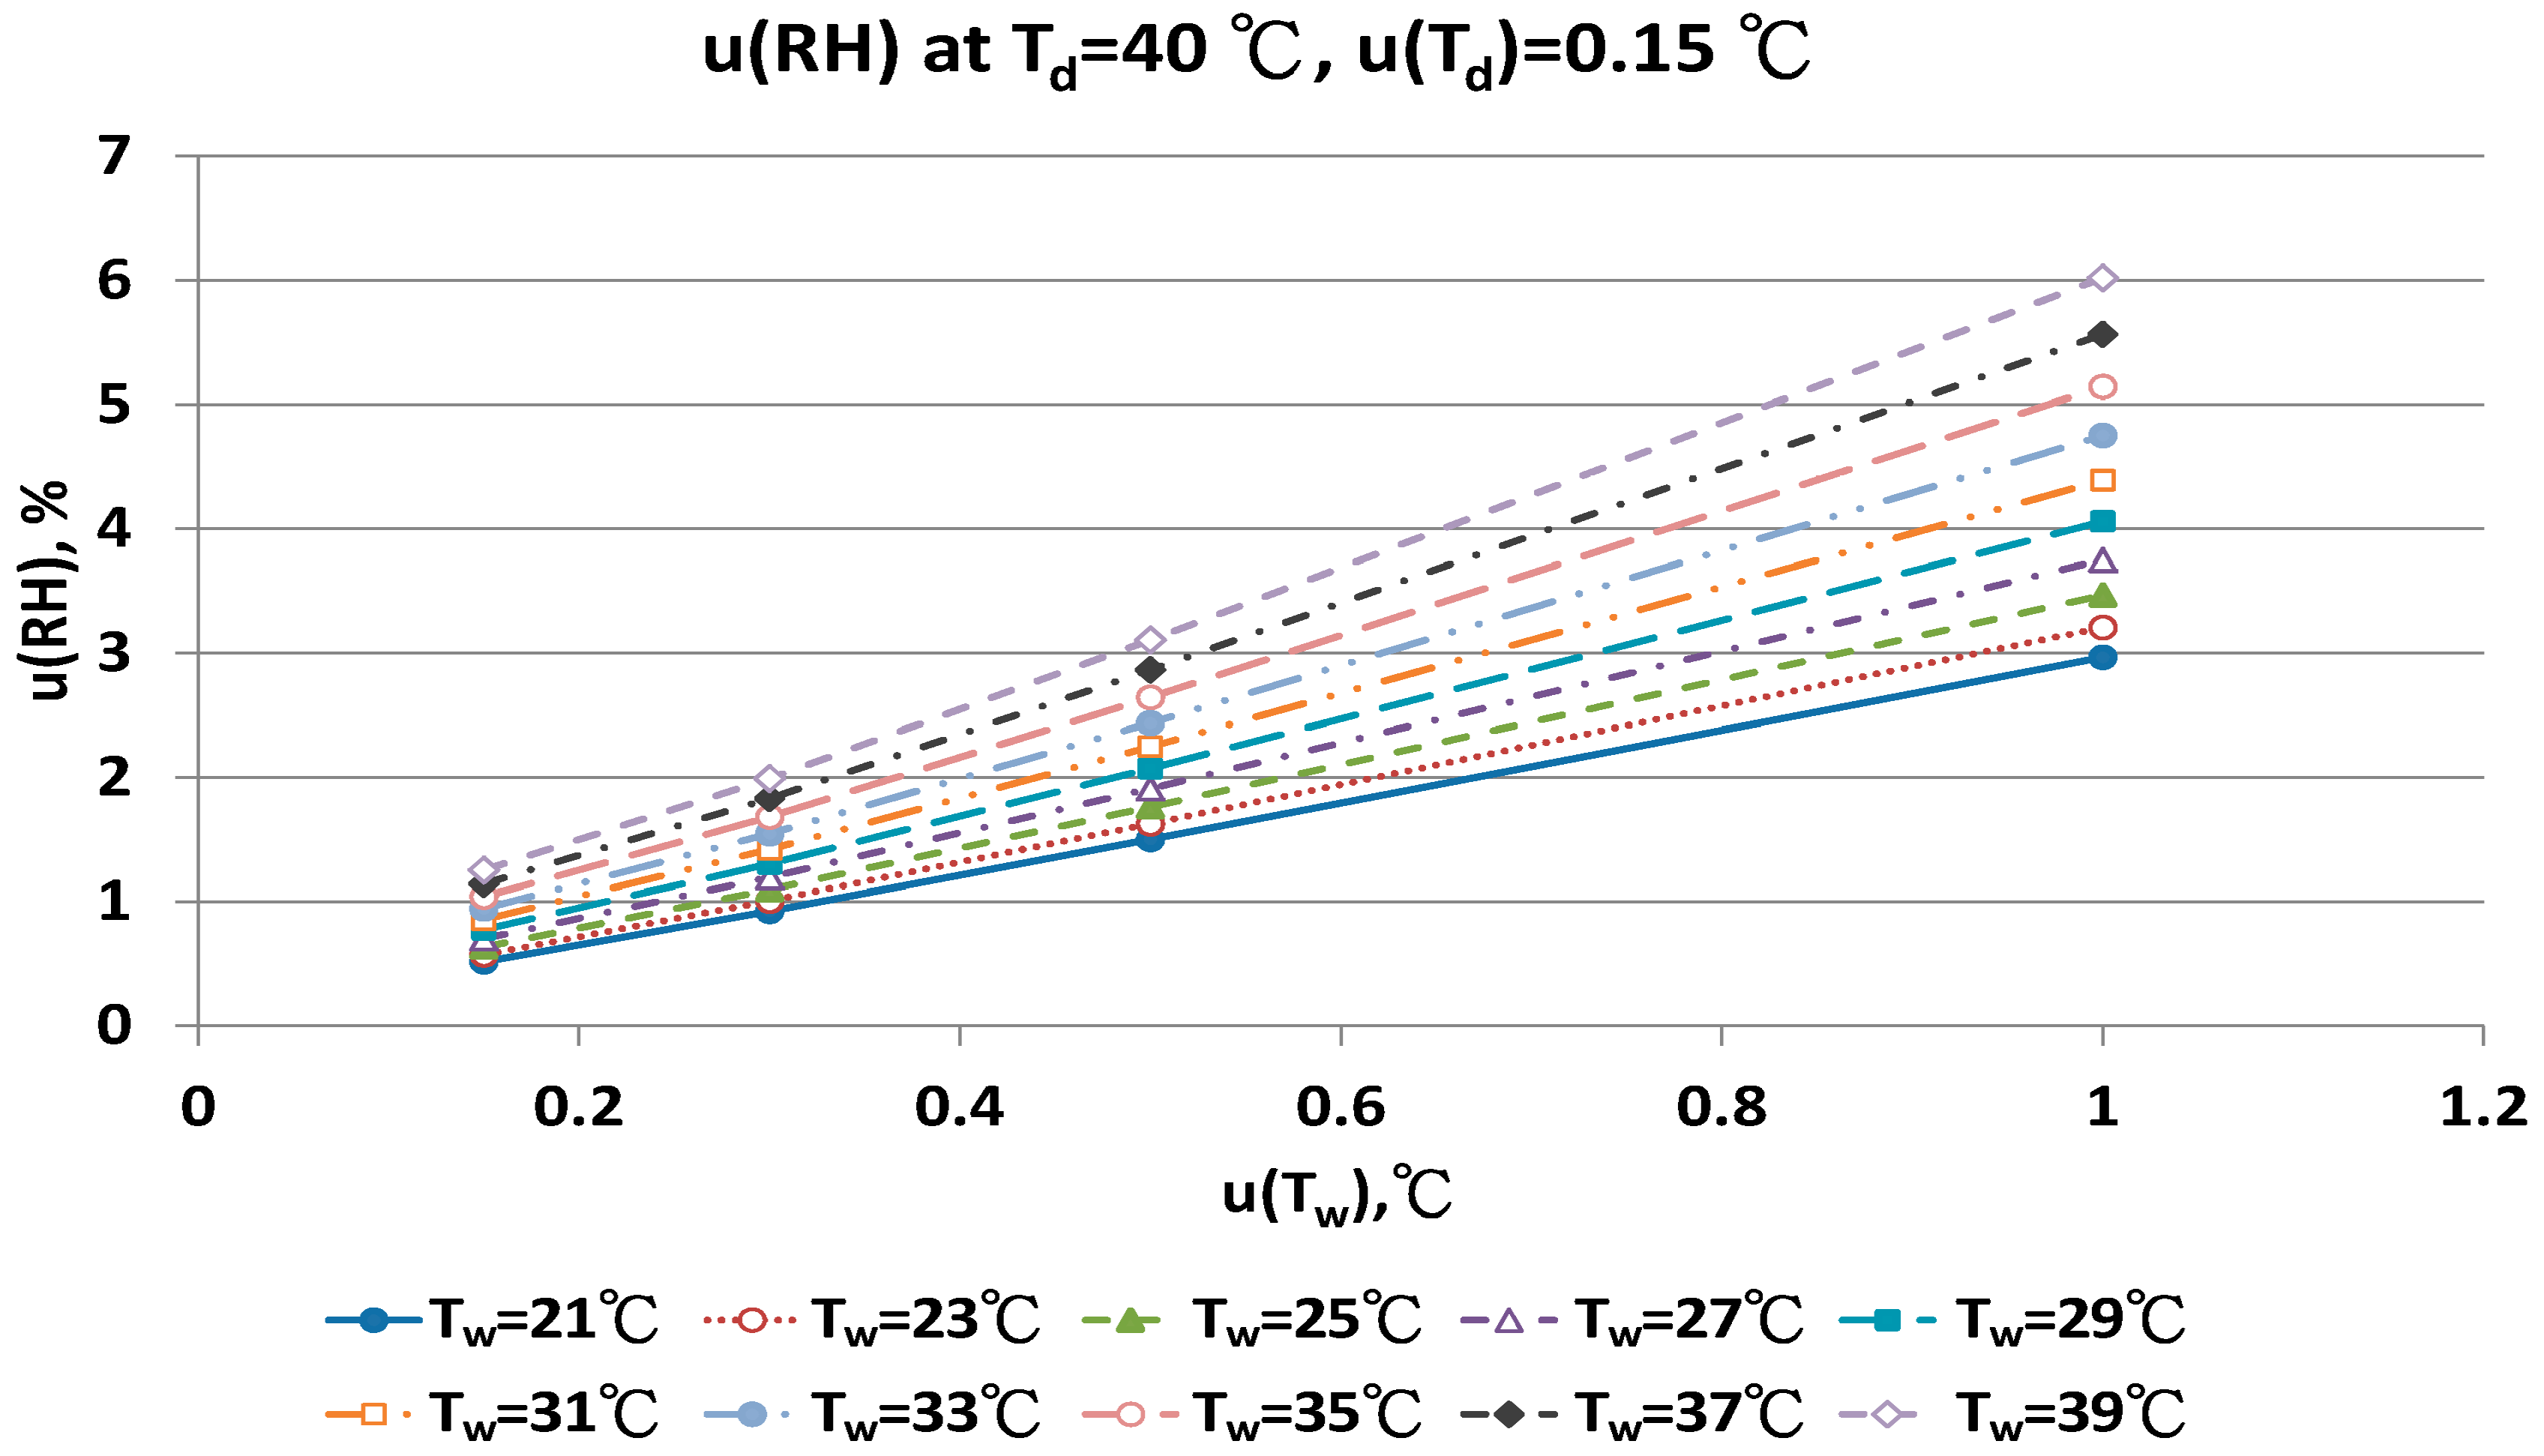
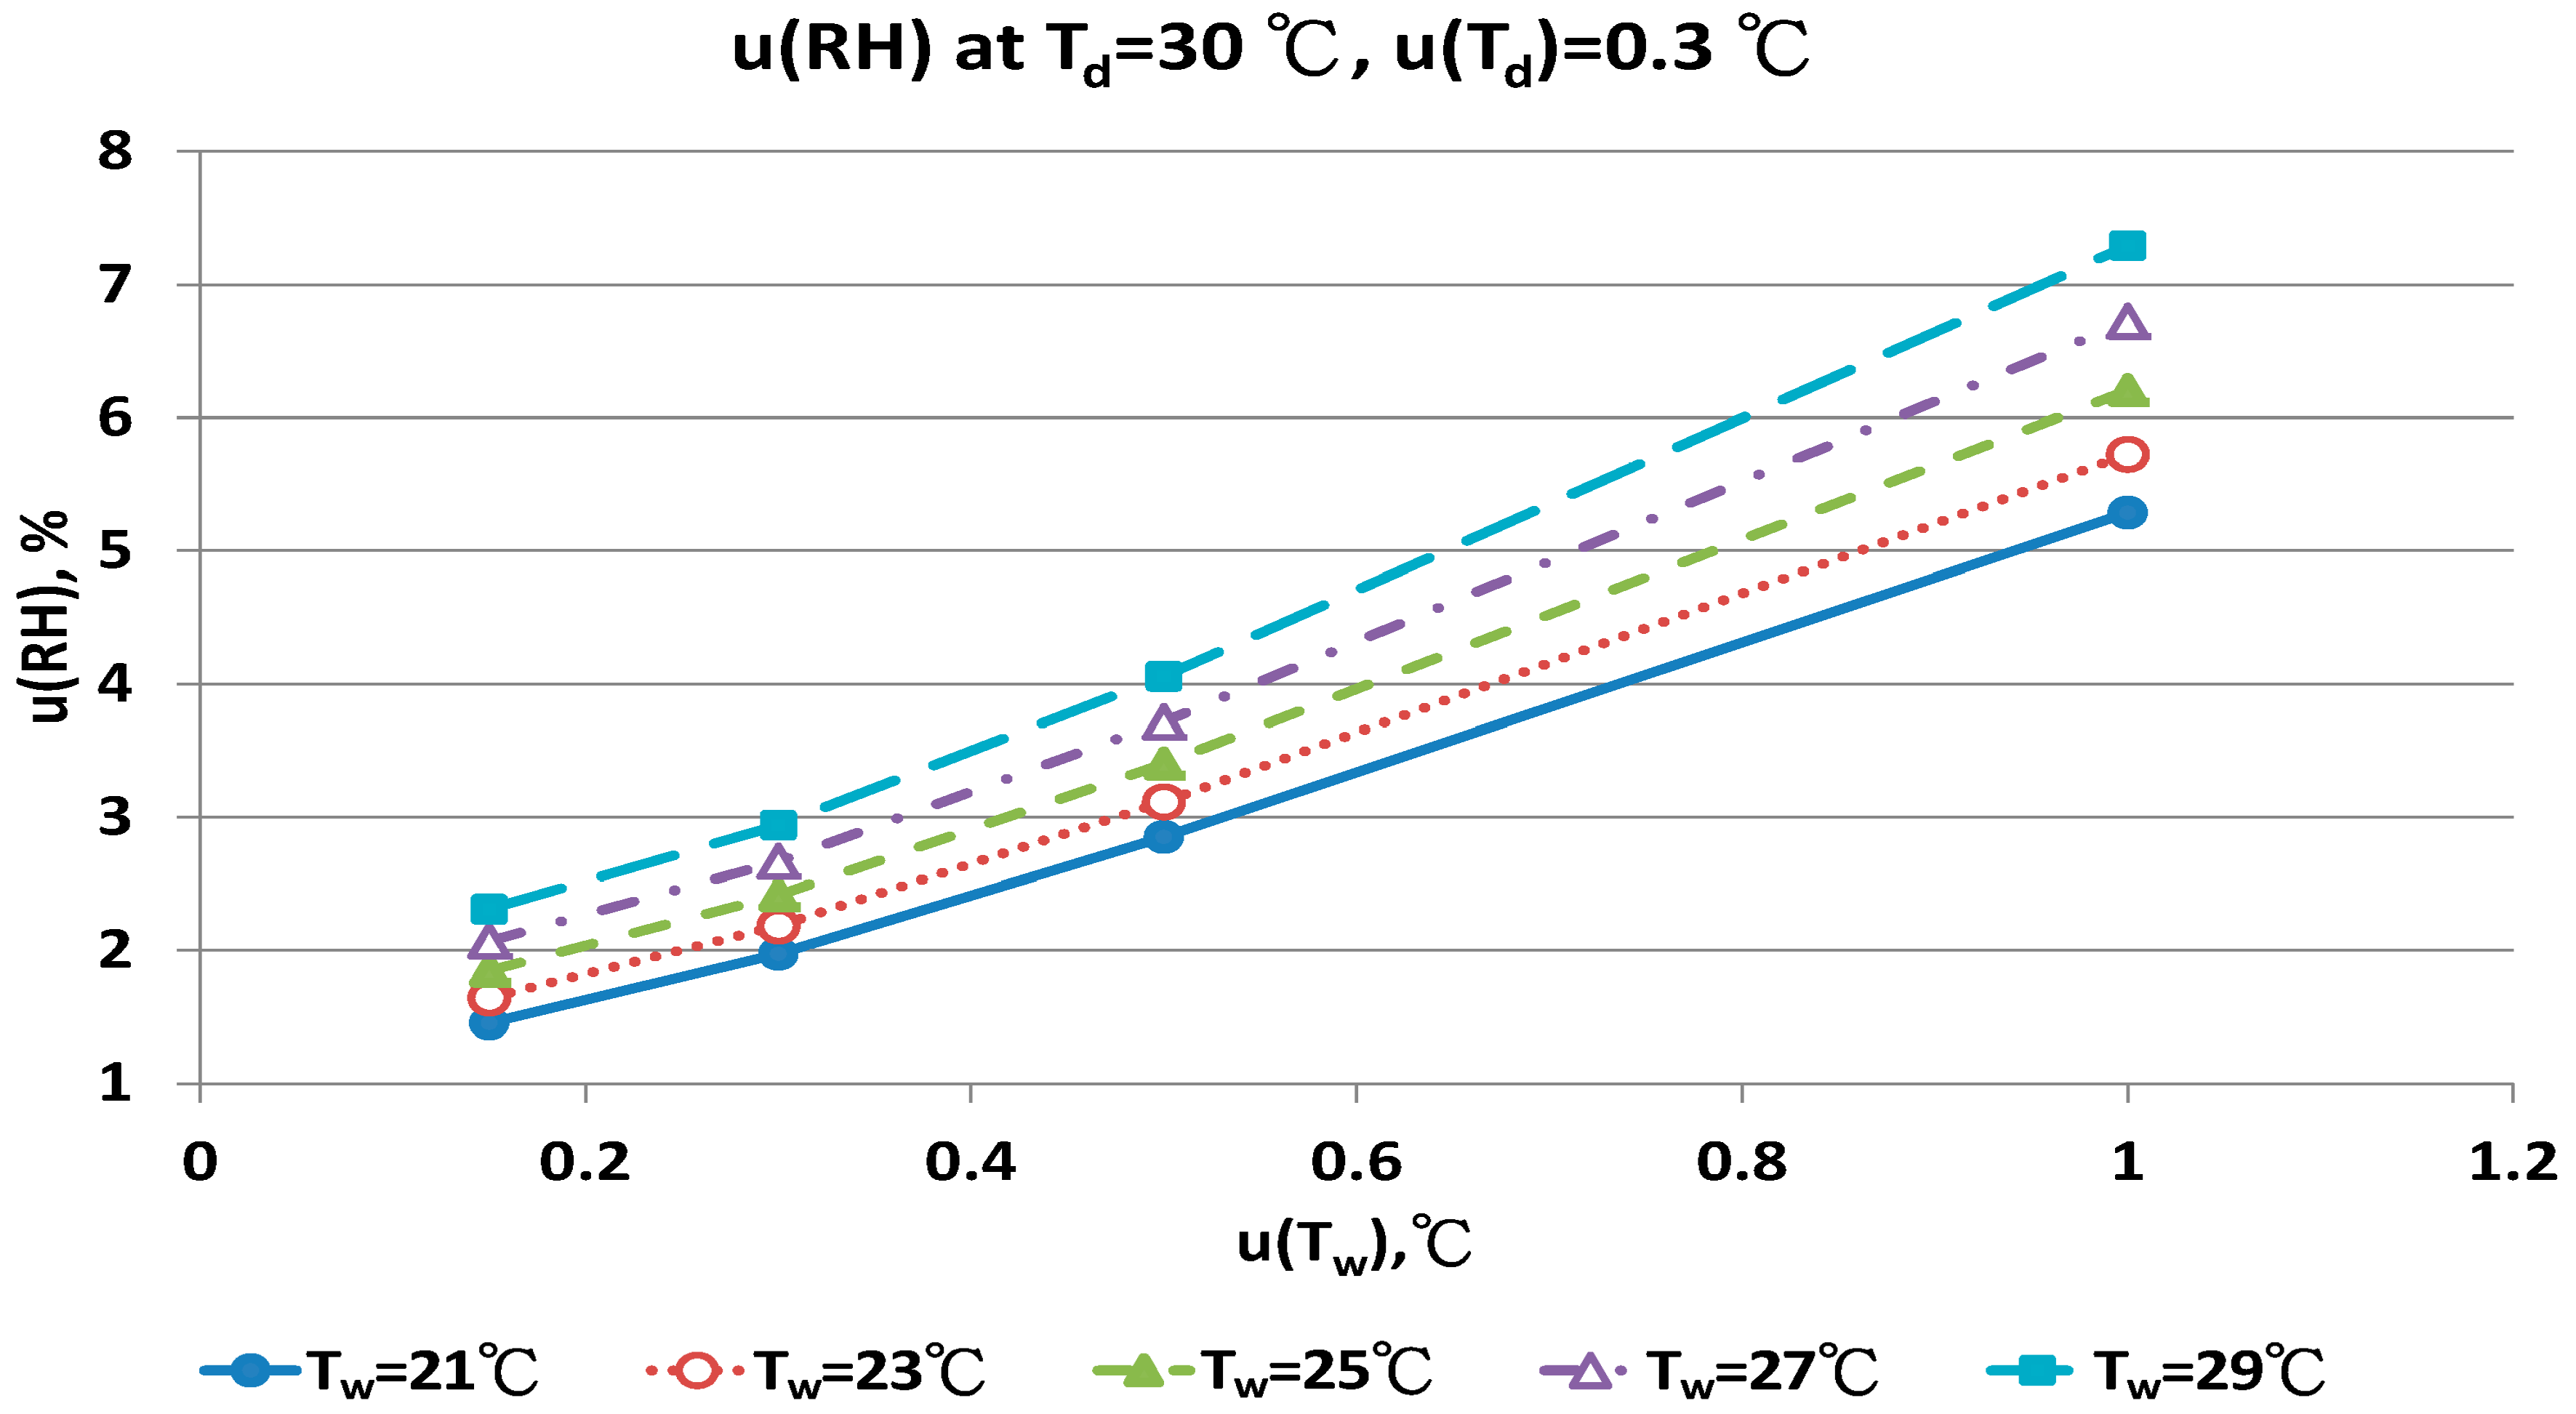
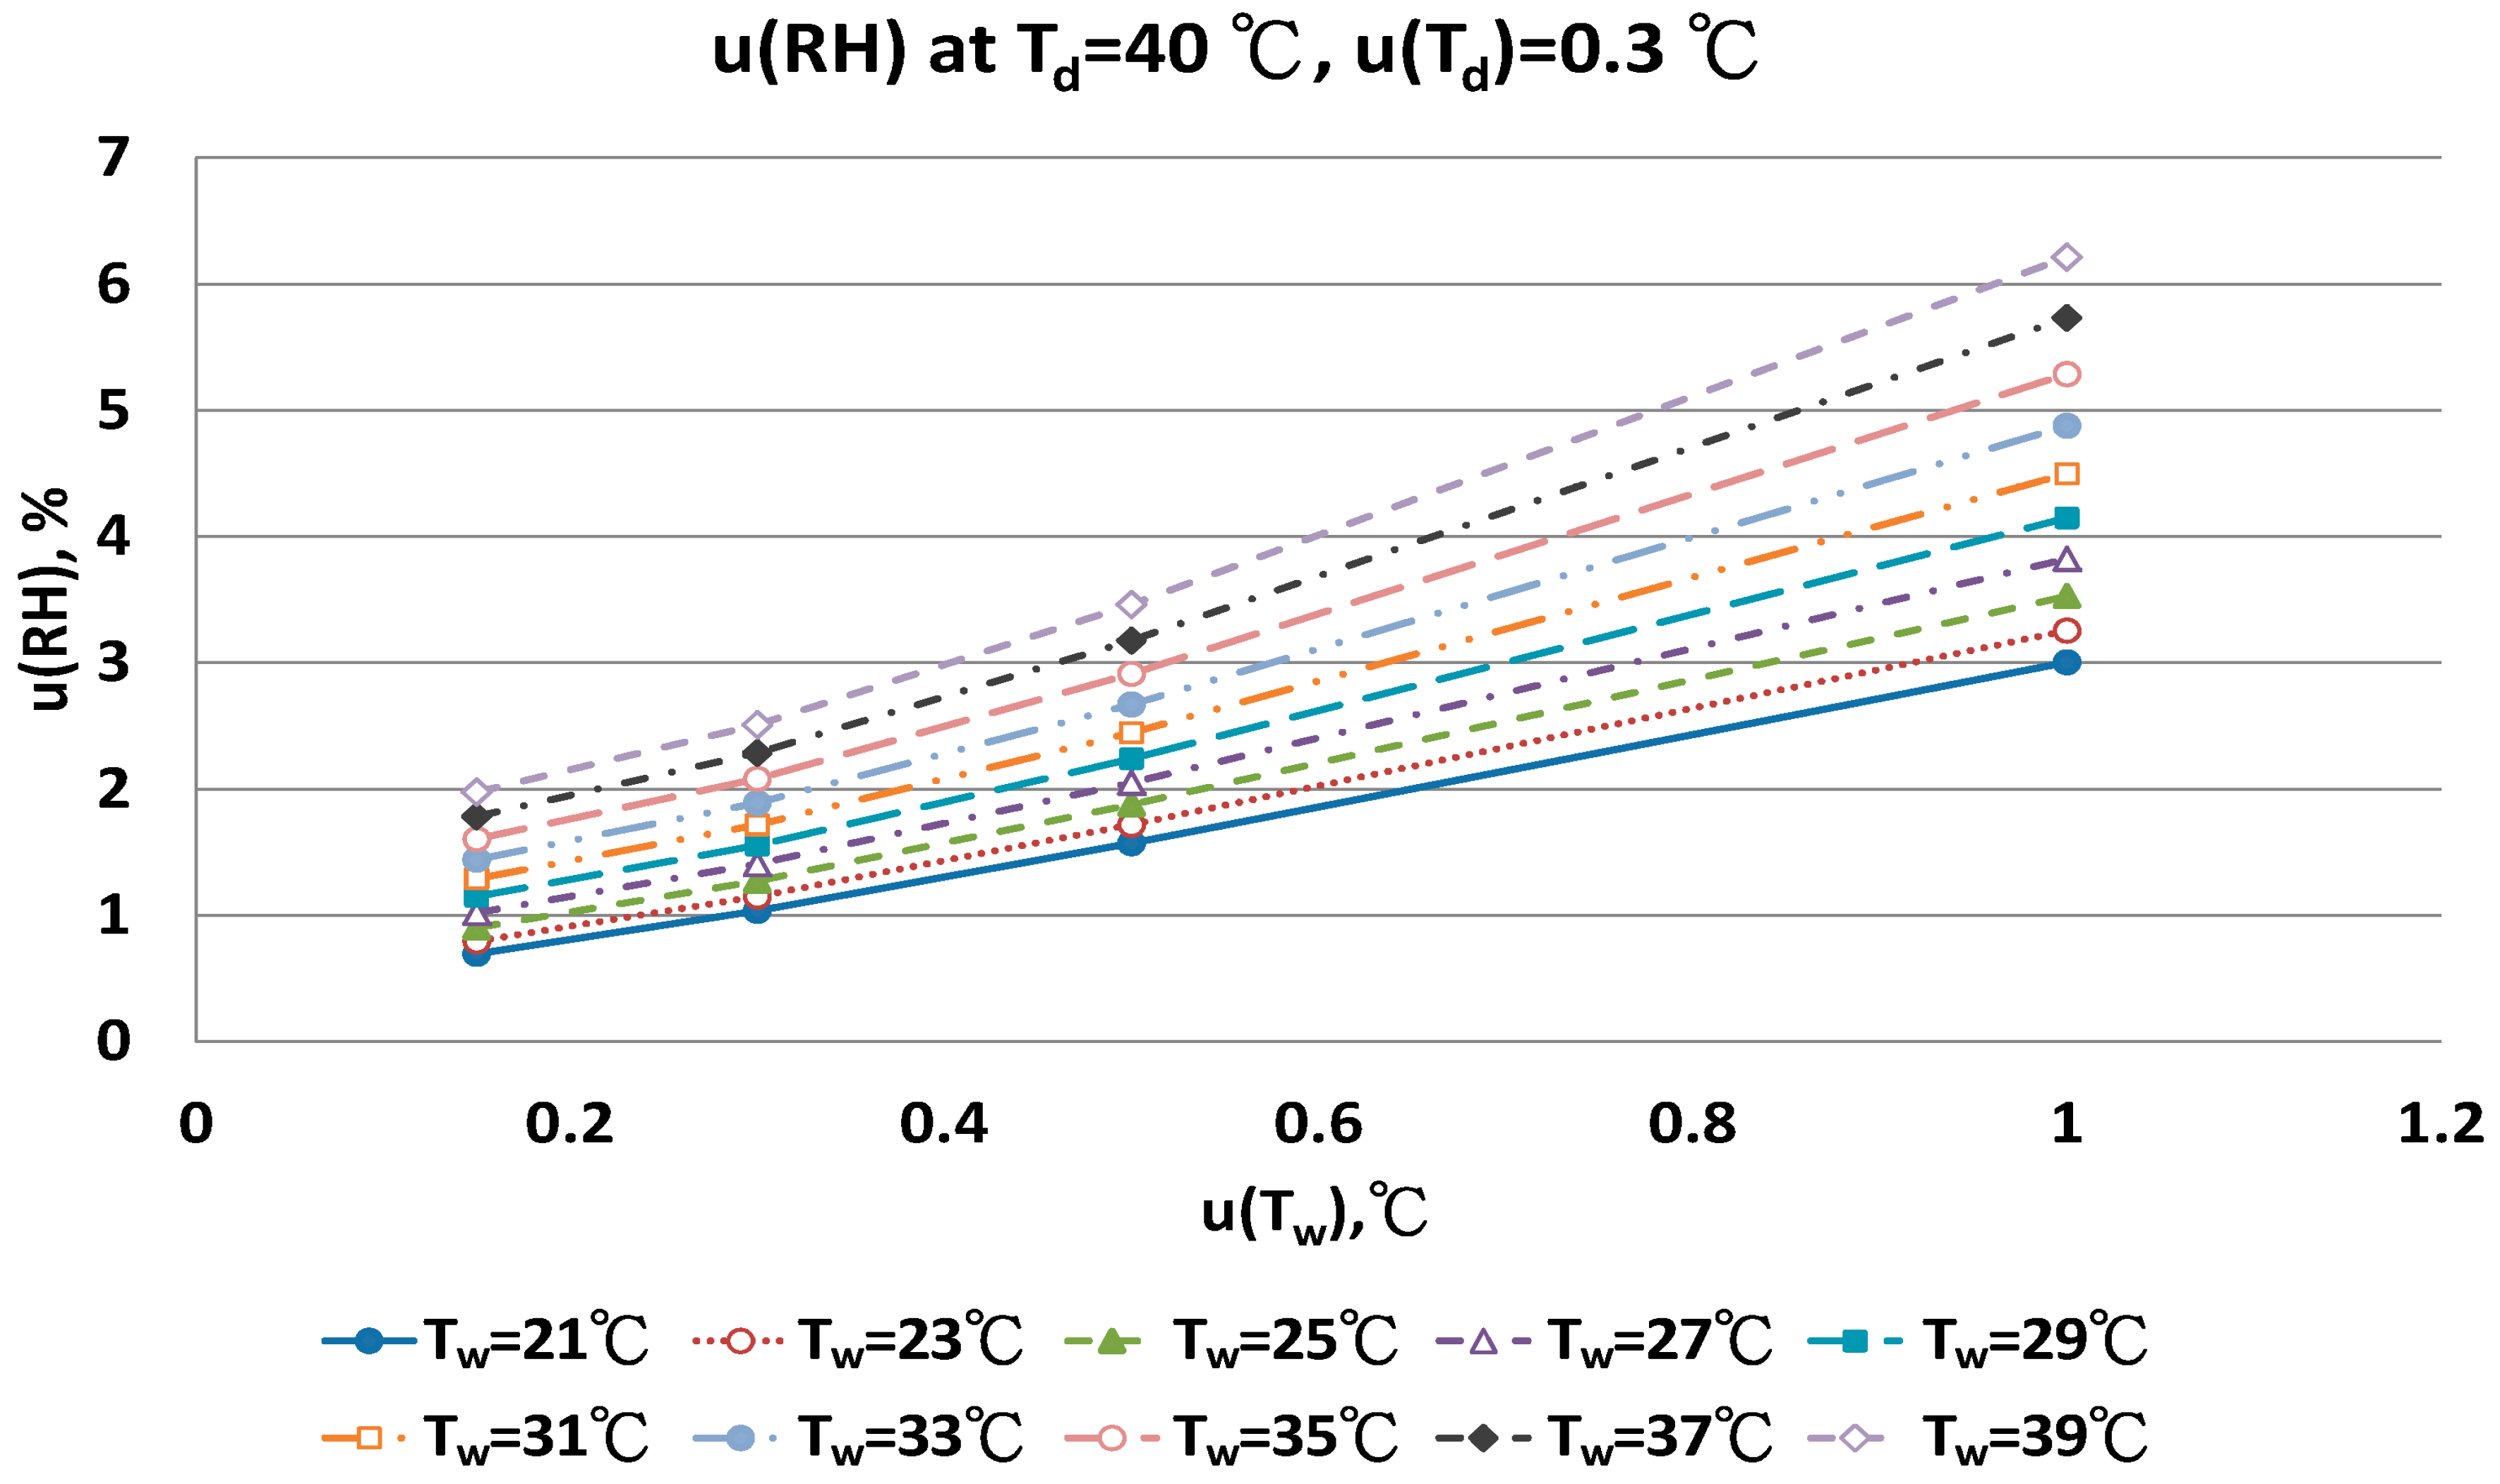
4.4. Measurement Uncertainty of Humidity Calculated by Td and Tw Values

The measurement uncertainty of humidity of a direct method has been investigated [11]. The evaluation of measurement uncertainty was studied with the new As equation developed in this study.
The typical uncertainty of a dry bulb thermometer, u(Td), carefully calibrated was 0.15 °C [33]. The estimated uncertainty of a wet bulb thermometer, u(Tw), ranged from 0.15 °C to 1.0 °C.
The combined uncertainty of the RH value, u(RH), evaluated by Equations (A5)–(A12) for four dry bulb temperatures with two uncertainties u(Td), 0.15 °C and 0.3 °C in different wet bulb temperatures, is in Figure 11, Figure 12, Figure 13, Figure 14, Figure 15, Figure 16, Figure 17 and Figure 18. The results of the calculation of u(RH) with other u(Td), 0.1 and 0.5, are available in supplemental information.
Figure 11 show that with increased uncertainty of the wet bulb thermometer, u(Tw) enhanced the combined uncertainties of u(RH). At the same u(Tw), higher wet bulb temperature induced larger u(RH) value.
With the smallest u(Tw) value, 0.1 °C, the combined uncertainty of u(RH) was 4.35% and 4.93% for the Tw at 6 °C and 14 °C, respectively. If the u(Tw) value was 0.5 °C, the u(RH) was 5.83% and 6.83% for the Tw at 6 °C and 14 °C, respectively. The uncertainty of u(Tw) affected the u(RH) value significantly. With the largest u(Tw), 1.0 °C, the largest uncertainty was 8.63% and 10.98%, respectively.
The contributions of u(Tw) are the performance of the sensor and the measurement technique for the wet bulb condition. If the uncertainty of wet bulb temperature was >0.5 °C, the u(RH) ranged from 5% to 11%. The measurement error of RH with the psychrometer was obvious. A similar result could be found for u(Td) = 0.3 °C. At the dry bulb temperature of 20 °C, the distribution of u(RH) in different wet bulb temperatures, u(Td) and u(Tw) values was similar to the results at 15 °C (Figure 13 and Figure 14). However, the numeric values of u(RH) were lower than the results at 15 °C. If the u(Td) and u(Tw) was 0.15 °C, the u(RH) was 3.24% and 3.87%, respectively. With the u(Td) = 0.15 °C and u(Tw) = 0.5 °C, the u(RH) ranged from 4.49% to 5.16% for different Tw values. At the worst conditions of u(Tw) = 1.0 °C, the u(RH) values ranged from 7.22% to 9.40%.
The u(RH) values for the Td at 30 °C in different Tw, u(Td) and u(Tw) values are in Figure 15 and Figure 16. With u(Td) and u(Tw) = 0.15 °C, the results for u(RH) ranged from 0.99% to 1.47%. With u(Tw) = 0.5 °C, the u(RH) ranged from 2.64% to 3.64%. At the worst conditions of u(Tw) = 1.0 °C, the u(RH) ranged from 5.18% to 7.07%. The RH values calculated by the new psychrometric equation with high dry bulb temperature had smaller u(RH) values.
The distribution of u(RH) of 40 °C Td in different u(Td), u(Tw) and Tw conditions are in Figure 17 and Figure 18. Nine Tw were considered. With u(Td) = 0.15 °C, the u(RH) ranged from 1.63% to 3.11% with u(Tw) = 0.5 °C, and from 2.97% to 6.02% with u(Tw) = 1.0 °C.
The u(RH) values at higher Td, 30 °C and 40 °C, were less than at Td 15 °C and 20 °C. The result confirmed that the new psychrometric As equation was adequate for RH measurement in high temperature.

5. Conclusions

This work investigated some empirical equations for calculating the relative humidity (RH) from indirect measurement of dry and aspirated wet bulb temperatures. The standard value for RH was obtained from the equations reported in the ASHRAE Handbook. The Penman equation had the best predictive ability among the six equations tested with dry bulb temperature ranging from 15 °C to 50 °C. Some equations with a linear relationship of psychrometer coefficients and wet bulb temperature did not have good predictive ability. At a fixed dry bulb temperature, the increase in wet bulb depression increased the errors. The psychrometer method is adequate for measuring high RH.
A relationship between the psychrometer constant As and dry and wet bulb temperature was established by regression analysis. The new As equation included the polynomial from of Tw. With this new As equation, the average predictive error was <0.1% RH.
The measurement uncertainty of RH calculated from dry and wet bulb temperature with this new As equation was evaluated. At the Td values of 10 °C and 25 °C, the combined uncertainty of RH values ranged from 3.2% to 4.0% with u(Tw) = 0.15 °C, 4.69% to 7.46% with u(Tw) = 0.5 °C and 6.5% to 11.0% with u(Tw) = 1.0 °C. At the Td values of 30 °C and 40 °C, the combined uncertainty of RH values ranged from 0.52% to 2.31% with u(Tw) = 0.15 °C, 1.72% to 4.06% with u(Tw) = 0.5 °C and 2.97% to 7.29% with u(Tw) = 1.0 °C.
The uncertainty of Tw had a significant effect on the combined uncertainty of RH. The uncertainty sources of Tw were performance of the thermometer and maintenance of wet bulb conditions. A quantification method was provided to evaluate measurement errors in calculating RH with dry and wet bulb temperatures.

Supplementary Materials

The following are available online at https://www.mdpi.com/1424-8220/17/2/368/s1, Figures S1–S8.

Acknowledgments

The authors would like to thank the National Science Council of the Republic of China for financially supporting this research under Contract No. NSC101-2313-B-005-027-MY3.

Author Contributions

Jiunyuan Chen reviewed the proposal, executed the statistical analysis, interpreted the results and revised the manuscript. Chiachung Chen drafted the proposal, performed some experiments, interpreted some results and read the manuscript critically and participated in its revision. All authors have read and approved the final manuscript.

Conflicts of Interest

The authors declare no conflict of interest.

Nomenclature

Apsychrometric coefficient °C−1·kPa−1
Aspsychrometric constant incorporated air atmosphere term, °C−1
evapor pressure, kPa
essaturated vapor pressure, kPa
Eerror of predictive performance, %
Emaxmaximum error of predictive performance, %
Eminminima error of predictive performance, %
| E | absolute error of predictive performance, %
| E | aveaverage of | E |
nnumber of data
Patmosphere air pressure, kPa
RHcalcalculated RH value from empirical equation
RHstastandard RH value from ASHRAE Handbook
Ttemperature of air, °C
Tddry bulb temperature, °C
Twwet bulb temperature, °C
u(RH)uncertainty of relative humidity
u(Td)uncertainty of dry bulb temperature
u(Tw)uncertainty of wet bulb temperature

Appendix A. Evaluation of the Measurement Uncertainty

The steps to evaluate uncertainty are as follows [28,29,30]:
1
Model the measurement
y is not measured directly and is determined from K quantities x 1 , x 2 , ...... x k ,
The functional relationship is as follows:
y = f ( x 1 , x 2 , ...... x k )
2
Ensure the uncertainty source x i and calculate the estimated values of x i
u c 2 [ y ] = i = 1 n [ y x i ] 2 u 2 ( x i )
where u c ( y ) is the combined uncertainty and y is the output quantity.
3
Evaluate the uncertainty classified as A and B types.
4
Estimate the covariance of each x i .
5
Calculate the sensitivity coefficient, c i
c i = f x i
6
Calculate the combining uncertainty and effective degree of freedom.
7
Determine a coverage factor and expanded uncertainty.
8
Report the uncertainty.
The uncertainty of RH value that calculated from Td and Tw values.
RH = P w P w s ( T d ) = P w s ( T w ) A s ( T d T w ) P w s ( T d )
By Equation (A2), the uncertainty of RH can be calculated follows:
u c 2 [ R H ] = ( R H T d ) 2 u 2 ( T d ) + ( R H T w ) 2 u 2 ( T w )
P w s ( T d ) T d = 2502.99   exp ( 17.2694   T d T d + 237.3 ) ( 1 T d + 237.3 ) 2
P w s ( T w ) T w = 2502.99   exp ( 17.2694   T w T w + 237.3 ) ( 1 T w + 237.3 ) 2
If As is a constant,
RH T w = 1 p w s ( T d ) [ p w s ( T w ) T w + A s ]   = 1 P w s ( T d ) [ P w s ( T w ) T w + A s ]
RH T d = 1 [ P w s ( T d ) ] 2 [ A s · p w s ( T d ) [ p w s ( T w ) A s ( T d T w ) ] P w s ( T d ) T d ]
If A s = C 0 + C 1 T w + C 2 T w 2 + C 3 T d ,
RH = 1 P w s ( T d ) [ p w s ( T w ) ( C 0 + C 1 T w + C 2 T w 2 + C 3 T d ) ( T d T w ) ]
RH T w = 1 P w s ( T d ) { P w s ( T w ) T w 2 ( C 2 T w + C 1 ) ( T d T w ) + C 2 T w 2 + C 3 T d + C 1 T w + C 0 }
RH T d = 1 [ P w s ( T d ) ] 2 { [ C 3 ( T d T w ) + ( C 0 + C 1 T w + C 2 T w 2 + C 3 T d ) p w s ( T d ) ]     P w s ( T d ) T d [ p w s ( T w ) ( C 0 + C 1 T w + C 2 T w 2 + C 3 T d ) ( T d T w ) ] }

References

  1. Wernecke, R.; Wernecke, J. Industrial Moisture and Humidity Measurement: A Practical Guide; Wiley: Hoboken, NJ, USA, 2014. [Google Scholar]
  2. EN 15251. Indoor Environmental Input Parameters for Design and Assessment of Energy Performance of Buildings Addressing Indoor Air Quality, Thermal Environment, Lighting and Acoustics; European Committee for Standardization: Brussels, Belgium, 2007. [Google Scholar]
  3. ASHRAE. The ASHRAE Guide for Buildings in Hot and Humid Climates; ASHRAE: Atlanta, GA, USA, 2009. [Google Scholar]
  4. D’Ambrosio Alfano, F.; Malchaire, J.; Palella, B.I.; Riccio, G. The WBGT index revisited after 60 years of use. Ann. Occup. Hyg. 2014, 58, 955–970. [Google Scholar] [PubMed]
  5. Kjellstrom, T.; Holmér, I.; Lemke, B. Workplace heat stress, health and productivity an increasing challenge for low and middle-income countries during climate change. Glob. Health Action 2009, 2, 1–6. [Google Scholar] [CrossRef] [PubMed]
  6. Dell'Isola, M.; Frattolillo, A.; Palella, B.I.; Riccio, G. Influence of measurement uncertainties on the thermal environment assessment. Int. J. Thermophys. 2012, 33, 1616–1632. [Google Scholar] [CrossRef]
  7. D’Ambrosio Alfano, F.; Palella, B.I.; Riccio, G. The role of measurement accuracy on the heat stress assessment according to ISO 7933: 2004. WIT Trans. Biomed. Health 2007, 11, 115–124. [Google Scholar]
  8. Wiederhold, P.R. Water Vapor Measurement; Marcel Dekker, Inc.: New York, NY, USA, 1997. [Google Scholar]
  9. Pallas-Areny, R.; Webster, J.G. Sensors and Signal Conditioning; John Wiley & Sons: New York, NY, USA, 2001. [Google Scholar]
  10. Fleming, R.J. A note on temperature and relative humidity corrections for humidity sensors. J. Atmos. Ocean. Technol. 1998, 15, 1511–1515. [Google Scholar] [CrossRef]
  11. Lu, T.; Chen, C. Uncertainty evaluation of humidity sensors calibrated by saturated salt solutions. Measurement 2007, 40, 591–599. [Google Scholar] [CrossRef]
  12. ISO. Ergonomics of the Thermal Environment: Instruments for Measuring Physical Quantities; ISO: Geneva, Switzerland, 2002. [Google Scholar]
  13. D’Ambrosio Alfano, F.; Palella, B.I.; Riccio, G. On the problems related to natural wet bulb temperature indirect evaluation for the assessment of hot thermal environments by means of WBGT. Ann. Occup. Hyg. 2012, 56, 1063–1079. [Google Scholar] [PubMed]
  14. ASHRAE. Brochure on Psychrometer; ASHRAE: Atlanta, GA, USA, 1977. [Google Scholar]
  15. ASHRAE. ASHRAE Handbook: Fundamentals; ASHRAE: Atlanta, GA, USA, 2013. [Google Scholar]
  16. Singh, A.K.; Singh, H.; Singh, S.P.; Sawhney, R.L. Numerical calculation of psychrometric properties on a calculator. Build. Environ. 2002, 37, 415–419. [Google Scholar] [CrossRef]
  17. Bahadori, A.; Zahedi, G.; Zendehboudi, S.; Hooman, K. Simple predictive tool to estimate relative humidity using wet bulb depression and dry bulb temperature. Appl. Therm. Eng. 2013, 50, 511–515. [Google Scholar] [CrossRef]
  18. Harrison, R.G.; Wood, C.R. Ventilation effects on humidity measurements in thermometer screens. Q. R. Meteorol. Soc. 2012, 138, 1114–1120. [Google Scholar] [CrossRef]
  19. Ustymczuk, A.; Giner, S.A. Relative humidity errors when measuring dry and wet bulb temperatures. Biosyst. Eng. 2012, 110, 106–111. [Google Scholar] [CrossRef]
  20. Mathioulakis, E.; Panaras, G.; Belessiotis, V. Estimation of uncertainties in indirect humidity measurements. Energy Build. 2011, 43, 2806–2812. [Google Scholar] [CrossRef]
  21. The Sensirion Company. Introduction to Humidity—Basic Principles on Physics of Water Vapor; The Sensirion Company: Staefa, Switzerland, 2009. [Google Scholar]
  22. Penman, H.L. Humidity; Reinhold Publishing Co.: New York, NY, USA, 1958. [Google Scholar]
  23. Goff, J.A.; Gratch, S. Thermodynamic properties of moist air. Trans. ASHVE 1945, 51, 125–164. [Google Scholar]
  24. British United Turkeys Ltd. Measurement of Incubation Humidity; British United Turkeys Ltd.: Cheshire, UK, 2005. [Google Scholar]
  25. Harrison, L.D. Fundamental Concepts and Definitions Relating to Humidity. In Humidity and Moisture; Wexler, A., Ed.; Reinhold Publishing Co.: New York, NY, USA, 1963; Volume 3. [Google Scholar]
  26. WMO. Guide to Meteorological Instruments and Methods of Observation; WMO-No. 8; World Meteorological Organisation: Geneva, Switzerland, 2006. [Google Scholar]
  27. De, B.; Neiva, A.C.; dos Reis, E.; Sanchez, C.G. Calibration and Validation of a New Aspirated Psychrometer for Technological Development of Humidifier. In Proceedings of the XVIII IMEKO World Congress, Rio de Janeiro, Brazil, 17–22 September 2006.
  28. ISO/IEC 98–3. Uncertainty of Measurement—Part 3: Guide to the Expression of Uncertainty in Measurement; ISO Edition: Geneva, Switzerland, 2010. [Google Scholar]
  29. National Aeronautics and Space Administration. Measurement Uncertainty Analysis Principles and Methods, NASA Measurement Quality Assurance Handbook—Annex 3; National Aeronautics and Space Administration: Washington, DC, USA, 2010.
  30. Grabe, M. Measurement Uncertainties in Science and Technology, 2nd ed.; Springer: Heidelberg, Germany, 2005. [Google Scholar]
  31. Barber, E.M.; Gu, D. Performance of an aspirated psychrometer and three hygrometers in livestock barns. Appl. Eng. Agric. 1988, 5, 595–599. [Google Scholar] [CrossRef]
  32. Simoes-Moreira, J.R. A thermodynamic formulation of the psychrometer constant. Meas. Sci. Technol. 1999, 10, 302–311. [Google Scholar] [CrossRef]
  33. Chen, C. Evaluation of measurement uncertainty for thermometers with calibration equations. Accredit. Qual. Assur. 2006, 11, 75–82. [Google Scholar] [CrossRef] [Green Version]
Figure 1. Experimental setup used for measurements (the figure is not to real scale).
Sensors 17 00368 g001
Figure 2. Wet bulb temperature readings with time. (a) wind velocity 1 m/s; (b) wind velocity 2 m/s; (c) wind velocity 3 m/s; (d) wind velocity 4 m/s; (e) wind velocity 5 m/s.
Sensors 17 00368 g002aSensors 17 00368 g002bSensors 17 00368 g002c
Figure 3. Error distribution of the Penman equation for dry bulb temperature <30 °C.
Sensors 17 00368 g003
Figure 4. Error distribution of the Penman equation for dry bulb temperature >30 °C.
Sensors 17 00368 g004
Figure 5. Error distribution of the WMO equation for dry bulb temperature <30 °C.
Sensors 17 00368 g005
Figure 6. Error distribution of the WMO equation for dry bulb temperature >30 °C.
Sensors 17 00368 g006
Figure 7. The relationship between As and wet-bulb temperatures with dry bulb temperature <30 °C.
Sensors 17 00368 g007
Figure 8. The relationship between As and wet-bulb temperatures with dry bulb temperature >30 °C.
Sensors 17 00368 g008
Figure 9. Error distribution of the new As equation with dry bulb temperature <30 °C.
Sensors 17 00368 g009
Figure 10. Error distribution of the new As equation with dry bulb temperature >30 °C.
Sensors 17 00368 g010
Figure 11. Uncertainties of relative humidity calculated with Equation (9) at Td = 15 °C, u(Td) = 0.15 °C, Tw = 6~14 °C and u(Tw) = 0.1~1 °C.
Sensors 17 00368 g011
Figure 12. Uncertainties of relative humidity calculated with Equation (9) at Td = 15 °C, u(Td) = 0.30 °C, Tw = 6~14 °C and u(Tw) = 0.1~1 °C.
Sensors 17 00368 g012
Figure 13. Uncertainties of relative humidity calculated with Equation (10) at Td = 20 °C, u(Td) = 0.15 °C, Tw = 11~19 °C and u(Tw) = 0.1~1 °C.
Sensors 17 00368 g013
Figure 14. Uncertainties of relative humidity calculated with Equation (10) at Td = 20 °C, u(Td) = 0.3 °C, Tw = 11~19 °C and u(Tw) = 0.1~1 °C.
Sensors 17 00368 g014
Figure 15. Uncertainties of relative humidity calculated with Equation (10) at Td = 30 °C, u(Td) = 0.15 °C, Tw = 21~29 °C and u(Tw) = 0.1~1 °C.
Sensors 17 00368 g015
Figure 16. Uncertainties of relative humidity calculated with Equation (10) at Td = 30 °C, u(Td) = 0.3 °C, Tw = 21~29 °C and u(Tw) = 0.1~1 °C.
Sensors 17 00368 g016
Figure 17. Uncertainties of relative humidity calculated with Equation (10) at Td = 40 °C, u(Td) = 0.15 °C, Tw = 21~39 °C and u(Tw) = 0.1~1 °C.
Sensors 17 00368 g017
Figure 18. Uncertainties of relative humidity calculated with Equation (10) at Td = 40 °C, u(Td) = 0.3 °C, Tw = 21~39 °C and u(Tw) = 0.1~1 °C.
Sensors 17 00368 g018
Table 1. Empirical equations used in this study.
1Penman equation [22]
Pw = Pws (Tw) − 0.0664 × (Td – Tw)
2Goft-Cratch equation [23]
Pw = Pws (Tw) − 0.067193 × (Td – Tw)
3British United Turkeys (BUT) equation [24]
Pw = Pws (Tw) − 0.066 × (Td – Tw)
4Harrison equation [25]
Pw = Pws (Tw) − 0.067 × (1 + 0.00115Tw) × (Td – Tw)
5World meteorological Organisation (WMO) equation [26]
Pw = Pws (Tw) − 0.0662795 × (1 + 0.000944Tw) × (Td – Tw)
6Nevia et al. equation [27]
Pw = Pws (Tw) − 0.0647164 × (1 + 0.00504Tw) × (Td – Tw)
Table 2. Criteria for the evaluating six empirical equations for calculating relative humidity.
Temp. (°C)CriteriaAs (This Study) °C−1PenmanBUTGoff-CratchHarrisonWMONeiva et al.
15Emin−0.00320.02780.03360.05100.27830.05080.1171
Emax0.04760.53210.62590.10410.94830.68080.8323
| E | ave0.09880.22610.26910.39660.64920.33310.5575
20Emin−0.008230.19990.01150.03700.23530.04350.1200
Emax0.03000.45770.28660.79690.95480.67351.3476
| E | ave0.00790.19170.19470.34430.63300.33320.7268
25Emin−0.00900.01640.01950.02890.05570.03870.1161
Emax0.00560.35280.42230.62820.93580.61501.3540
| E | ave0.04480.15310.18410.27590.46120.30910.8033
27.5Emin−0.00180.01560.01830.02640.28150.03700.1126
Emax0.00510.31610.31870.56450.96170.59181.4235
| E | ave0.00290.14180.16960.25230.65420.30160.8282
30Emin−0.04230.01530.01760.02460.24740.03560.1080
Emax0.00540.31320.37450.55620.96350.60211.4964
| E | ave0.00580.14220.16930.24940.63680.32050.8774
32.5Emin−0.00690.01530.01740.02340.26030.03460.1048
Emax0.00560.28700.34230.50600.96510.58181.5331
| E | ave0.00240.13840.16280.23490.64180.30680.8004
35Emin−0.00150.01560.01740.02670.27150.03380.1008
Emax0.00570.26790.31190.46540.96650.56491.5543
| E | ave0.002160.15760.15760.22240.64740.30150.8851
40Emin−0.00300.01700.01830.02230.04110.03290.0929
Emax0.00570.24700.28770.40830.76090.54061.5631
| E | ave0.00240.13880.15660.20950.40170.30150.8751
45Emin−0.00200.01880.01990.02300.03990.03270.0858
Emax0.00340.24440.27780.37680.71770.52711.5428
| E | ave0.00110.15110.16560.20880.39100.30160.8592
50Emin−0.00760.02100.02180.02420.03890.03310.0797
Emax0.00770.25680.28590.37250.70410.53131.5342
| E | ave0.00460.17190.18480.22320.40150.31900.8706

