Abstract
Sulfur hexafluoride (SF6) gas-insulated electrical equipment is widely used in high-voltage (HV) and extra-high-voltage (EHV) power systems. Partial discharge (PD) and local heating can occur in the electrical equipment because of insulation faults, which results in SF6 decomposition and ultimately generates several types of decomposition products. These SF6 decomposition products can be qualitatively and quantitatively detected with relevant detection methods, and such detection contributes to diagnosing the internal faults and evaluating the security risks of the equipment. At present, multiple detection methods exist for analyzing the SF6 decomposition products, and electrochemical sensing (ES) and infrared (IR) spectroscopy are well suited for application in online detection. In this study, the combination of ES with IR spectroscopy is used to detect SF6 gas decomposition. First, the characteristics of these two detection methods are studied, and the data analysis matrix is established. Then, a qualitative and quantitative analysis ES-IR model is established by adopting a two-step approach. A SF6 decomposition detector is designed and manufactured by combining an electrochemical sensor and IR spectroscopy technology. The detector is used to detect SF6 gas decomposition and is verified to reliably and accurately detect the gas components and concentrations.
1. Introduction
Electrical equipment is the fundamental basis of power systems, and its reliability is crucial to ensure grid security and stability [1]. With their many advantages, such as a compact structure, stable insulation performance, strong flowing-breaking ability, and reliable operation, SF6 gas-insulated electrical equipment, especially gas-insulated-switchgear (GIS) and gas-insulated-transmission line (GIL), has been widely applied in high-voltage (HV) and extra-high-voltage (EHV) power systems worldwide [2]. However, partial discharge (PD) and local overheating can occur in the GIS because of insulation faults, causing SF6 gas decomposition and ultimately generating several types of SF6 decomposition products, including SO2F2, SOF2, CO, SO2, H2S, HF, CF4, and SiF4 [3,4]. These decomposition products have a severe effect on the insulating materials, accelerate insulation deterioration in the GIS, and can even result in equipment damage. Once the GIS insulation fails, the state-of-safe and reliable GIS operation faces a severe threat. The variation of these gases reflects the equipment internal PD and insulation status. Through quantitatively detecting and analyzing these gaseous components, potential equipment failure and security problems can be diagnosed to provide an early warning of degraded device status [5,6,7,8].
The analysis techniques for SF6 decomposition are an important method for diagnosing the insulation condition of SF6 gas-insulated electrical equipment. Relative to other detection methods, the SF6 decomposition detection methods have many advantages, including resistance against jamming, high-sensitivity and quantitative analysis. Furthermore, with the existence and development of equipment internal defects, the amount of SF6 decomposition products can gradually accumulate; thus, this method is particularly suitable for long-term monitoring. Substantial worldwide research has been directed to the detection of SF6 decomposition products. These detection methods are used to analyze the components and concentrations of such products and ultimately to deduce the partial discharge type and severity. The methods include gas chromatography, mass spectrometry, infrared (IR) spectroscopy, electrochemical sensing (ES), gas detector tubes, ion mobility spectrometry, and carbon nanotubes, among other methods [9,10,11,12,13]. However, these detection methods still generally depend on regular field sampling and complete quantitative analysis of SF6 decomposition products in the laboratory. Relative to other detection methods, electrochemical sensors and IR spectroscopy offer particularly favorable prospects for online detection [9,14,15]. Therefore, it is necessary a further investigation in electrochemical sensors and IR spectroscopy for detecting SF6 decomposition products, which is the focus of this study.
Here, by first establishing a testing platform of ES and IR spectroscopy, we obtain the response characteristics of the electrochemical sensor and the spectral characteristic of target detection gases (CO, SO2 and H2S), including the temperature, temperature compensation and linearity. Then, a qualitative and quantitative analysis model of ES-IR is established by adopting a two-step approach. Furthermore, a SF6 decomposition detector has been designed by combining electrochemical sensors and IR spectroscopy to lay the foundation for SF6 decomposition product online monitoring with an ES-IR evaluation of SF6 gas-insulated electrical equipment.
2. Detection Principle
2.1. Electrochemical Sensing
With advantages such as a stable working performance, long-service life, low-power consumption, high-sensitivity and rapid-response speed, the electrometrical gas sensor is well-suited for field quantitative detection of gases that are toxic at low concentrations and combustible gases [9,16]. ES also offers advantages such as small volume, simple operation and low cost, and has been widely used to conduct online monitoring in multiple fields, such as petrochemical industry, home automation, air quality monitoring, etc.
Electrochemical sensors are electrochemical cells that operate in the amperometric mode. That is, sensors generate a current that is linearly proportional to the fractional volume of the target gas, such as CO, SO2 or H2S. The structure of an electrochemical sensor is shown in Figure 1. The sensor typically consists of three electrodes immersed in an electrolyte: the working electrode (WE), the counter electrode (CE) and the reference electrode (RE). The working principle of an electrode sensor is that the target gas diffuses into the WE surface by crossing a gas diffusion barrier, the WE either oxidizes or reduces the target gas with the CE balancing the generated current, and an external circuit outputs a current linearly proportional to the measured gas concentration. Taking the reaction of CO electrochemical sensor as an example, when the sensor works, CO is oxidized on the WE and O2 is reduced on the CE. And the reaction equation is shown as follows:
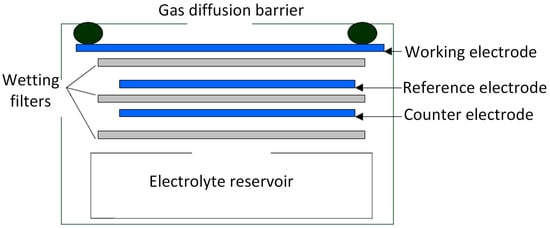
Figure 1.
Schematic diagram of the electrochemical gas sensor.
When the electrode potential and the catalytic activity are high enough, CO gas molecules penetrate the diffusion barrier close to the electrode and reacted rapidly. Then, the amplitude of the generated current is proportional to the CO gas concentration based on Fick’s law. Therefore, by measuring the current between WE and CE, the CO gas concentration can be obtained. Similarly, the total redox reaction of H2S and SO2 electrochemical sensors is expressed by the following equations:
In reality, the WE surface always undergoes a continuous electrochemical reaction, which may result in sensor performance degradation. Thus, the RE is added to improve sensor performance. The RE anchors the WE at the correct potential to ensure that the reaction stays in the transport-limited current plateau of the current-voltage curve.
2.2. IR Spectroscopy
Material molecular movement follows the law of quantum mechanics. According to the Born-Oppenheimer approximation of quantum mechanics [17], the energy of molecular motion (E) is composed of translational (Et), rotational (Er), vibrational (Ev) and electronic energy (Ee). Thus, the energy of molecular motion can be expressed as follows:
The energy difference of adjacent energy levels of a molecule’s translational kinetic energy is relatively small and can be regarded as changing continuously. The rotational, vibrational and electronic transitions are all quantized. When using IR to detect gas samples, the molecule undergoes an energy level transition from a lower energy level E1 to a higher energy level E2. The gas sample can selectively absorb the specific frequency of IR light that satisfies the following equation:
where h = 6.624 × 10⁻³⁴ J·s and v is the frequency. IR absorption spectroscopy exploits the fact that molecules can selectively absorb electromagnetic (EM) radiation in the IR zone. Each type of molecule absorbs wavelengths in a unique IR spectrum corresponding to its molecular vibrational and rotational frequency. Thus, the IR absorption spectrum of a gaseous decomposition product features a peak at the gas absorption wavelength called the typical absorption peak for this gas. Through analyzing the typical absorption position, value and shape of the gas sample IR spectrum, the decomposition products of SF6, for example, can be qualitatively and quantitatively detected [7].
Specifically, IR absorption spectroscopy for quantitative detection is based on the Lambert-Beer Law [18], which states that the gas sample absorbs a specific frequency of IR light when a beam of light passes through the gas sample; the absorption intensity is proportional to each component concentration and optical path length [19]. For the IR absorption spectra of a single gas sample, the absorbance at any wave number (v) is expressed as follows:
where the dimensionless parameter A(v) is the absorbance, the dimensionless parameter T(v) is the transmittance, a(v) is the absorbance coefficient at the wave number (v) and its units are (kPa × μL/L × m)−1, b is the optical path length (unit: m), and c is the gas concentration (units: kPa × μL/L).
3. Testing Platform
To obtain the response of the electrochemical sensor and spectral characteristics of the target detection gas, an experimental platform is first configured, as shown in Figure 2. The platform comprises a gas configuration system and a measurement system, including the background SF6 gas, the sample gases (CO, SO2, H2S), a mass flow controller, a SF6 decomposition detection tank, electrochemical sensors, and a Fourier transform infrared spectroscopy (FTIR) detection system.
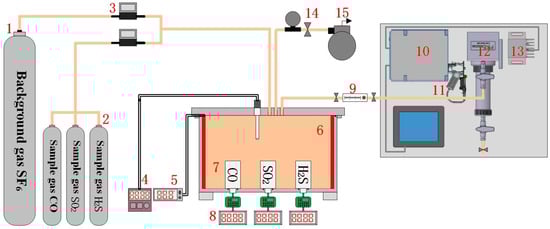
Figure 2.
Test platform for electrochemical sensing. The label in the picture is indicated respectively as follows: 1. Background gas SF6; 2. Sample gas CO, SO2, H2S; 3. Mass flow controller; 4. Thermocouple; 5. Heating plate; 6. SF6 decomposition detection tank; 7. Electrochemical sensor; 8. Digital ammeter; 9. Glass rotameter; 10. Interferometer; 11. IR source; 12. Gas pool; 13. Detector; 14. Barometer; 15. Vacuum pump.
The experimental gas configuration system consists primarily of background SF6 gas, sample gas, a mass flow controller, and a SF6 decomposition detection tank. The gas flow controller can be used to accurately control the gas volume, and various species and concentrations of experimental gas can be configured in the SF6 decomposition detection tank.
The measurement system for sensor response contains the electrochemical sensors (see Figure 3), a digital ammeter, a heating plate and a thermocouple. The sensors that employ a threaded connection for ease of replacement is placed at the bottom of the tank and its main technical parameters is shown in Table A1. The heating plate is used to heat the experimental gas in the tank, and the thermocouple measures the ambient temperature inside the tank in real time, facilitating study of the sensor’s temperature characteristics. Through configuring various components and concentrations of the experimental gas, the sensor linearity characteristics can also be obtained.
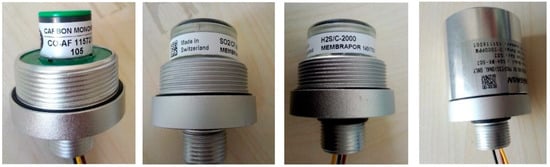
Figure 3.
Electrochemical sensors.
The FTIR detection system consists of an IR source, an interferometer module, a detector module and the gas pool, as shown in Figure 4 and Table A2. The IR source can emit 1–25 μm wavelength light, and the wavelength range can cover all the characteristic wavelengths for all measured gas components. The interferometer module is the key component and mediates the splitting and scanning of the IR light. The detector module is used to analyze the interference light containing the information from the measured gas; the model then obtains the gas component concentrations through IR spectroscopy.
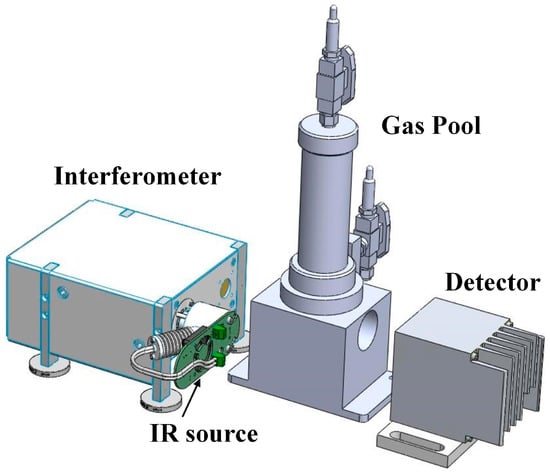
Figure 4.
SF6 decomposition product detection system.
4. Response Characteristics of the Sensors
4.1. Temperature Characteristics
The output signal of electrochemical sensors is closely related to the ambient temperature. To study the relationship between the sensor output signal and ambient temperature, the experiments are processed at different temperatures of 10 °C, 20 °C, 30 °C, 40 °C and 50 °C using sensors to detect the experimental gas. The temperature characteristics are shown in Figure 5.
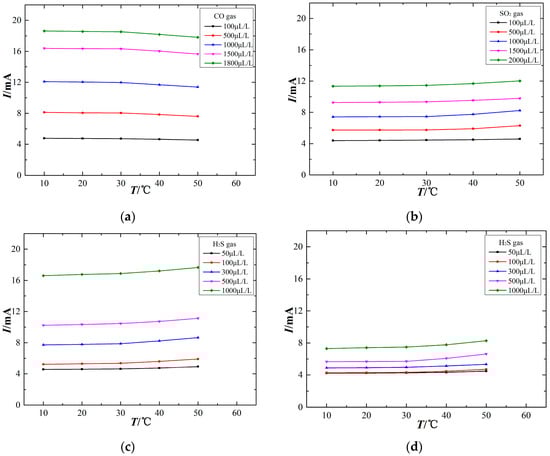
Figure 5.
Temperature characteristics of the electrochemical sensors. (a) CO sensor, (b) SO2 sensor, (c) H2S sensor, (d) SO2 sensor (exposed to H2S).
The variation of ambient temperature affects the output signal of electrochemical sensors at a constant gas concentration. However, different gas sensors exhibit differences in their temperature-dependent response, as shown in Figure 5. Figure 5a shows that the output current signal of the CO electrochemical sensor decreases with increasing ambient temperature, although this temperature sensitivity is nearly absent over the range of 10–30 °C. Figure 5b,c show that the output signals of the SO2 and H2S sensors increase as the ambient temperature increases, and the higher the ambient temperature, the greater the rate of change for the output current signal. Figure 5d shows that the SO2 sensor also responds to H2S gas and that its output signal is positively correlated with ambient temperature. The sensor output signal is relatively stable at approximately 20 °C, which demonstrates that 20 °C may be an appropriate testing temperature for the sensors. When the ambient temperature is too high, the output signal exhibits a greater change. That is, a higher ambient temperature has a stronger effect on these electrochemical sensors. Therefore, such temperature-dependence sensors are difficult to be used directly for field detection.
The relationship between the sensor output signal and ambient temperature is influenced in two ways. First, the electrochemical sensors have an internal electrochemical reaction, and increasing the ambient temperature can enhance the reaction speed, thus increasing the output signal. Second, a gas diffusion barrier exists between the sensor and the external environment. With the use of various materials and fabrication processes, different sensor films exhibit differences in diffusion permeability, and the variation of ambient temperature influences the transport of gas molecules through the diffusion film. An increasing ambient temperature causes more energetic thermal motion of gas molecules, thereby affecting the gas contacting the working electrode surface, which may influence the sensor output signal. As a result, an increasing ambient temperature may not necessarily lead to an increased sensor output signal. It is important when using electrochemical sensors to ensure an optimal operating temperature over long experimental durations, and temperature compensation is necessarily adopted to suppress the effect of ambient temperature insofar as it influence the sensor measurements.
4.2. Temperature Compensation
To further study the relationship between the ambient temperature and sensor output signal, the temperature compensation curves are fit using a quadratic fitting method, as shown in Figure 6. The x-axis represents the ambient temperature (°C), the sensor output signal at an ambient temperature of 20 °C is chosen as the reference signal, and the Q of the y-axis represents the ratio of output signals at the measuring temperature and at 20 °C, as shown in the following equation:
where Ix is the measured output signals value; I20°C is the measured output signals value at 20 °C.
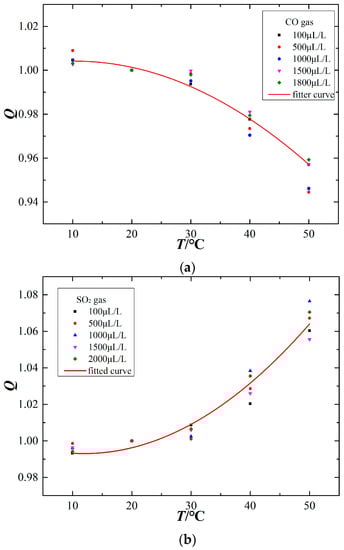
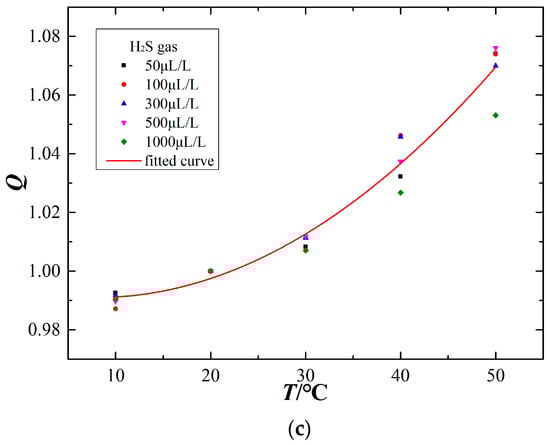
Figure 6.
Temperature compensation curves of the electrochemical sensors. (a) CO sensor, (b) SO2 sensor, (c) H2S sensor.
The CO electrochemical sensor has a negative temperature sensitivity, whereas the SO2 and H2S sensors have a positive temperature sensitivity. The temperature compensation curves for the different sensors are as follows:
where T is the ambient temperature during the measurement. Therefore, after the data normalization preprocessing, the actual output signals (Ix) at the ambient temperature can be converted to the standard value (I20°C) at 20 °C by the following equation:
4.3. Linearity Characteristics
The electrochemical sensor generates a current signal linearly proportional to the target gas concentration. Through configuring various components and concentrations of experimental gas in the detection tank at one atmosphere and 20 °C ambient temperature, the linearity characteristics of the electrochemical sensors are obtained, as shown in Figure 7.
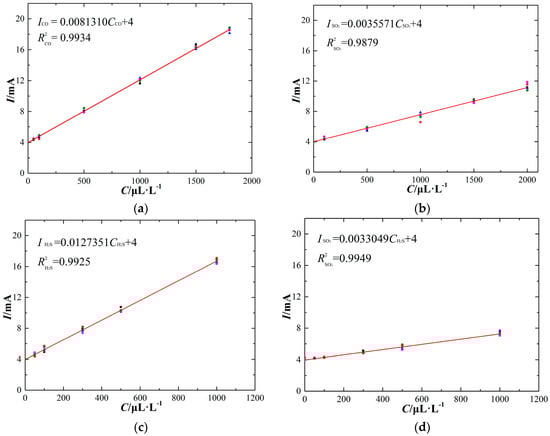
Figure 7.
Linearity characteristics of the electrochemical sensors (at 20 °C). (a) CO sensor, (b) SO2 sensor, (c) H2S sensor, (d) SO2 sensor (exposed to H2S).
The experimental results show that the output current signal of different types of electrochemical sensors responds linearly with the corresponding target gas concentration. In addition, the SO2 sensor responds linearly to increasing H2S gas concentration. The sensor response can be fit to a linear equation between the output signal (I) and the target gas concentration (C):
where m, n is the slope and vertical intercept of the fitting line respectively. The sensor linearity characteristics are shown in Table 1.

Table 1.
Linearity characteristics of the electrochemical sensors (at 20 °C).
Based on the linearity characteristics of these electrochemical sensors, the theoretical detection precision and measurement uncertainty can be analyzed. The sensor detection precision is an important parameter for evaluating detection performance, and the target output current precision of the sensors is two valid digits after the decimal point in units of mA. Therefore, the ideal minimum gas concentration detection of sensors can be calculated by assuming a sensor output current value of 4.01 mA in the linear formulas. The measurement uncertainty is also an important parameter. The upper envelope is expressed by the following equation:
which can be fit by choosing the maximum measurement value at each gas concentration. The lower envelope is expressed by the following equation:
which can be fit by choosing the minimum measurement value at each gas concentration. Comparing the two envelope lines with the optimal linearity characteristic in Figure 7, the measurement uncertainty can be calculated, as shown in Table 2.
Table 2.
Theoretical detection precision and measurement uncertainty of the electrochemical sensors.
4.4. Sensor Data Analysis Matrix
The working principle of electrochemical sensors can cause the sensor to respond to several types of gas with similar chemical properties. We determined that the SO2 sensor responds to SO2 and H2S gas. To accurately obtain the target gas concentration, the temperature compensation and crossing calculation are adopted, and the sensor data matrix is established [20]. The sensor data matrix between the real value of target gas concentration and the measured output current signal is as follows:
where diagonal matrix Q = diag(QCO, QSO2, QH2S) represents the sensor temperature compensation coefficient matrix, I1 = [I1CO, I1SO2, I1H2S]T represents the sensor actual output signal matrix, I = [ICO, ISO2, IH2S]T is the sensor output signal matrix at 20 °C, A = {αij}(1 ≤ i ≤ 3, 1 ≤ j ≤ 3) represents the sensor crossing calculation matrix, C = [CCO, CSO2, CH2S]T is the actual target gas concentration matrix, and b = [4,4,4] is the sensor output signal in pure SF6 gas.
Matrices Q and A can be obtained through a series of experiments, and then the actual target gas concentration can be obtained through matrix inversion:
A multi-component gas mixture is used to demonstrate the reliability and accuracy of the sensor data matrix. We configured the system to detect the multi-components with background SF6 gas and the target gases of CO, SO2 and H2S, and the experimental results are shown in Table 3.
Table 3.
The measurement results of SF6 decomposition products using a sensor data analysis matrix.
The experimental results show that the measurement uncertainty of the CO sensor is less than 2% and that the measurement uncertainty of the SO2 and H2S sensors is less than 3%. The results show that the sensor data matrix method offers high reliability and accuracy.
5. Spectral Characteristic of the Target Gas
5.1. Spectral Simulation
Material studio is used to simulate the IR absorption spectrum of SF6 and its decomposition products based on the molecular dynamics method [21]. The microstructure of different molecular molecules are first determined, as shown in Figure 8.
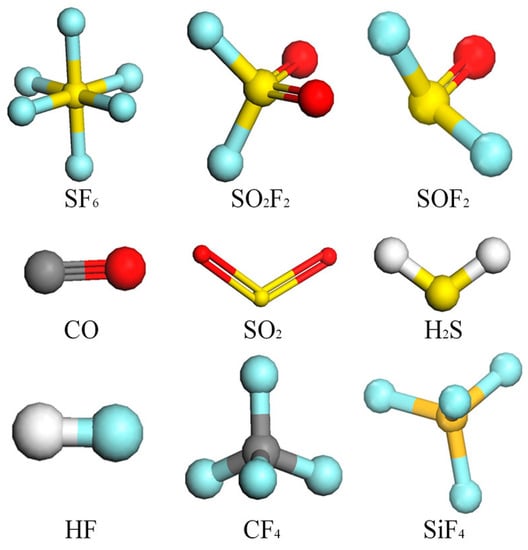
Figure 8.
Molecular models of the decomposition products of SF6.
The calculated IR absorption spectroscopy of SF6 and its decomposition products is simulated, as shown in Figure 9. The simulation results show that the IR absorption of SF6 and its decomposition products is concentrated predominantly within the range of 300–4000 cm−1. Different gas molecules have different IR absorption peaks, and their corresponding absorption intensities also exhibit a large difference. In addition, a single gas molecule can have multiple absorption peaks.
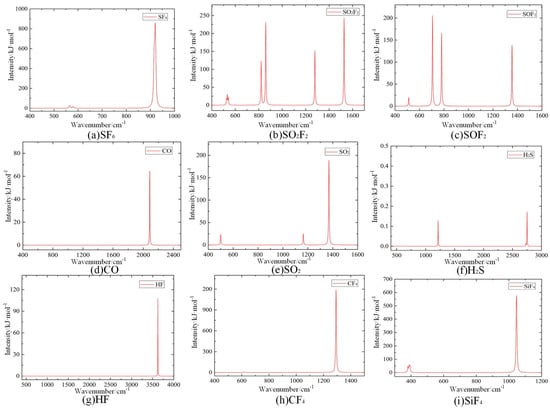
Figure 9.
IR absorption spectroscopy of SF6 and its decomposition products.
Polyatomic molecules can have a variety of vibration modes that correspond to several IR absorption lines of different intensity; thus, it is necessary to determine the characteristic IR peaks to identify the SF6 decomposition products. The calculated IR absorption spectroscopy is obtained by superimposing the IR absorption spectroscopy of SF6 and its decomposition products, as shown in Figure 10. The position, intensity and shape of IR absorption characteristic peaks of these gas molecules differ substantially. The above characteristics of IR absorption peaks are used to qualitatively and quantitatively analyze the SF6 decomposition products.
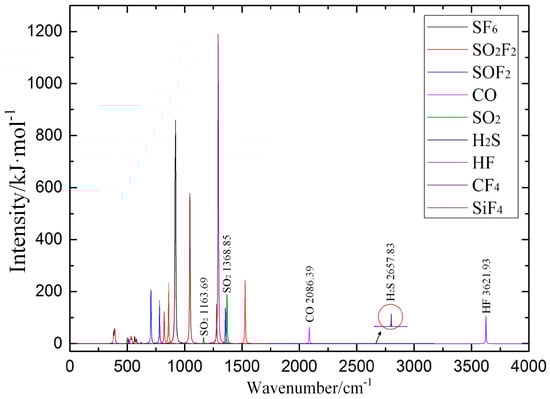
Figure 10.
Calculated IR absorption spectroscopic results of SF6 decomposition products.
Through reviewing the relevant international standards and literature, we compared the results of calculated IR spectroscopy and measured IR spectroscopy, as shown in Table A3. The comparison shows that both calculated and measured results are consistent. It is possible to determine the attribution of IR absorption peaks for the SF6 decomposition products.
5.2. Selection of a Typical Spectrum
The established FTIR detection system is intended to obtain the IR typical spectra of these three target gases. In the experiment, CO, SO2 and H2S are chosen as the target detection gases. Pure SF6 is the background gas, and the concentrations of CO/SF6, SO2/SF6, and H2S/SF6 are each 1000 μL/L. During the measurement, we ensure that the power supply and gas connection are safely and reliably connected. The gas pressure is adjusted to 0.1 MPa, and the measurement result is recorded after the gas flows for approximately 15 min. The experimental results are shown in Figure 11, in which au is the relative intensity of the IR spectrum.
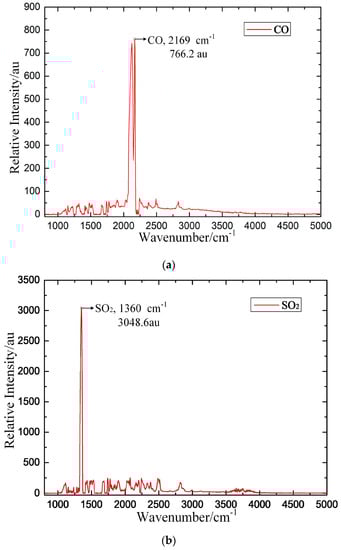
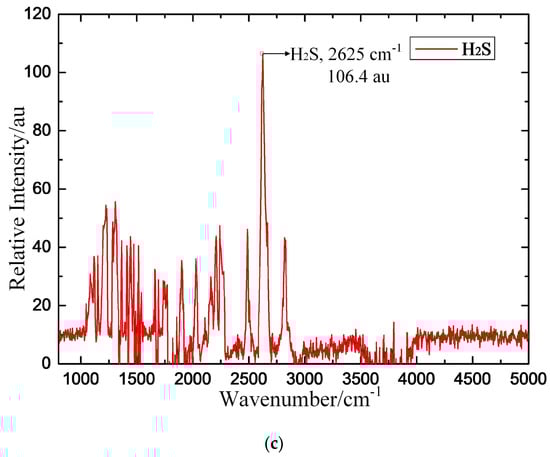
Figure 11.
Measured IR spectroscopic results for the target detection gas. (a) CO, (b) SO2, (c) H2S.
The experimental results show that the IR spectra of CO, SO2 and H2S all contain prominent peaks. The relative intensity of CO is 766.2 au at the 2169 cm−1 characteristic peak, that of SO2 is 3048.6 au at the 1360 cm−1 characteristic peak, and that of H2S is 106.4 au at the 2625 cm−1 characteristic peak. The basic rules of characteristic IR line selection are as follows: (1) the characteristic IR line is typical for a single component in the mixture; (2) a higher peak is correlated with improved detection sensitivity; (3) the lines are independent of each other to reduce cross interference; and (4) the line is only minimally influenced by external factors [22]. According to the above rules, the IR characteristic spectroscopy of the three target gases (CO, SO2 and H2S) is obtained by comparing the calculated and measured IR spectroscopic results, as shown in Table 4.
Table 4.
Typical IR spectra of the three target detection gases.
Comparing the calculated and measured IR spectroscopy of these three target gases, the calculated spectral intensity of CO and SO2 at their respective wavenumbers is 64.537 kJ/mol−1 and 188.75 kJ/mol−1, respectively; the calculated spectrum intensity of H2S is only 0.3246 kJ/mol−1 because the IR absorption capacity of CO and SO2 is much stronger than that of H2S gas. Due to these three target gases differing substantially in terms of IR absorption capacity, the experimental results show that CO and SO2 have distinct IR characteristic peaks with higher relative intensity but that the IR spectrum of H2S gas is noisier, with multiple IR peaks with lower relative intensity. It is important to ensure that the target detection gases exhibit strong and unambiguous IR characteristic peaks to enable reliable qualitative and quantitative detection of these target detection gases. Simulations based on the molecular dynamics calculated method are effective and help ensure the accuracy of the IR characteristic spectra of the target detection gases.
5.3. Pretreatment of IR Spectroscopy
IR absorption spectroscopy for quantitative detection is based on the Lambert-Beer Law. The quantitative analysis using this law is applied only in the absorbance spectrum. Therefore, the absorbance spectra of these target detection gases must be pretreated. The collected IR spectrum data may contain irrelevant information, such as noise, instrument interference, and environmental factors. The absorbance spectrum pretreatment can obtain a high-quality IR spectrum by eliminating this irrelevant information, thus improving the qualitative and quantitative accuracy.
Figure 12 shows that pretreatment of the target gas IR spectrum can fully retain the effective information by elimination of the interference noise and can further improve the quality of the absorbance spectrum of these target detection gases. Furthermore, the absorbance spectra of CO and SO2 gases feature prominent IR peaks at their characteristic wavenumber; thus, these two gases can be quantitatively detected based on their absorbance spectrum. Relative to that of CO and SO2, the IR absorption capacity of the H2S is far lower; H2S gas does not exhibit any prominent IR peak at its characteristic wavenumber and thus cannot be quantitatively detected using this FTIR detection system.
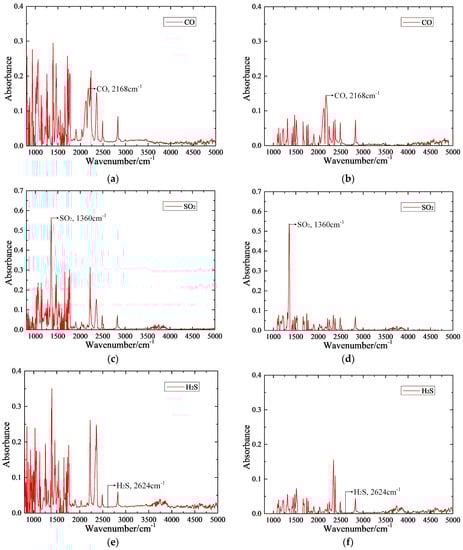
Figure 12.
Pretreatment of the target gas IR spectrum. (a) CO before pretreating, (b) CO after pretreating, (c) SO2 before pretreating, (d) SO2 after pretreating, (e) H2S before pretreating, (f) H2S after pretreating.
5.4. Response Characteristics of IR Spectroscopy
Through analyzing the pretreatment absorbance spectrum of these three target detection gases, a prominent difference emerges between qualitative and quantitative detection. In the qualitative analysis, these three target gases (CO, SO2 and H2S) can all be identified using IR spectroscopy. In the quantitative analysis, CO and SO2 can be accurately calculated using the absorbance spectrum, but H2S gas is challenging to quantitatively analyze with IR spectroscopy, and a supplemental electrochemical sensor is required to realize quantitative analysis. However, CO and SO2 gas can be studied primarily in terms of the response characteristics IR absorption spectroscopy, as shown in Figure 13.
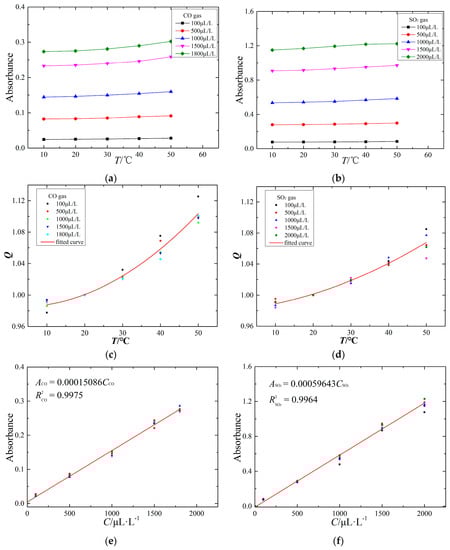
Figure 13.
The response characteristics of the CO and SO2 IR spectrum: (a) temperature characteristic of CO IR spectrum; (b) temperature characteristic of SO2 IR spectrum; (c) temperature compensation of CO IR spectrum; (d) temperature compensation of SO2 IR spectrum; (e) linearity characteristic of CO IR spectrum; (f) linearity characteristic of SO2 IR spectrum.
5.4.1. Temperature Characteristics
The ambient temperature is an important factor influencing the measurement accuracy. To study the IR spectral characteristics of the target gas at different temperatures, the ambient temperature of the FTIR system is controlled using a vacuum oven. The temperature characteristics of the IR spectrum are obtained at 10 °C, 20 °C, 30 °C, 40 °C and 50 °C using the FTIR detection system to detect the experimental gas. The temperature characteristics are shown in Figure 13a,b.
Figure 13a,b shows that the absorbance value of CO and SO2 increases with increasing ambient temperature. Due to the IR absorption capacity of SO2 being stronger than that of CO, the SO2 absorbance value is larger than that of CO at the same concentration and ambient temperature. In general, increasing the ambient temperature may strengthen absorption of IR light by gas molecules; for example, the absorbance values of CO and SO2 increase with increasing temperature.
5.4.2. Temperature Compensation
To further study the relationship between the temperature and IR absorbance of CO and SO2, the temperature compensation curves are fit by a quadratic fitting method, as shown in Figure 13c,d. The x-axis represents the ambient temperature (°C), and the Q of the y-axis represents the ratio of absorbance values at the measurement temperature and at 20 °C.
The absorbance spectra of CO and SO2 have a positive temperature relationship, and the change of ambient temperature influencing the CO absorbance value is much higher than that for SO2. The temperature compensation curves of CO and SO2 absorbance are analyzed as follows:
where Q is the ratio of absorbance values at the measurement temperature and at 20 °C and T is the ambient temperature during a measurement.
5.4.3. Linearity Characteristics
The quantitative analysis of IR spectroscopy follows the Lambert-Beer Law, and the absorbance value of the target gas is proportional to the target gas concentration. To study the linearity characteristics of the CO and SO2 IR spectra, through configuring various components and concentrations of experimental gas in the detection tank at one atmosphere and 20 °C ambient temperature, the linearity characteristics of CO and SO2 IR spectra are obtained, as shown in Figure 13e,f.
The experimental results show that the absorbance values of CO and SO2 follow a linear relationship with their gas concentration; the linearity characteristics of CO and SO2 IR spectra are represented by the following formulas:
where A is the absorbance value of the target gas and C is the gas concentration.
Through analyzing the retreatment absorbance spectrum of CO and SO2, the signal-to-noise ratio (SNR) of their IR typical spectra can be obtained, and the theoretical detection precision of the FTIR detection system can be calculated. In addition, the upper envelope Amax = kmaxC and the lower envelope Amin = kminC are linearly fit using the least squares method. Comparing these two envelope lines with the linearity characteristics in Figure 13e,f, the measurement uncertainty can be calculated, as shown in Table 5.
Table 5.
Theoretical detection precision and measurement uncertainty of IR absorption spectroscopy.
5.5. Spectral Analysis Matrix
The IR absorption spectrum can directly and quickly reflect the gas components of the detected gas sample, and the gas concentration of each component can be quantitatively calculated based on the Lambert-Beer Law. To accurately obtain the target gas component and concentration, the spectral analysis matrix is assembled. The gas component can be quickly obtained by analyzing the IR spectrum. The absorbance value of the target gas is converted to the value at 20 °C, and the gas concentration is calculated based on the linearity characteristics of the CO and SO2 IR spectra:
where C = [CCO, CSO2]T is the actual target gas concentration matrix, K = {Kij} (1 ≤ i ≤ 2, 1 ≤ j ≤ 2) represents the linearity characteristic matrices of the CO and SO2 IR spectra, Q = diag(QCO, QSO2) represents the temperature compensation coefficient matrices of CO and SO2 IR spectra, A = [ACO, ASO2,]T is the absorbance value matrix at 20 °C, and A1 = [A1CO, A1SO2]T is the absorbance value matrix for the actual measurement.
The multi-component gas mixture is used to verify the data matrix. Through configuring and detecting the multi-components with SF6 background gas with target gases of CO, SO2 and H2S, the experimental results of the FTIR detection system are shown in Table 6.
Table 6.
The measurement results for SF6 decomposition products using the spectral analysis matrix.
The experimental results show that the measurement uncertainty of the CO absorbance spectrum is less than 7% and that the measurement uncertainty of the absorbance spectrum is less than 5%.
6. ES-IR Comprehensive Detection
6.1. Analysis Model Based on ES-IR
ES and IR spectroscopy are important for SF6 decomposition analysis techniques for evaluating SF6 gas-insulated electrical equipment. These two detection methods are both suitable for online detection. In this section, ES and IR spectroscopy are integrated to detect SF6 gas decomposition through the response of electrochemical sensors and the spectral characteristics of target gases. A qualitative and quantitative analysis model for ES-IR has been established by adopting a two-step approach.
The first step is that the gas components of these three target gases (CO, SO2 and H2S) are quickly identified by analyzing the IR spectrum. Relative to the electrochemical sensor, IR spectroscopy is superior for qualitative analysis, offering a faster response speed, more potential gas detection components and less cross-interference, as shown in Table 7. Therefore, IR spectroscopy is used to rapidly identify the target gas components.
Table 7.
Comparison of electrochemical sensors and IR spectroscopy in qualitative analysis.
The second step is that the gas concentrations of these three target gases (CO, SO2 and H2S) are accurately calculated by analyzing the measurement results of these two methods. The joint detection algorithm is used to obtain the gas concentration. It is challenging to use a single measurement to accurately reflect the gas concentration; thus, this algorithm selects the average of five measurement results as the detection result (CES, CIR) of these two detection methods. In addition, the relative standard deviation of these five measurement results is chosen as the evaluation criteria, and the final result for the target gas can be calculated using the following equation:
where CV is the relative standard deviation of the five measurement results, Co is the average of five measurement results, Ci is a single measurement result, and n is the number of measurements. In addition:
where C is the final result of the target gas, CVES is the relative standard deviation of the five measurement results using electrochemical sensors, CVIR is the relative standard deviation of the five measurement results using IR spectroscopy, CES is the average of five measurement results using electrochemical sensors, and CIR is the average of five measurement results using IR spectroscopy.
Thus, the qualitative and quantitative analysis model of ES-IR is established by adopting a two-step approach. The qualitative analysis uses IR spectroscopy to rapidly identify the gas components. The quantitative analysis uses a joint detection algorithm to calculate the measurement results of these two methods and then obtains the gas concentration of each identified component.
6.2. SF6 Decomposition Detector
A SF6 decomposition detector was designed and manufactured by combining electrochemical sensors and IR spectroscopy, as shown in Figure 14. The volume of this detector is 460 mm × 380 mm × 132 mm, and the weight is 25 kg. Furthermore, there are several features for the developed SF6 decomposition detector in this paper. First of all, using ES-IR comprehensive detection method and cross interference technique, the gas composition and concentration of SF6 decomposition products could be analyzed accurately and fast, which meets the requirements of on-site monitoring. Secondly, temperature monitoring module is also installed inside the detector, then temperature compensation method is used to reduce the influence of ambient temperature on the measurement results and ensure the accuracy of the measurement results. Thirdly, pneumatic control module is applied to the detector to make the internal sensors work under the suitable condition of about 1 MPa gas pressure, which further ensures the veracity and reliability of test results.
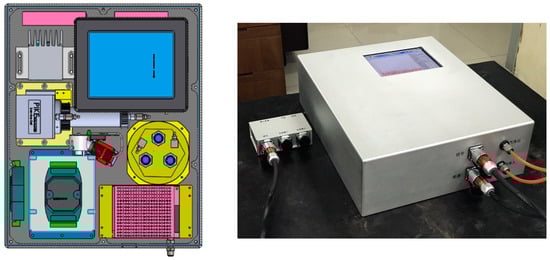
Figure 14.
Structural design of the SF6 decomposition detector.
The SF6 decomposition detector was tested using a multi-component gas mixture to verify the data matrix. Through configuring and detecting the multi-components with a background gas of SF6 and target gases of CO, SO2 and H2S, the results of the SF6 decomposition detector are shown in Table 8.
Table 8.
The results of the SF6 decomposition detector.
The results show that the measurement uncertainty for CO, SO2 and H2S is less than 5%. The detector is used to detect SF6 gas decomposition in the experiment, and the results show that the detector can reliably and accurately detect the gas components and concentrations.
7. Conclusions
ES and IR spectroscopy offer favorable application prospects for online detection. Furthermore, electrochemical sensors can be combined with IR spectroscopy to detect SF6 decomposition products; following this concept, a SF6 decomposition detector was also designed and manufactured. After reviewing the complete research results, the main conclusions are as follows:
- (1)
- The SF6 decomposition detection method based on electrochemical sensors was studied. The results show that the sensors can accurately detect the three target gases (CO, SO2 and H2S). Through adopting temperature compensation and a crossing calculation, the sensor data matrix is established to guarantee measurement accuracy. A multi-component mixed gas is configured and used to verify the sensor data matrix, and the results show that the method offers satisfactory reliability and accuracy.
- (2)
- Infrared spectroscopy is also an important detection method for analyzing SF6 decomposition. The IR absorption spectrum of SF6 and its decomposition products are simulated, and the typical IR spectra of the three target gases (CO, SO2 and H2S) were obtained. By assembling the spectral analysis matrix, the target gas can be rapidly identified, and CO and SO2 can also be quantitatively detected.
- (3)
- The combination of electrochemical sensors with IR spectroscopy was used to detect SF6 gas decomposition. The qualitative and quantitative analysis model of ES-IR was established by adopting a two-step approach. A SF6 decomposition detector was designed and manufactured by combining electrochemical sensors and IR spectroscopy. The detector was used to detect SF6 gas decomposition in the experiments, and the results show that the detector can reliably and accurately detect the gas components and concentrations.
Acknowledgments
This project was supported by the National Key Research and Development Program of China (Grant No. 2017YFB0902705) and the National Natural Science Foundation of China (Grant No. 51507130 and 51777157).
Author Contributions
Ming Dong and Ming Ren conceived and designed the experiments; Rixin Ye performed the experiments; Chongxing Zhang analyzed the data and wrote the paper; and Ricardo Albarracín gave substantive suggestions and guidance for the research.
Conflicts of Interest
The authors declare no conflict of interest.
Appendix A
Table A1.
Main technical parameters of electrochemical sensors.
Table A1.
Main technical parameters of electrochemical sensors.
| Sensor | Measuring Range (ppm) | Resolution Ratio (ppm) | Response Time (s) | Work Pressure (kPa) |
|---|---|---|---|---|
| CO | 0–2000 | 0.5 | <25 | 80–120 |
| SO2 | 0–2000 | 1 | <20 | 90–110 |
| H2S | 0–2000 | −1 | <60 | 90–110 |
Table A2.
Main technical parameters of infrared spectrum detection system.
Table A2.
Main technical parameters of infrared spectrum detection system.
| Module Name | Interferometer | Detector | IR Source | Gas Pool |
|---|---|---|---|---|
| Main technical parameters | Type: Dual reflector design | Type: Photoelectric MCT | Type: ceramic lamp filament | Type: Gas Cell-2.4 m Optical path length: 2.4 m |
| Lens diameter: 12.7 mm | Aperture diameter: 12.7 mm | Beam diameter: 12.7 mm | ||
| Resolution ratio: 4 cm−1 | Resolution ratio: 1 mm | Spectrum range: 1–25 μm | ||
| Repetition rate of wave number: <10 ppm | Amplifier bandwidth: 0–20 kHz | Power source: 12/5 A | ||
| Scanning frequency: 1 spectrum per second | Half-field angle: 28 mrad | Scanning frequency: 1 spectrum per second |
Table A3.
Comparison between calculated and measured IR spectroscopy.
Table A3.
Comparison between calculated and measured IR spectroscopy.
| Decomposition Products | Simulation (cm−1) | Measurement (cm−1) | Relative Error (%) |
|---|---|---|---|
| SO2F2 | 525.15; 532.25; 540.90; 821.17; 1278.56; 1526.79 | 539; 544; 552; 848; 1269; 1502 | −2.57; −2.16; −2.01; −3.16; 0.75; 1.65 |
| SOF2 | 373.25; 511.97; 780.89; 1355.55 | 390; 530; 806; 1333 | −4.29; −3.40; −3.12; 1.69 |
| CO | 2086.39 | 2169 | −3.81 |
| SO2 | 1163.69; 1368.85 | 1167; 1360 | −0.28; 0.65 |
| H2S | 1380.97; 2657.83 | 1335; 2625 | 3.44; 1.25 |
| HF | 3621.93 | 3644 | −0.61 |
| CF4 | 1231.598; 1232.343 | 1280; 1283 | −3.78; −3.95 |
| SiF4 | 1044.98; 1045.93; 1047.79 | 1020; 1028; 1032 | 2.45; 1.74; 1.53 |
References
- Sun, Q.; Dong, M.; Ren, Z.; Ren, M.; Li, Y.; Qiu, A. Field Test and Analysis of Partial Discharge on GIS under Impulse Voltage. High Volt. Eng. 2012, 38, 639–644. [Google Scholar]
- Wang, F.; Qiu, Y. Recent Development Trend of Gas Insulated Switchgear. Power Syst. Technol. 2003, 27, 54–57. [Google Scholar]
- Zhang, X.X.; Liu, W.T.; Tang, J. Study on PD detection in SF6 using multi-wall carbon nanotube films sensor. IEEE Trans. Dielectr. Electr. Insul. 2010, 17, 838–844. [Google Scholar] [CrossRef]
- Liu, C.; Palanisamy, S.; Chen, S.; Wu, P.; Yao, L.; Lou, B. Mechanism of Formation of SF6 Decomposition Gas Products and its Identification by GC-MS and Electrochemical methods: A mini Review. Int. J. Electrochem. Sci. 2015, 10, 4223–4231. [Google Scholar]
- Ji, Y.; Wang, C.; Yang, R. Measuring Technique of SF6 Decomposition Products and Its Application to Fault Diagnosis of GIS. High Volt. Appar. 2011, 47, 100–103. [Google Scholar]
- Hergli, R.; Casanovas, J.; Derdouri, A. Study of the Decomposition of SF6 in the Presence of Water, Subjected to Gamma Irradiation or Corona Discharges. IEEE Trans. Electr. Insul. 1988, 23, 451–465. [Google Scholar] [CrossRef]
- Nukaiyama, Y.; Takagi, I.; Ishihara, H. Principal Decomposition By-Products Generated at Various Abnormalities in Gas-Insulated Transformers. IEEE Trans. Power Deliv. 1994, 9, 1885–1891. [Google Scholar] [CrossRef]
- Tang, J.; Yang, X.; Yang, D.; Yao, Q.; Miao, Y.; Zhang, C.; Zeng, F. Using SF6 Decomposed Component Analysis for the Diagnosis of Partial Discharge Severity Initiated by Free Metal Particle Defect. Energies 2017, 10, 1119. [Google Scholar] [CrossRef]
- Chen, X.; Peng, H.; Red, M. Detection Techniques of SF6 Decomposition and Application. High Volt. Appar. 2010, 46, 34–38. [Google Scholar]
- Sakthinathan, S.; Palanisamy, S.; Chen, S.; Wu, P.; Yao, L.; Lou, B. Electrochemical Detection of Phenol in Industrial Pollutant Absorbed Molecular Sieves by Electrochemically Activated Screen Printed Carbon Electrode. Int. J. Electrochem. Sci. 2015, 10, 3319–3328. [Google Scholar]
- Zhang, X.; Tie, J.; Zhang, J. A Pt-Doped TiO2 Nanotube Arrays Sensor for Detecting SF6 Decomposition Products. Sensors 2013, 13, 14764–14776. [Google Scholar] [CrossRef] [PubMed]
- Liu, H.; Zhou, Q.; Zhang, Q.; Hong, C.; Xu, L.; Jin, L.; Chen, W. Synthesis, Characterization and Enhanced Sensing Properties of a NiO/ZnO p–n Junctions Sensor for the SF6 Decomposition Byproducts SO2, SO2F2, and SOF2. Sensors 2017, 17, 913. [Google Scholar] [CrossRef] [PubMed]
- Thirumalraj, B.; Palanisamy, S.; Chen, S.; Wu, P.; Yao, L.; Lou, B. Electrochemical Sensing of SF6 Decomposition Products Based on a Screen Printed Carbon Electrode. Int. J. Electrochem. Sci. 2015, 10, 3098–3105. [Google Scholar]
- Chu, F. SF6 Decomposition in Gas-insulated Equipment. IEEE Trans. Electr. Insul. 1986, 2, 693–725. [Google Scholar] [CrossRef]
- Shi, H.; Qian, J.; Xiong, Z. Investigation on On-line Monitoring of SF6 Decomposition in Electrical Device. High Volt. Appar. 2014, 50, 56–60. [Google Scholar]
- Qi, B.; Li, C.; Luo, L. Experiment on the Correlation between Partial Discharge and Gas Decomposition Products in GIS. High Volt. Eng. 2010, 36, 957–963. [Google Scholar]
- Cederbaum, L. Born-Oppenheimer Approximation and Beyond for Time-dependent Electronic Processes. J. Chem. Phys. 2008, 128, 124101. [Google Scholar] [CrossRef] [PubMed]
- Joel, M.; Yi, X. Results on Gas Detection and Concentration Estimation via Mid-IR-Based Gas Detection System Analysis Model. IEEE Sens. J. 2012, 12, 2347–2354. [Google Scholar]
- Ji, S.; Zhong, L.; Liu, K. Research Status and Development of SF6 Decomposition Components Analysis under Discharge and Its Application. Proc. CSEE 2015, 35, 2318–2322. [Google Scholar]
- Yang, D.; Tan, Q.; Xiong, J.; Tao, C. Design of Detencto foe SF6 Gas Purity and Decomposition. Instrum. Tech. Sens. 2015, 2, 36–45. [Google Scholar]
- Scott, A.; Radom, L. Harmonic Vibrational Frequencies: An Evaluation of Hartree-Fock, Møller-Plesset, Quadratic Configuration Interaction, Density Functional Theory, and Semiempirical Scale Factors. J. Phys. Chem. 1996, 100, 16502–16513. [Google Scholar] [CrossRef]
- Chen, W.; Zhao, L.; Peng, S. Analysis of Dissolved Gas in Transformer Oil Based on Laser Raman Spectroscopy. Proc. CSEE 2014, 15, 2485–2492. [Google Scholar]
© 2017 by the authors. Licensee MDPI, Basel, Switzerland. This article is an open access article distributed under the terms and conditions of the Creative Commons Attribution (CC BY) license (http://creativecommons.org/licenses/by/4.0/).