Non-Contact Sensor for Long-Term Continuous Vital Signs Monitoring: A Review on Intelligent Phased-Array Doppler Sensor Design


 ,
, 
Abstract
:1. Introduction
1.1. Research Motivation
1.2. Existing Noncontact Vital Signs Sensors
1.2.1. Under-the-Bed Noncontact Sensors for Vital Signs Monitoring
1.2.2. Camera-Based NCVS
1.2.3. Doppler-Based NCVS
2. Research Methodology and Design
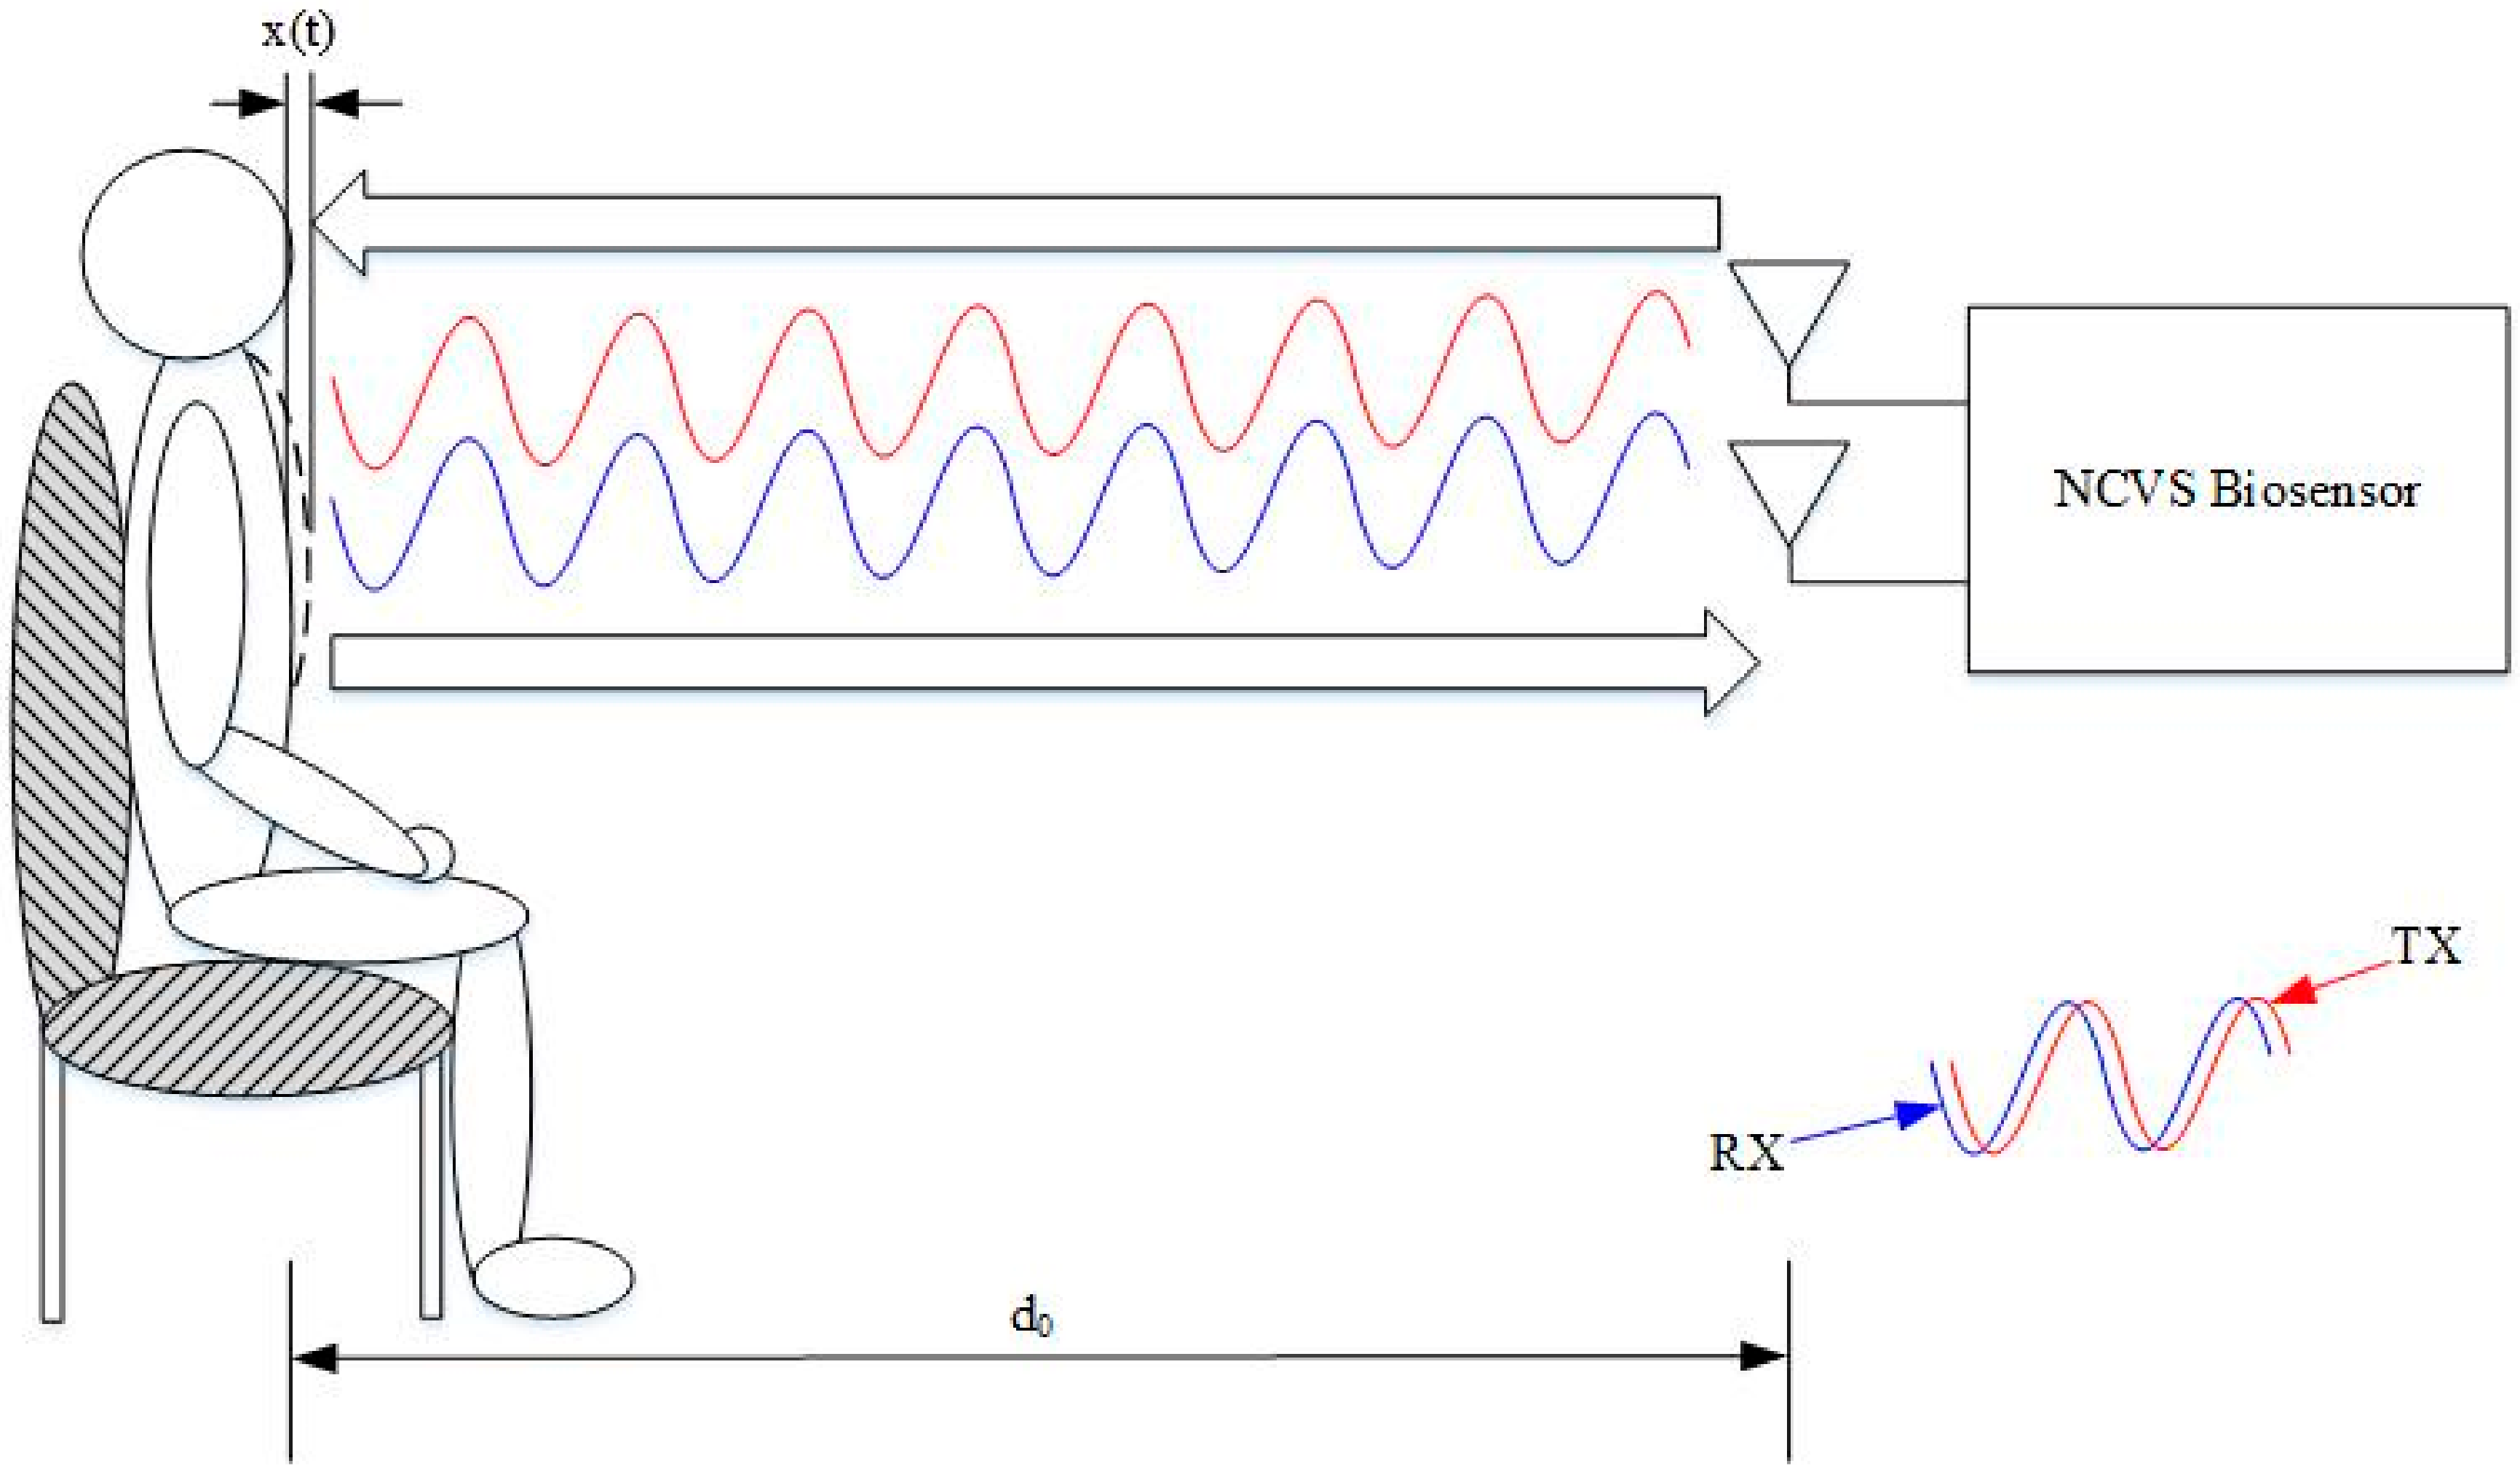
2.1. Our Basic Doppler NCVS Sensor Design Principles
2.2. A Brief Development History of Our Phased Array NCVS Sensor Systems
3. Testing of the Phased Array NCVS Monitoring System
3.1. Robust Phased Array NCVS Monitoring in an Office Cubicle Setting
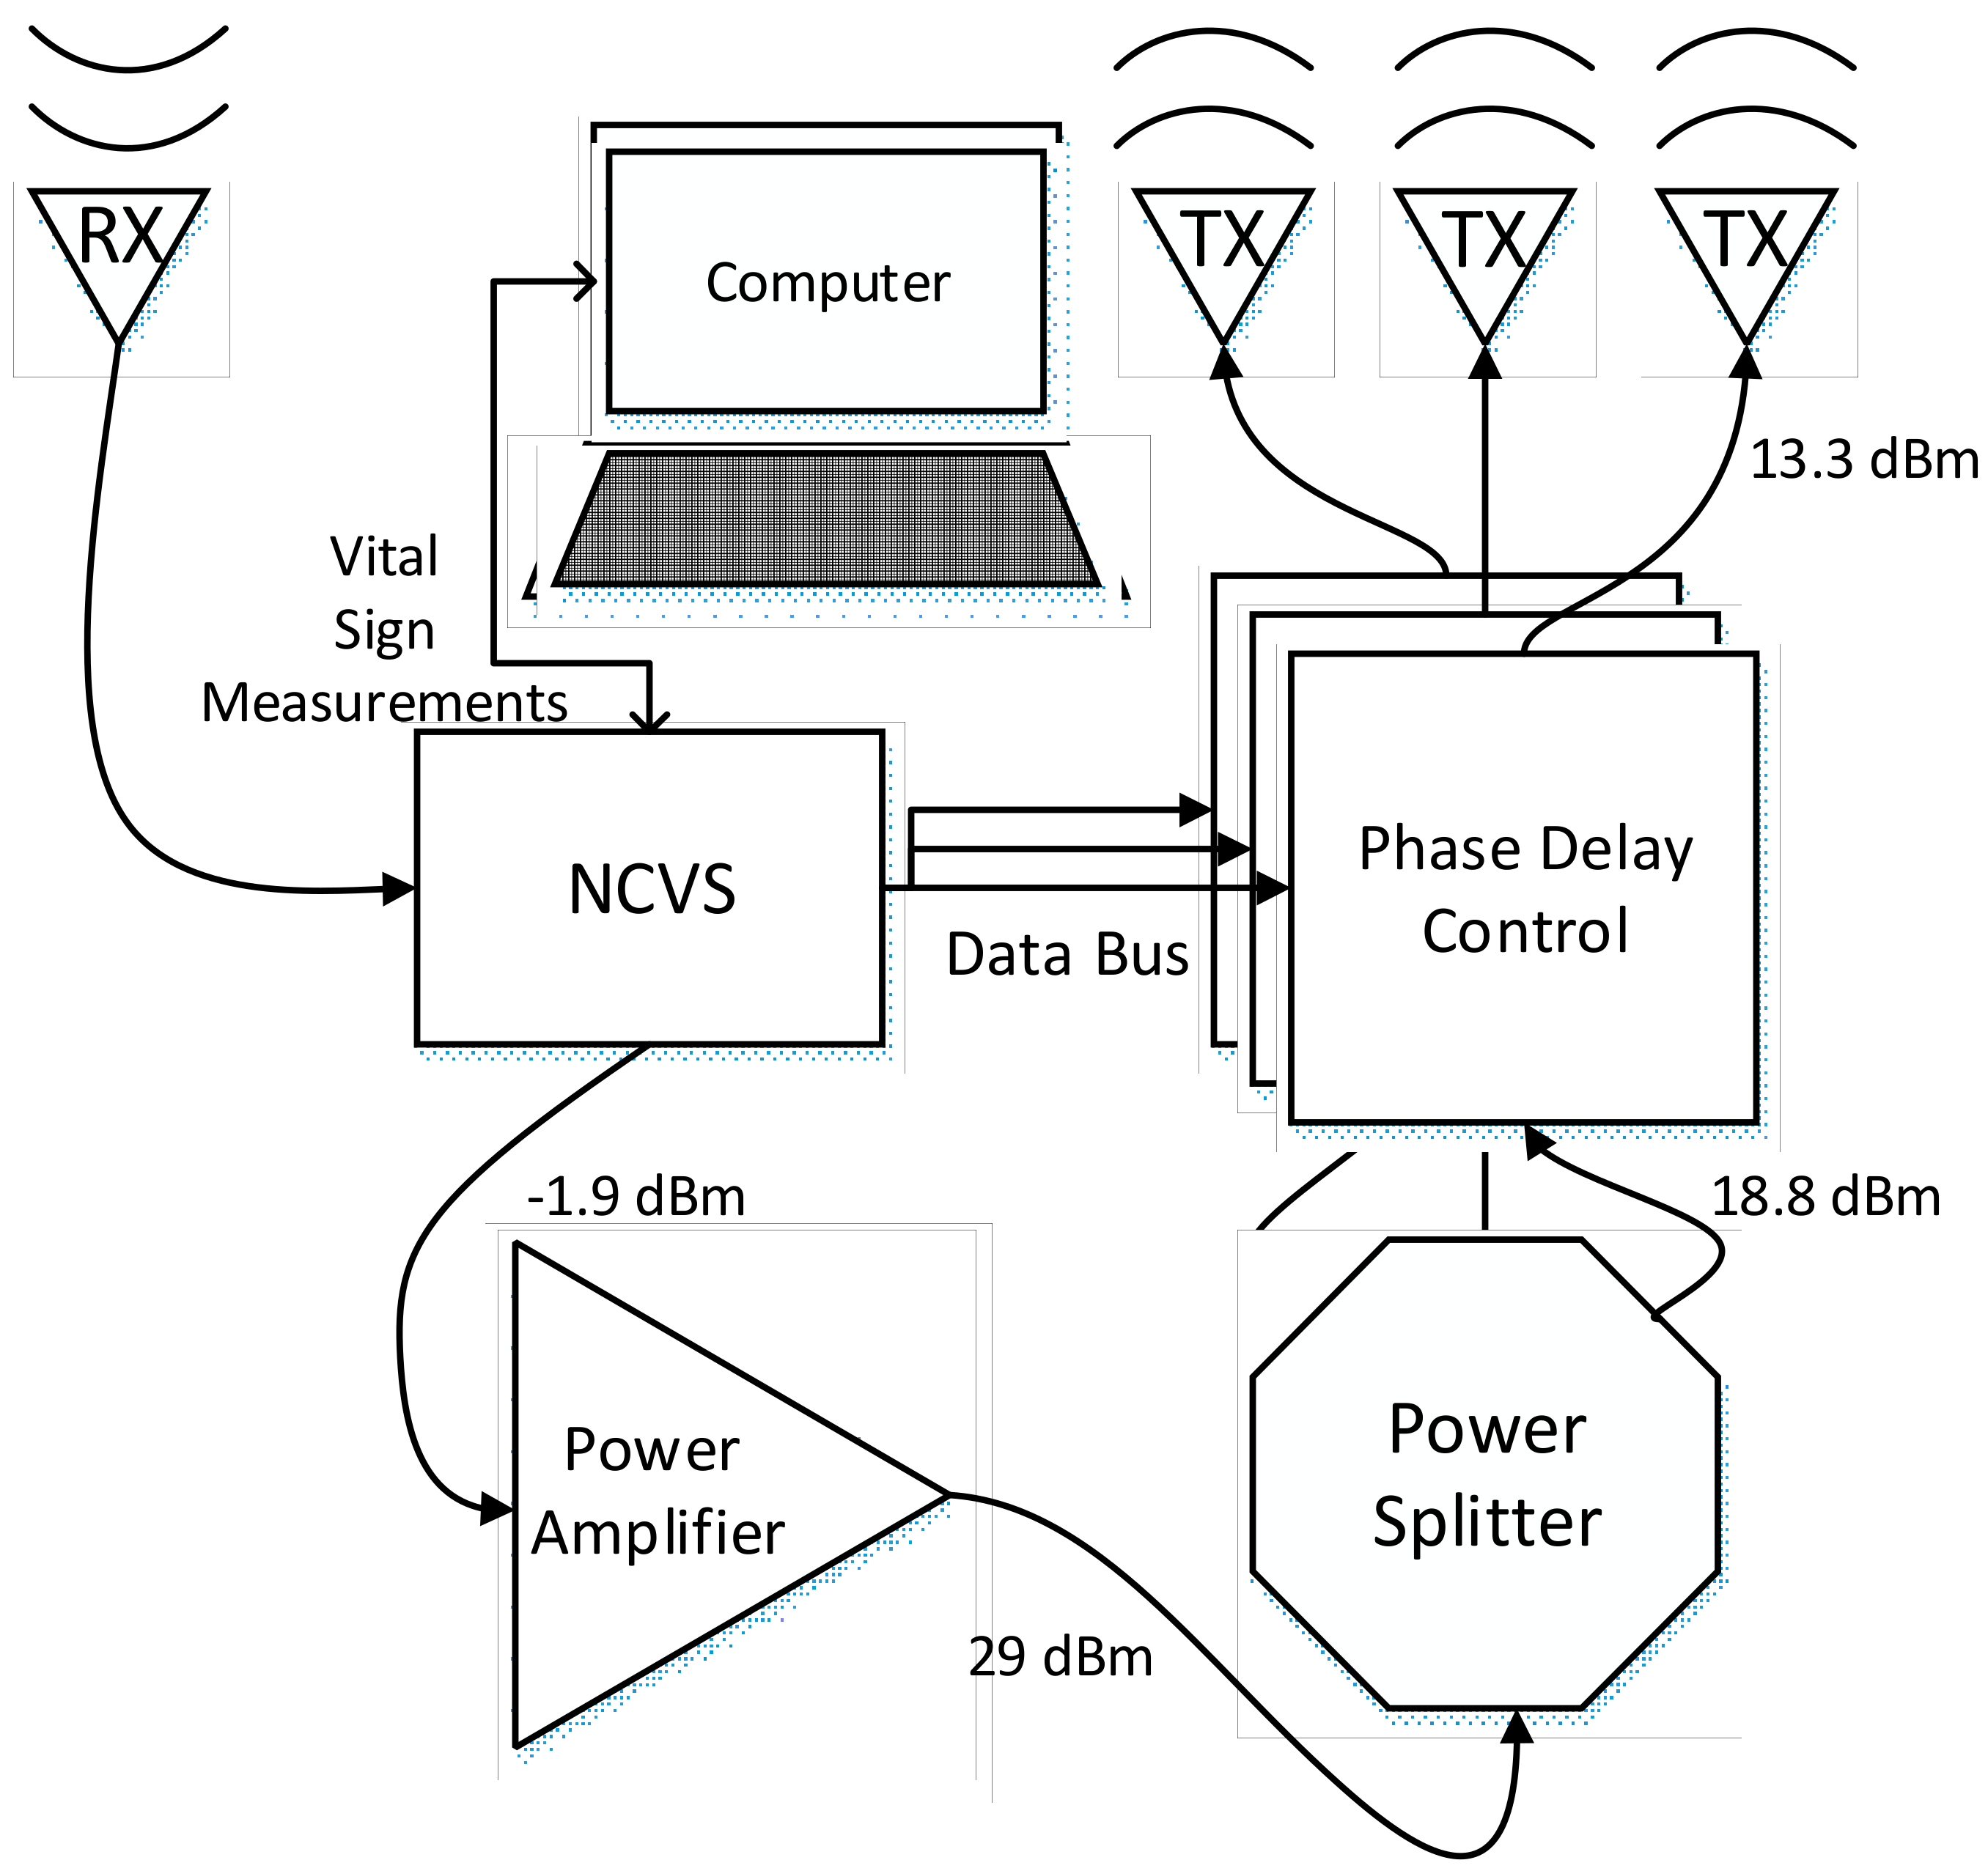
3.2. Testing the Phase Delay Selection Board and Automatic Beam Steering Algorithm for Our 5th Generation Phased Array NCVS Sensor
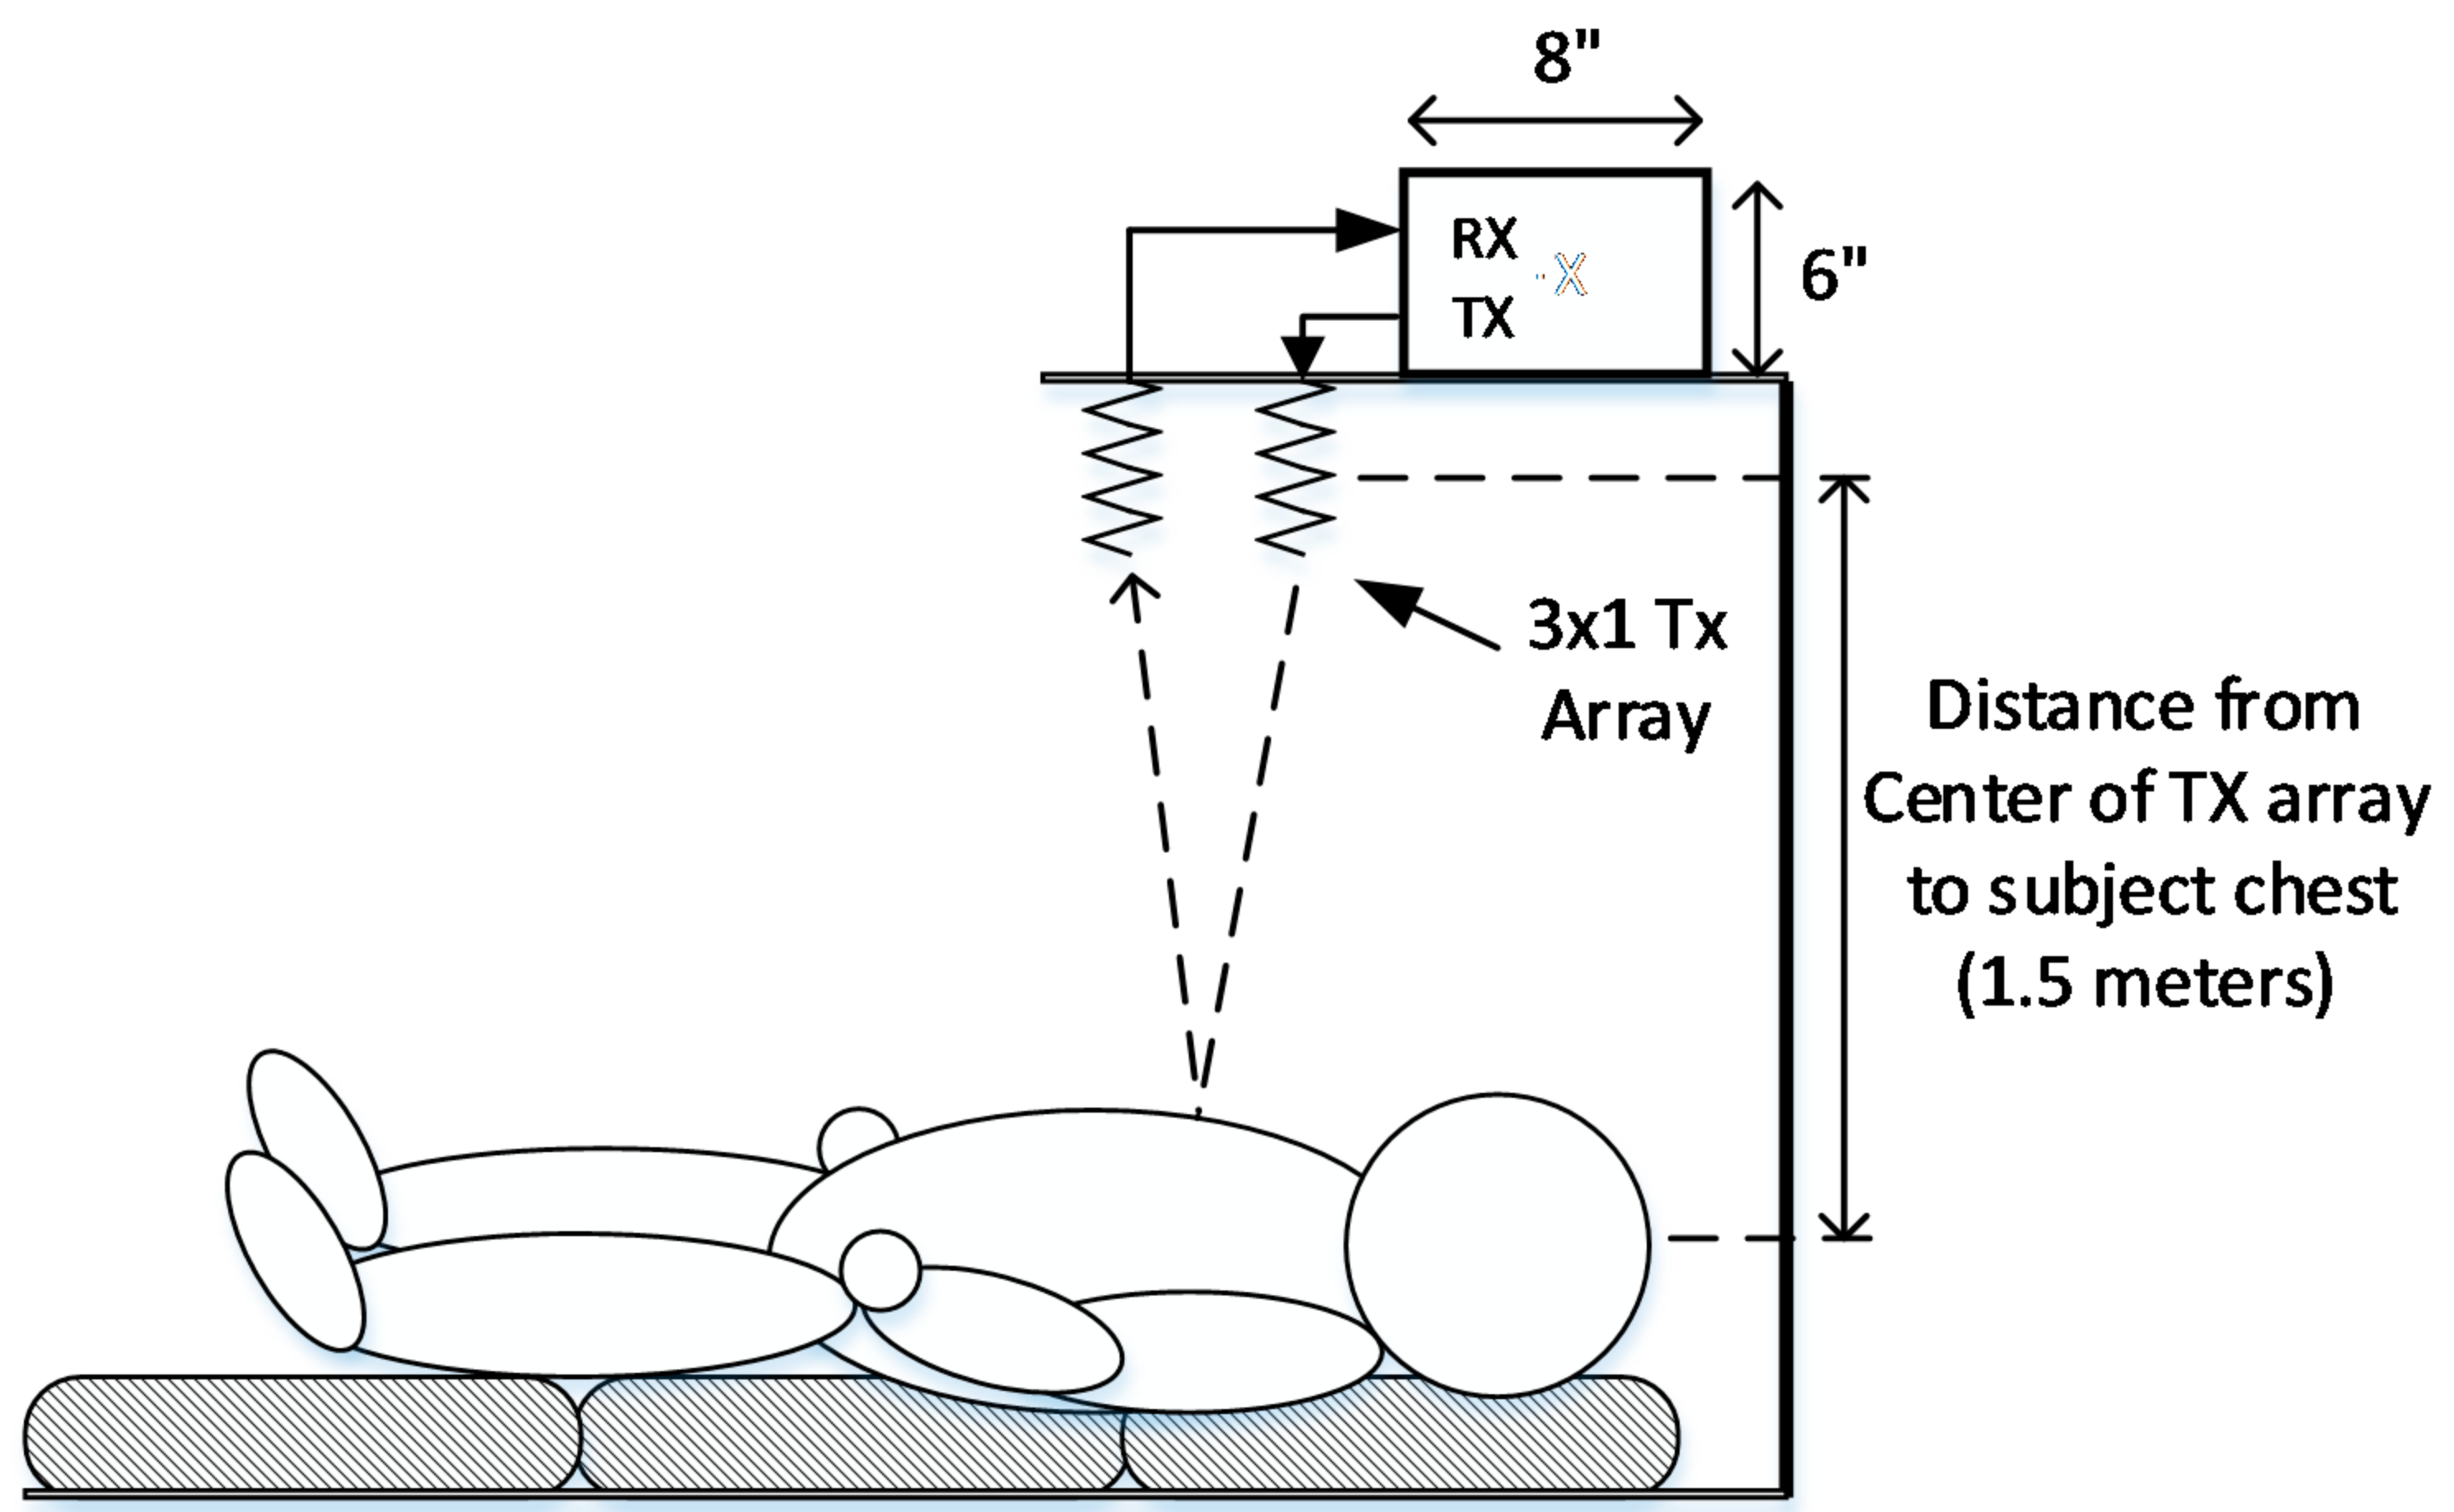
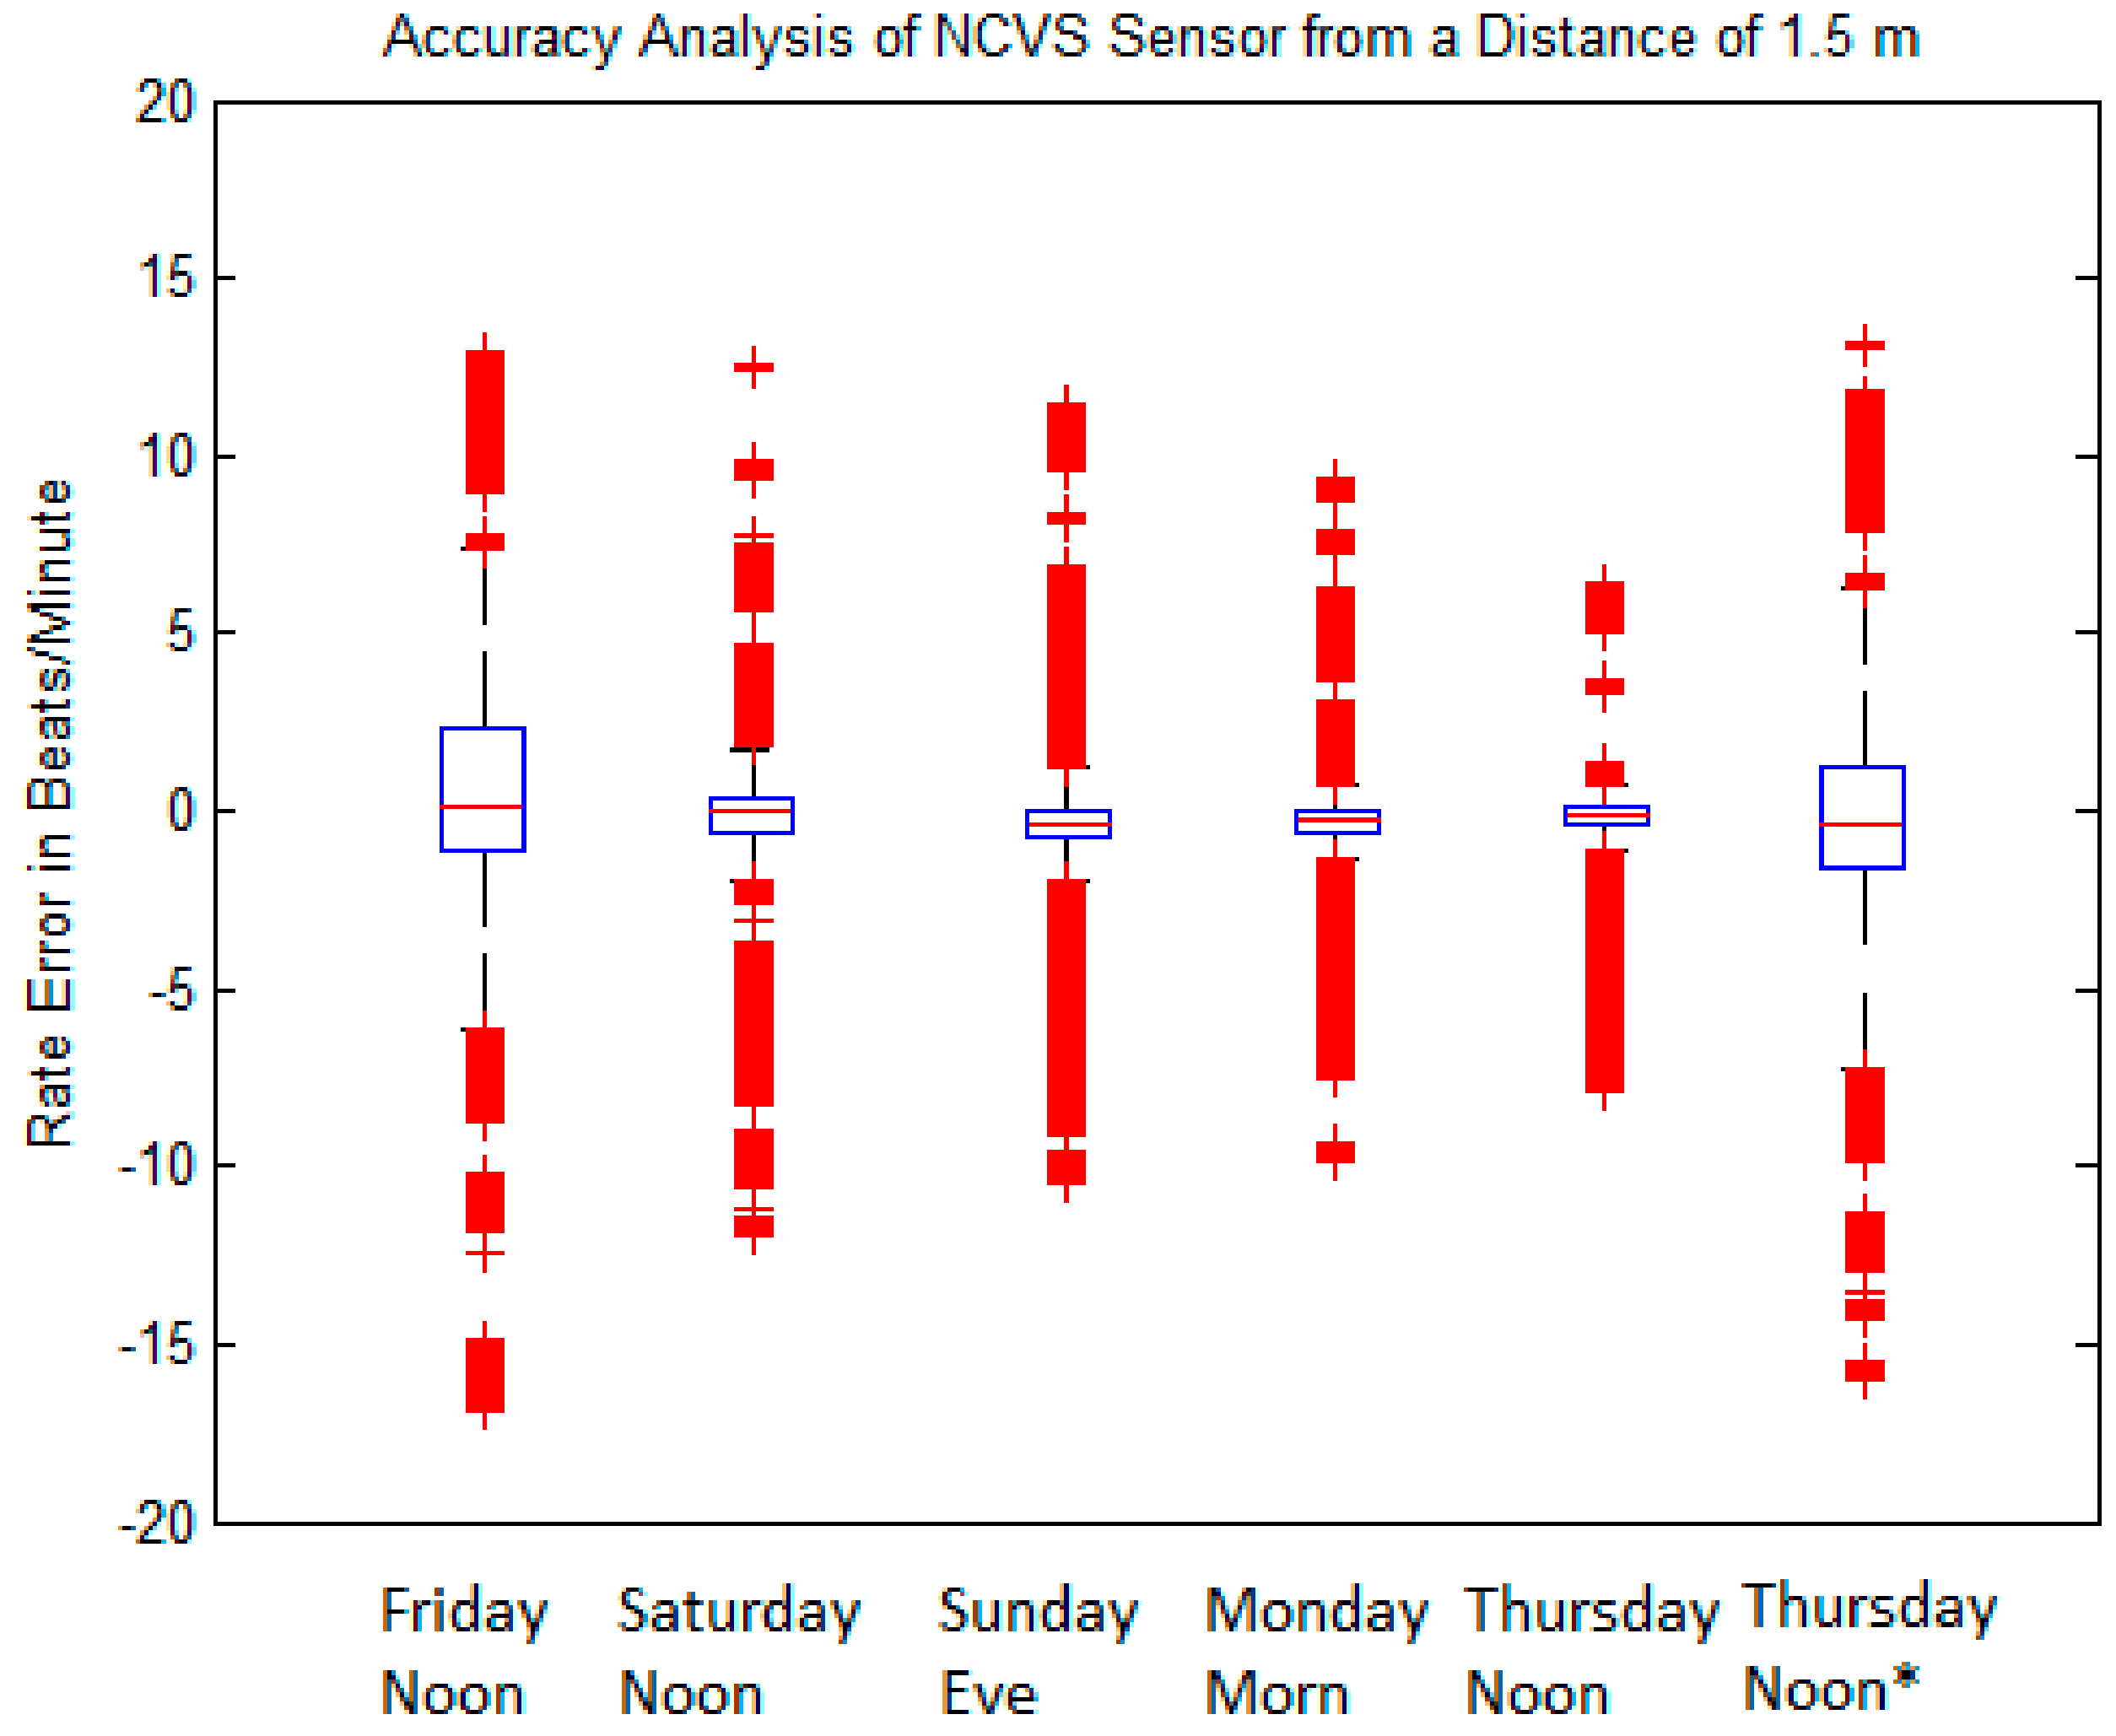
3.3. Long-Term Measurement Performance of Our Phased-Array Sensor
4. Conclusions
Conflicts of Interest
References
- Boric-Lubecke, O.; Lubecke, V.M.; Droitcour, A.D.; Park, B.K.; Singh, A. Doppler Radar Physiological Sensing; Wiley: Hoboken, NJ, USA, 2016. [Google Scholar]
- Murata’s Contactless Bed Sensors. Available online: http://www.murata.com/en-us/products/sensor/accel/sca10h_11h (accessed on 15 November 2017).
- Emfit, Corp. Movement Monitor. Available online: http://www.emfitcorp.com/index.php?page=movement-monitor (accessed on 15 November 2017).
- Satoshi, S.; Matsui, T.; Kagawa, M.; Asao, T.; Kotani, K. An approach to a non-contact vital sign monitoring using dual-frequency microwave radars for elderly care. J. Biomed. Sci. Eng. 2013, 6, 704–711. [Google Scholar]
- Microsoft. Kinect for Xbox One. 2016. Available online: http://www.xbox.com/en-US/xbox-one/accessories/kinect-for-xbox-one (accessed on 15 November 2017).
- Woollaston, V. The Sensor that Reads Your Heartbeat from Four Feet Away without Touching You. 13 September 2013. Available online: http://www.dailymail.co.uk/sciencetech/article-2408748/The-sensor-reads-heartbeat-feet-away-WITHOUT-touching-you.html (accessed on 15 November 2017).
- YouTube. New Xbox One: Kinect-Game|Life-WIRED Exclusive. 2013. Available online: https://www.youtube.com/watch?v=Hi5kMNfgDS4 (accessed on 15 November 2017).
- Kumar, M.; Veeraraghavan, A.; Sabharwal, A. DistancePPG: Robust non-contact vital. Boimed. Opt. Express 2015, 6, 1565–1588. [Google Scholar] [CrossRef] [PubMed]
- U.S. National Institutes of Health. Non-Contact Measurement of Vital Signs. 2016. Available online: https://clinicaltrials.gov/ct2/show/NCT02287220 (accessed on 15 November 2017).
- Chekmenev, S.Y.; Rara, H.; Farag, A.A. Non-contact, Wavelet-based Measurement of Vital Signs using Thermal Imaging. In Proceedings of the First International Conference on Graphics, Vision and Image Processing (GVIP), Cairo, Egypt, 19 December 2006; pp. 107–112. [Google Scholar]
- Lin, J.C. Microwave sensing of physiological movement and volume change: A review. Bioelectromagnetics 1992, 13, 557–656. [Google Scholar] [CrossRef] [PubMed]
- Panasonic Corporation. Kyoto University and Panasonic Developed New Remote Sensing Technology for Vital Signs by Millimeter-Wave Radar. 22 January 2016. Available online: http://news.panasonic.com/global/stories/2016/44718.html (accessed on 15 November 2017).
- SENSIOTEC. Vitual Medical Assistant. 2016. Available online: https://www.youtube.com/watch?v=El88VU6dYdo (accessed on 15 November 2017).
- Hall, T.; Nukala, B.; Stout, C.; Brewer, N.; Tsay, J.; Lopez, J.; Banister, R.E.; Nguyen, T.; Lie, D.Y.C. A Phased Array Non-Contact Vital Signs Sensor with Automatic Beam Steering. In Proceedings of the IEEE International Microwave Symposium (IMS2015), Phoenix, Arizona, 17–22 May 2015; pp. 1–4. [Google Scholar]
- Hall, T.; Stout, C.; Brewer, N.; Dominguez, G.; Tsay, J.; Boothby, A.; Das, V.; Lopez, J.; Nguyen, T.; Banister, R.E.; et al. Extending the Range of Phased Array Non-Contact Vital Signs Monitoring in an Office Cubicle Setting. In Proceedings of the IEEE Texas Symposium on Wireless and Microwave Circuits and Systems (TSWMCS), Waco, TX, USA, 7–8 April 2014; pp. 1–4. [Google Scholar]
- Hall, T.; Dominguez, G.; Tsay, J.; Boothby, A.; Lopez, J.; Nguyen, T.; Lie, D.Y.C. Robust Phased Array Non-Contact Vital Signs Monitoring in an Office Cubicle Setting. In Proceedings of the 1st International Conference on Intelligent Green Building and Smart Grid (IGBSG), Taipei, Taiwan, 23–25 April 2014; pp. 1–4. [Google Scholar]
- Lie, D.Y.C.; Ichapurapu, R.; Jain, S.; Lopez, J.; Banister, R.E.; Nguyen, T.Q.; Griswold, J. A 2.4GHz Non-Contact Biosensor System for Continuous Monitoring of Vital-Signs, Telemedicine Techniques and Applications; Graschew, G., Ed.; InTech: Rijeka, Croatia, 2011; Available online: http://www.intechopen.com/books/telemedicine-techniques-and-applications/a-2-4ghz-non-contact-biosensor-system-for-continuous-monitoring-of-vital-signs (accessed on 15 November 2017)ISBN 978-953-307-354-5.
- Boothby, A. Investigation of Phased Array Antenna Systems for Non-Contact Vital Signs Sensing. Master’s Thesis, Texas Tech University, Lubbock, TX, USA, 2012. [Google Scholar]
- Hall, T.; Malone, N.A.; Nukala, B.; Tsay, J.; Lopez, J.; Banister, R.E.; Nguyen, T.; Lie, D.Y.C. A Phased Array Non-Contact Vital Sign Sensor System with Automatic Beam Steering for Tracking and Long-Term Continuous-Time Monitoring. In Proceedings of the 38th Annual International Conference of the IEEE Engineering in Medicine and Biology Society (EMBC’16), Orlando, FL, USA, 16–20 August 2016. [Google Scholar]


| Condition | Delay 1 | Delay 2 | Delay 3 | Measured Steering Angle | Direction |
|---|---|---|---|---|---|
| 1 | 0° | 90° | 180° | 13.3° | Right |
| 2 | 0° | 60° | 120° | 9.9° | Right |
| 3 | 0° | 20° | 40° | 3.9° | Right |
| 4 | 0° | 0° | 0° | 0° | Straight |
| 5 | 40° | 20° | 0° | −4.6° | Left |
| 6 | 120° | 60° | 0° | −10.1° | Left |
| 7 | 180° | 90° | 0° | −14.1° | Left |
| POUT (at Each TX Antenna Port) | Distance from Subject | 50 cm | 75 cm | 100 cm | 150 cm | 200 cm |
|---|---|---|---|---|---|---|
| −12.5 dBm | Within 1 bpm | 83.7% | 78.0% | 40.2% | ||
| Within 2 bpm | 88.8% | 83.3% | 42.9% | |||
| Within 5 bpm | 93.0% | 91.4% | 51.80% | |||
| IQR | 0.45 | 0.62 | 19.8 | |||
| STDEV | 4.81 | 3.91 | 13.25 | |||
| 9.7 dBm | Within 1 bpm | 92.7% | 86.2% | 80.3% | 30.8% | |
| Within 2 bpm | 94.4% | 89.4% | 85.3% | 37.4% | ||
| Within 5 bpm | 95.9% | 93.2% | 89.9% | 48.1% | ||
| IQR | 0.33 | 0.44 | 0.66 | 12.9 | ||
| STDEV | 2.06 | 3.56 | 4.05 | 12.2 | ||
| 16.25 dBm | Within 1 bpm | 84.9% | 84.8% | 85.5% | 81.8% | |
| Within 2 bpm | 89.8% | 88.0% | 88.8% | 86.60 | ||
| Within 5 bpm | 93.3% | 92.3% | 93.6% | 91.8% | ||
| IQR | 0.5 | 0.47 | 0.49 | 0.64 | ||
| STDEV | 2.86 | 3.52 | 2.74 | 4.96 |
| Friday Noon | Saturday Noon | Sunday Eve | Monday Morn | Thursday Noon | Thursday Noon * | |
|---|---|---|---|---|---|---|
| 1 BPM | 69.89 | 89.16 | 89.03 | 88.86 | 87.22 | 75.42 |
| 2 BPM | 76.60 | 92.19 | 92.66 | 91.99 | 89.22 | 79.40 |
| 5 BPM | 83.46 | 93.69 | 95.23 | 93.82 | 92.86 | 82.34 |
| IQR | 1.433 | 0.647 | 0.602 | 0.505 | 0.610 | 1.448 |
| STDEV | 4.306 | 2.419 | 2.134 | 1.941 | 1.821 | 4.288 |
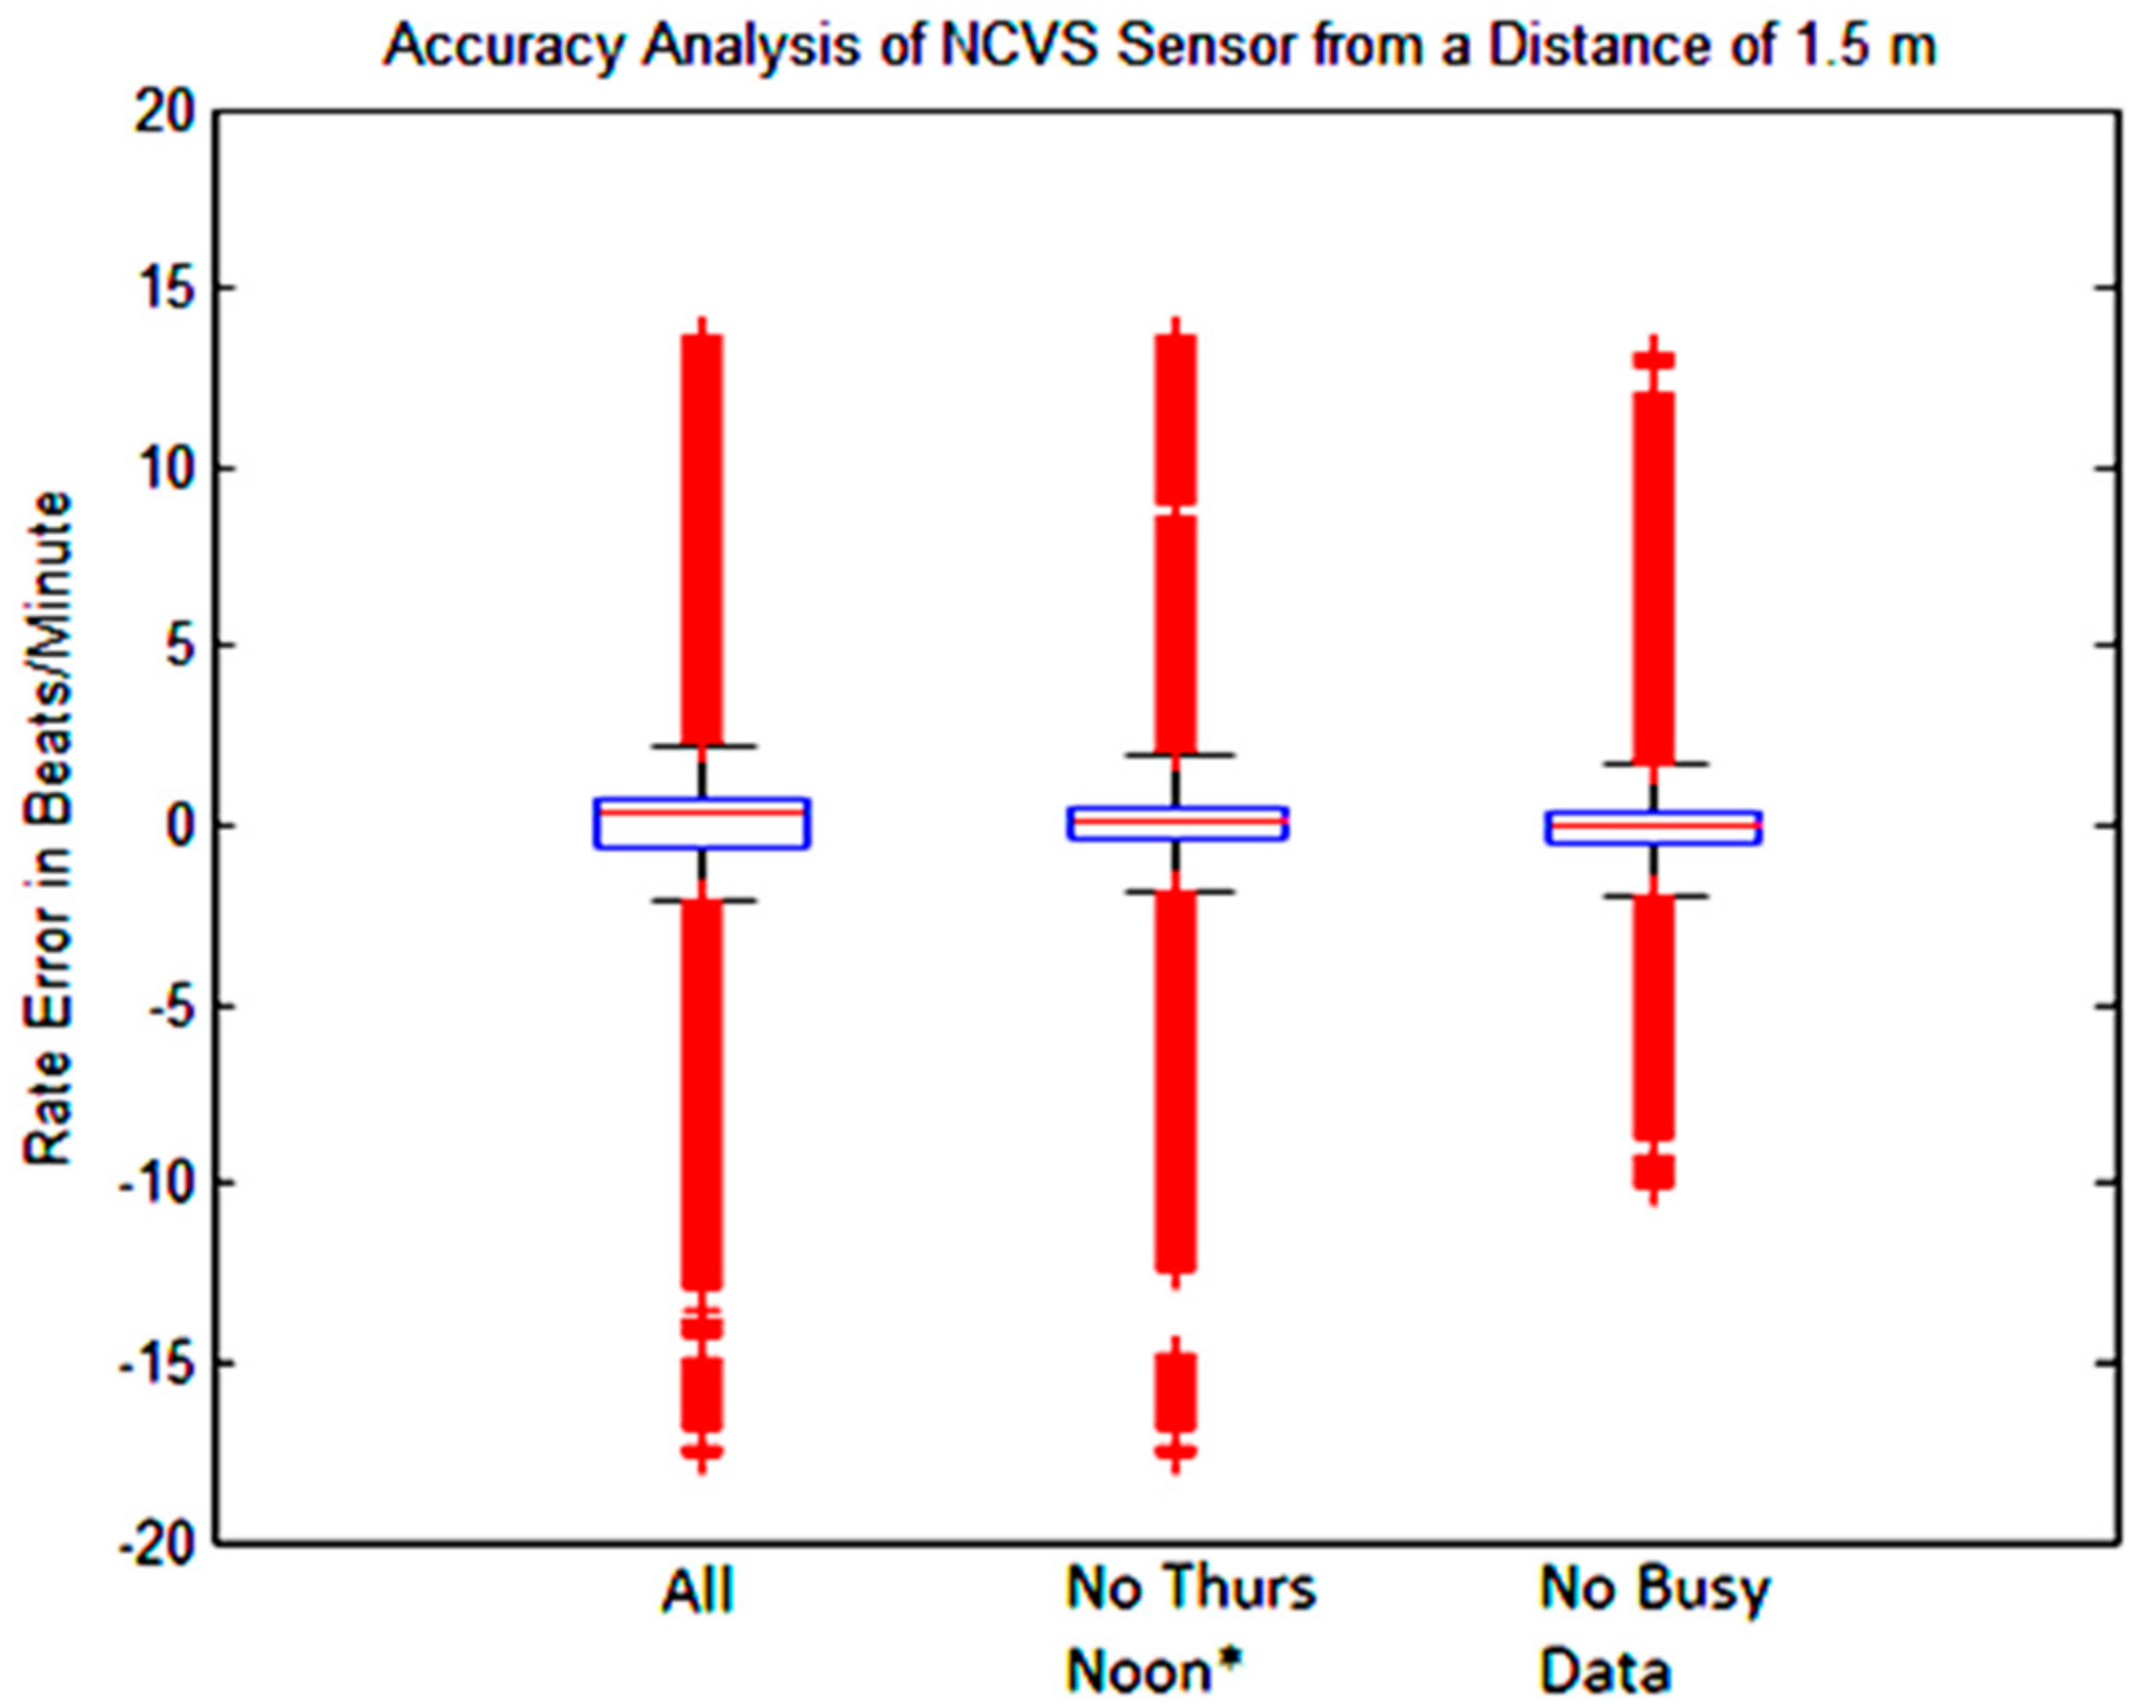
| All Data | No Thurs. Noon * | No “Busy Data” | |
|---|---|---|---|
| 1 BPM | 83.26 | 84.83 | 88.57 |
| 2 BPM | 87.01 | 88.53 | 91.51 |
| 5 BPM | 90.23 | 91.81 | 93.90 |
| IQR | 0.87 | 0.759 | 0.591 |
| STDEV | 2.82 | 2.524 | 2.079 |
© 2017 by the authors. Licensee MDPI, Basel, Switzerland. This article is an open access article distributed under the terms and conditions of the Creative Commons Attribution (CC BY) license (http://creativecommons.org/licenses/by/4.0/).
Share and Cite
Hall, T.; Lie, D.Y.C.; Nguyen, T.Q.; Mayeda, J.C.; Lie, P.E.; Lopez, J.; Banister, R.E. Non-Contact Sensor for Long-Term Continuous Vital Signs Monitoring: A Review on Intelligent Phased-Array Doppler Sensor Design. Sensors 2017, 17, 2632. https://doi.org/10.3390/s17112632
Hall T, Lie DYC, Nguyen TQ, Mayeda JC, Lie PE, Lopez J, Banister RE. Non-Contact Sensor for Long-Term Continuous Vital Signs Monitoring: A Review on Intelligent Phased-Array Doppler Sensor Design. Sensors. 2017; 17(11):2632. https://doi.org/10.3390/s17112632
Chicago/Turabian StyleHall, Travis, Donald Y. C. Lie, Tam Q. Nguyen, Jill C. Mayeda, Paul E. Lie, Jerry Lopez, and Ron E. Banister. 2017. "Non-Contact Sensor for Long-Term Continuous Vital Signs Monitoring: A Review on Intelligent Phased-Array Doppler Sensor Design" Sensors 17, no. 11: 2632. https://doi.org/10.3390/s17112632