Modeling the Energy Performance of LoRaWAN


Abstract
:1. Introduction
2. Related Work
3. LoRaWAN Overview
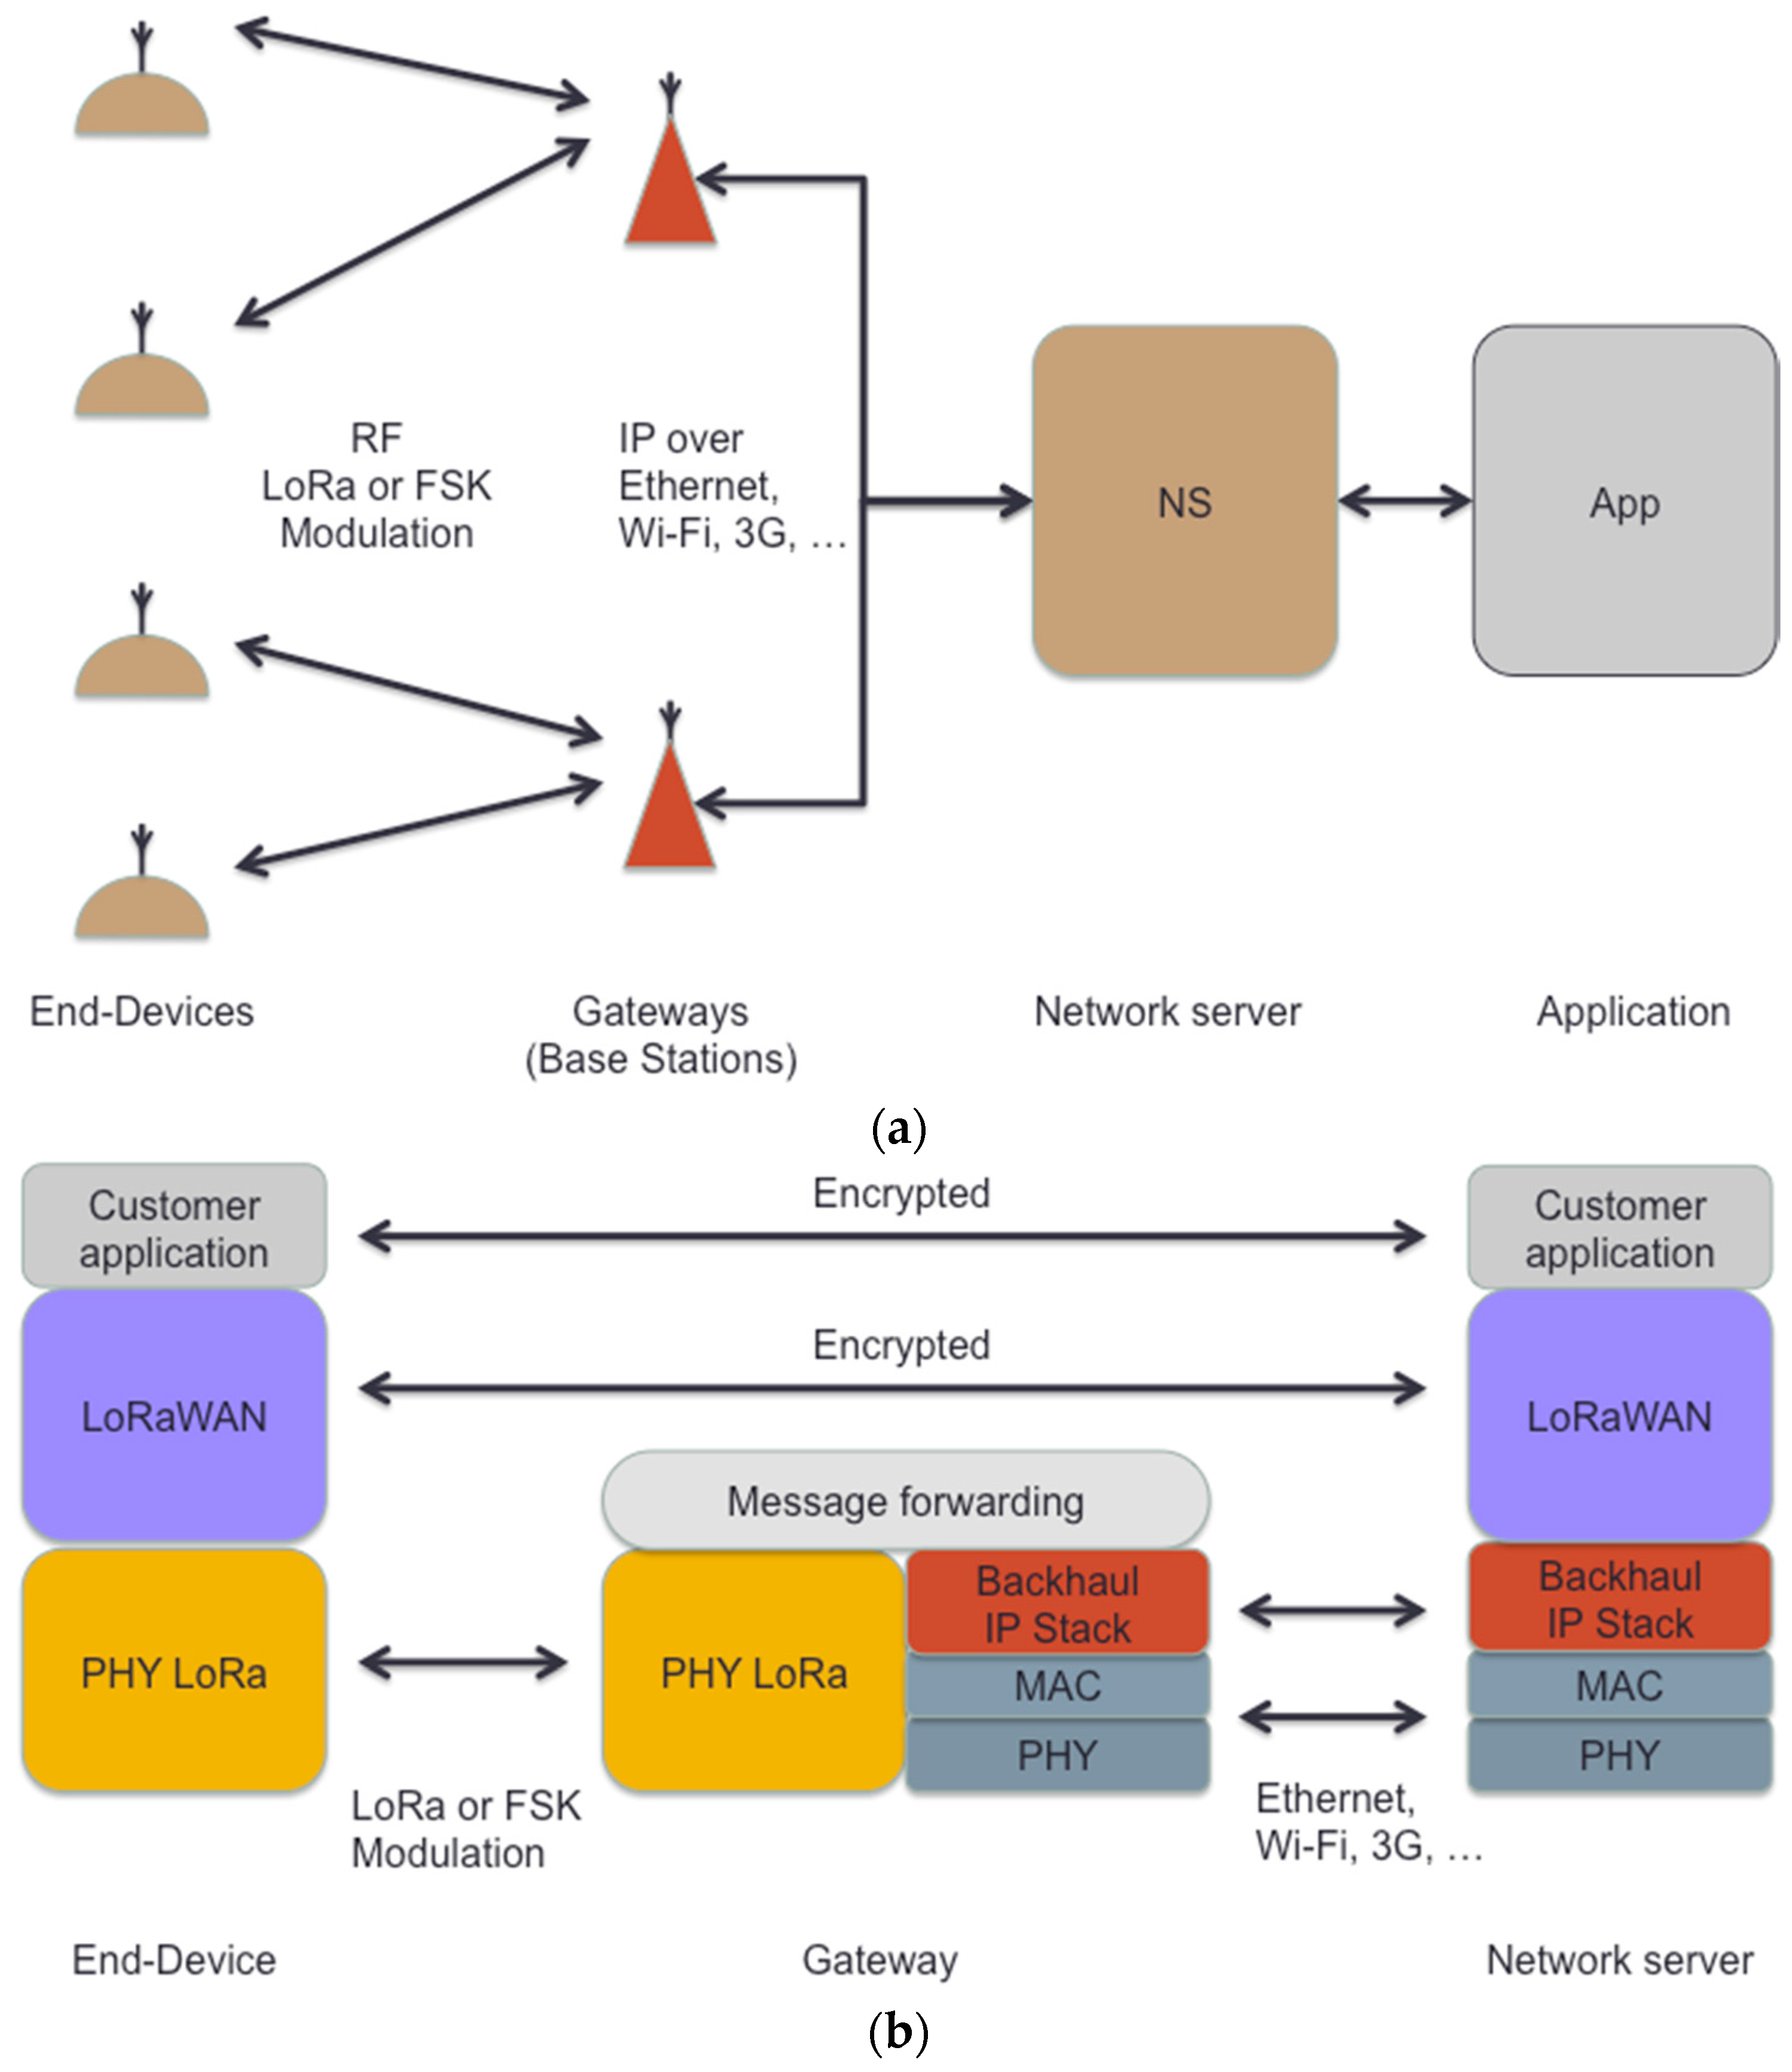
3.1. LoRaWAN General Overview
3.2. LoRaWAN Physical Layer
3.2.1. Physical Layer Main Features
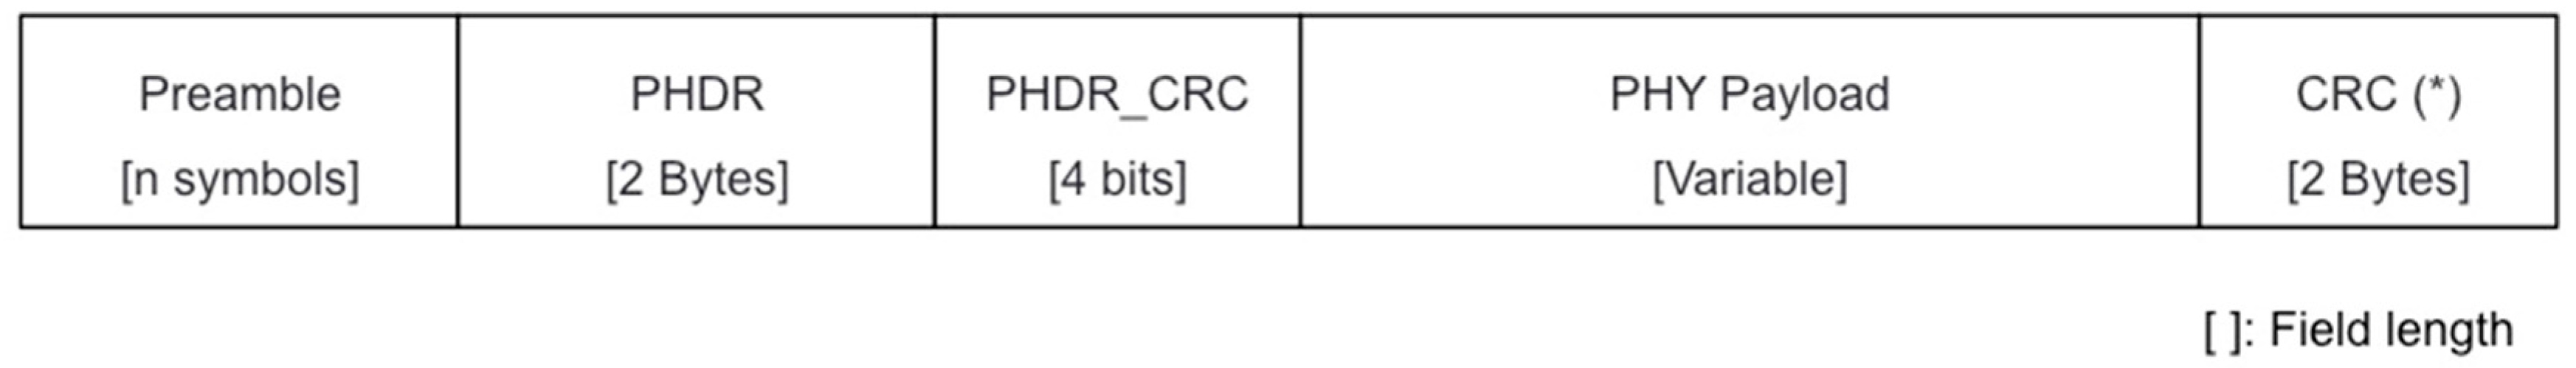
3.2.2. Physical Layer Message Format
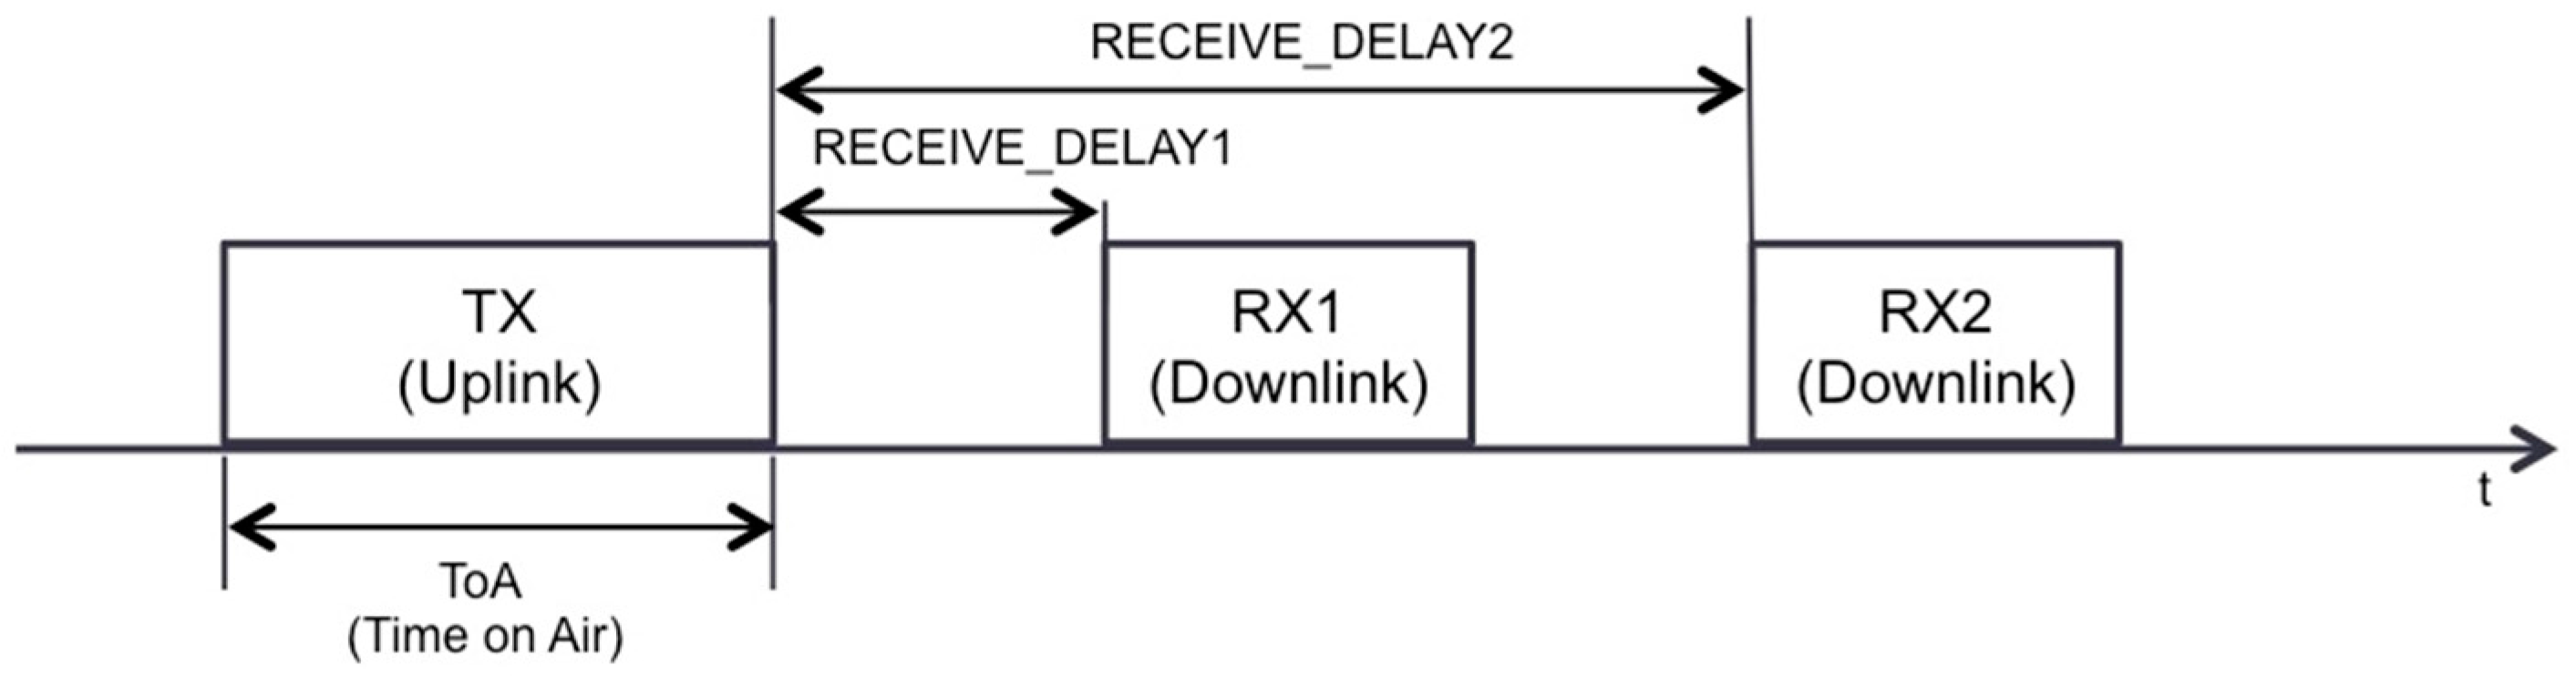
3.2.3. Receive Window Parameters
3.3. LoRaWAN MAC Layer
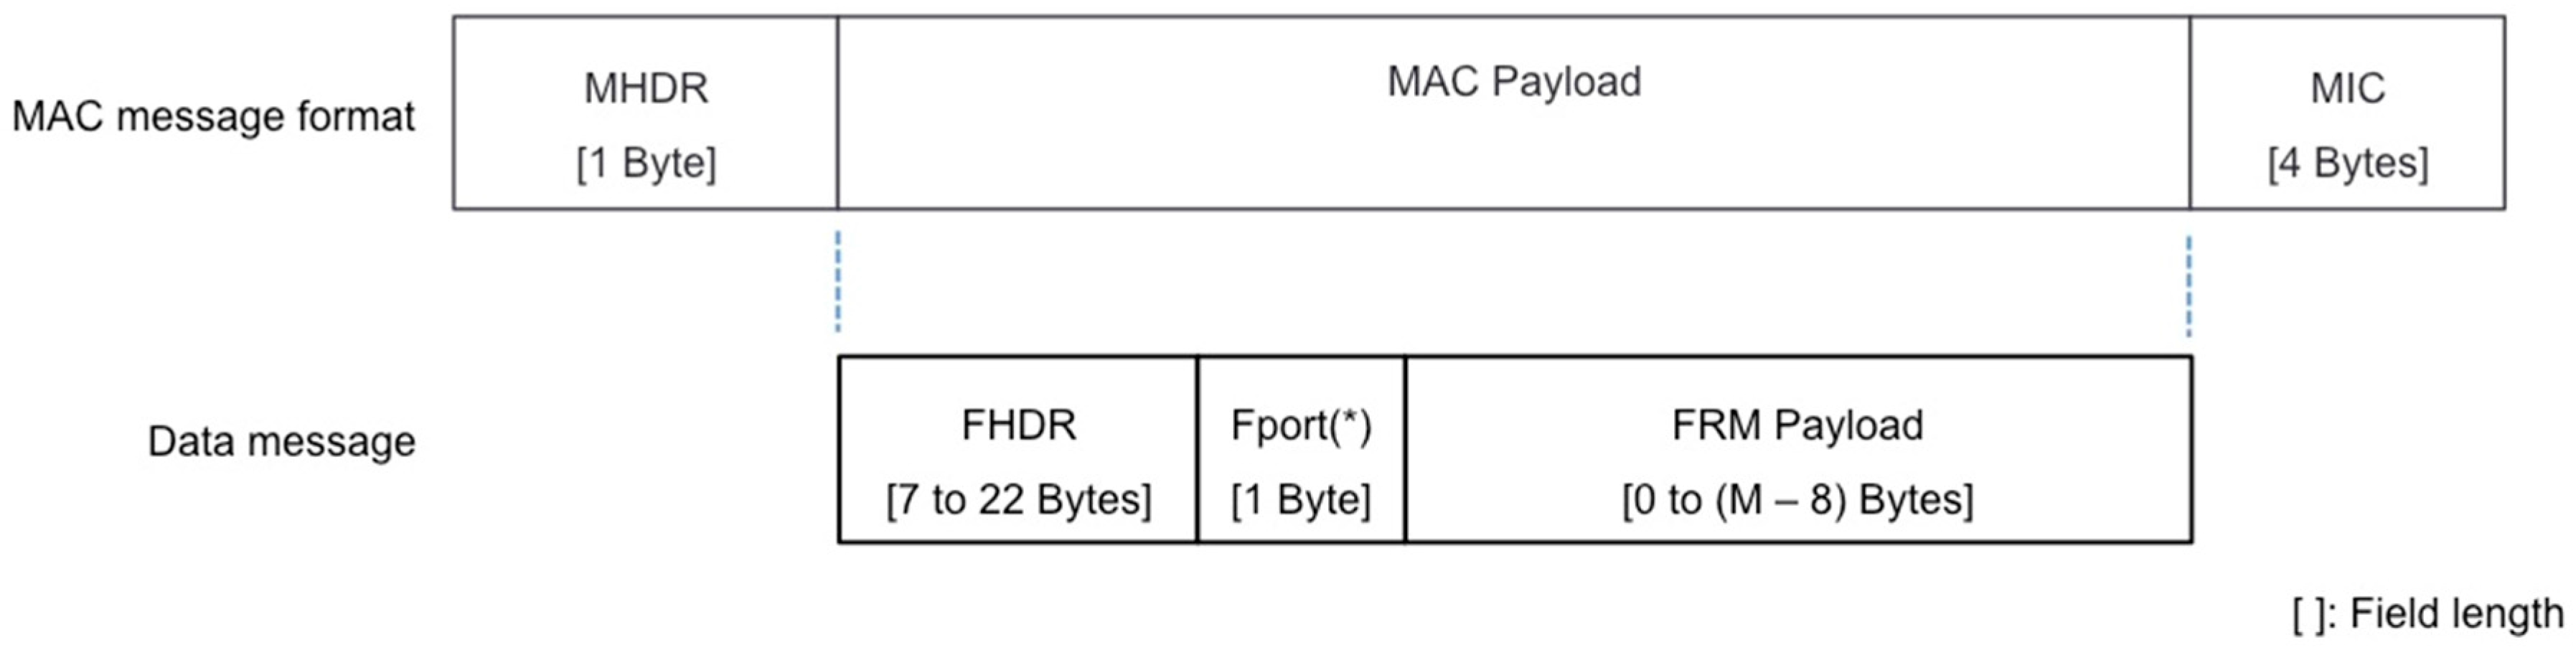
3.3.1. MAC Message Format
3.3.2. Transmission and Retransmission Procedure
4. Modeling LoRaWAN End-Device Current Consumption
4.1. Unacknowledged Transmission
4.2. Acknowledged Transmission
5. Evaluation
5.1. End-Device Current Consumption
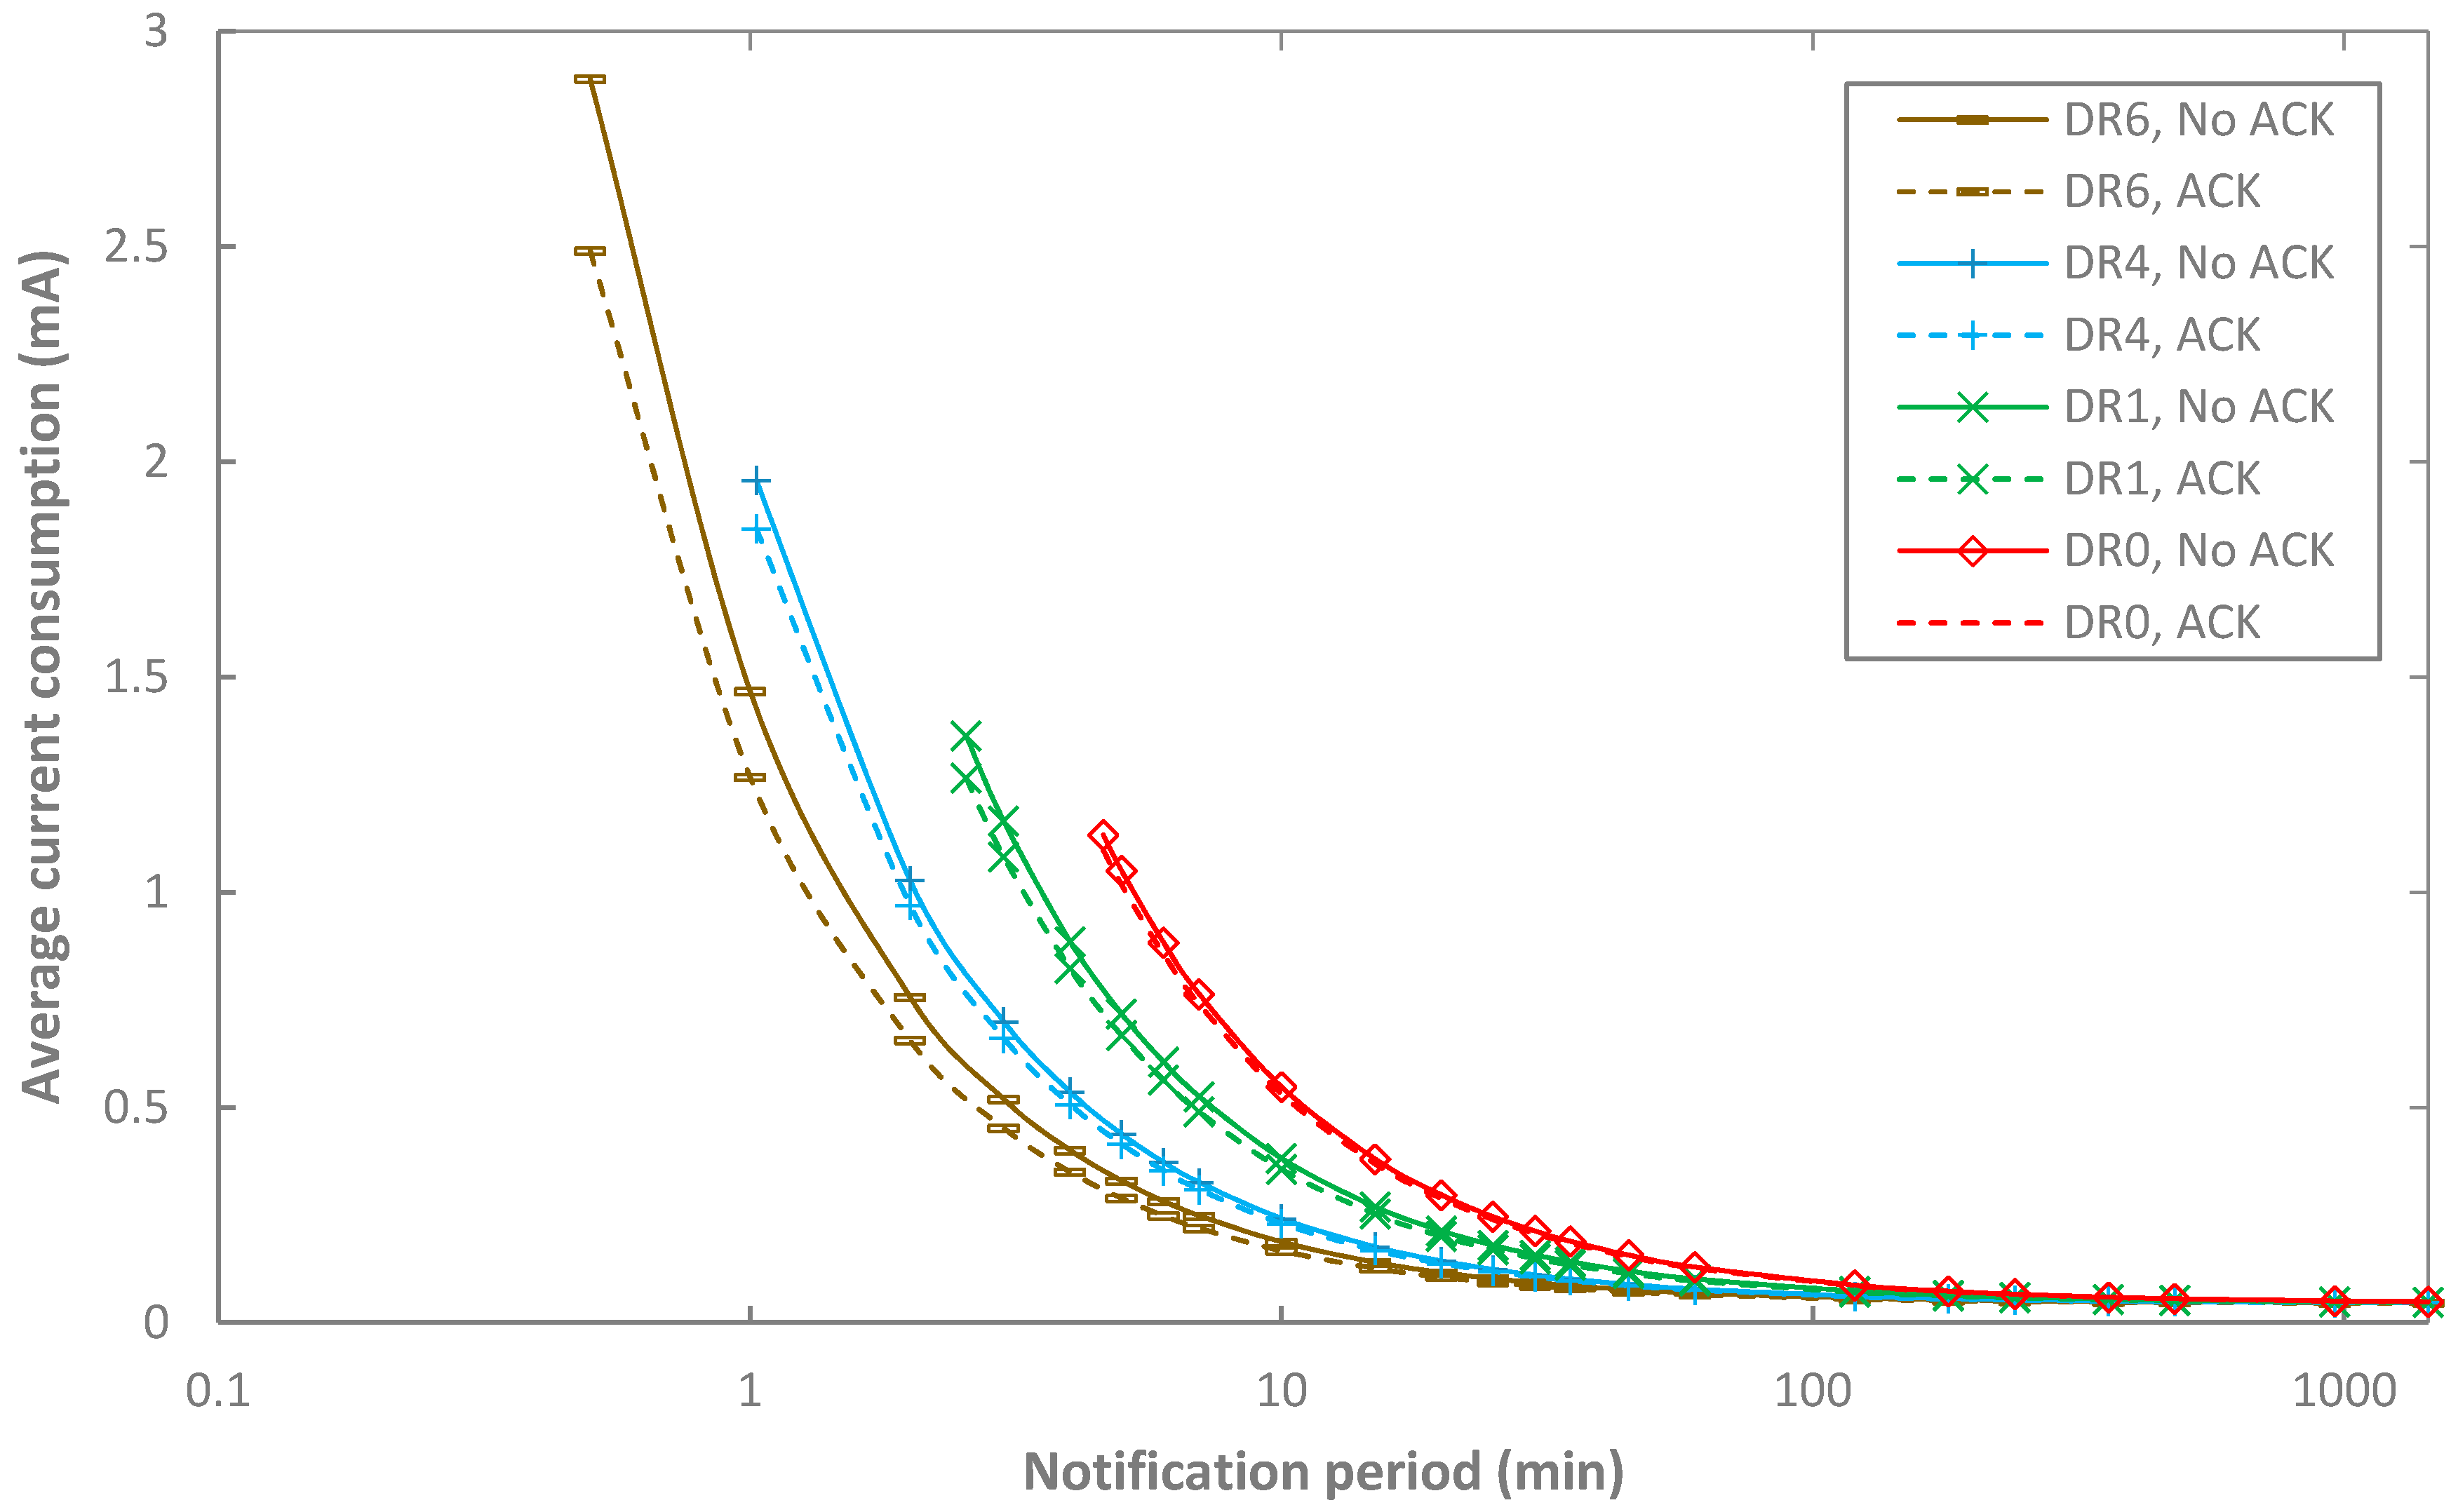
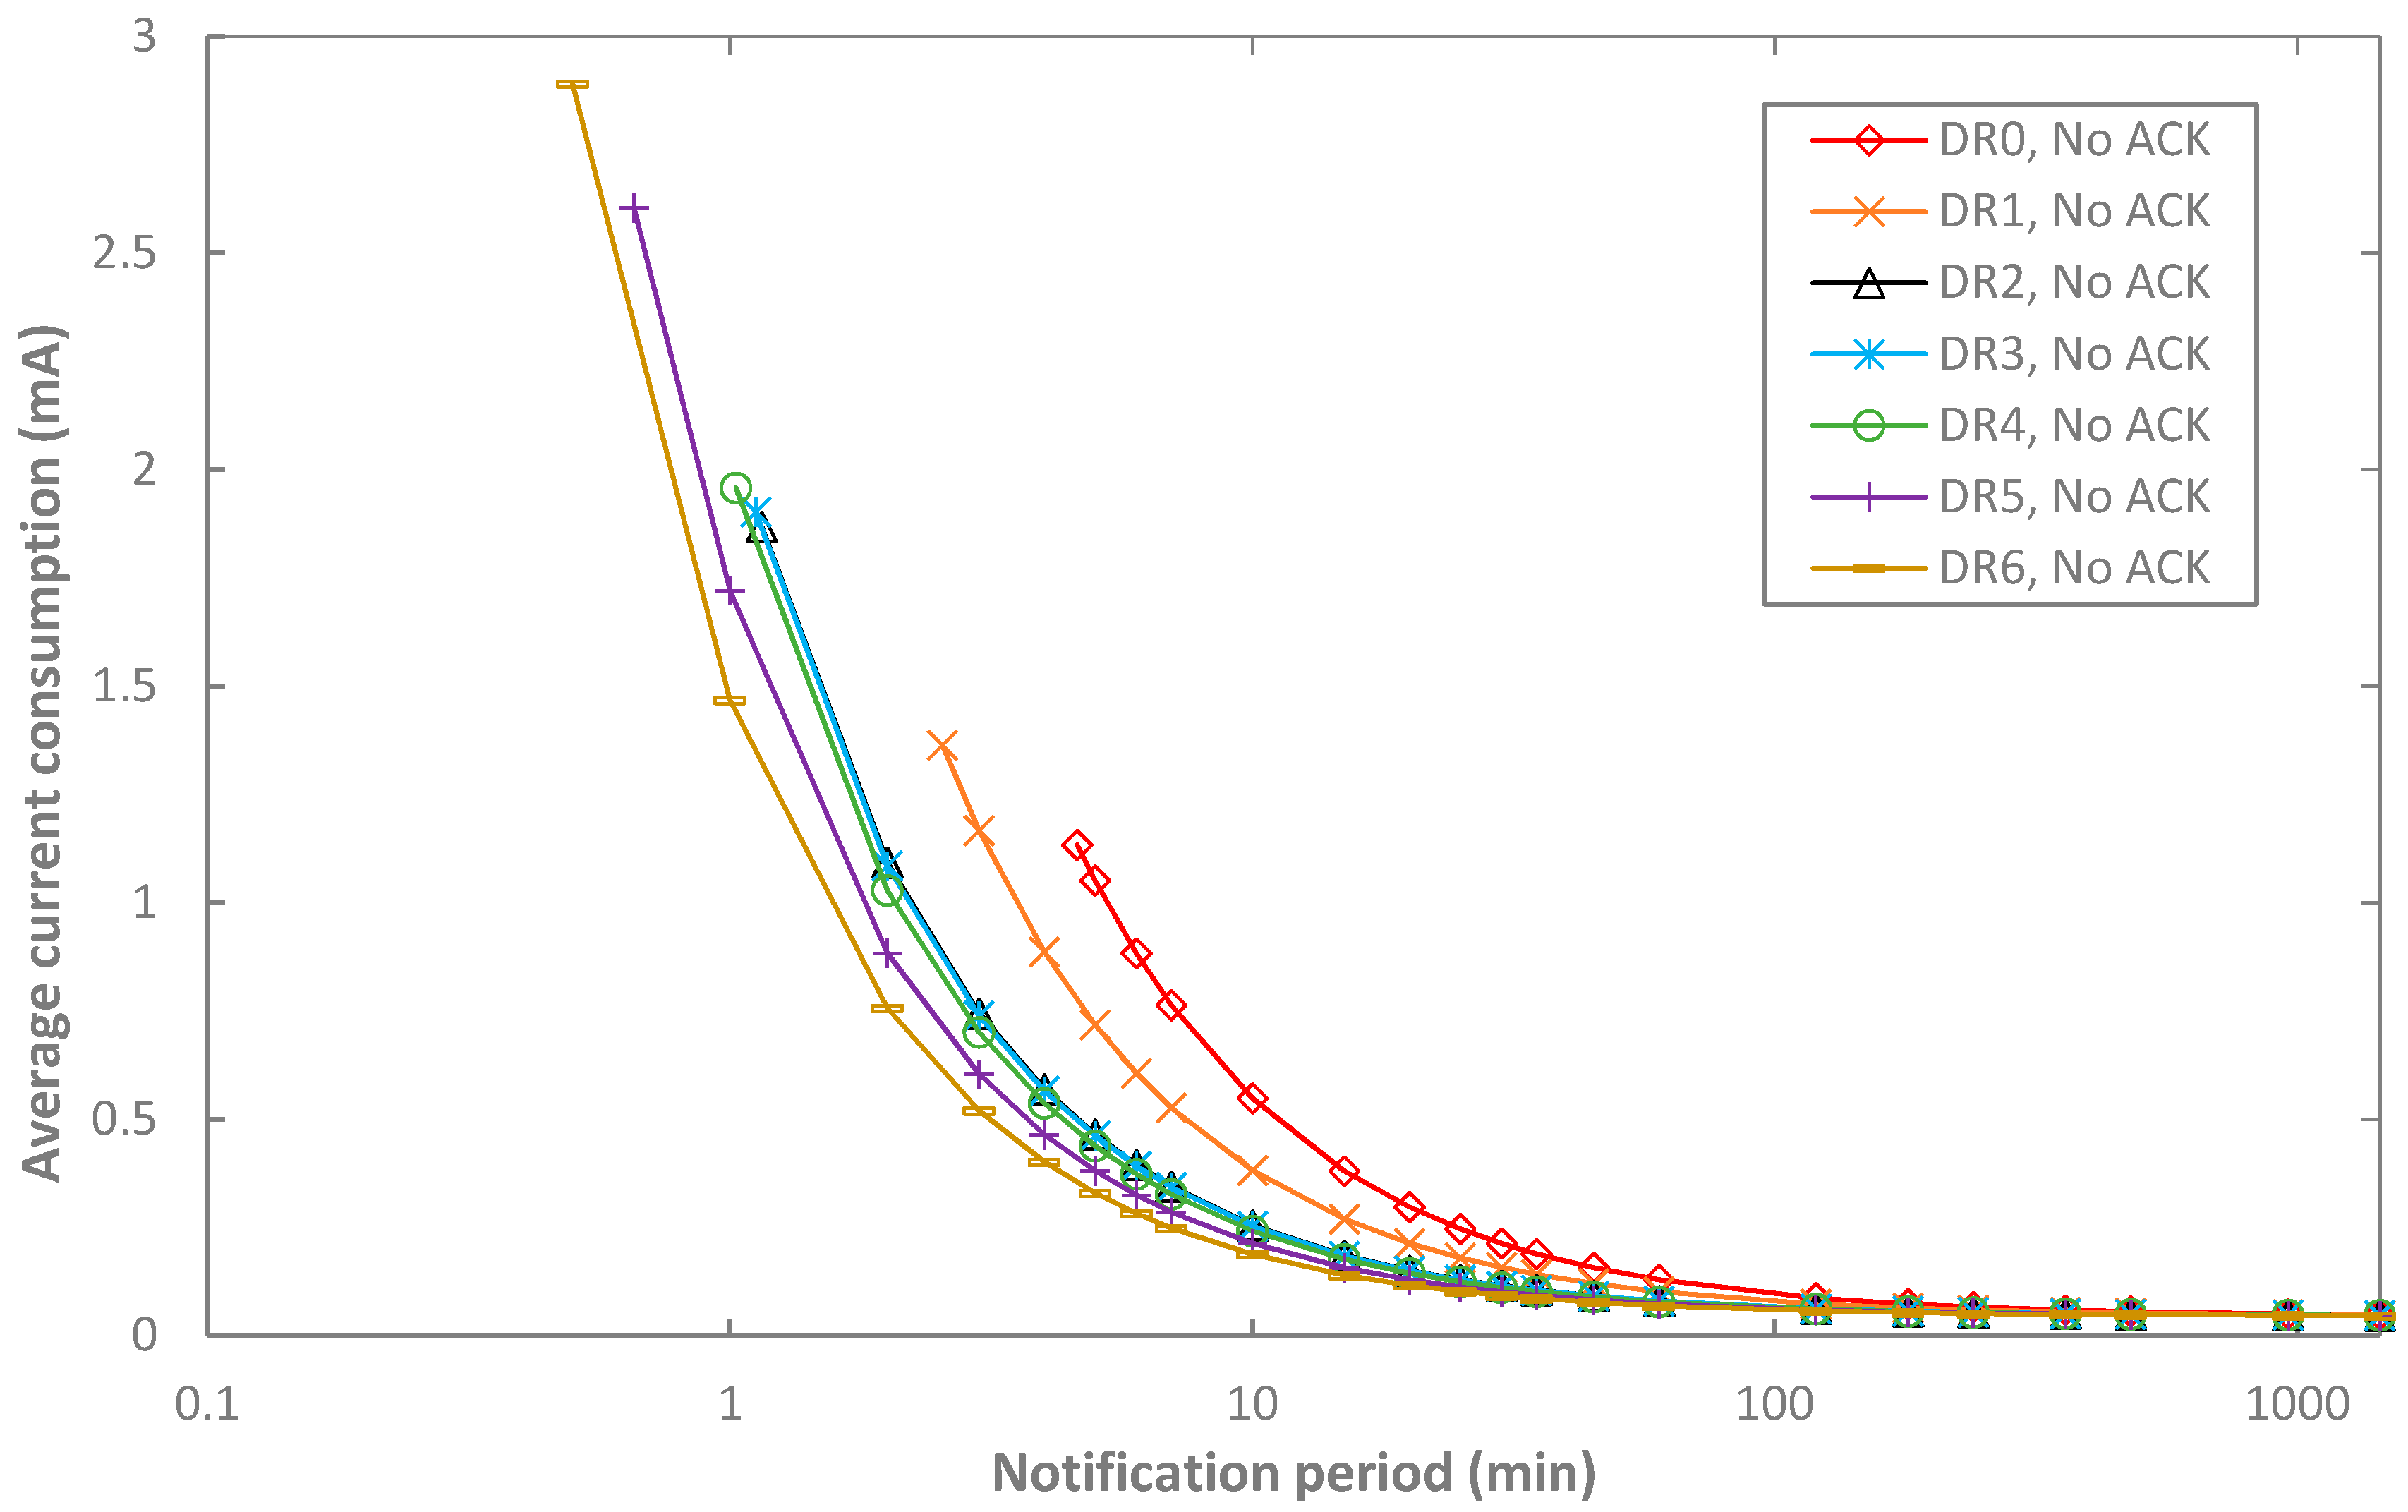
5.1.1. Unacknowledged Transmission
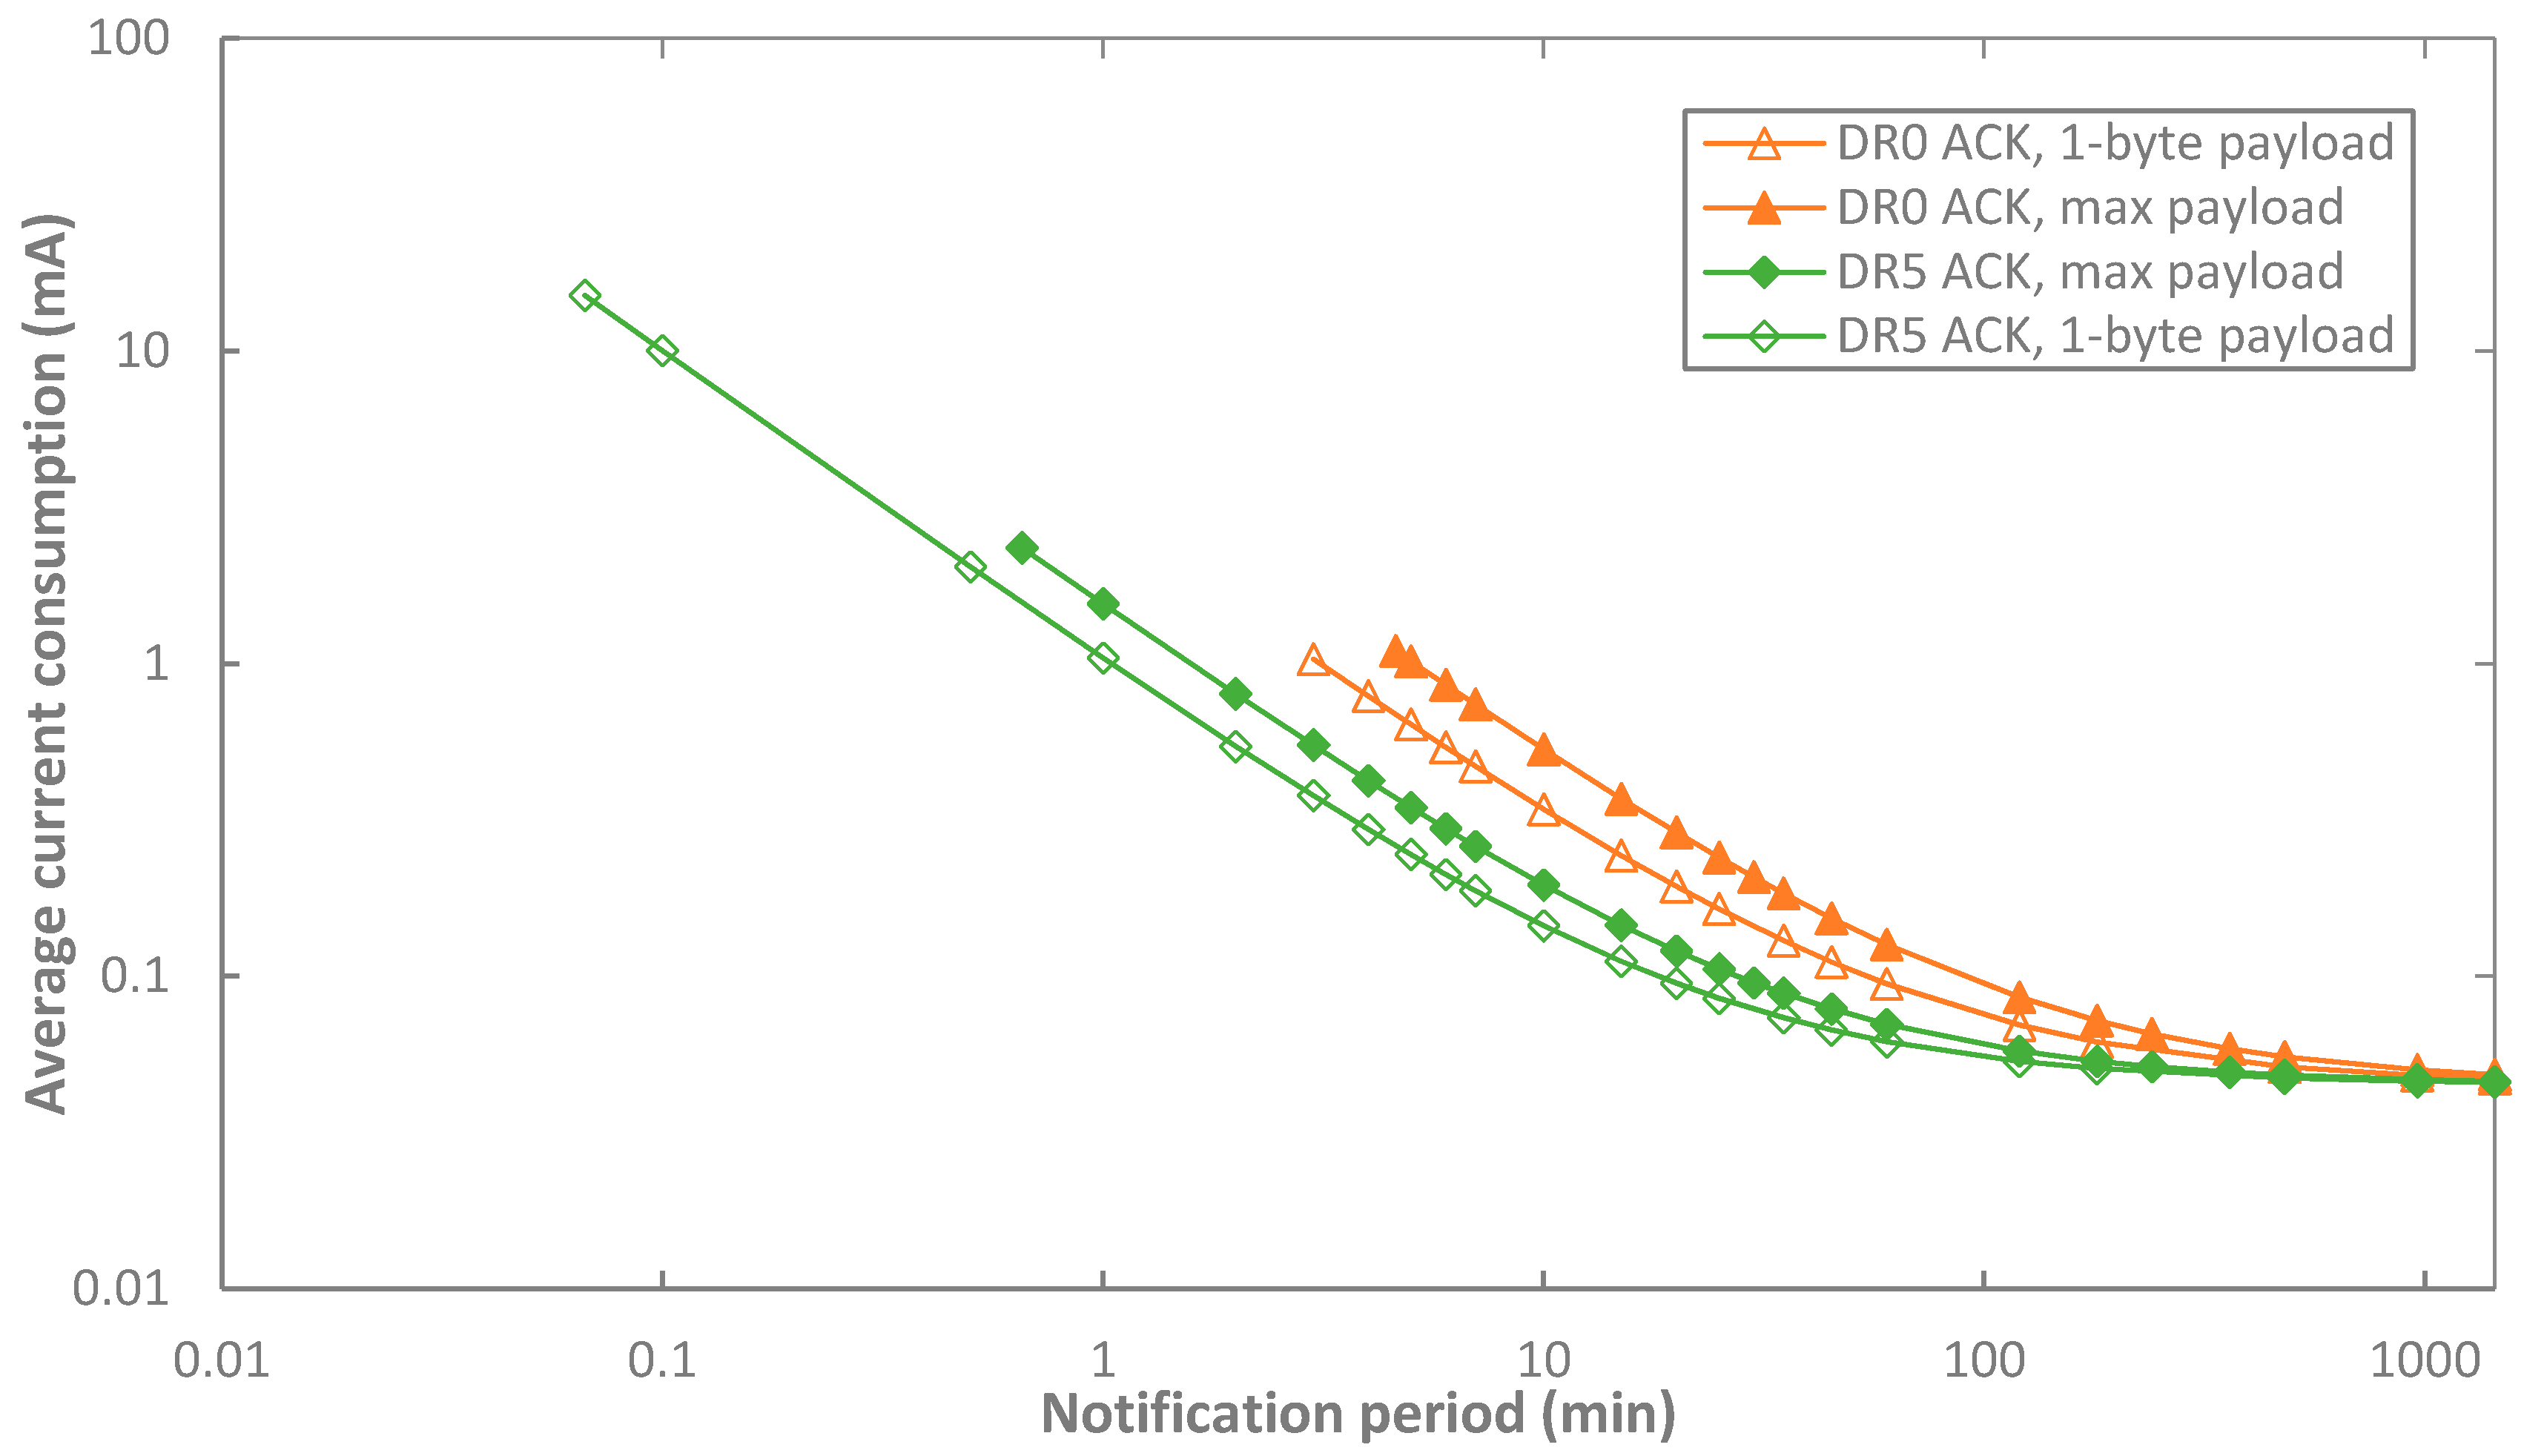
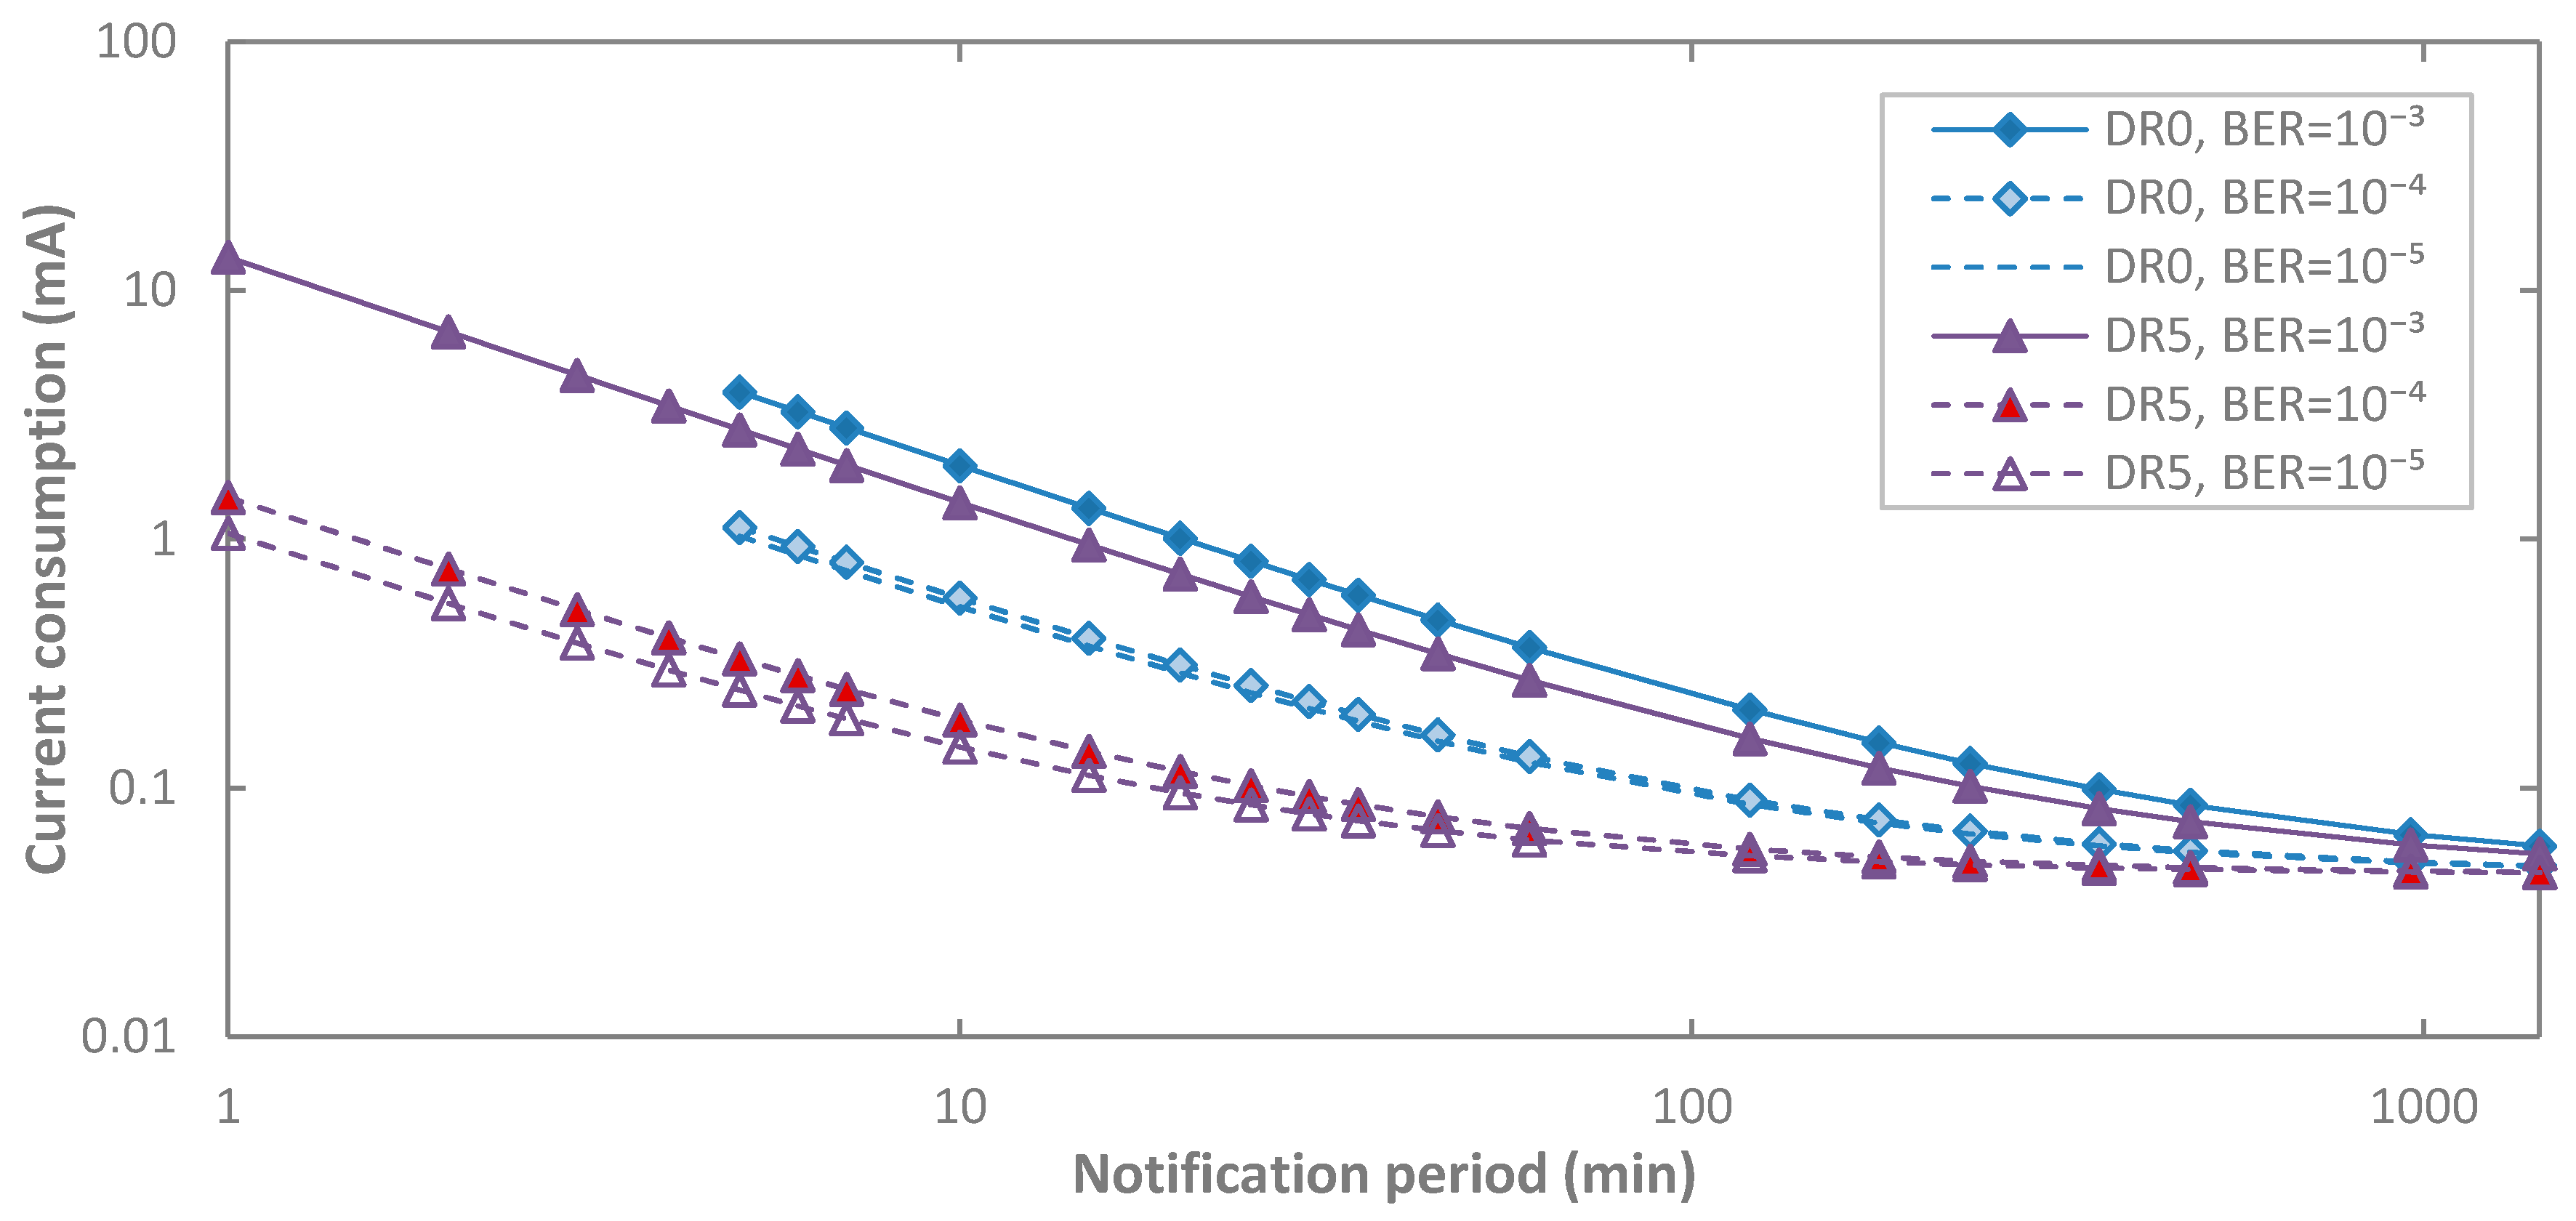
5.1.2. Acknowledged Transmission
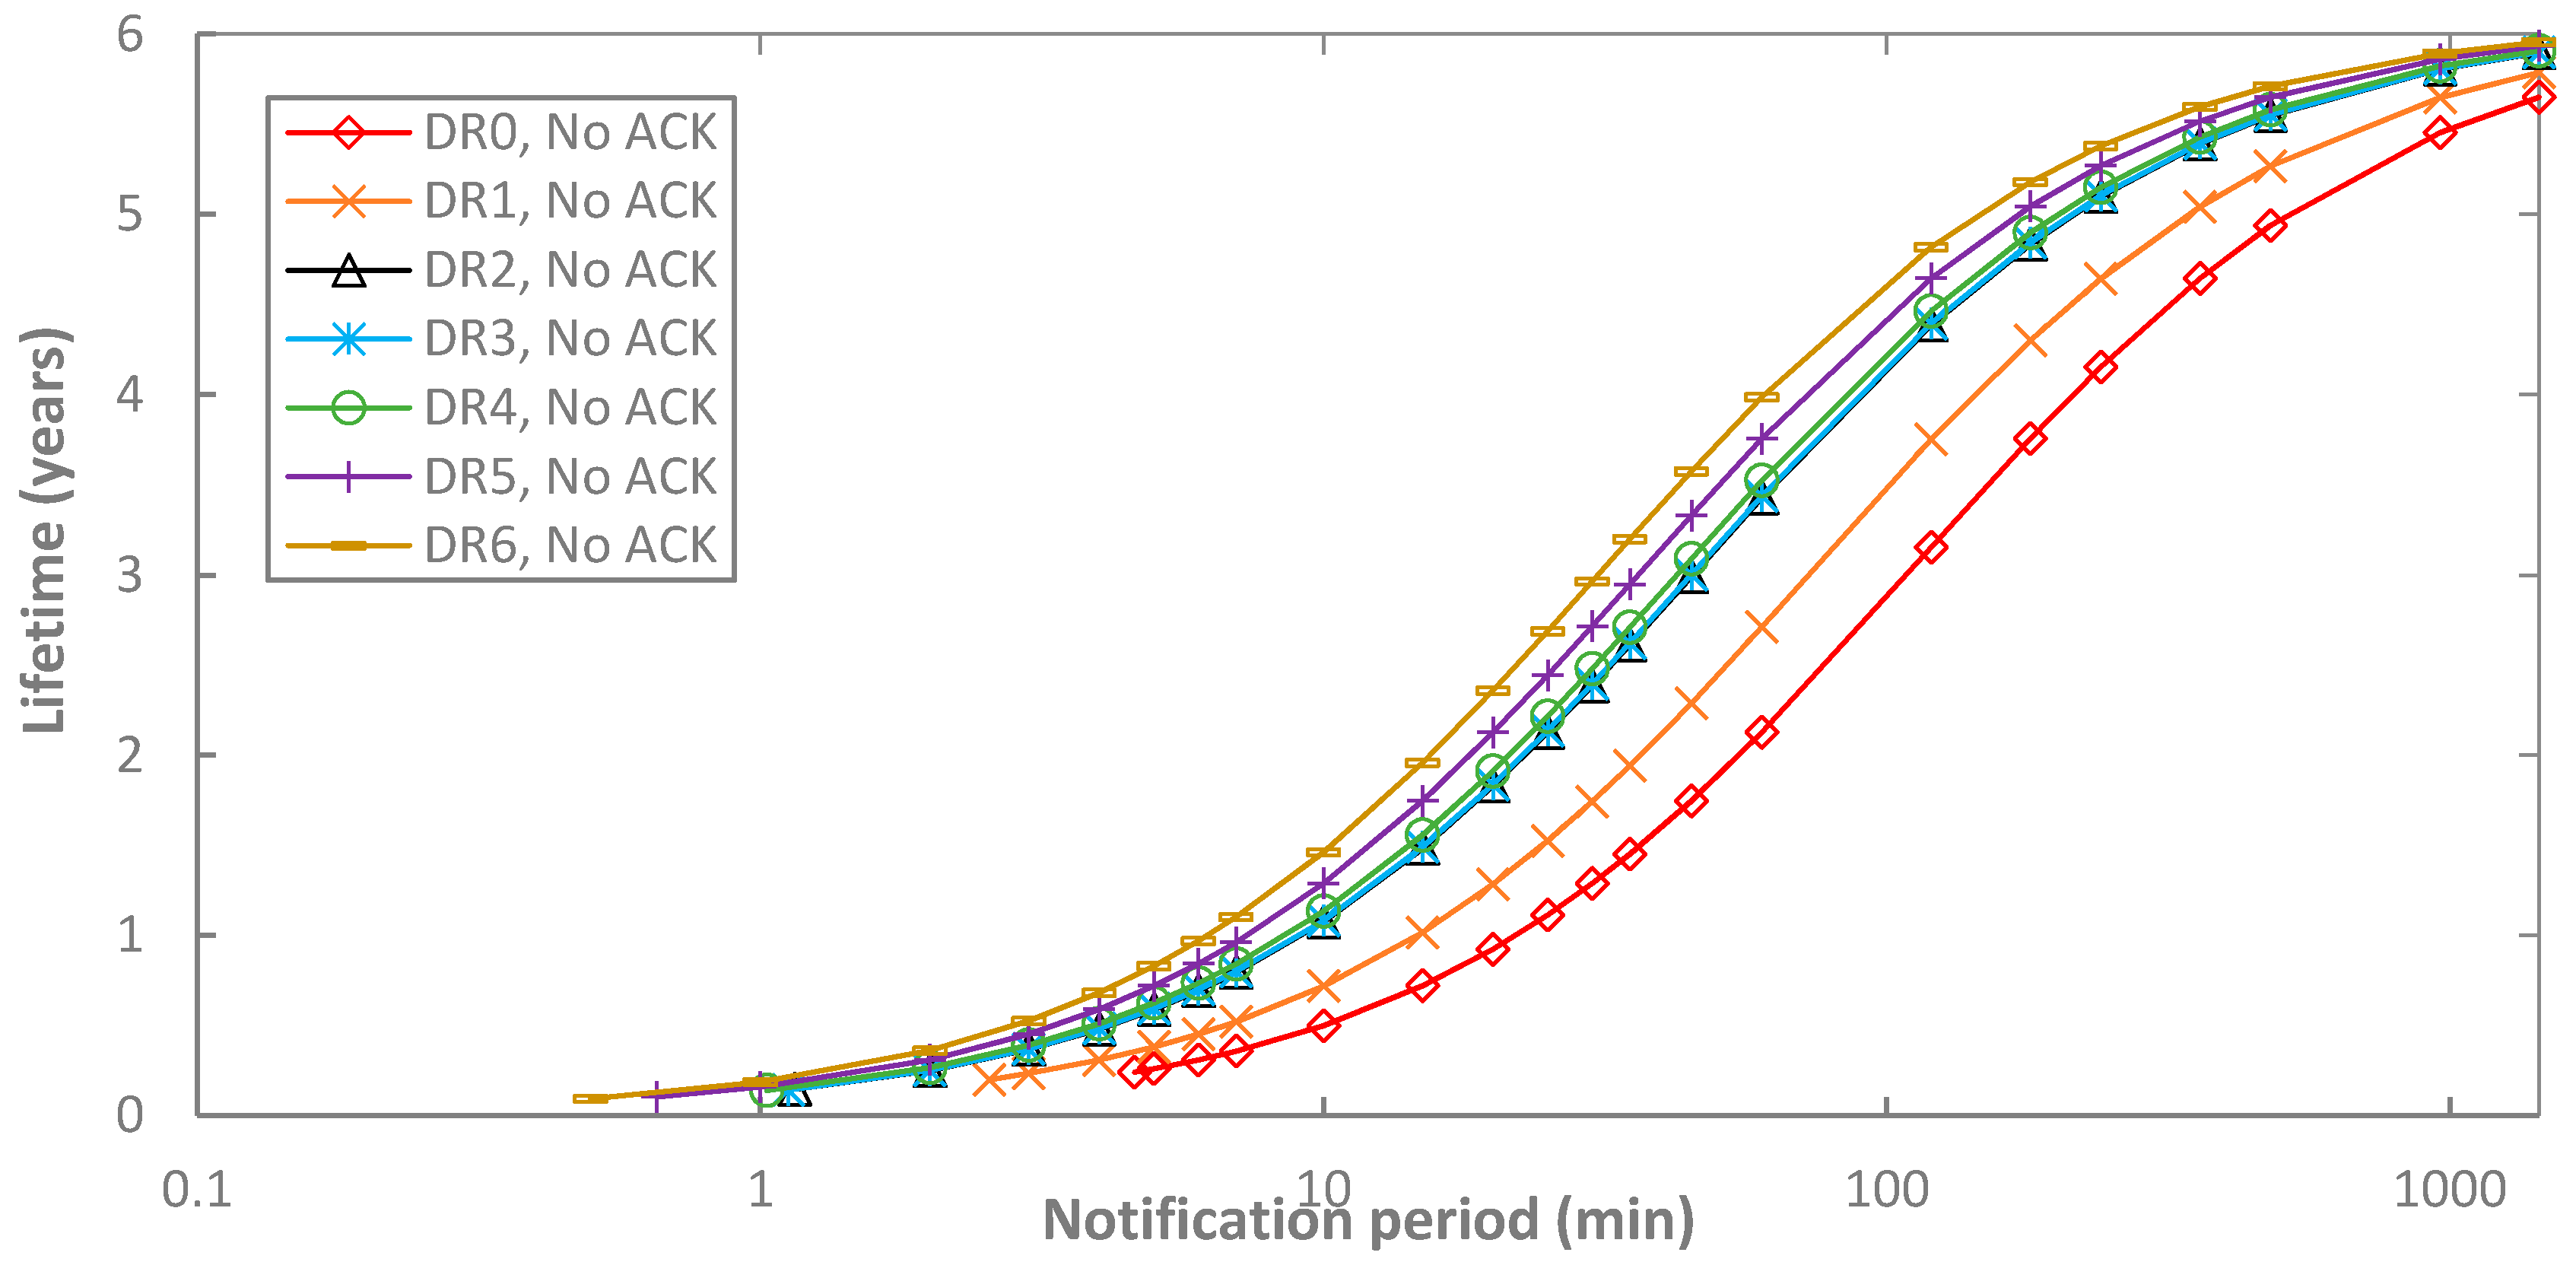
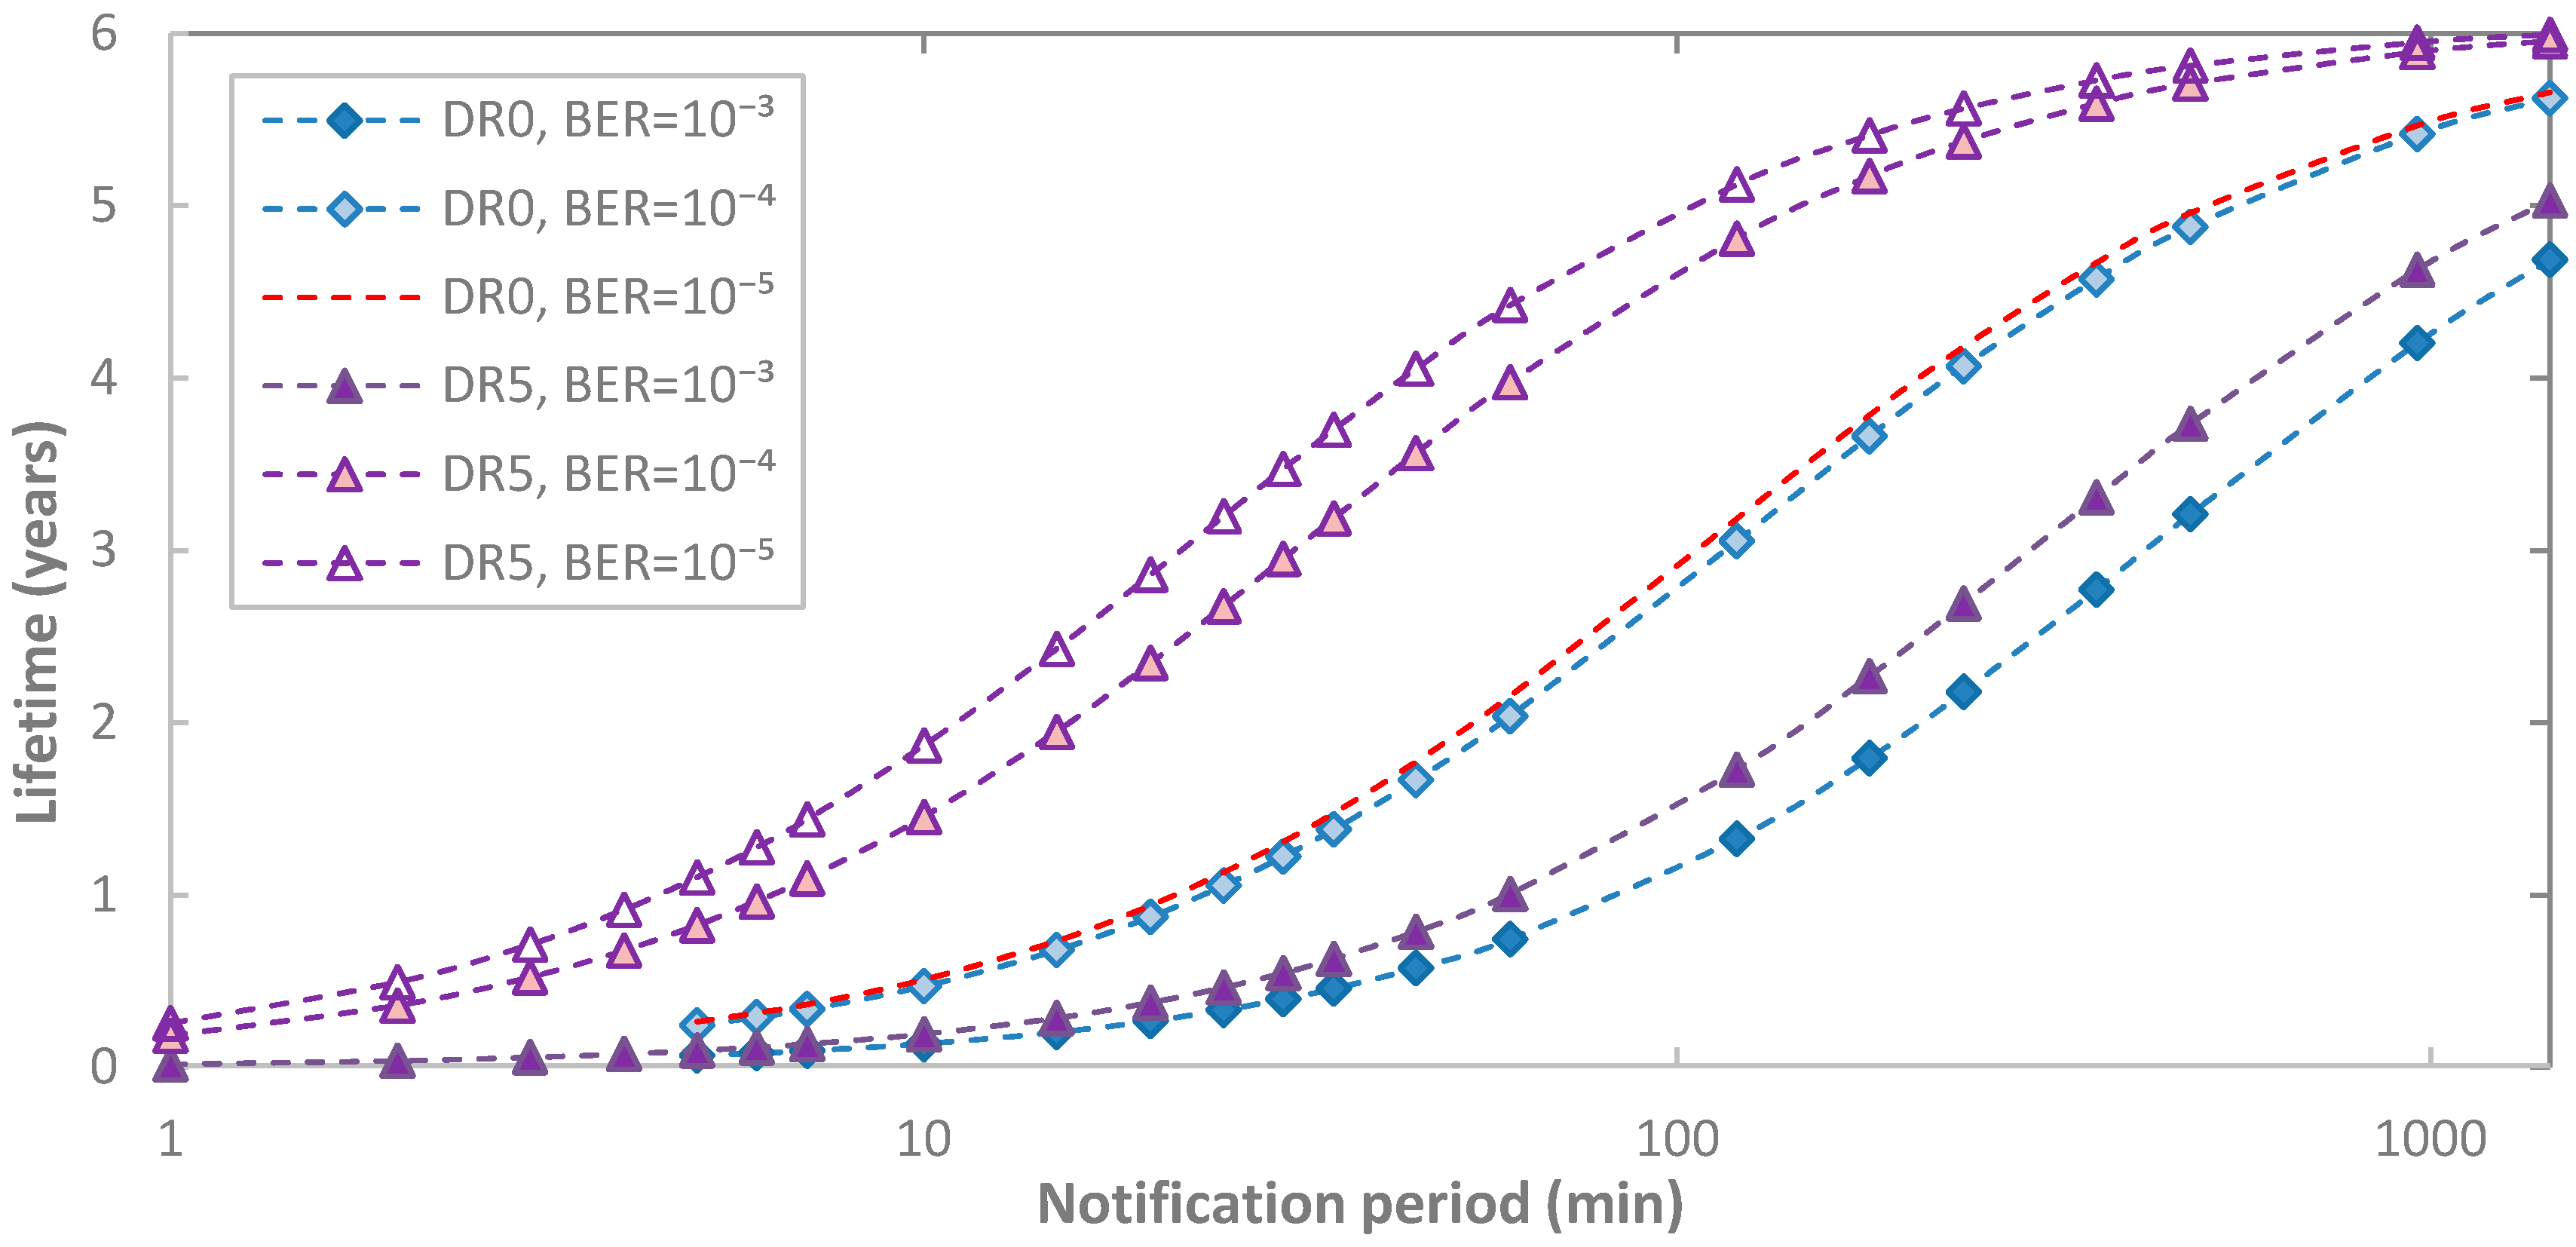
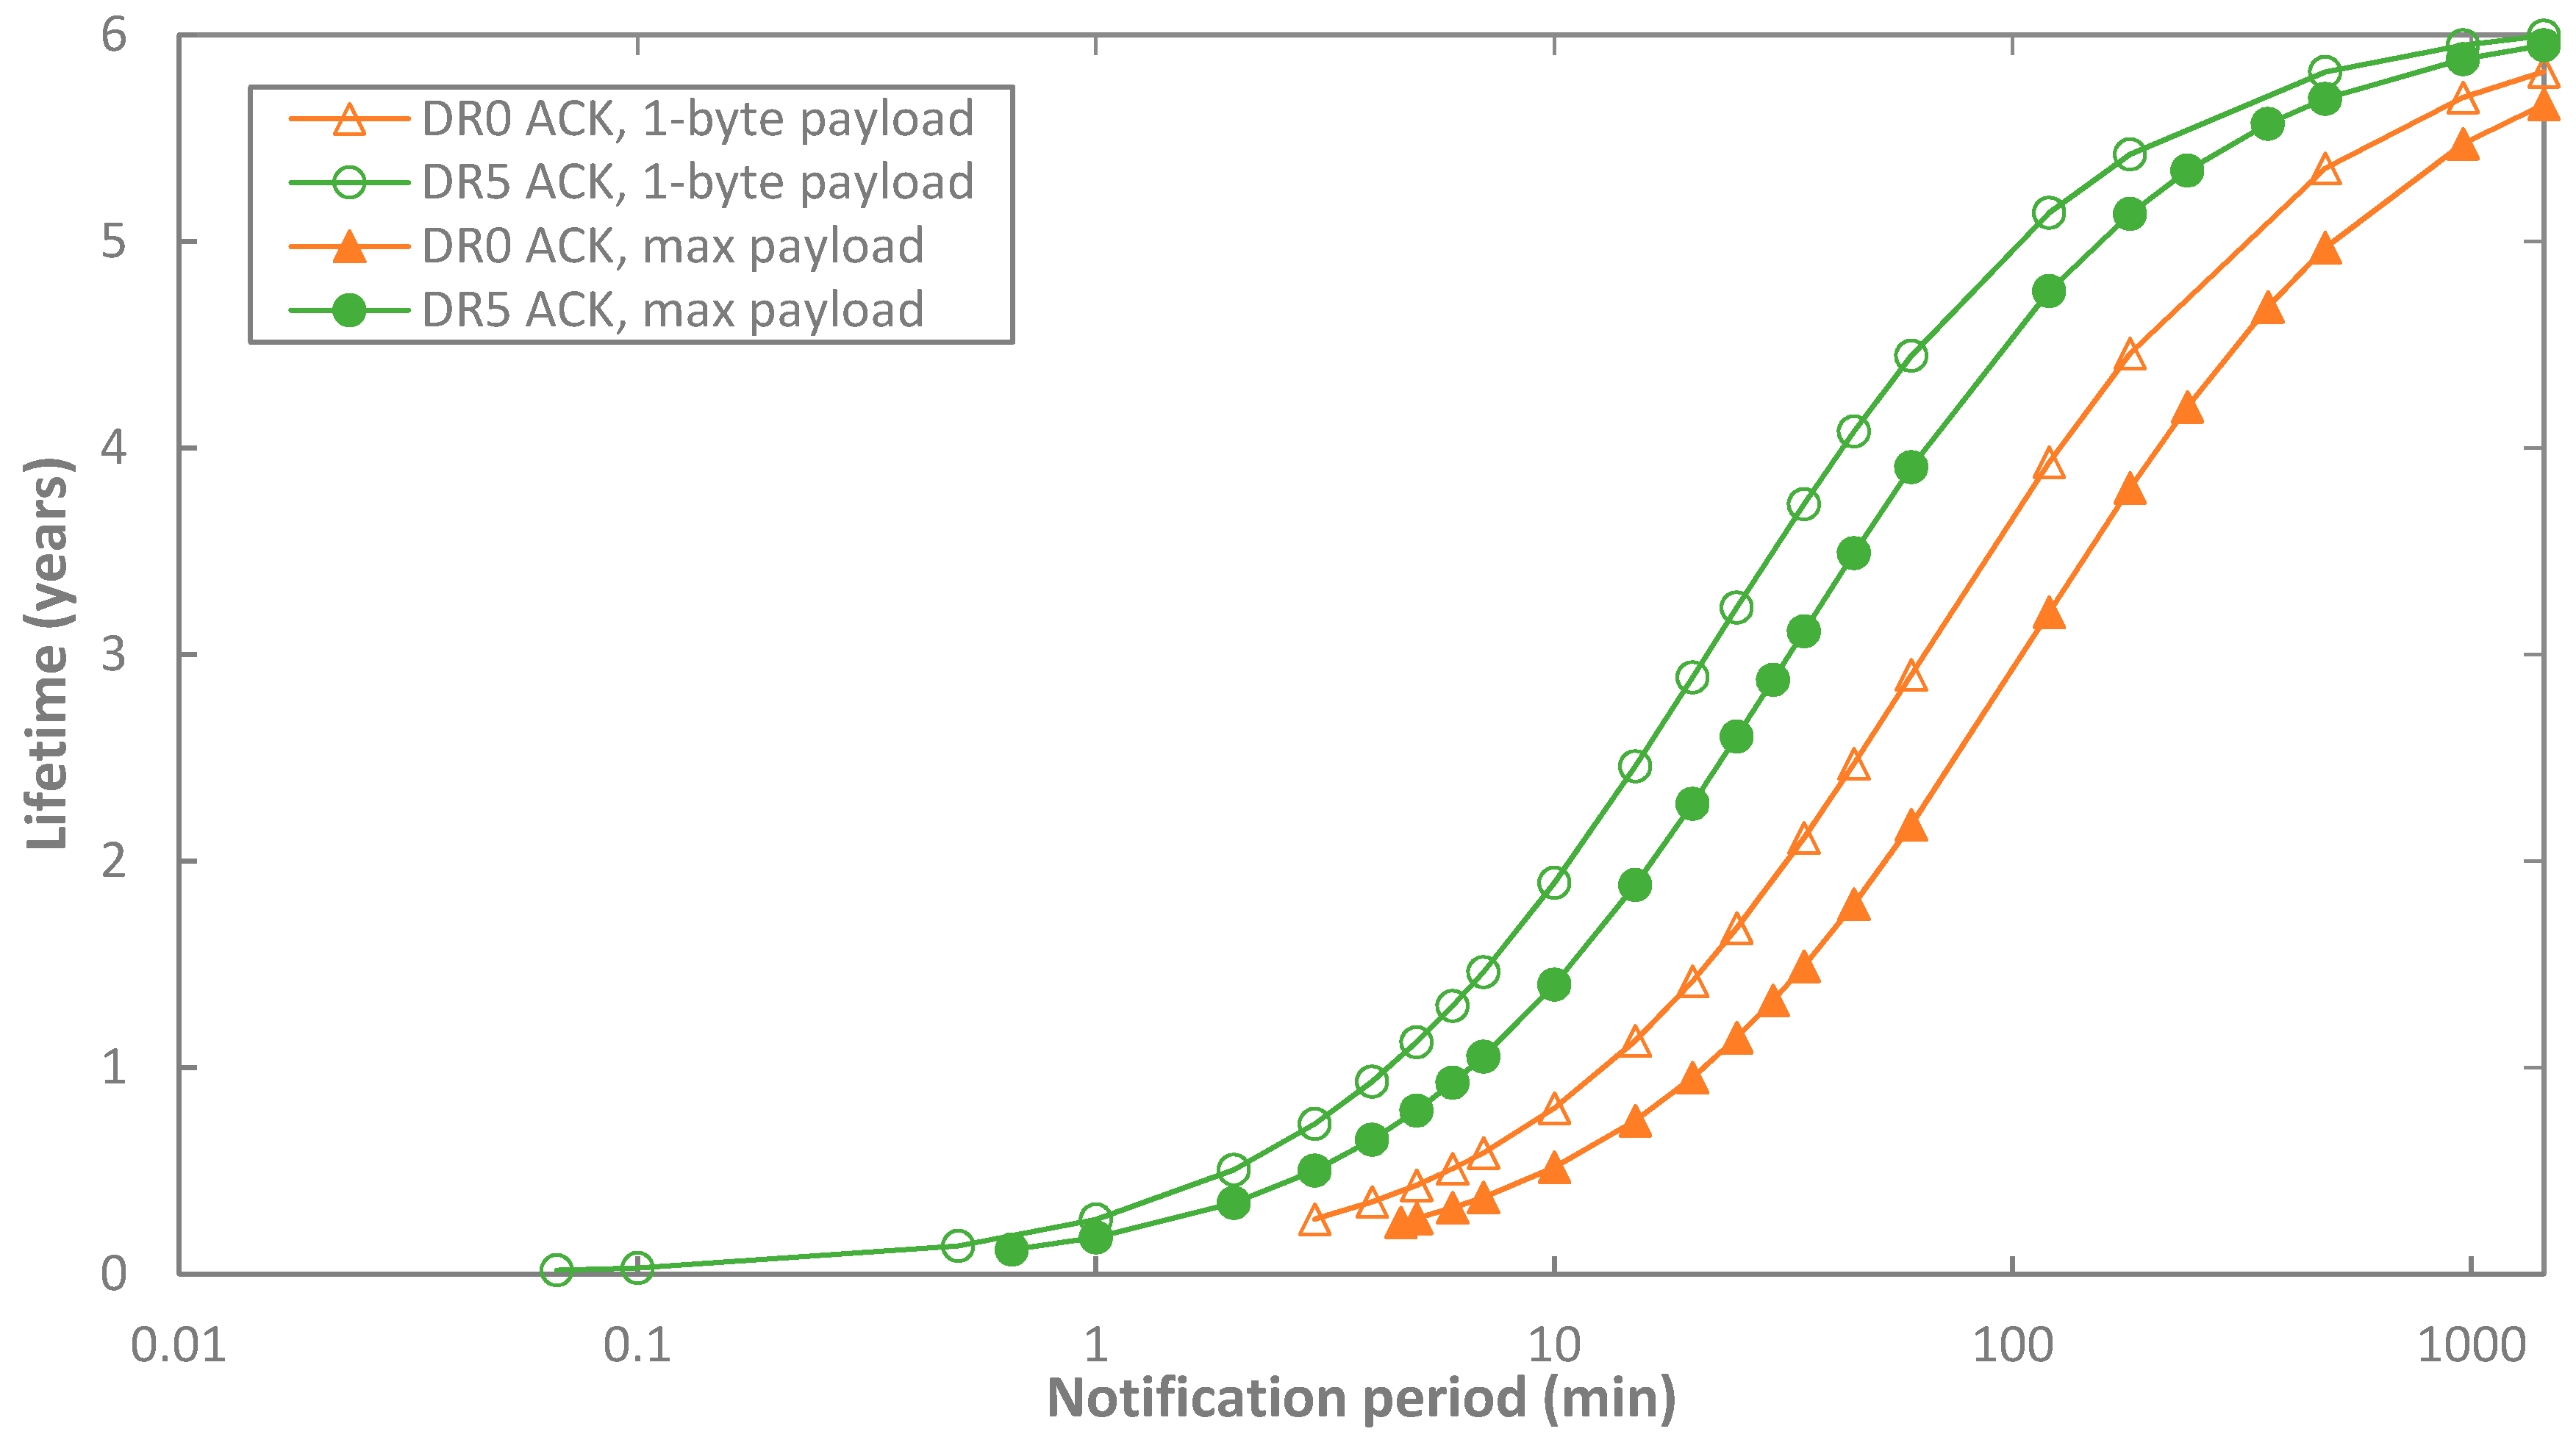
5.2. End-Device Lifetime
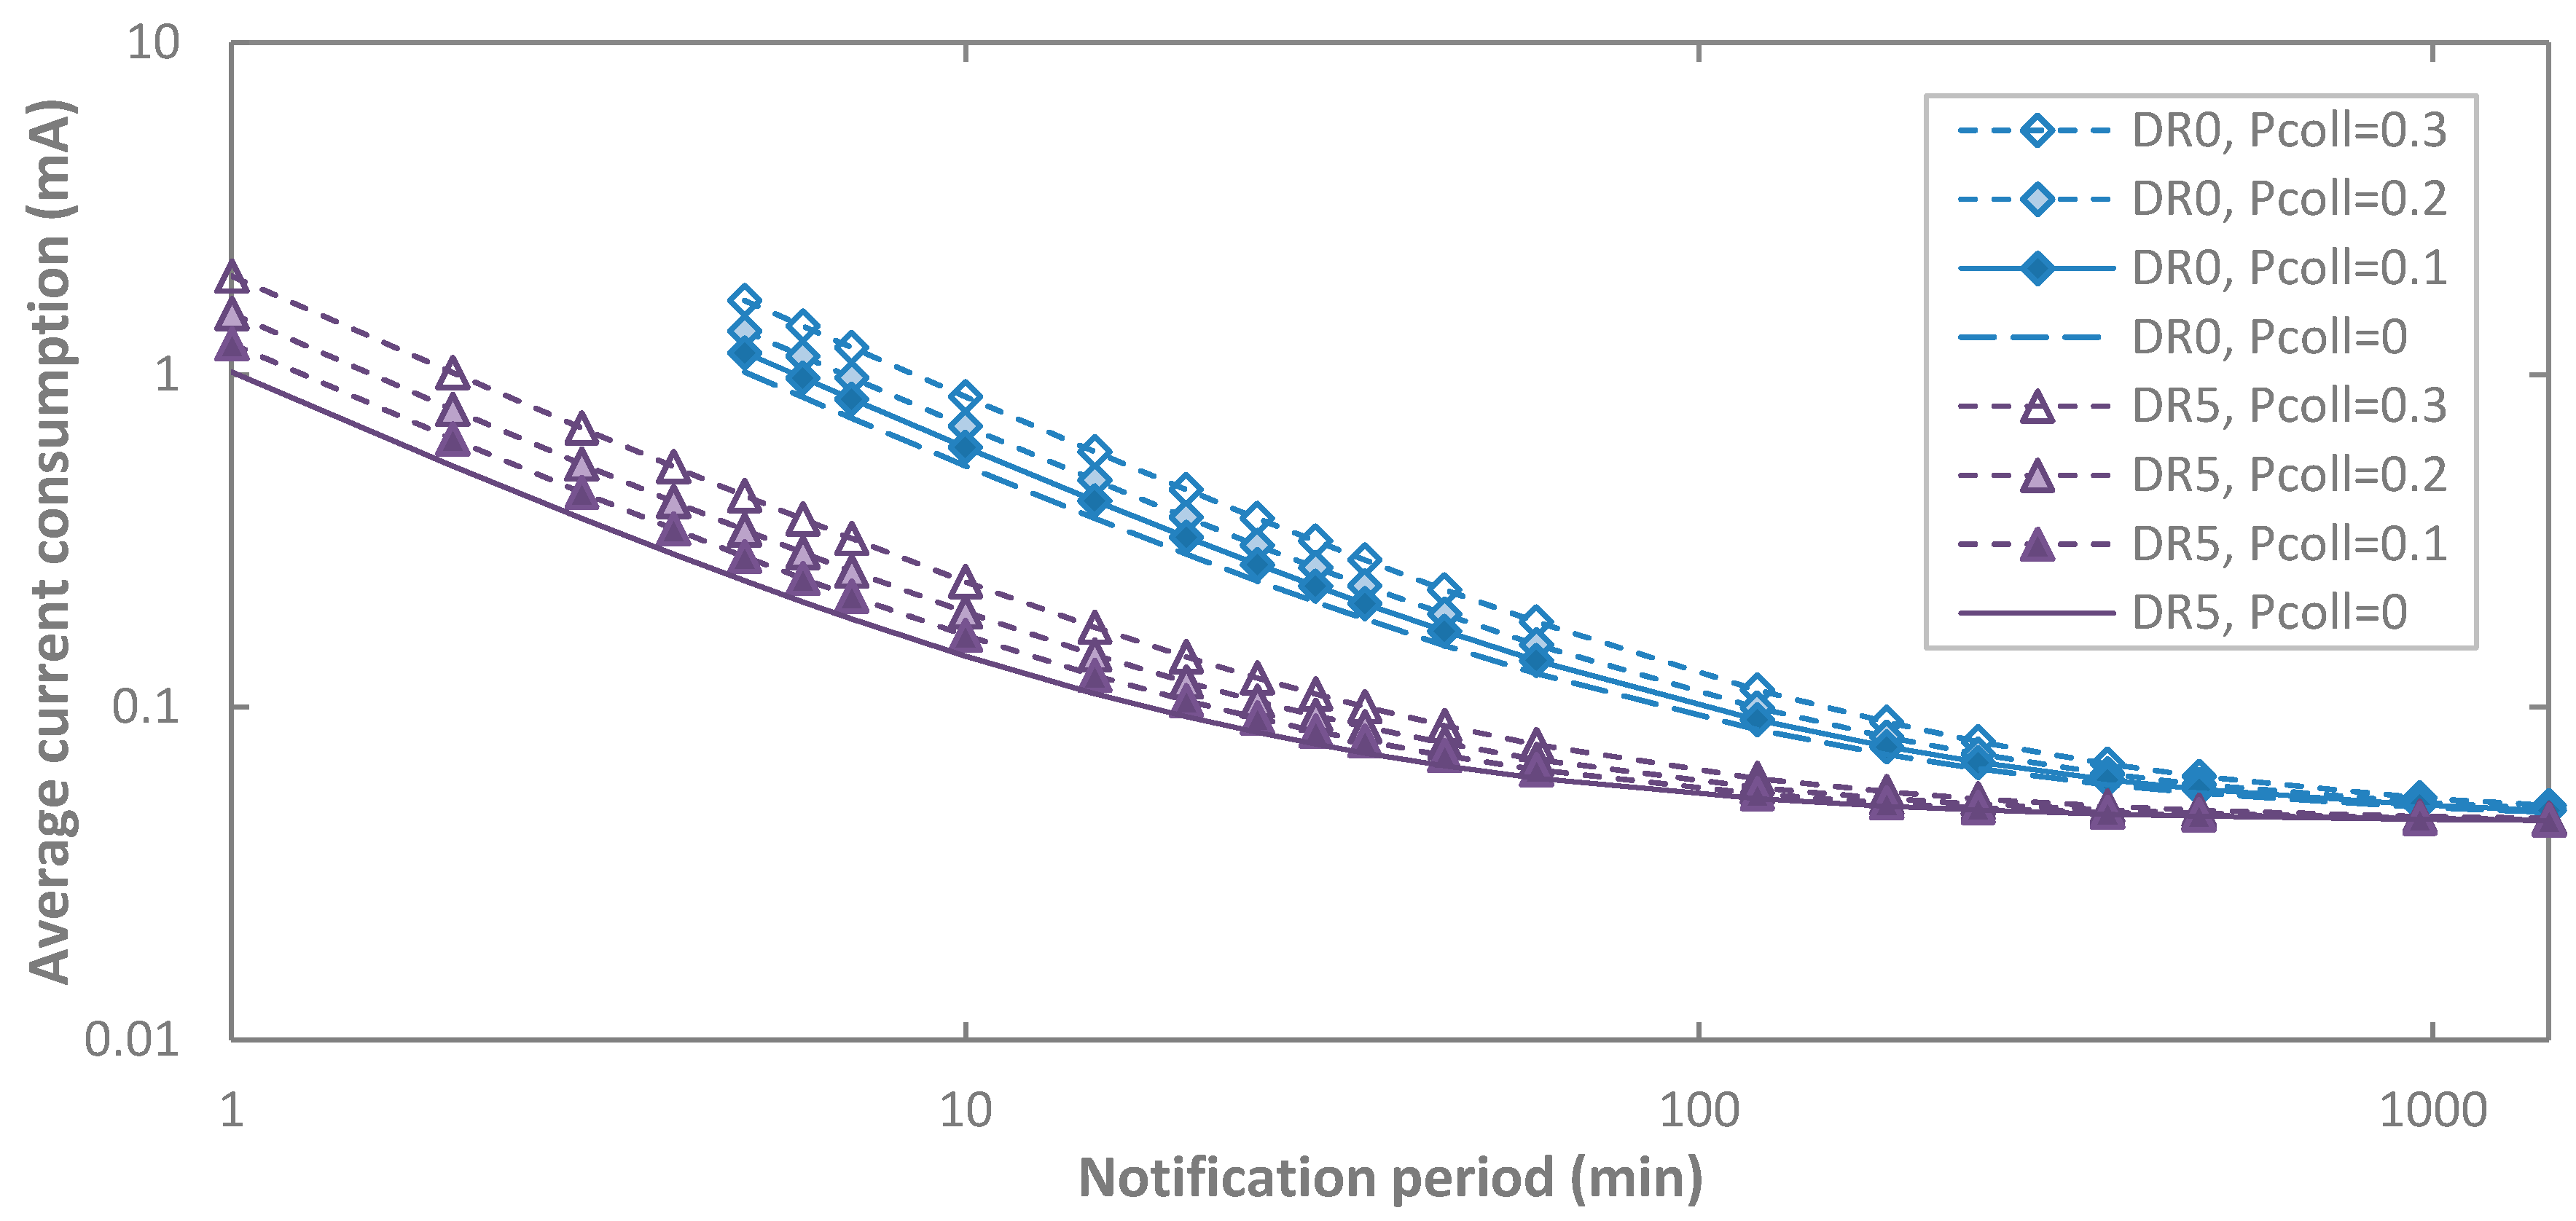
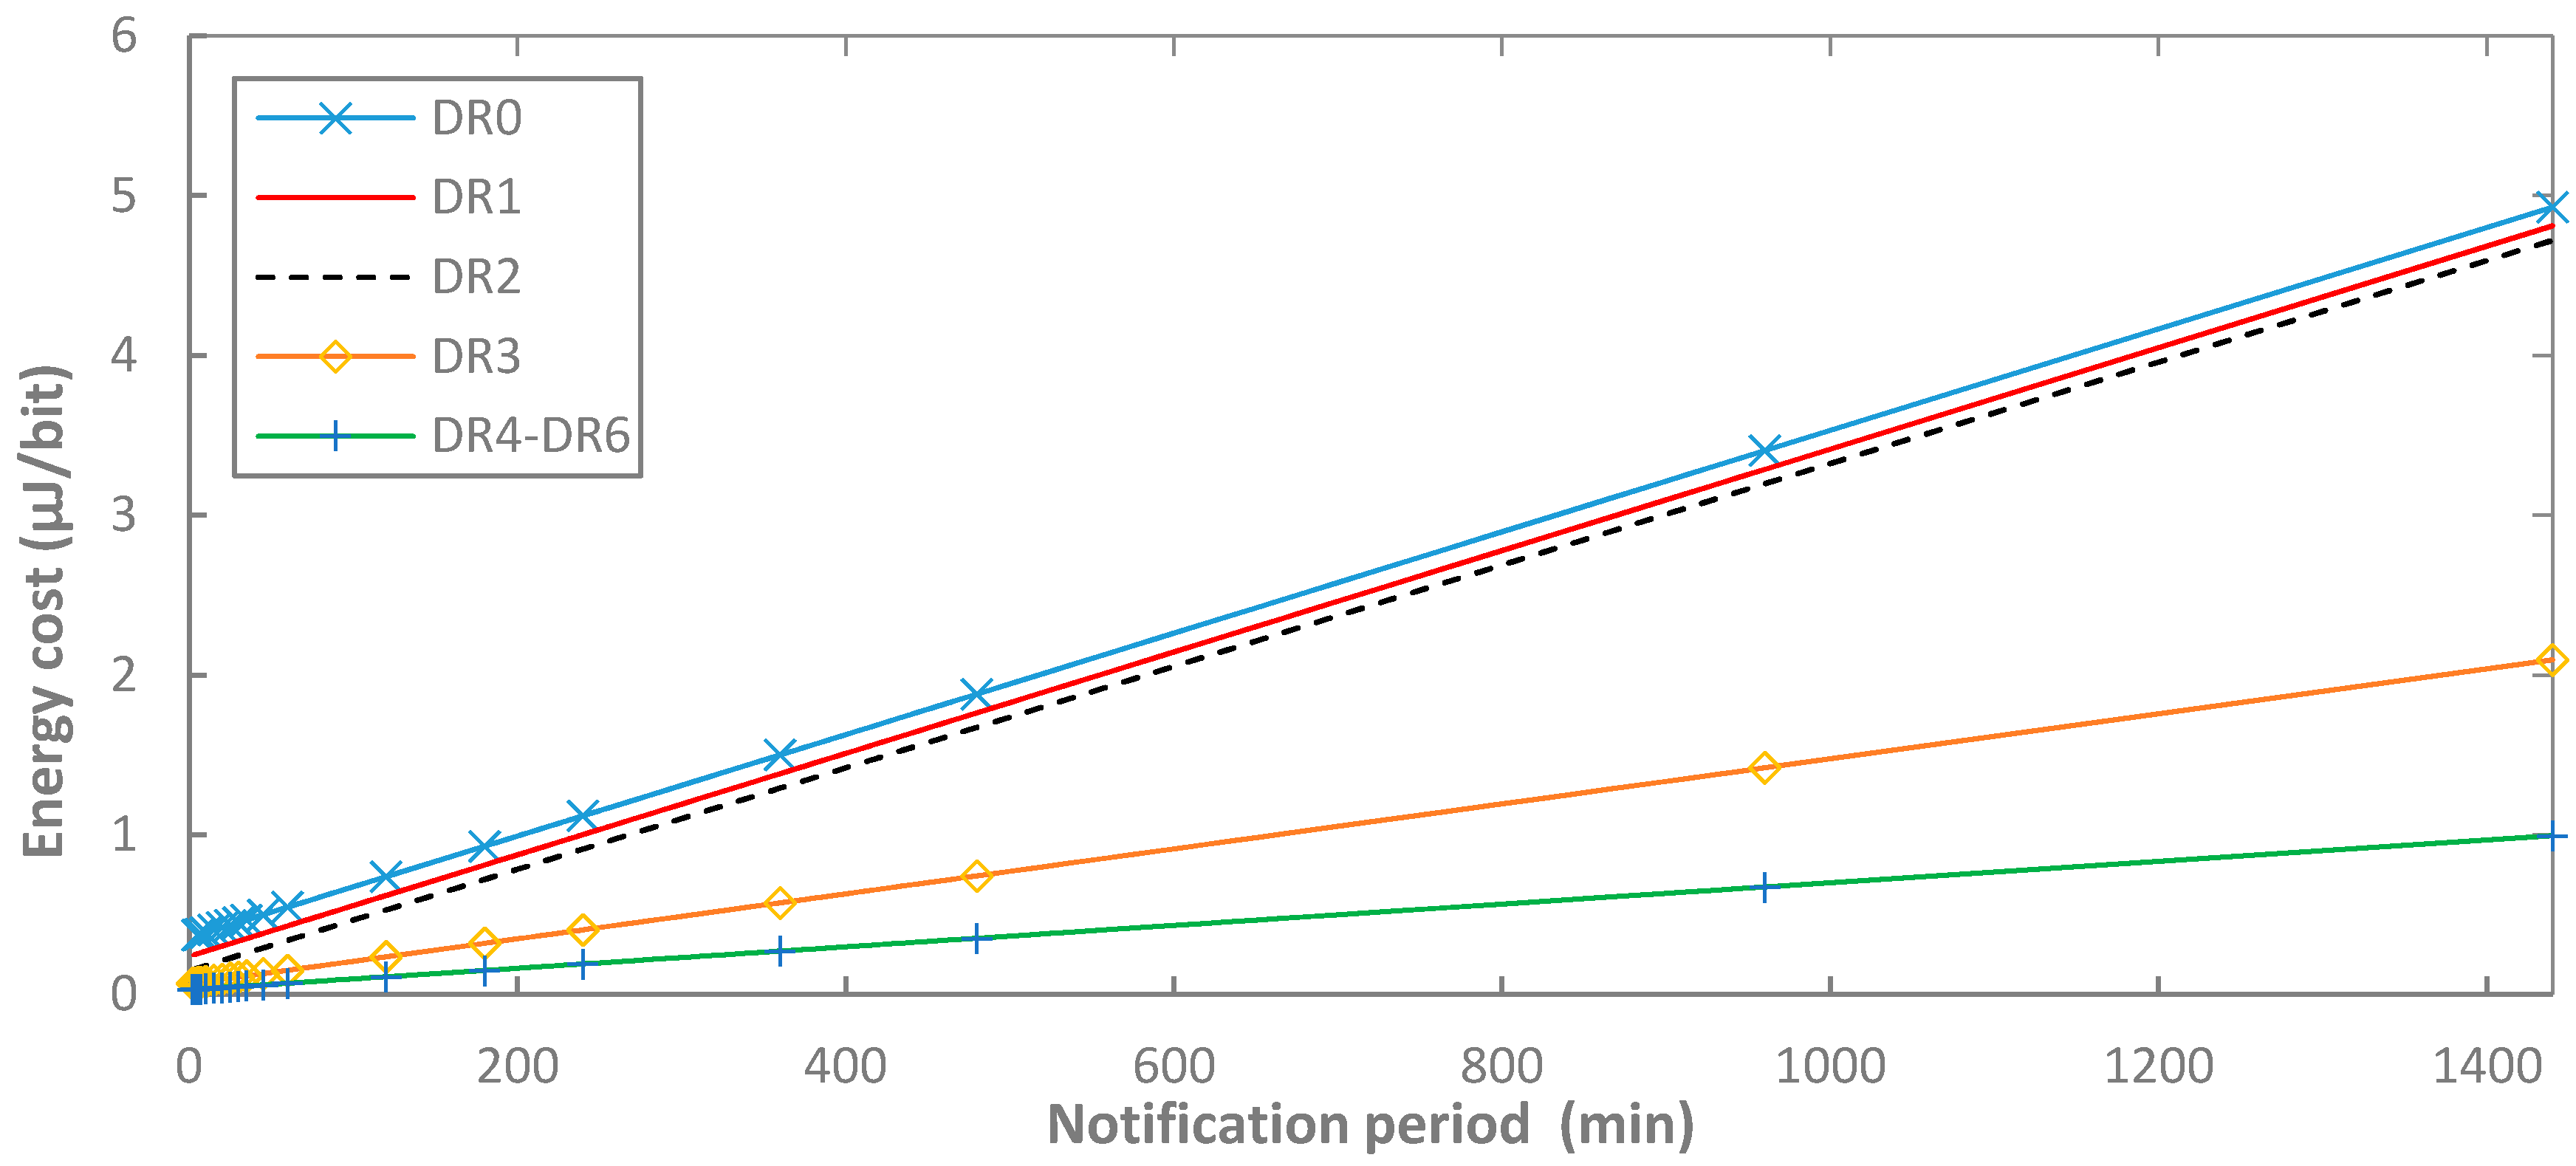
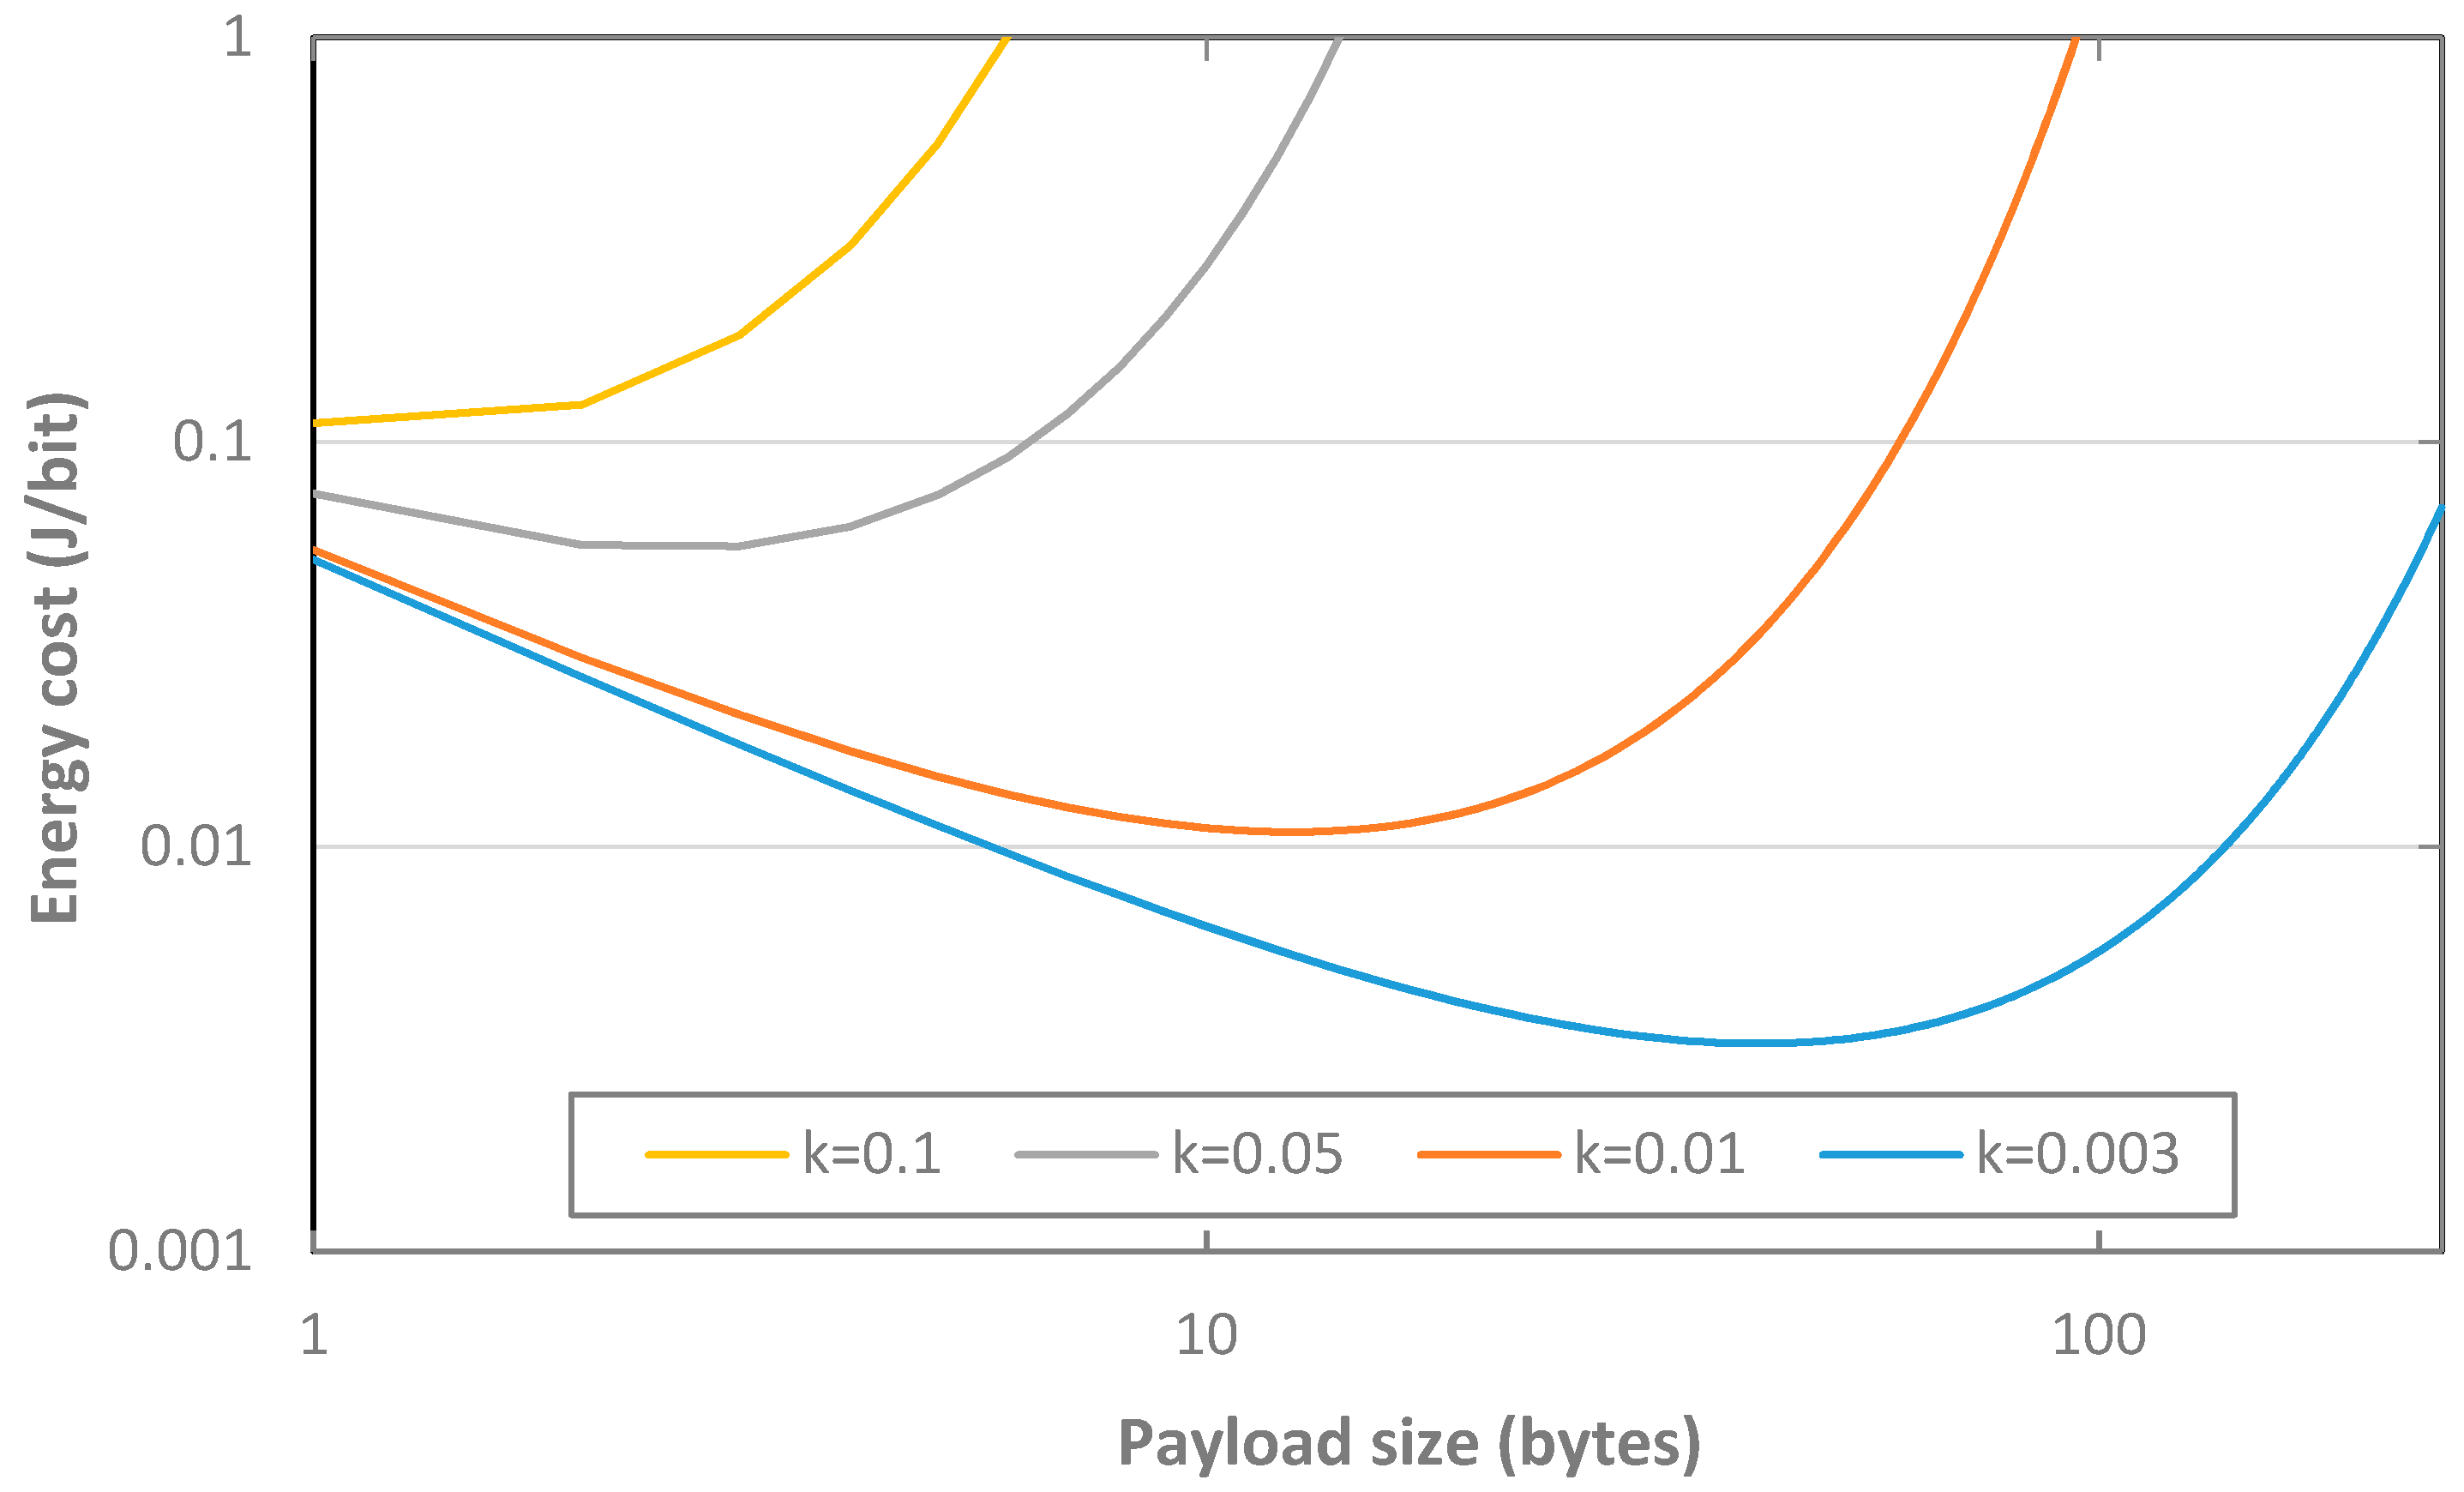
5.3. Energy Cost of Data Delivery
6. Conclusions
Acknowledgments
Author Contributions
Conflicts of Interest
References
- Raza, U.; Kulkarni, P.; Sooriyabandara, M. Low Power Wide Area Networks: An Overview. IEEE Commun. Surv. Tutor. 2017, 19, 855–873. [Google Scholar] [CrossRef]
- Minaburo, A.; Toutain, L.; Gomez, C. LPWAN Static Context Header Compression (SCHC) and fragmentation for IPv6 and UDP. IETF Internet Draft 2017. work in progress. [Google Scholar]
- Mikhaylov, K.; Petajajarvi, J.; Hanninen, T. Analysis of capacity and scalability of the LoRa low power wide area network technology. In Proceedings of the 22th European Wireless Conference, Oulu, Finland, 18–20 May 2016; pp. 1–6. [Google Scholar]
- Farrell, S. LPWAN Overview. IETF Internet Draft 2017. work in progress. [Google Scholar]
- Petajajarvi, J.; Mikhaylov, K.; Roivainen, A.; Hanninen, T.; Pettissalo, M. On the coverage of LPWANs: Range evaluation and channel attenuation model for LoRa technology. In Proceedings of the 14th International Conference on ITS Telecommunications (ITST), Copenhagen, Denmark, 2–4 December 2015; pp. 55–59. [Google Scholar]
- Adelantado, F.; Vilajosana, X.; Tuset-Peiro, P.; Martinez, B.; Melia, J. Understanding the limits of lorawan. Available online: https://arxiv.org/pdf/1607.08011 (accessed on 18 July 2017).
- Augustin, A.; Yi, J.; Clausen, T. A study of LoRa: Long range & low power networks for the Internet of Things. Sensors 2016, 16, 1466. [Google Scholar]
- Nolan, K.E.; Guibene, W.; Kelly, M.Y. An evaluation of low power wide area network technologies for the Internet of Things. In Proceedings of the IEEE International of Wireless Communications and Mobile Computing Conference (IWCMC), Paphos, Cyprus, 5–9 September 2016; pp. 439–444. [Google Scholar]
- Petajajarvi, J.; Mikhaylov, K.; Pettissalo, M.; Janhunen, J.; Iinatti, J. Performance of a low-power wide-area network based on LoRa technology: Doppler robustness, scalability, and coverage. Int. J. Distrib. Sens. Netw. 2017, 13, 1–16. [Google Scholar] [CrossRef]
- Mikhaylov, K.; Petajajarvi, J.; Janhunen, J. On LoRaWAN Scalability: Empirical Evaluation of Susceptibility to Inter-Network Interference. Available online: https://arxiv.org/pdf/1704.04257 (accessed on 18 July 2017).
- Haxhibeqiri, J.; Van den Abeele, F.; Moerman, I.; Hoebeke, J. LoRa Scalability: A Simulation Model Based on Interference Measurements. Sensors 2017, 17, 1193. [Google Scholar] [CrossRef] [PubMed]
- Petajajarvi, J.; Mikhaylov, K.; Yasmin, R.; Hämäläinen, M.; Iinatti, J. Evaluation of LoRa LPWAN Technology for Indoor Remote Health and Wellbeing Monitoring. Int. J. Wirel. Inf. Netw. 2017, 24, 153–165. [Google Scholar]
- Kim, B.; Hwang, K. Cooperative Downlink Listening for Low-Power Long-Range Wide-Area Network. Sustainability 2017, 9, 627. [Google Scholar] [CrossRef]
- Mahmoud, M.S.; Mohamad, A.A.H. A Study of Efficient Power Consumption Wireless Communication Techniques/ Modules for Internet of Things (IoT) Applications. Adv. Intern. Things 2016, 6, 19–29. [Google Scholar] [CrossRef]
- Bjelcevic, S.; Jemson, J.; Karusala, N.; Purcell, D. LAMBS: Light and Motion Based Safety. Available online: https://andyhub.com/wordpress/wp-content/uploads/LAMBSFinalReport.pdf (accessed on 18 July 2017).
- Bor, M.; Roedig, U. LoRa Transmission Parameter Selection. In Proceedings of the 13th IEEE International Conference on Distributed Computing in Sensor Systems (DCOSS), Ottawa, ON, Canada, 5–7 June 2017. [Google Scholar]
- Mendívil, L.J. Comparación de Soluciones Basadas en LPWAN e IEEE 802.15.4 Para Aplicaciones de Salud Móvil (“m-Health”). Master’s Thesis, Centro de Investigación Científica y de Educación Superior de Ensenada, Ensenada, Mexico, 2017. [Google Scholar]
- Neumann, P.; Montavont, J.; Noël, T. Indoor deployment of low-power wide area networks (LPWAN): A LoRaWAN case study. In Proceedings of the IEEE 12th International Conference on Wireless and Mobile Computing, Networking and Communications (WiMob), New York, NY, USA, 17–19 December 2016; pp. 1–8. [Google Scholar]
- Mikhaylov, K.; Petäjäjärvi, J. Design and implementation of the plug&play enabled flexible modular wireless sensor and actuator network platform. Asian J. Control 2017, 19, 1392–1412. [Google Scholar]
- Magno, M.; Aoudia, F.A.; Gautier, M.; Berder, O.; Benini, L. WULoRa: An energy efficient IoT end-node for energy harvesting and heterogeneous communication. In Proceedings of the IEEE Design, Automation & Test in Europe Conference & Exhibition, Lausanne, Switzerland, 27–31 March 2017; pp. 1528–1533. [Google Scholar]
- Dongare, A.; Hesling, C.; Bhatia, K.; Balanuta, A.; Pereira, R.L.; Iannucci, B.; Rowe, A. OpenChirp: A Low-Power Wide-Area Networking architecture. In Proceedings of the IEEE International Conference on Pervasive Computing and Communications Workshops (PerCom Workshops), Kona, HI, USA, 13–17 March 2017; pp. 569–574. [Google Scholar]
- Conus, G.; Lilis, G.; Zanjani, N.A.; Kayal, M. An event-driven low power electronics for loads metering and control in smart buildings. In Proceedings of the Second International Conference on IEEE Event-Based Control, Communication, and Signal Processing (EBCCSP), Krakow, Poland, 13–15 October 2016; pp. 1–7. [Google Scholar]
- Kim, C. AN079-Measuring Power Consumption of CC2530 with Z-Stack. Texas Instruments. Available online: http://www.ti.com/lit/an/swra292/swra292.pdf (accessed on 18 July 2017).
- Aguilar, S.; Vidal, R.; Gomez, C. Opportunistic Sensor Data Collection with Bluetooth Low Energy. Sensors 2017, 17, 159. [Google Scholar] [CrossRef] [PubMed]
- Sartori, D.; Brunelli, D. A smart sensor for precision agriculture powered by microbial fuel cells. In Proceedings of the IEEE Sensors Applications Symposium (SAS), Catania, Italy, 20–22 May 2016; pp. 1–6. [Google Scholar]
- Toussaint, J.; El Rachkidy, N.; Guitton, A. Performance analysis of the on-the-air activation in LoRaWAN. In Proceedings of the IEEE 7th Annual Information Technology, Electronics and Mobile Communication Conference (IEMCON), Vancouver, BC, Canada, 13–15 November 2016; pp. 1–7. [Google Scholar]
- Sornin, N.; Luis, M.; Eirich, T.; Kramp, T.; Hersent, O. LoRaWAN Specification; Version V1.0.2; LoRa Alliance: Beaverton, OR, USA, 2016. [Google Scholar]
- LoRaWAN™ Certified Products. Available online: https://www.lora-alliance.org/certified-products (accessed on 18 July 2017).
- LoRaWAN Multitech mDot. Available online: http://www.multitech.com/documents/publications/data-sheets/86002171.pdf (accessed on 18 July 2017).
- NetBlocks XRange. Available online: https://www.netblocks.eu/xrange-sx1272-lora-datasheet/ (accessed on 18 July 2017).
- Microchip RN2483 LoRa Mote. Available online: http://www.microchip.com/DevelopmentTools/ProductDetails.aspx?PartNO=dm164138 (accessed on 18 July 2017).
- LoRaBug. Available online: https://github.com/OpenChirp/LoRaBug (accessed on 18 July 2017).
- Semtech SX1272. Available online: http://www.semtech.com/images/datasheet/sx1272.pdf (accessed on 18 July 2017).
- Semtech SX1276. Available online: http://www.semtech.com/images/datasheet/sx1276_77_78_79.pdf (accessed on 18 July 2017).
- HopeRF HM-TRLR-LF/HFS Series 100 mW. Available online: http://www.hoperf.com/upload/rf/HM-TRLR-S_Series_english_.pdf (accessed on 18 July 2017).
- Microchip RN2483. Available online: http://ww1.microchip.com/downloads/en/DeviceDoc/50002346A.pdf (accessed on 18 July 2017).
- Errata Microchip RN2483. Available online: http://ww1.microchip.com/downloads/en/DeviceDoc/80000689A.pdf (accessed on 18 July 2017).
- Semtech Corporation. SX1272/3/6/7/8: LoRa Modem. Designer’s Guide. AN1200.13; Semtech Corporation: Camarillo, CA, USA, 2013. [Google Scholar]
- LoRa Alliance Technical committee. LoRaWAN™ 1.0.2 Regional Parameters; LoRa Alliance Technical Committee: San Ramon, CA, USA, 2017. [Google Scholar]
- Kerlink LoRa IoT Station. Available online: http://www.kerlink.fr/images/Kerlink/fiches_produit/LoRa-IoT-Station.pdf (accessed on 18 July 2017).
- Seller, O.; Sornin, N. Low Power Long Range Transmitter. U.S. Patent 9,252,834, 6 August 2014. [Google Scholar]


| Transceiver Included | Device Name | Current Consumption | References | ||
|---|---|---|---|---|---|
| Sleep | Transmit | Receive | |||
| Semtech SX1272 | LoRaWAN Multitech mDot (a) [29] | 2 µA 30.9 µA 30.9 µA 40 µA | 36 mA | 11 mA | [13] |
| 26–41 mA | 12 mA | [14] | |||
| - | - | [15] | |||
| Min.: 26 mA (2 dBm) | |||||
| Max.: 31/41 mA (20 dBm) | - | ||||
| Semtech SX1272 | NetBlocks XRange [30] | 70 µA | 109 mA (18.5 dBm) | 20 mA | [16] |
| Microchip RN2483 | Microchip RN2483 LoRa Mote (b) [31] | - | 38.9 mA (14 dBm) | 14.2 mA | [17] |
| 3.4 mA | 47.5–47.9 mA (14.1 dBm) | 17.2 mA | [18] | ||
| Microchip RN2483 | Custom 1 (d) | - | Min.: 23.9 mA (2 dBm) | - | [12] |
| Max.: 38.5 mA (14 dBm) | |||||
| Microchip RN2483 | Custom 2 | 34 mA | 14 dBm: 70 Ma | 46 mA | [19] |
| Semtech SX1276 | Custom 3 | 0.17 mA | Min.: 46 mA (0 dBm) | 14 mA | [20] |
| Max.: 103 mA (14 dBm) | |||||
| Semtech SX1276 | LoRaBug [32] | 3.7 mA | 120.7 mA (20 dBm) (c) | 16.6 mA | [21] |
| HopeRF HM-TRLR-LF/HFS | iLoad (custom) | 7.66 μA | 133.3 mA (20 dBm) (c) | 16.3 mA | [22] |
| Transceiver | Current Consumption | ||
|---|---|---|---|
| Sleep | Transmit | Receive | |
| Semtech SX1272 [33] | 0.1 µA (max. 1 µA) | Min.: 18 mA (7 dBm) Max.: 125 mA (20 dBm) | 10.5 or 11.2 mA |
| Semtech SX1276 [34] | 0.2 µA (max. 1 µA) | Min.: 20 mA (7 dBm) Max.: 120 mA (20 dBm) | 10.8, 11.5 or 12.0 mA |
| HopeRF HM-TRLR-LF/HFS [35] | 2 µA (min. 1.2 µA, max. 3 µA) | Min.: 35 mA (13 dBm) Max.: 120 mA (20 dBm) | 16 mA (min. 15 mA, max. 18 mA) |
| Microchip RN2483 [36,37] | Up to 100-150 µA | Min.: 17.3 mA (−4.0 dBm) Max.: 38.9 mA (14.1 dBm) | 14.2 mA |
| Data Rate (DR) | Configuration | Physical Bit Rate (bit/s) | ||
|---|---|---|---|---|
| Modulation | Spreading Factor (SF) | Bandwidth | ||
| 0 | LoRa | SF12 | 125 kHz | 250 |
| 1 | LoRa | SF11 | 125 kHz | 440 |
| 2 | LoRa | SF10 | 125 kHz | 980 |
| 3 | LoRa | SF9 | 125 kHz | 1760 |
| 4 | LoRa | SF8 | 125 kHz | 3125 |
| 5 | LoRa | SF7 | 125 kHz | 5470 |
| 6 | LoRa | SF7 | 250 kHz | 11,000 |
| 7 | FSK | 50 kbit/s | 50,000 | |
| 8–15 | Reserved for Future Use | |||
| Parameters | Default Value | |
|---|---|---|
| Name | Description | |
| Downlink data rate, 1st receive window | DR(uplink) minus RX1DROffset | |
| Downlink data rate, 2nd receive window | DR0, SF12 | |
| RX1DROffset | Data rate offset for the 1st receive window | 0 |
| RECEIVE_DELAY1 | Delay from end of uplink transmission to start of 1st receive window | 1 s |
| RECEIVE_DELAY2 | Delay from end of uplink transmission to start of 2nd receive window | 2 s (must be RECEIVE_DELAY1 + 1 s) |
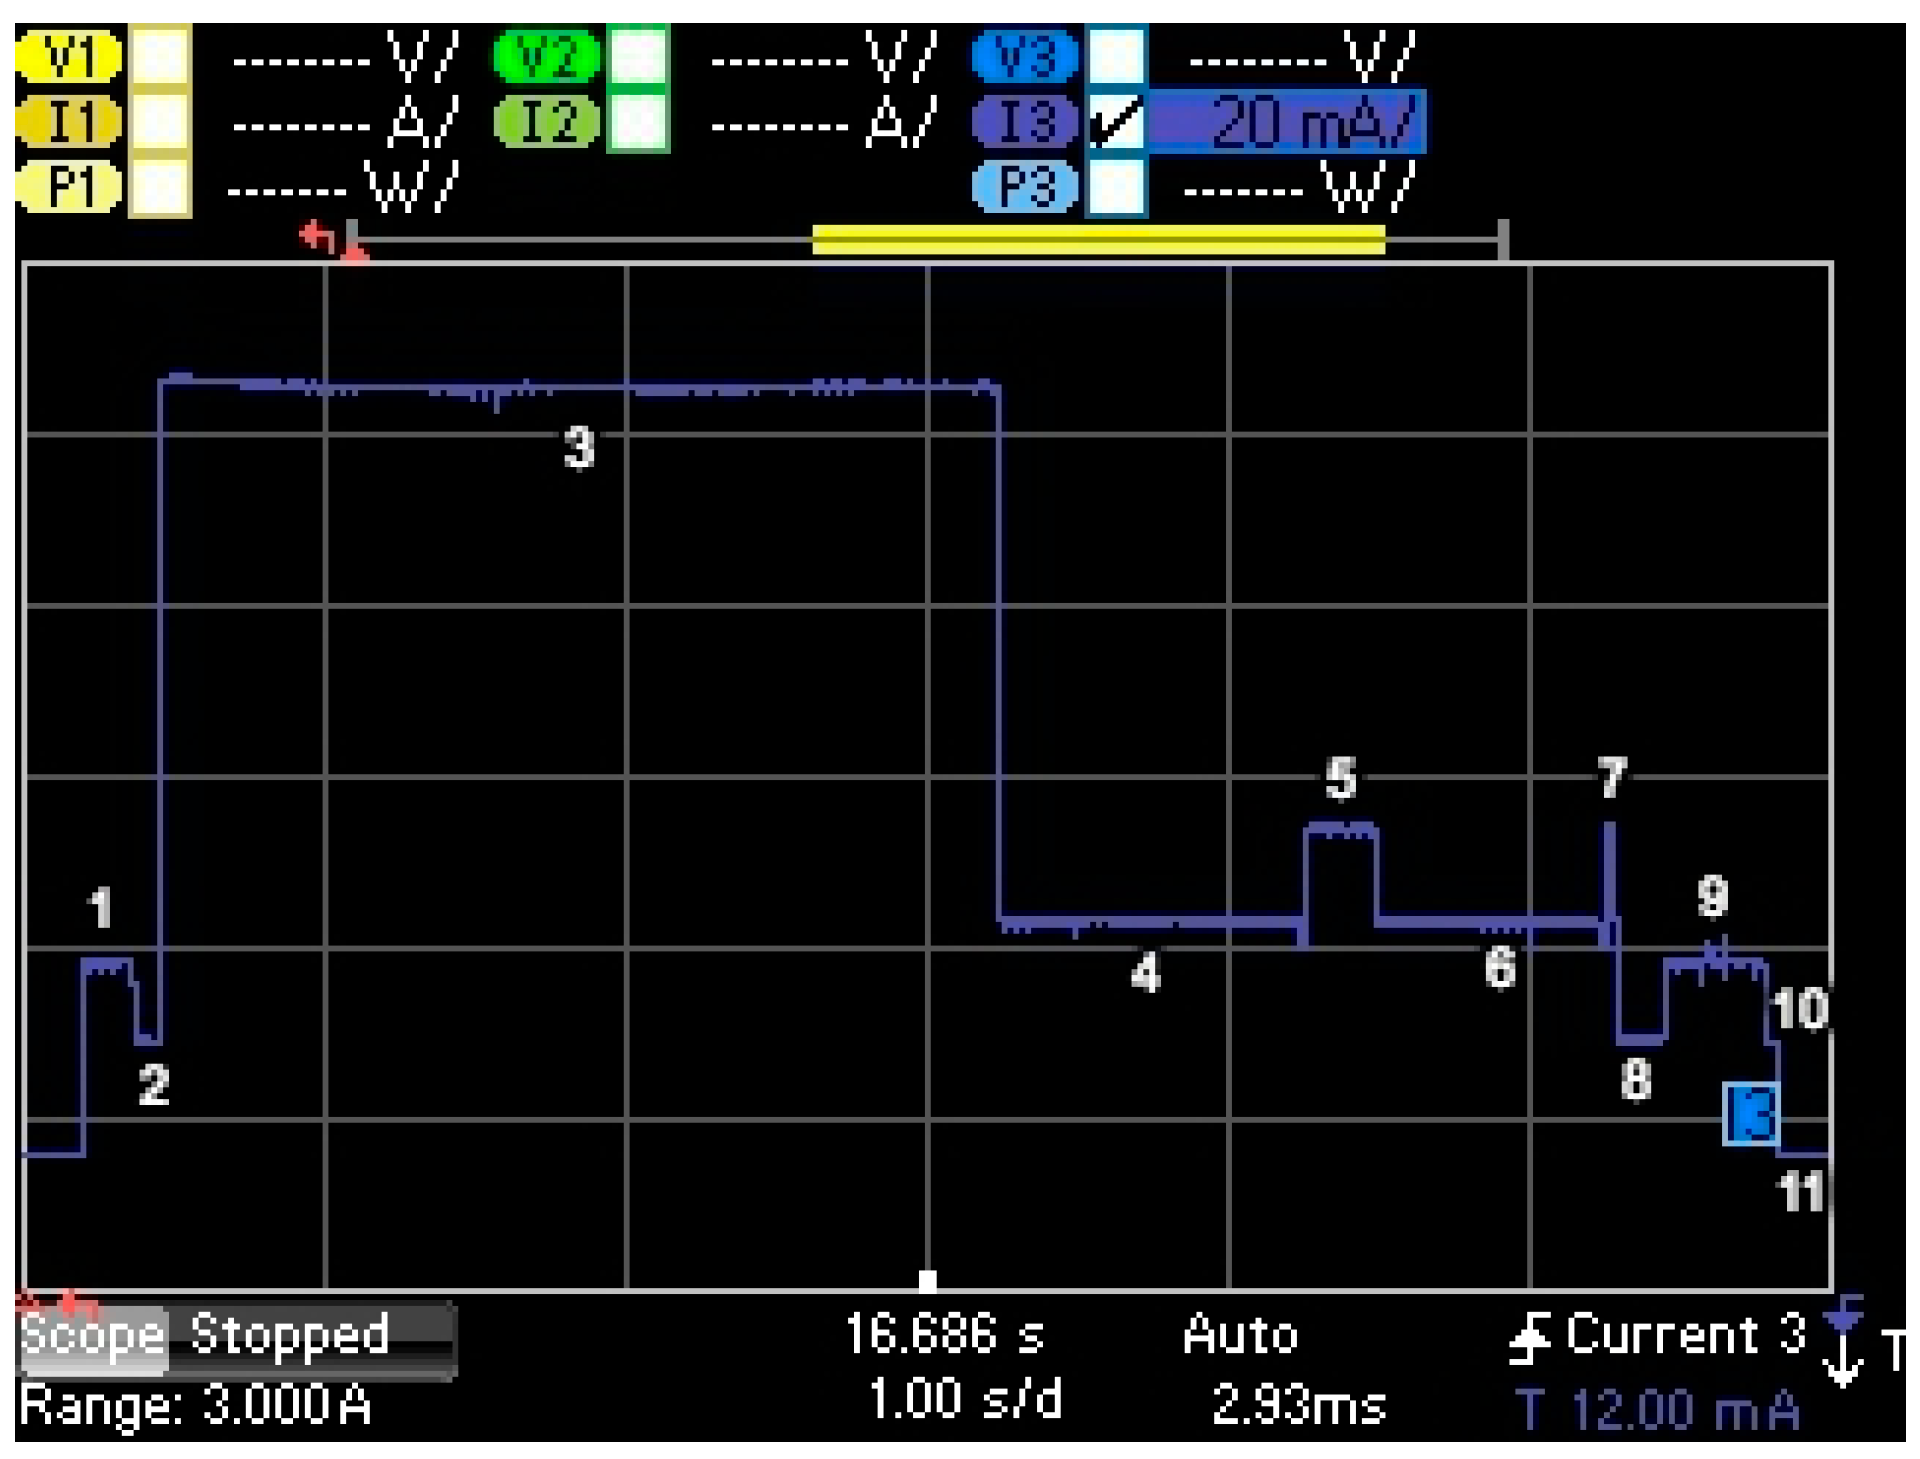
| State Number | Description | Duration | Current Consumption | ||
|---|---|---|---|---|---|
| Variable | Value (ms) | Variable | Value (mA) | ||
| 1 | wake up | Twu | 168.2 | Iwu | 22.1 |
| 2 | radio preparation | Tpre | 83.8 | Ipre | 13.3 |
| 3 | Transmission | Ttx | (see Table 6) | Itx | 83.0 |
| 4 | wait 1st window | Tw1w | 983.3 | Iw1w | 27.0 |
| 5 | 1st receive window | Trx1w | (see Table 6) | I1w | 38.1 |
| 6 | wait 2nd window | Tw2w | Equation (4) | Iw2w | 27.1 |
| 7 | 2nd receive window | Trx2w | 33.0 | I2w | 35.0 |
| 8 | radio off | Toff | 147.4 | Ioff | 13.2 |
| 9 | Postprocessing | Tpost | 268.0 | Ipost | 21.0 |
| 10 | turn off sequence | Tseq | 38.6 | Iseq | 13.3 |
| 11 | Sleep | Tsleep | Equation (2) | Isleep | 45 × 10−3 |
| DR | SF | Tsym | Tpreamble | Trx1w | Trx2w | DE | FRM Payload | Ttx Max | Ttx Min | |
|---|---|---|---|---|---|---|---|---|---|---|
| Max | Min | Uplink | Downlink | |||||||
| (ms) | (ms) | (ms) | (ms) | (bytes) | (bytes) | (ms) | (ms) | |||
| 0 | 12 | 32.77 | 401.41 | 262.14 | 33.02 | 1 | 51 | 0 | 2793.5 | 991.8 |
| 1 | 11 | 16.38 | 200.70 | 131.07 | 16.64 | 1 | 51 | 0 | 1560.6 | 577.5 |
| 2 | 10 | 8.19 | 100.35 | 98.30 | 8.45 | 0 | 51 | 0 | 698.4 | 288.7 |
| 3 | 9 | 4.10 | 50.18 | 49.15 | 4.35 | 0 | 115 | 0 | 676.9 | 144.4 |
| 4 | 8 | 2.05 | 25.09 | 24.58 | 2.30 | 0 | 242 | 0 | 707.1 | 72.2 |
| 5 | 7 | 1.02 | 12.54 | 12.29 | 1.28 | 0 | 242 | 0 | 399.6 | 41.2 |
| 6 | 7 | 0.51 | 6.27 | 6.14 | 0.64 | 0 | 242 | 0 | 199.8 | 20.6 |
| 7 | - | 0.02 | 0.48 | 1.28 | 1.28 | - | 242 | 0 | 42.4 | 3.2 |
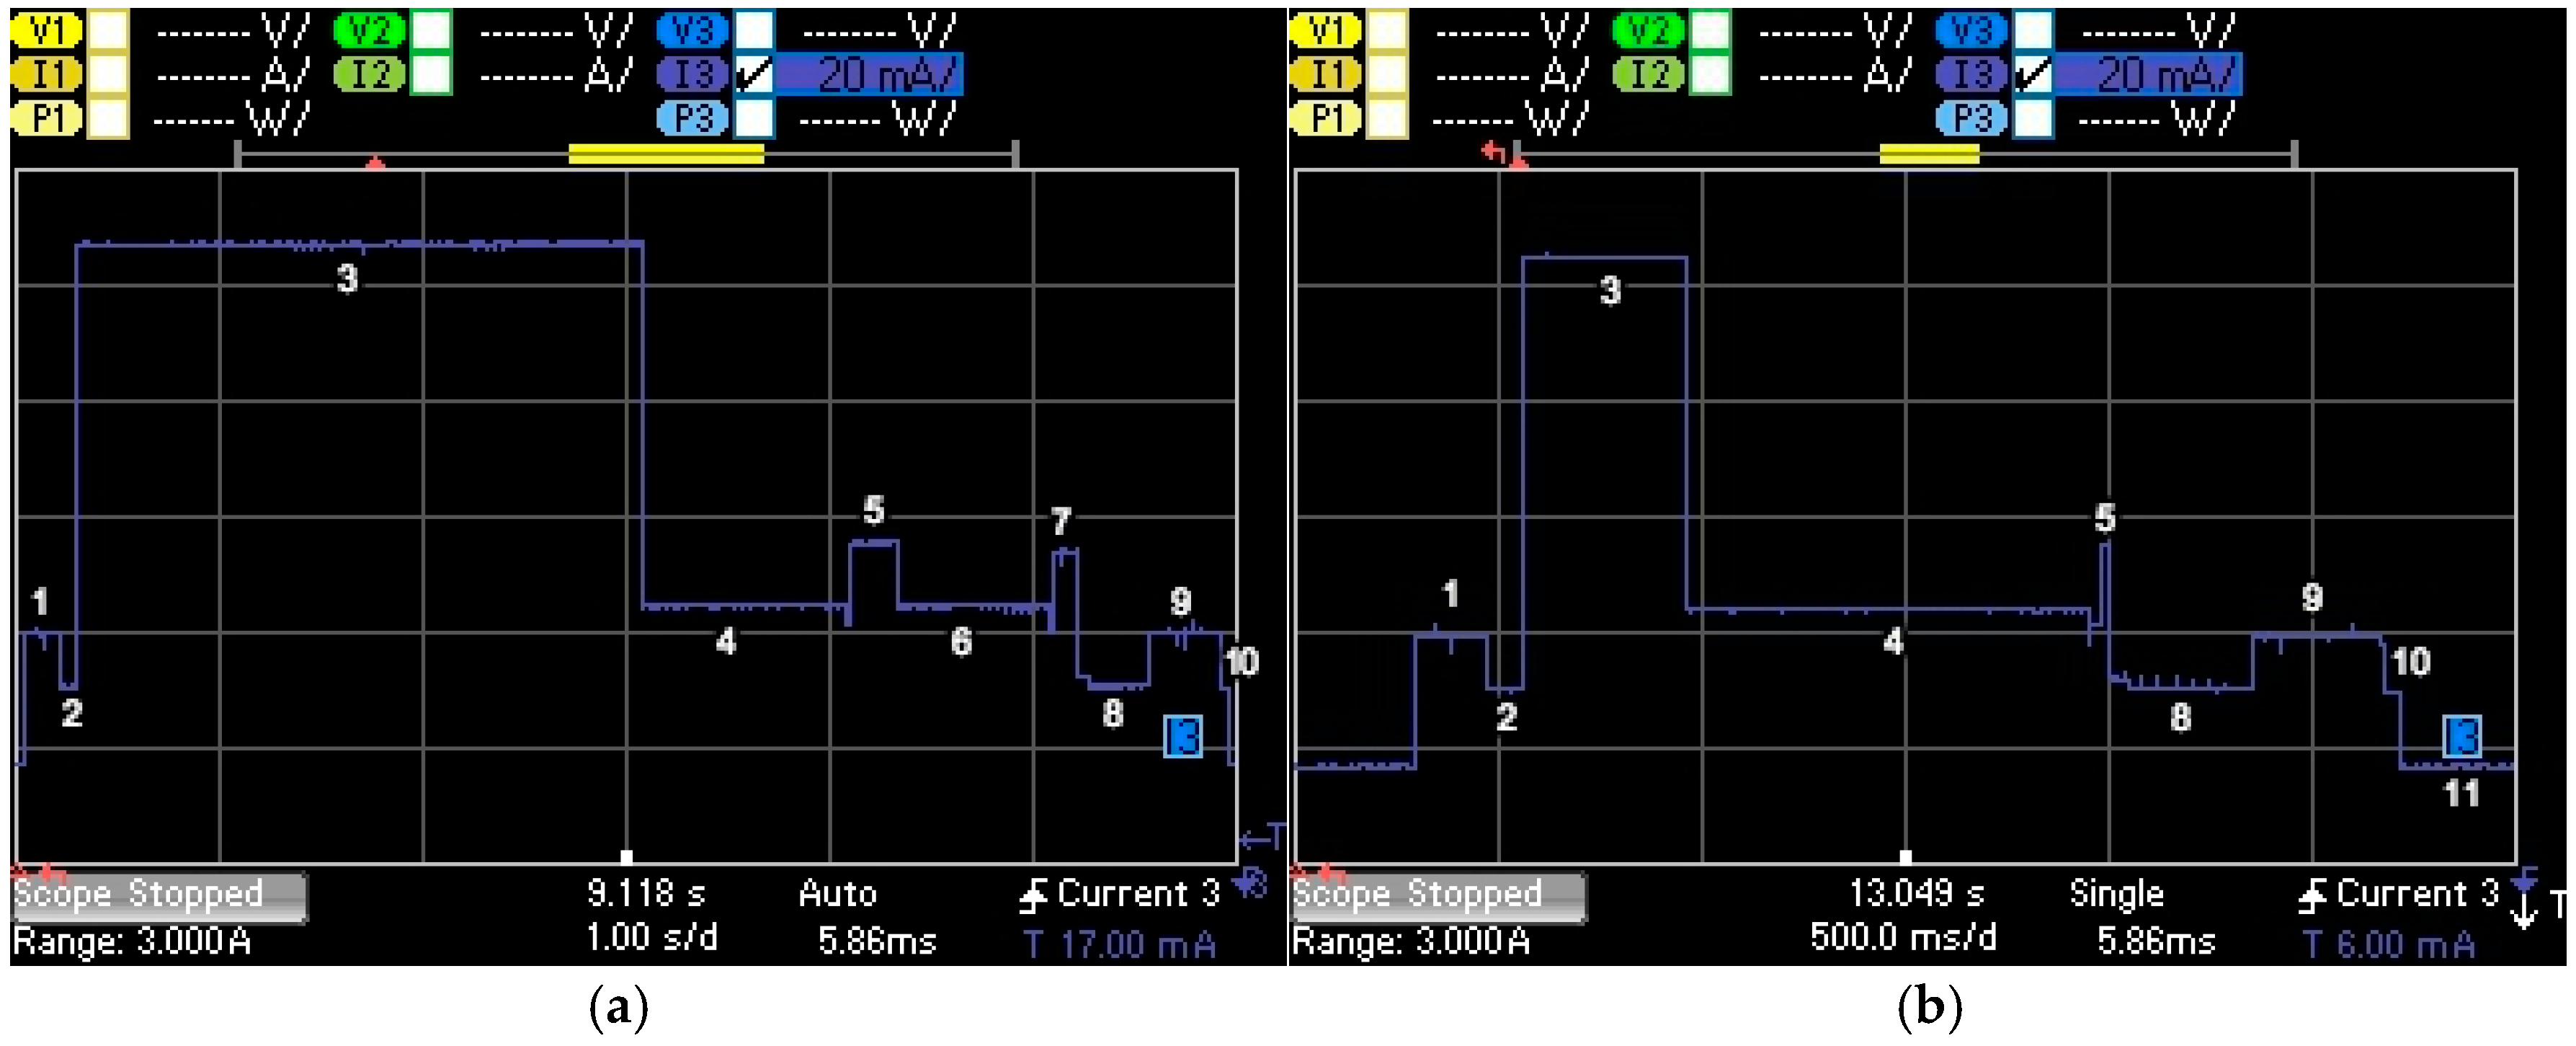
| State Number | Description | Duration | Current Consumption | ||
|---|---|---|---|---|---|
| Variable | Value (ms) | Variable | Value (mA) | ||
| 1 | wake up | Twu | 169.2 | Iwu | 22.1 |
| 2 | radio preparation | Tpre | 80.4 | Ipre | 13.7 |
| 3 | transmission | Ttx | (see Table 6) | Itx | 82.8 |
| 4 | wait 1st window | Tw1w | 988.4 | Iw1w | 27.1 |
| 5 | 1st receive window | Trx1w | (Ttx min in Table 6) | I1w | 31.8 |
| 8 | radio off | Toff | 337.8 | Ioff | 13.4 |
| 9 | postprocessing | Tpost | 272.5 | Ipost | 20.9 |
| 10 | turn off sequence | Tseq | 37.5 | Iseq | 13.4 |
| 11 | sleep | Tsleep | Equation (2) | Isleep | 45 × 10−3 |
| State Number | Description | Duration | Current Consumption | ||
|---|---|---|---|---|---|
| Variable | Value (ms) | Variable | Value (mA) | ||
| 7 | 2nd receive window | Trx2w | (Ttx min in Table 6) | I2w | 38.0 |
| 8 | radio off | Toff | 337.8 | Ioff | 13.4 |
© 2017 by the authors. Licensee MDPI, Basel, Switzerland. This article is an open access article distributed under the terms and conditions of the Creative Commons Attribution (CC BY) license (http://creativecommons.org/licenses/by/4.0/).
Share and Cite
Casals, L.; Mir, B.; Vidal, R.; Gomez, C. Modeling the Energy Performance of LoRaWAN. Sensors 2017, 17, 2364. https://doi.org/10.3390/s17102364
Casals L, Mir B, Vidal R, Gomez C. Modeling the Energy Performance of LoRaWAN. Sensors. 2017; 17(10):2364. https://doi.org/10.3390/s17102364
Chicago/Turabian StyleCasals, Lluís, Bernat Mir, Rafael Vidal, and Carles Gomez. 2017. "Modeling the Energy Performance of LoRaWAN" Sensors 17, no. 10: 2364. https://doi.org/10.3390/s17102364
APA StyleCasals, L., Mir, B., Vidal, R., & Gomez, C. (2017). Modeling the Energy Performance of LoRaWAN. Sensors, 17(10), 2364. https://doi.org/10.3390/s17102364