
Passive Mixing Capabilities of Micro- and Nanofibres When Used in Microfluidic Systems

Abstract
:1. Introduction
2. Materials and Methods
2.1. Electrospinning
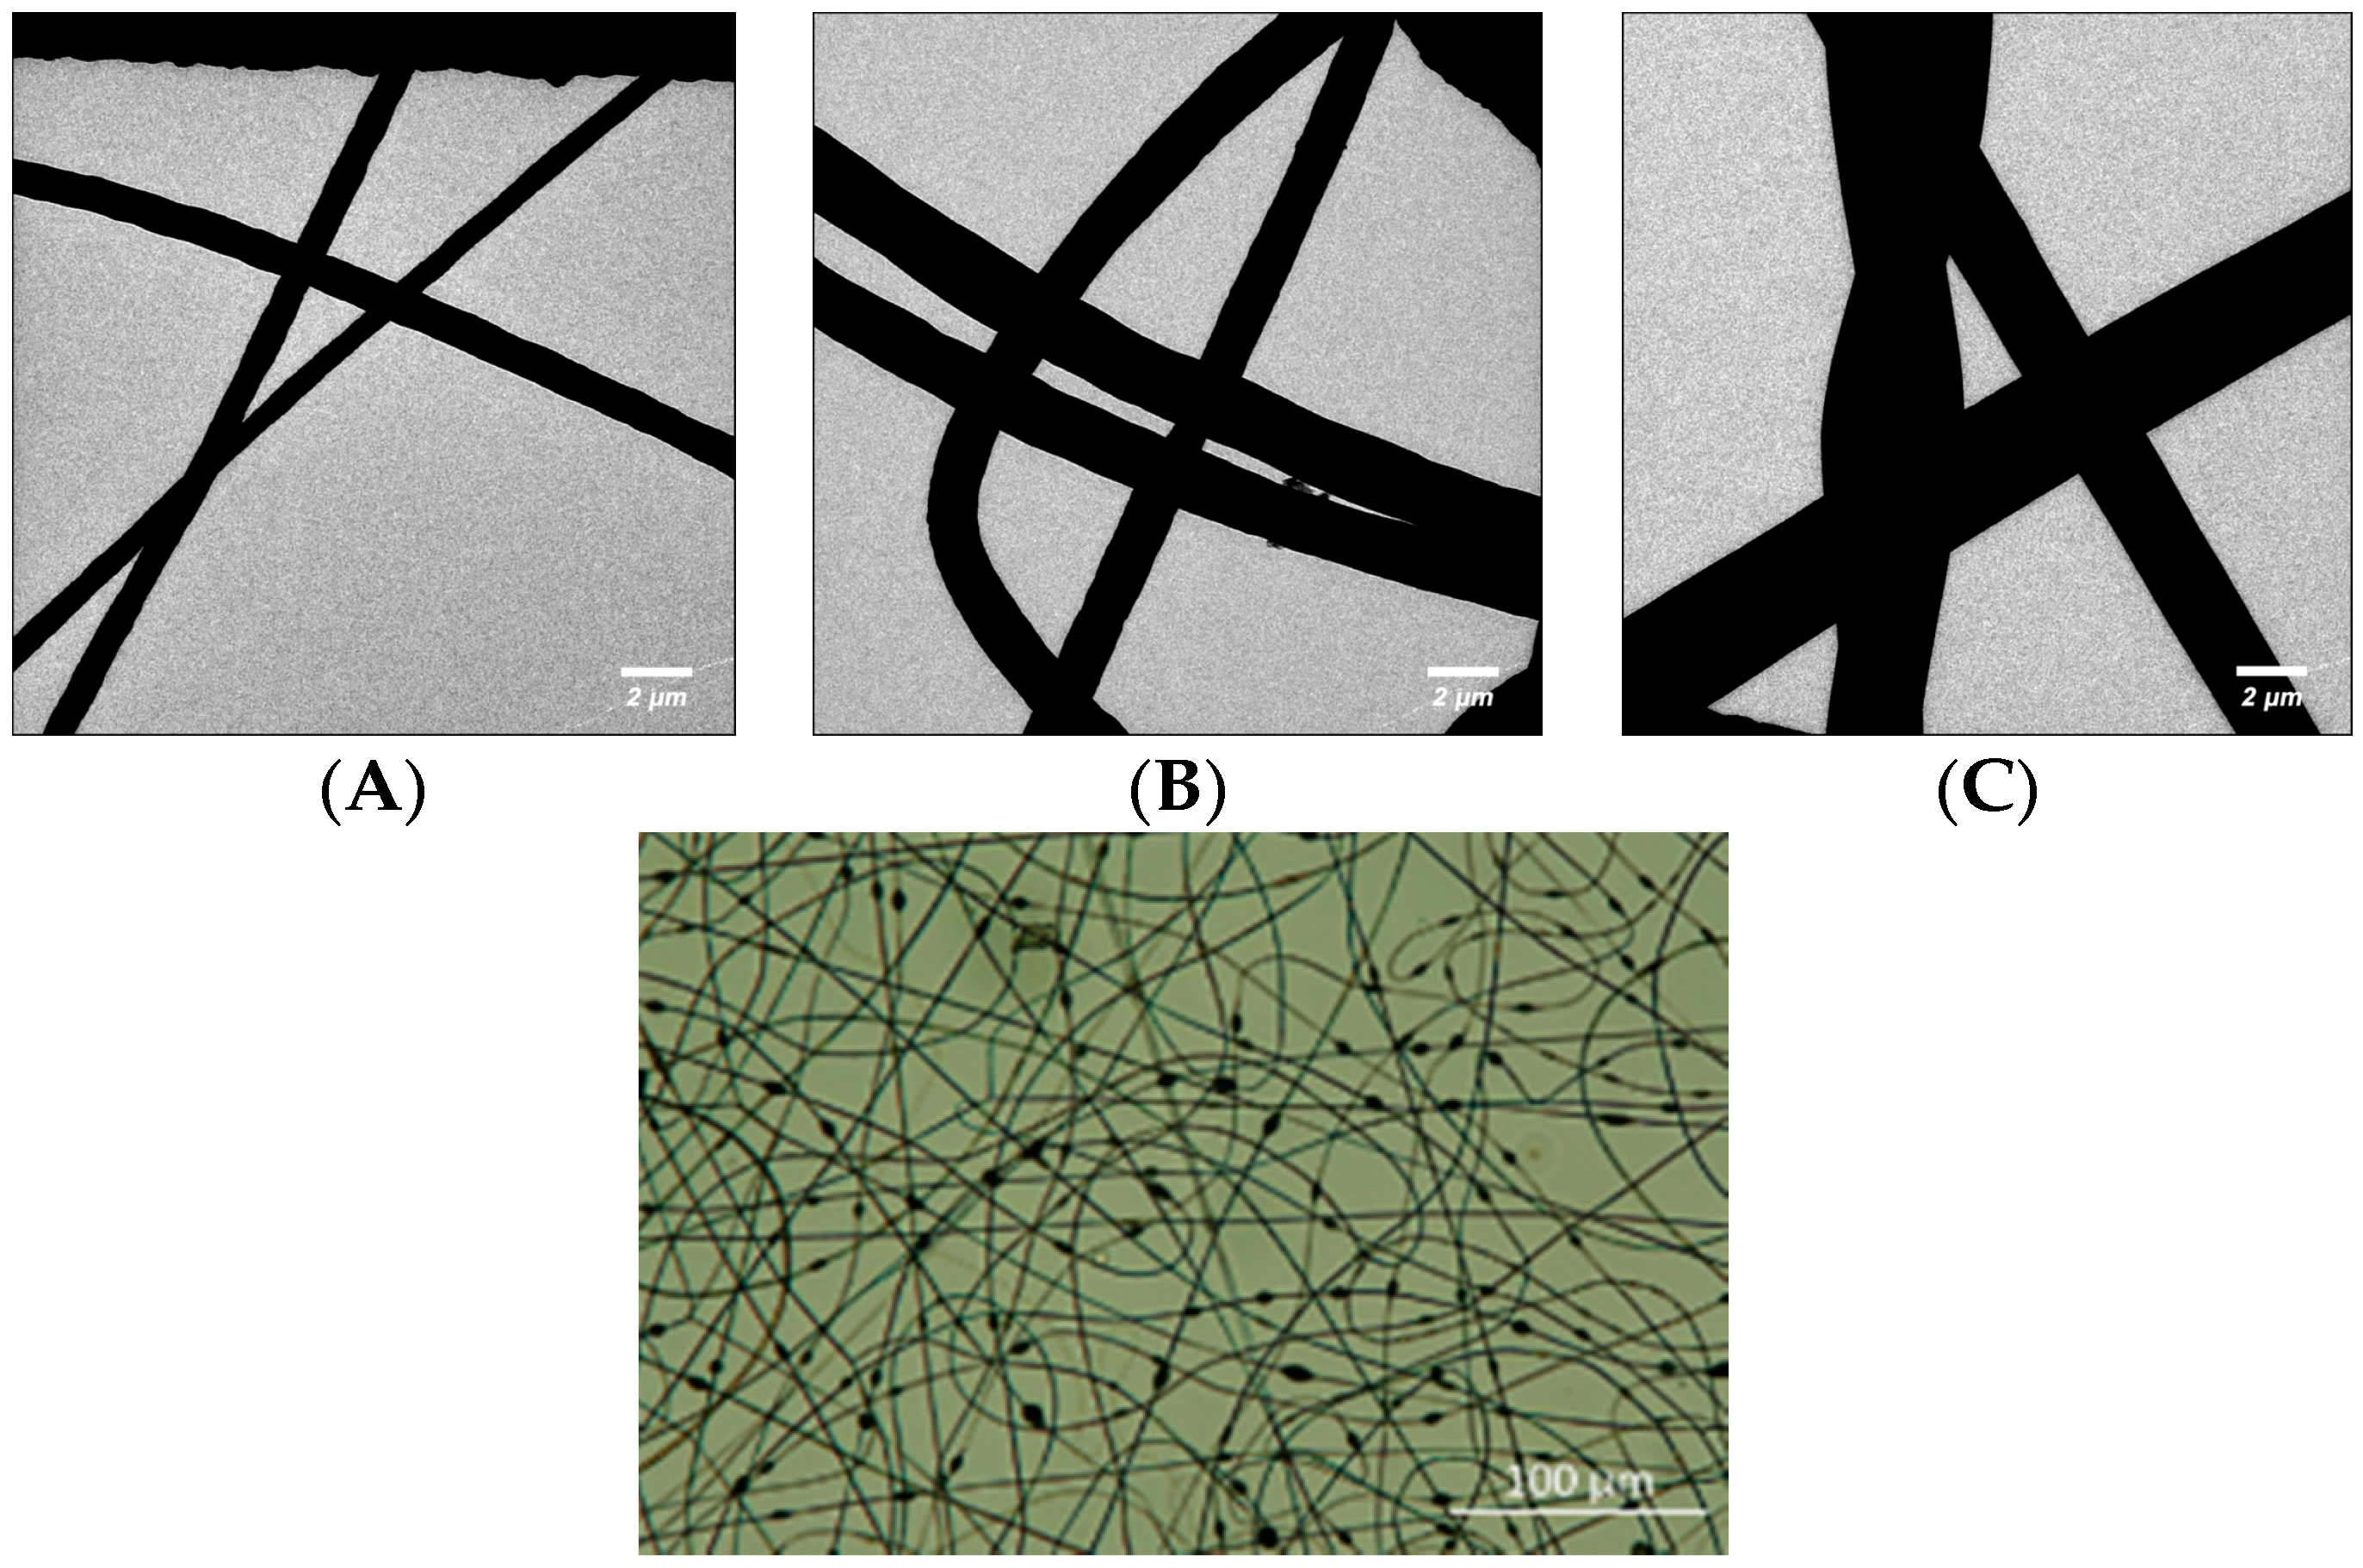
2.2. Analysis of Fibre Morphology
2.3. Microchannel Fabrication
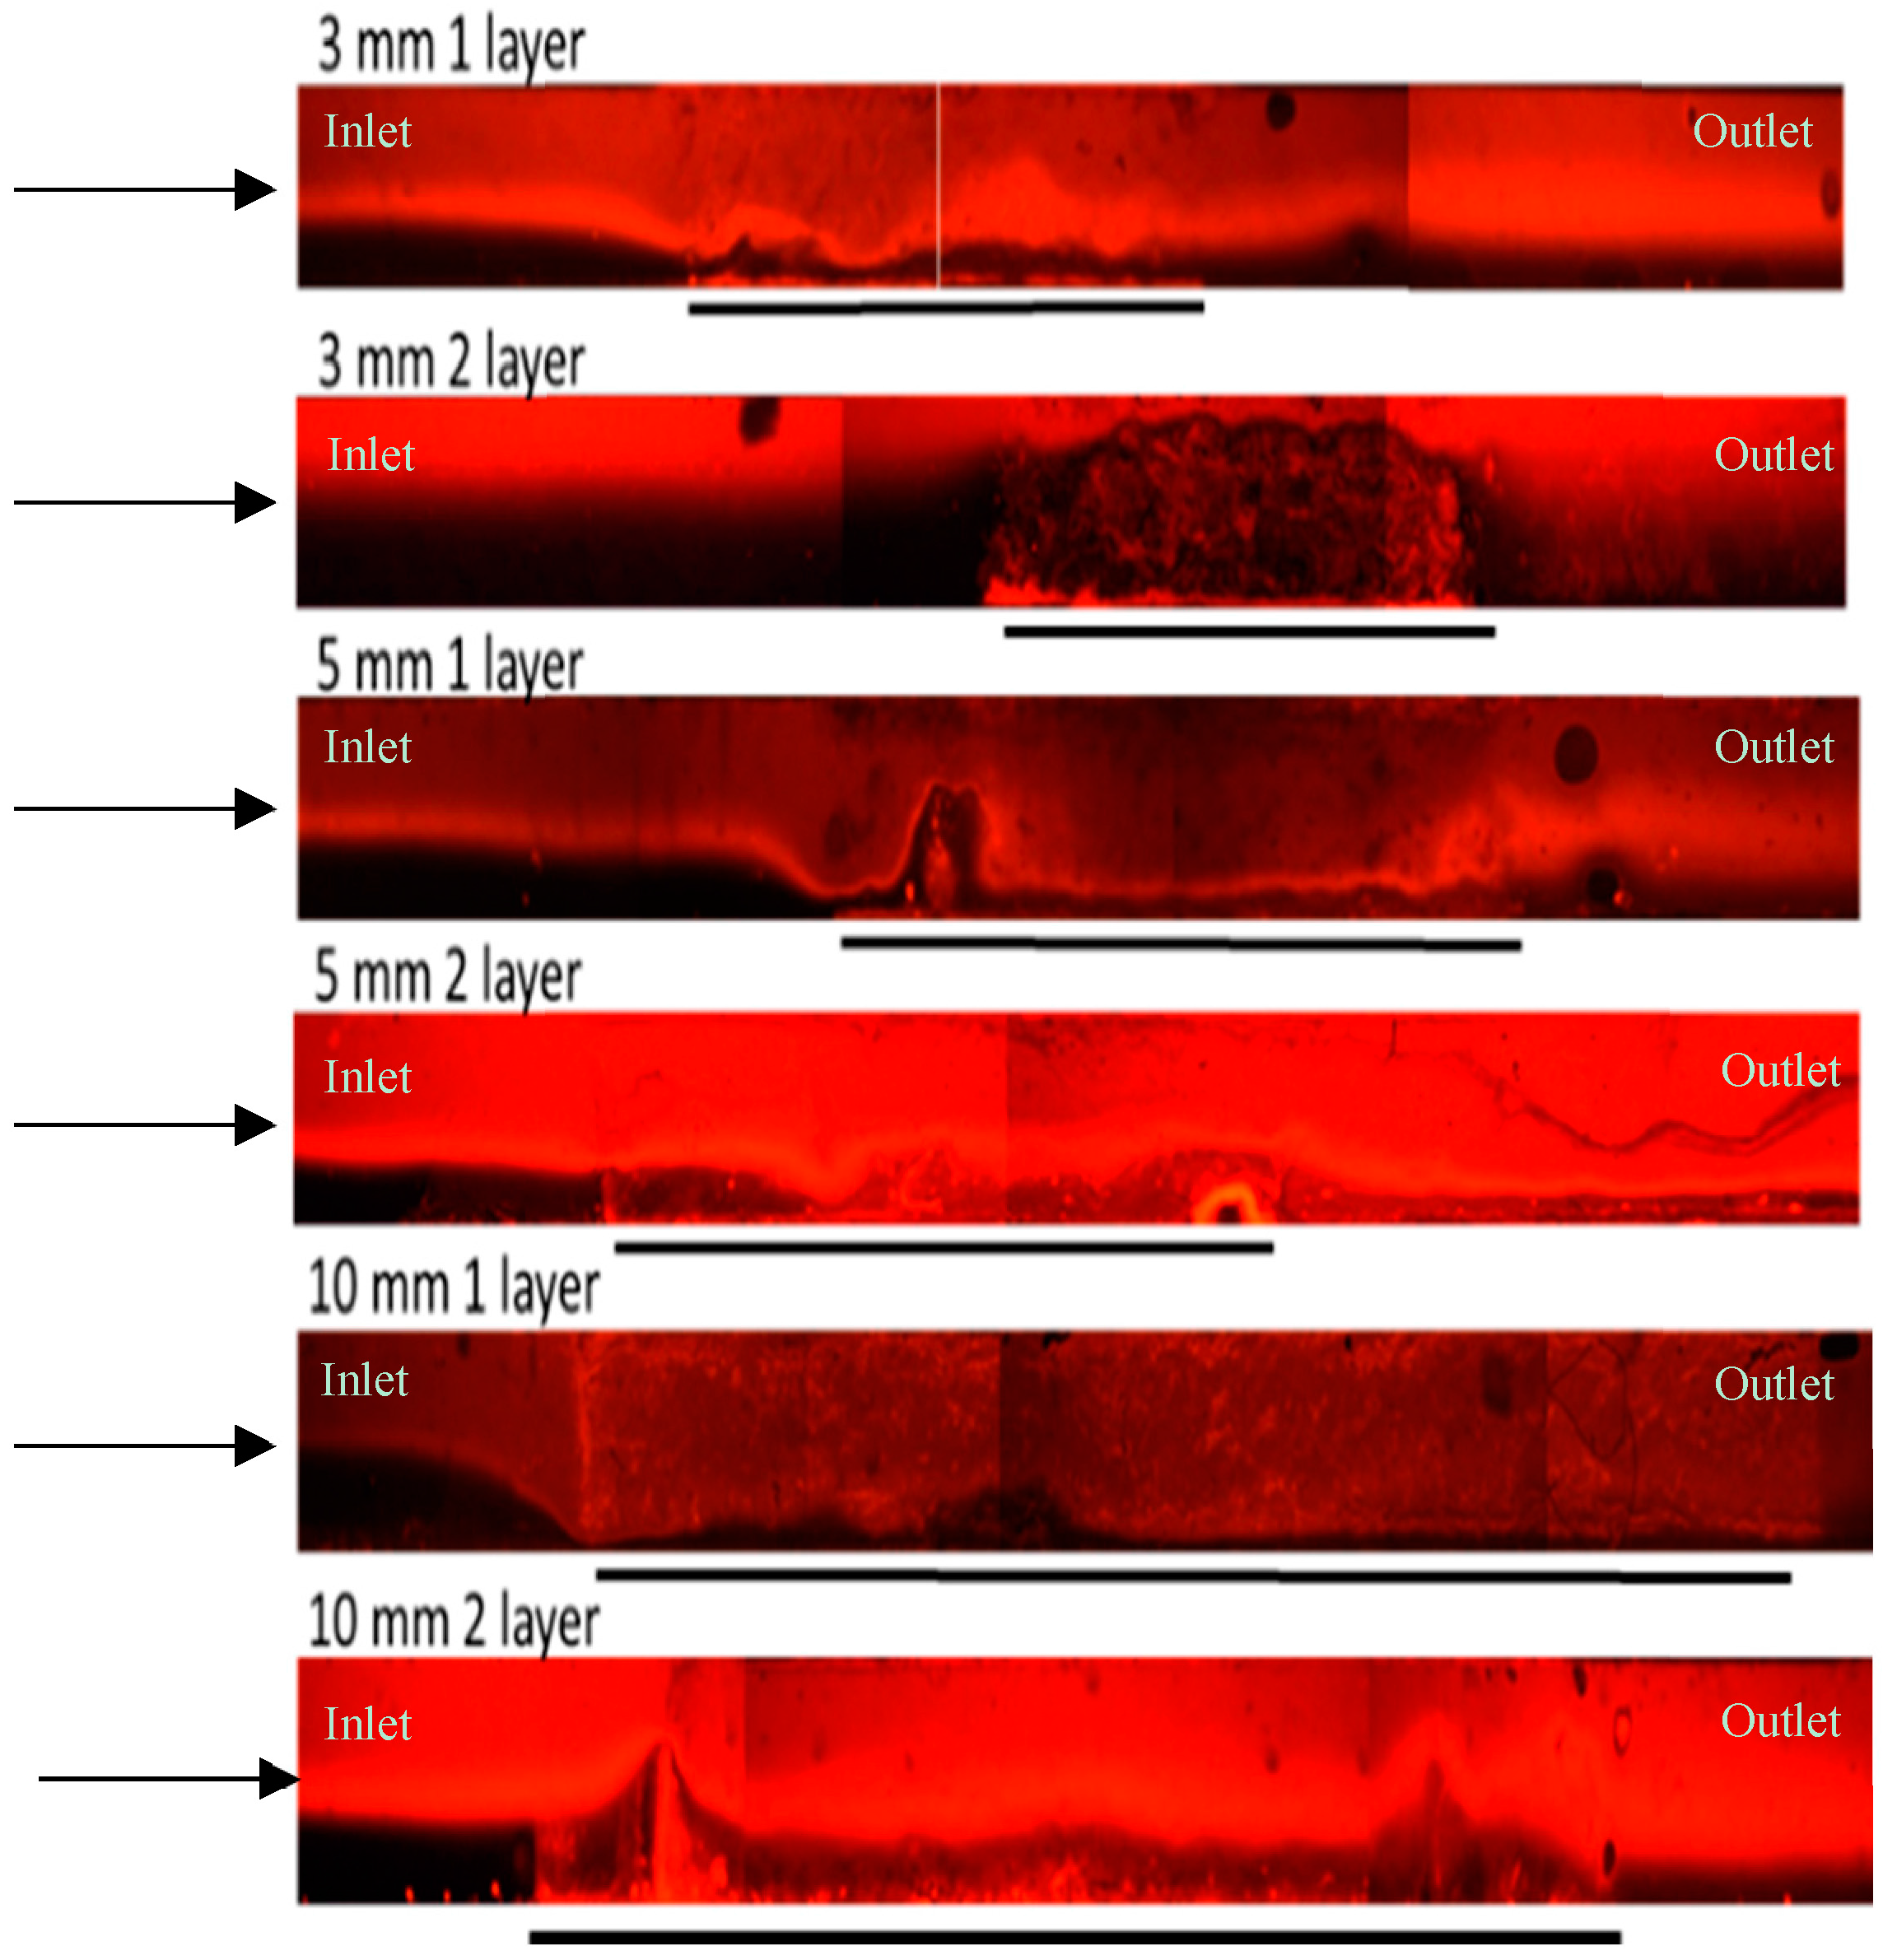
2.4. Fluid Mixing
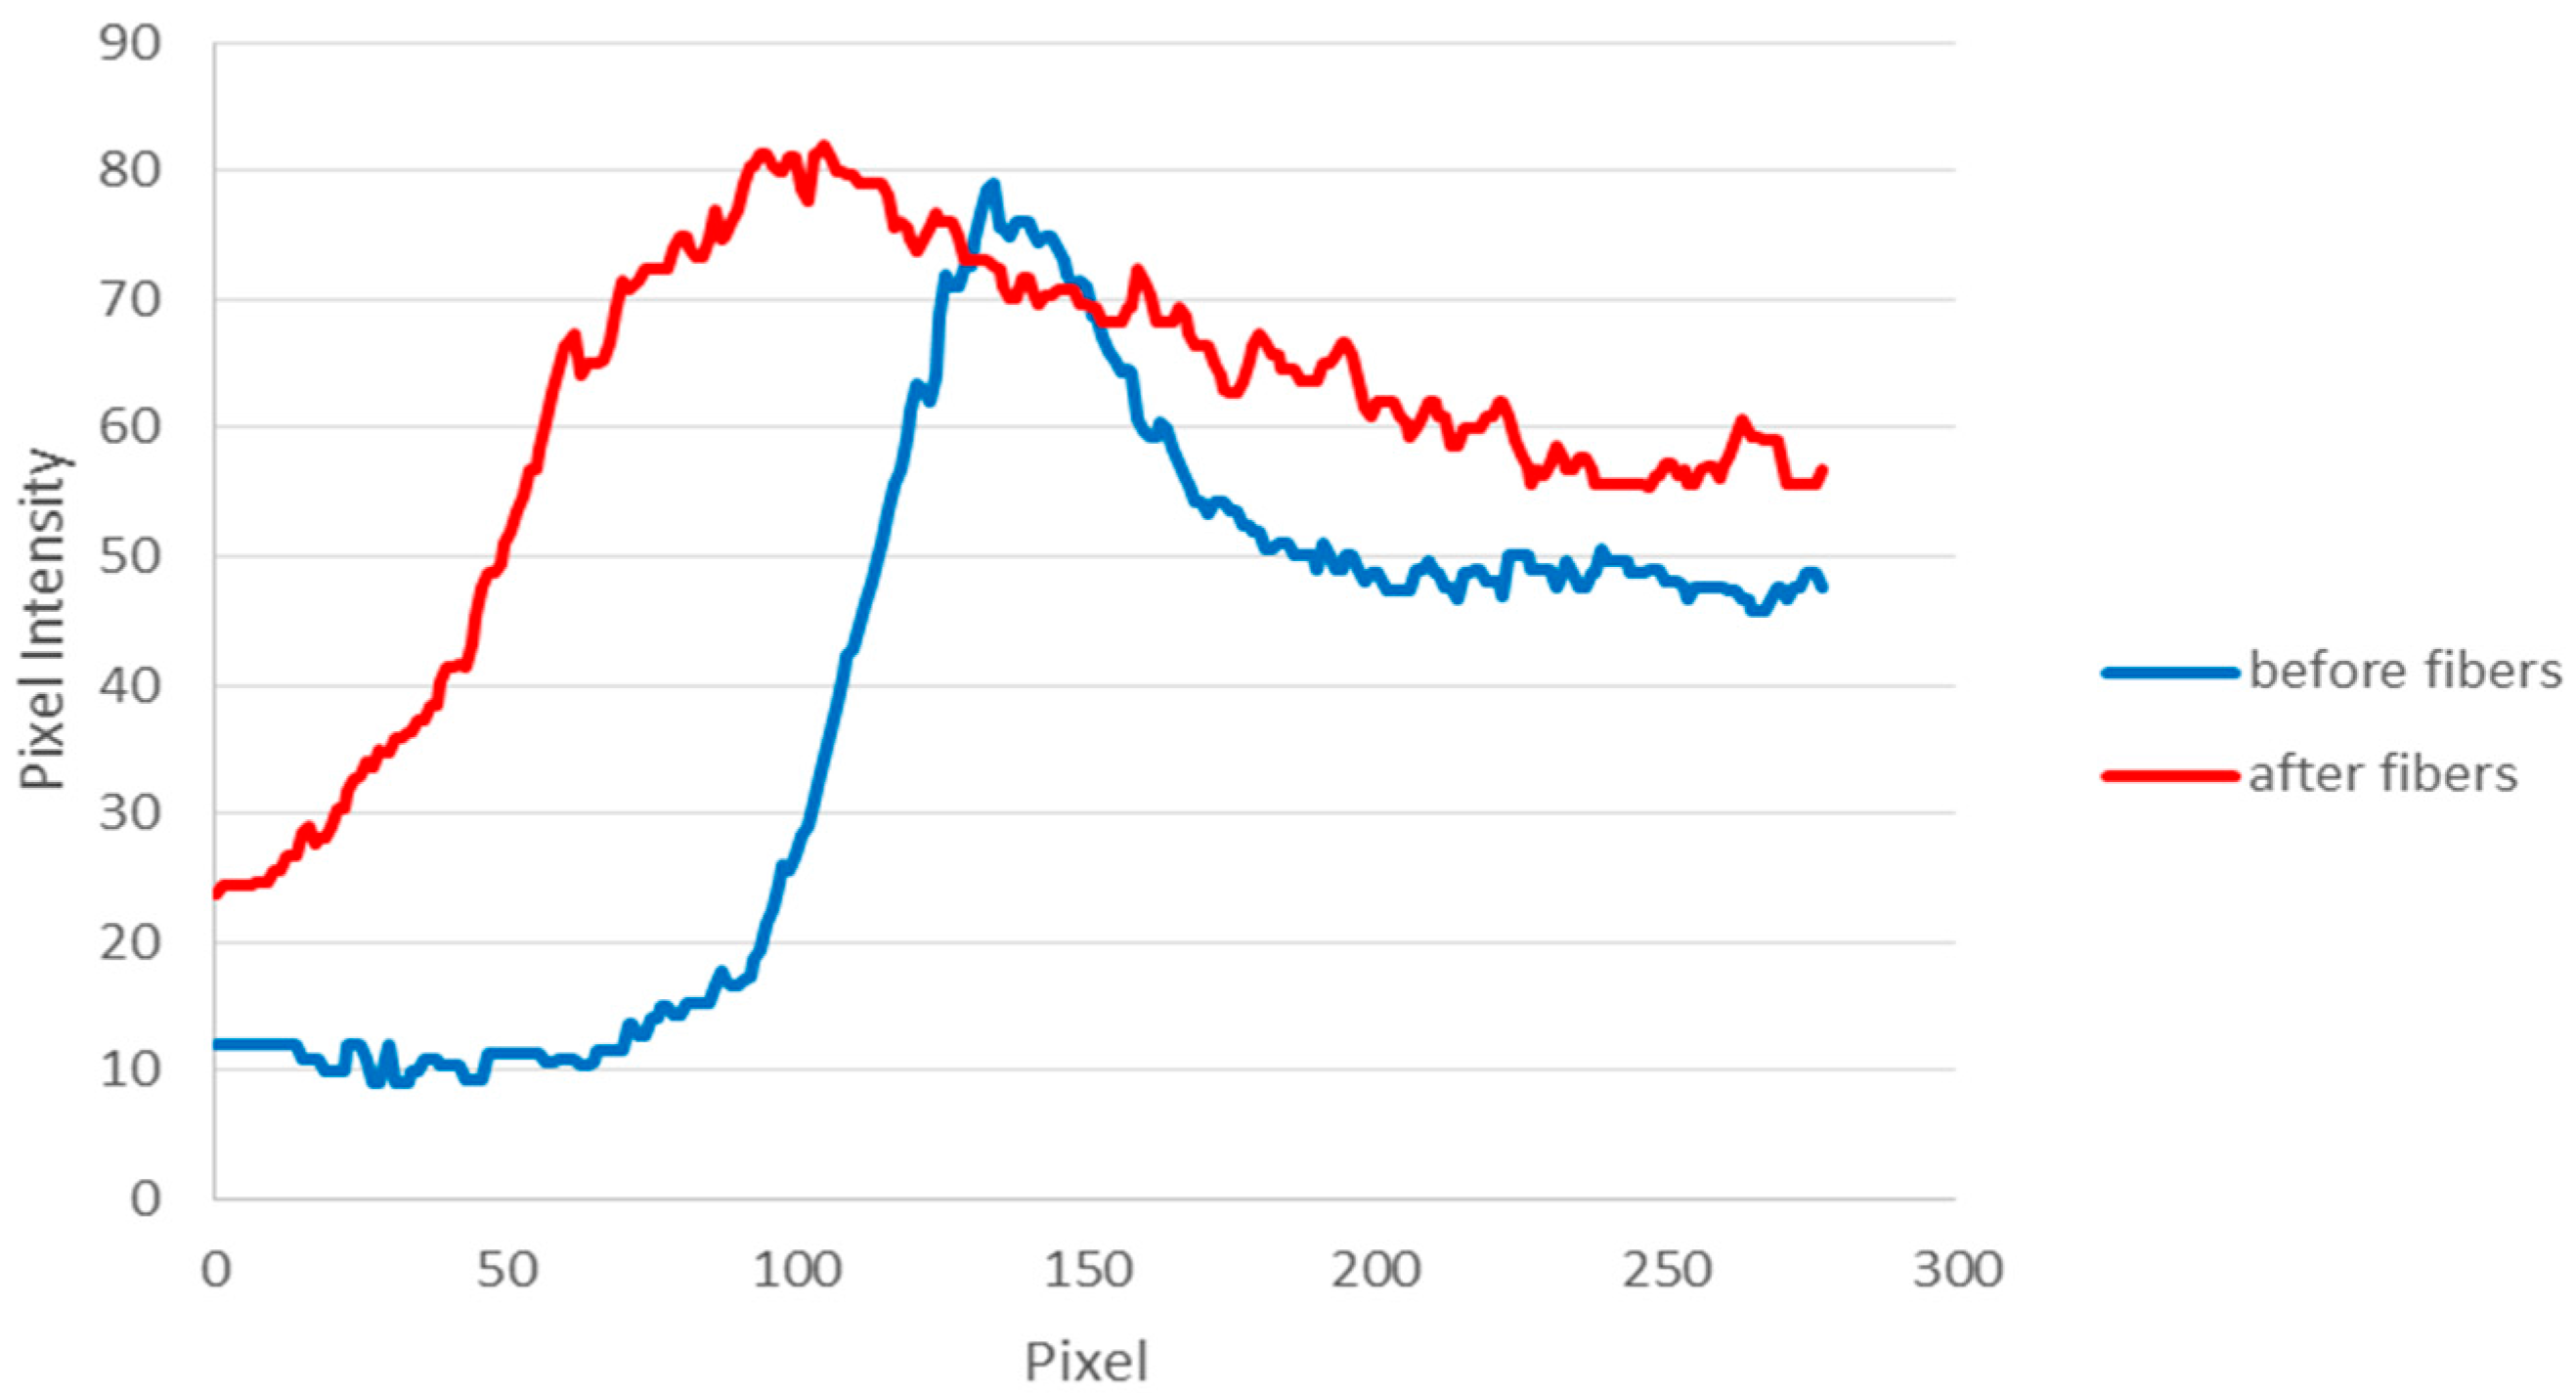
2.5. Data Analysis
2.6. Statistics
3. Results
3.1. Thick Nanofibre Mats
3.2. Layered PVA Nanofibre Mats
3.3. Layered PS Microfibre Mats
4. Discussion
4.1. Comparison of PVA and PS Fibre Mixing
4.2. Comparison to Conventional Micromixers
5. Conclusions
Supplementary Materials
Acknowledgments
Author Contributions
Conflicts of Interest
References
- Doshi, J.; Reneker, D.H. Electrospinning process and applications of electrospun fibers. In Proceedings of the Conference Record of the 1993 IEEE Industry Applications Society Annual Meeting, Toronto, ON, Canada, 2–8 October 1993; Volume 3, pp. 1698–1703.
- Matlock-Colangelo, L.; Baeumner, A.J. Recent progress in the design of nanofiber-based biosensing devices. Lab. Chip 2012, 12, 2612–2620. [Google Scholar] [PubMed]
- Santoro, M.; Shah, S.R.; Walker, J.L.; Mikos, A.G. Poly(lactic acid) nanofibrous scaffolds for tissue engineering. Adv. Drug Deliv. Rev. 2016, in press. [Google Scholar] [CrossRef] [PubMed]
- Jing, X.; Mi, H.-Y.; Peng, J.; Peng, X.-F.; Turng, L.-S. Electrospun aligned poly(propylene carbonate) microfibers with chitosan nanofibers as tissue engineering scaffolds. Carbohydr. Polym. 2015, 117, 941–949. [Google Scholar] [CrossRef] [PubMed]
- Kucinska-Lipka, J.; Gubanska, I.; Janik, H.; Sienkiewicz, M. Fabrication of polyurethane and polyurethane based composite fibres by the electrospinning technique for soft tissue engineering of cardiovascular system. Mater. Sci. Eng. C 2015, 46, 166–176. [Google Scholar] [CrossRef] [PubMed]
- Ru, C.; Wang, F.; Pang, M.; Sun, L.; Chen, R.; Sun, Y. Suspended, Shrinkage-Free, Electrospun PLGA Nanofibrous Scaffold for Skin Tissue Engineering. ACS Appl. Mater. Interfaces 2015, 7, 10872–10877. [Google Scholar] [CrossRef] [PubMed]
- Jin, S.; Dai, M.; Ye, B.; Nugen, S.R. Development of a capillary flow microfluidic Escherichia coli biosensor with on-chip reagent delivery using water-soluble nanofibers. Microsyst. Technol. 2013, 19, 2011–2015. [Google Scholar] [CrossRef]
- Zhang, P.; Zhao, X.; Ji, Y.; Ouyang, Z.; Wen, X.; Li, J.; Su, Z.; Wei, G. Electrospinning graphene quantum dots into a nanofibrous membrane for dual-purpose fluorescent and electrochemical biosensors. J. Mater. Chem. B 2015, 3, 2487–2496. [Google Scholar] [CrossRef]
- Bourourou, M.; Holzinger, M.; Bossard, F.; Hugenell, F.; Maaref, A.; Cosnier, S. Chemically reduced electrospun polyacrilonitrile-carbon nanotube nanofibers hydrogels as electrode material for bioelectrochemical applications. Carbon 2015, 87, 233–238. [Google Scholar] [CrossRef]
- Adabi, M.; Saber, R.; Faridi-Majidi, R.; Faridbod, F. Performance of electrodes synthesized with polyacrylonitrile-based carbon nanofibers for application in electrochemical sensors and biosensors. Mater. Sci. Eng. C 2015, 48, 673–678. [Google Scholar] [CrossRef] [PubMed]
- Zhang, Y.; Liu, S.; Li, Y.; Deng, D.; Si, X.; Ding, Y.; He, H.; Luo, L.; Wang, Z. Electrospun graphene decorated MnCo2O4 composite nanofibers for glucose biosensing. Biosens. Bioelectron. 2015, 66, 308–315. [Google Scholar] [CrossRef] [PubMed]
- Chung, S.-H.; Han, P.; Singhal, R.; Kalra, V.; Manthiram, A. Electrochemically Stable Rechargeable Lithium-Sulfur Batteries with a Microporous Carbon Nanofiber Filter for Polysulfide. Adv. Energy Mater. 2015, 5. [Google Scholar] [CrossRef]
- Aravindan, V.; Sundaramurthy, J.; Suresh Kumar, P.; Lee, Y.-S.; Ramakrishna, S.; Madhavi, S. Electrospun nanofibers: A prospective electro-active material for constructing high performance Li-ion batteries. Chem. Commun. 2015, 51, 2225–2234. [Google Scholar] [CrossRef] [PubMed]
- Singhal, R.; Chung, S.-H.; Manthiram, A.; Kalra, V. A free-standing carbon nanofiber interlayer for high-performance lithium-sulfur batteries. J. Mater. Chem. A 2015, 3, 4530–4538. [Google Scholar] [CrossRef]
- Hu, X.; Liu, S.; Zhou, G.; Huang, Y.; Xie, Z.; Jing, X. Electrospinning of polymeric nanofibers for drug delivery applications. J. Controlled Release 2014, 185, 12–21. [Google Scholar] [CrossRef] [PubMed]
- Mendes, A.C.; Gorzelanny, C.; Halter, N.; Schneider, S.W.; Chronakis, I.S. Hybrid electrospun chitosan-phospholipids nanofibers for transdermal drug delivery. Int. J. Pharm. 2016, 510, 48–56. [Google Scholar] [CrossRef] [PubMed]
- Pramanik, S.; Pingguan-Murphy, B.; Abu Osman, N.A. Progress of key strategies in development of electrospun scaffolds: Bone tissue. Sci. Technol. Adv. Mater. 2012, 13. [Google Scholar] [CrossRef]
- Jiang, T.; Carbone, E.J.; Lo, K.W.-H.; Laurencin, C.T. Electrospinning of polymer nanofibers for tissue regeneration. Prog. Polym. Sci. 2015, 46, 1–24. [Google Scholar] [CrossRef]
- Rezaei, B.; Ghani, M.; Shoushtari, A.M.; Rabiee, M. Electrochemical biosensors based on nanofibres for cardiac biomarker detection: A comprehensive review. Biosens. Bioelectron. 2016, 78, 513–523. [Google Scholar] [CrossRef] [PubMed]
- Rezvani, Z.; Venugopal, J.R.; Urbanska, A.M.; Mills, D.K.; Ramakrishna, S.; Mozafari, M. A bird’s eye view on the use of electrospun nanofibrous scaffolds for bone tissue engineering: Current state-of-the-art, emerging directions and future trends. Nanomed. Nanotechnol. Biol. Med. 2016, 12, 2181–2200. [Google Scholar] [CrossRef] [PubMed]
- Li, D.; Frey, M.W.; Baeumner, A.J. Electrospun polylactic acid nanofiber membranes as substrates for biosensor assemblies. J. Membr. Sci. 2006, 279, 354–363. [Google Scholar] [CrossRef]
- Luo, Y.; Nartker, S.; Miller, H.; Hochhalter, D.; Wiederoder, M.; Wiederoder, S.; Setterington, E.; Drzal, L.T.; Alocilja, E.C. Surface functionalization of electrospun nanofibers for detecting E. coli O157:H7 and BVDV cells in a direct-charge transfer biosensor. Biosens. Bioelectron. 2010, 26, 1612–1617. [Google Scholar] [CrossRef] [PubMed]
- Matlock-Colangelo, L.; Cho, D.; Pitner, C.L.; Frey, M.W.; Baeumner, A.J. Functionalized electrospun nanofibers as bioseparators in microfluidic systems. Lab Chip 2012, 12, 1696–1701. [Google Scholar] [CrossRef] [PubMed]
- Cho, D.; Matlock-Colangelo, L.; Xiang, C.; Asiello, P.J.; Baeumner, A.J.; Frey, M.W. Electrospun nanofibers for microfluidic analytical systems. Polymer 2011, 52, 3413–3421. [Google Scholar] [CrossRef]
- Matlock-Colangelo, L.; Coon, B.; Pitner, C.L.; Frey, M.W.; Baeumner, A.J. Functionalized electrospun poly(vinyl alcohol) nanofibers for on-chip concentration of E. coli cells. Anal. Bioanal. Chem. 2016, 408, 1327–1334. [Google Scholar] [CrossRef] [PubMed]
- Yang, D.; Niu, X.; Liu, Y.; Wang, Y.; Gu, X.; Song, L.; Zhao, R.; Ma, L.; Shao, Y.; Jiang, X. Electrospun Nanofibrous Membranes: A Novel Solid Substrate for Microfluidic Immunoassays for HIV. Adv. Mater. 2008, 20, 4770–4775. [Google Scholar] [CrossRef]
- Dai, M.; Jin, S.; Nugen, S.R. Water-Soluble Electrospun Nanofibers as a Method for on-Chip Reagent Storage. Biosensors 2012, 2, 388–395. [Google Scholar] [CrossRef] [PubMed]
- Nguyen, N.T.; Wu, Z. Micromixers—A review. J. Micromec. Microeng. 2005, 15, R1–R16. [Google Scholar] [CrossRef]
- Hessel, V.; Löwe, H.; Schönfeld, F. Micromixers—A review on passive and active mixing principles. Chem. Eng. Sci. 2005, 60, 2479–2501. [Google Scholar] [CrossRef]
- Li, J. Computational Analysis of Nanofluid Flow in Microchannels with Applications to Micro-heat Sinks and Bio-MEMS; ProQuest: Ann Arbor, MI, USA, 2008. [Google Scholar]
- Bökenkamp, D.; Desai, A.; Yang, X.; Tai, Y.-C.; Marzluff, E.M.; Mayo, S.L. Microfabricated Silicon Mixers for Submillisecond Quench-Flow Analysis. Anal. Chem. 1998, 70, 232–236. [Google Scholar] [CrossRef]
- Ducrée, J.; Haeberle, S.; Lutz, S.; Pausch, S.; von Stetten, F.; Zengerle, R. The centrifugal microfluidic bio-disk platform. J. Micromech. Microeng. 2007, 17, S103–S115. [Google Scholar]
- Vijayendran, R.A.; Motsegood, K.M.; Beebe, D.J.; Leckband, D.E. Evaluation of a Three-Dimensional Micromixer in a Surface-Based Biosensor. Langmuir 2003, 19, 1824–1828. [Google Scholar] [CrossRef]
- Wang, H.; Iovenitti, P.; Harvey, E.; Masood, S. Optimizing layout of obstacles for enhanced mixing in microchannels. Smart Mater. Struct. 2002, 11, 662–667. [Google Scholar] [CrossRef]
- Yang, Z.; Matsumoto, S.; Goto, H.; Matsumoto, M.; Maeda, R. Ultrasonic micromixer for microfluidic systems. Sens. Actuators Phys. 2001, 93, 266–272. [Google Scholar] [CrossRef]
- Wong, S.H.; Ward, M.C.L.; Wharton, C.W. Micro T-mixer as a rapid mixing micromixer. Sens. Actuators B Chem. 2004, 100, 359–379. [Google Scholar] [CrossRef]
- Kim, D.S.; Lee, S.W.; Kwon, T.H.; Lee, S.S. A barrier embedded chaotic micromixer. J. Micromech. Microeng. 2004, 14, 798. [Google Scholar] [CrossRef]
- Marle, L.; Greenway, G.M. Microfluidic devices for environmental monitoring. TrAC Trends Anal. Chem. 2005, 24, 795–802. [Google Scholar] [CrossRef]
- Chronakis, I.S.; Grapenson, S.; Jakob, A. Conductive polypyrrole nanofibers via electrospinning: Electrical and morphological properties. Polymer 2006, 47, 1597–1603. [Google Scholar] [CrossRef]
- Jang, S.-Y.; Seshadri, V.; Khil, M.-S.; Kumar, A.; Marquez, M.; Mather, P.T.; Sotzing, G.A. Welded Electrochromic Conductive Polymer Nanofibers by Electrostatic Spinning. Adv. Mater. 2005, 17, 2177–2180. [Google Scholar] [CrossRef]
- Patel, A.C.; Li, S.; Yuan, J.-M.; Wei, Y. In situ Encapsulation of Horseradish Peroxidase in Electrospun Porous Silica Fibers for Potential Biosensor Applications. Nano Lett. 2006, 6, 1042–1046. [Google Scholar] [CrossRef] [PubMed]
- Li, D.; Frey, M.W.; Vynias, D.; Baeumner, A.J. Availability of biotin incorporated in electrospun PLA fibers for streptavidin binding. Polymer 2007, 48, 6340–6347. [Google Scholar] [CrossRef]
- Wang, D.; Sun, G.; Xiang, B.; Chiou, B.-S. Controllable biotinylated poly(ethylene-co-glycidyl methacrylate) (PE-co-GMA) nanofibers to bind streptavidin–horseradish peroxidase (HRP) for potential biosensor applications. Eur. Polym. J. 2008, 44, 2032–2039. [Google Scholar] [CrossRef]
- Kim, J.H.; Hwang, E.T.; Kang, K.; Tatavarty, R.; Gu, M.B. Aptamers-on-nanofiber as a novel hybrid capturing moiety. J. Mater. Chem. 2011, 21, 19203–19206. [Google Scholar] [CrossRef]
- Nugen, S.R.; Asiello, P.J.; Baeumner, A.J. Design and fabrication of a microfluidic device for near-single cell mRNA isolation using a copper hot embossing master. Microsyst. Technol. 2008, 15, 477–483. [Google Scholar] [CrossRef]
- Lu, L.-H.; Ryu, K.S.; Liu, C. A magnetic microstirrer and array for microfluidic mixing. J. Microelectromec. Syst. 2002, 11, 462–469. [Google Scholar]
- Chang, S.T.; Beaumont, E.; Petsev, D.N.; Velev, O.D. Remotely powered distributed microfluidic pumps and mixers based on miniature diodes. Lab Chip 2007, 8, 117–124. [Google Scholar] [CrossRef] [PubMed]
- Holm, S. A Simple Sequentially Rejective Multiple Test Procedure. Scand. J. Stat. 1979, 6, 65–70. [Google Scholar]
- Glantz, S.; Slinker, B. Primer of Applied Regression & Analysis of Variance; McGraw-Hill Education: New York, NY, USA, 2000. [Google Scholar]
- Zhang, Q.; Welch, J.; Park, H.; Wu, C.-Y.; Sigmund, W.; Marijnissen, J.C.M. Improvement in nanofiber filtration by multiple thin layers of nanofiber mats. J. Aerosol. Sci. 2010, 41, 230–236. [Google Scholar] [CrossRef]
- Przekop, R.; Gradon, L. Deposition and Filtration of Nanoparticles in the Composites of Nano- and Microsized Fibers. Aerosol. Sci. Technol. 2008, 42, 483–493. [Google Scholar] [CrossRef]
- Podgórski, A.; Bałazy, A.; Gradoń, L. Application of nanofibers to improve the filtration efficiency of the most penetrating aerosol particles in fibrous filters. Chem. Eng. Sci. 2006, 61, 6804–6815. [Google Scholar] [CrossRef]
- Bland, J.M.; Altman, D.G. Multiple significance tests: The Bonferroni method. BMJ 1995, 310, 170. [Google Scholar] [CrossRef] [PubMed]
- Lin, Y.; Gerfen, G.J.; Rousseau, D.L.; Yeh, S.-R. Ultrafast Microfluidic Mixer and Freeze-Quenching Device. Anal. Chem. 2003, 75, 5381–5386. [Google Scholar] [CrossRef] [PubMed]
- Chen, L.; Wang, G.; Lim, C.; Seong, G.H.; Choo, J.; Lee, E.K.; Kang, S.H.; Song, J.M. Evaluation of passive mixing behaviors in a pillar obstruction poly(dimethylsiloxane) microfluidic mixer using fluorescence microscopy. Microfluid. Nanofluid. 2008, 7, 267–273. [Google Scholar] [CrossRef]
- Johnson, T.J.; Ross, D.; Locascio, L.E. Rapid Microfluidic Mixing. Anal. Chem. 2002, 74, 45–51. [Google Scholar] [CrossRef] [PubMed]
- Bhagat, A.A.S.; Peterson, E.T.K.; Papautsky, I. A passive planar micromixer with obstructions for mixing at low Reynolds numbers. J. Micromech. Microeng. 2007, 17, 1017–1024. [Google Scholar] [CrossRef]
- Li, D.; Frey, M.W.; Joo, Y.L. Characterization of nanofibrous membranes with capillary flow porometry. J. Membr. Sci. 2006, 286, 104–114. [Google Scholar] [CrossRef]
- Nedjari, S.; Schlatter, G.; Hébraud, A. Thick electrospun honeycomb scaffolds with controlled pore size. Mater. Lett. 2015, 142, 180–183. [Google Scholar] [CrossRef]
- Park, C.H.; Bae, H.; Kwak, S.J.; Jang, M.S.; Lee, J.-H.; Lee, J. Interconnection of electrospun nanofibers via a post co-solvent treatment and its open pore size effect on pressure-retarded osmosis performance. Macromol. Res. 2016, 24, 314–322. [Google Scholar] [CrossRef]
- Krifa, M.; Yuan, W. Morphology and pore size distribution of electrospun and centrifugal forcespun nylon 6 nanofiber membranes. Text. Res. J. 2016, 86, 1294–1306. [Google Scholar] [CrossRef]
- Kerr-Phillips, T.E.; Woehling, V.; Agniel, R.; Nguyen, G.T.M.; Vidal, F.; Kilmartin, P.; Plesse, C.; Travas-Sejdic, J. Electrospun rubber fibre mats with electrochemically controllable pore sizes. J. Mater. Chem. B 2015, 3, 4249–4258. [Google Scholar] [CrossRef]
- Park, J.-C.; Ito, T.; Kim, K.-O.; Kim, K.-W.; Kim, B.-S.; Khil, M.-S.; Kim, H.-Y.; Kim, I.-S. Electrospun poly(vinyl alcohol) nanofibers: Effects of degree of hydrolysis and enhanced water stability. Polym. J. 2010, 42, 273–276. [Google Scholar] [CrossRef]
- Lu, X.; Zhou, J.; Zhao, Y.; Qiu, Y.; Li, J. Room Temperature Ionic Liquid Based Polystyrene Nanofibers with Superhydrophobicity and Conductivity Produced by Electrospinning. Chem. Mater. 2008, 20, 3420–3424. [Google Scholar] [CrossRef]
- Ansari, M.A.; Kim, K.-Y.; Anwar, K.; Kim, S.M. A novel passive micromixer based on unbalanced splits and collisions of fluid streams. J. Micromech. Microeng. 2010, 20, 055007. [Google Scholar] [CrossRef]
- Jeon, W.; Shin, C.B. Design and simulation of passive mixing in microfluidic systems with geometric variations. Chem. Eng. J. 2009, 152, 575–582. [Google Scholar] [CrossRef]
- Cama, J.; Bajaj, H.; Pagliara, S.; Maier, T.; Braun, Y.; Winterhalter, M.; Keyser, U.F. Quantification of Fluoroquinolone Uptake through the Outer Membrane Channel OmpF of Escherichia coli. J. Am. Chem. Soc. 2015, 137, 13836–13843. [Google Scholar] [CrossRef] [PubMed]
- Cama, J.; Chimerel, C.; Pagliara, S.; Javer, A.; Keyser, U.F. A label-free microfluidic assay to quantitatively study antibiotic diffusion through lipid membranes. Lab Chip 2014, 14, 2303–2308. [Google Scholar] [CrossRef] [PubMed]
- Gobby, D.; Angeli, P.; Gavriilidis, A. Mixing characteristics of T-type microfluidic mixers. J. Micromech. Microeng. 2001, 11, 126–132. [Google Scholar] [CrossRef]
- Kirby, B.J. Micro- and Nanoscale Fluid Mechanics: Transport in Microfluidic Devices; Cambridge University Press: New York, NY, USA, 2010. [Google Scholar]
- Min, B.-M.; Lee, S.W.; Lim, J.N.; You, Y.; Lee, T.S.; Kang, P.H.; Park, W.H. Chitin and chitosan nanofibers: Electrospinning of chitin and deacetylation of chitin nanofibers. Polymer 2004, 45, 7137–7142. [Google Scholar] [CrossRef]
- Zhang, M.; Wang, Z.; Wang, Z.; Feng, S.; Xu, H.; Zhao, Q.; Wang, S.; Fang, J.; Qiao, M.; Kong, D. Immobilization of anti-CD31 antibody on electrospun poly(ɛ-caprolactone) scaffolds through hydrophobins for specific adhesion of endothelial cells. Colloids Surf. B Biointerfaces 2011, 85, 32–39. [Google Scholar] [CrossRef] [PubMed]
- Xie, J.; Hsieh, Y.-L. Ultra-high surface fibrous membranes from electrospinning of natural proteins: Casein and lipase enzyme. J. Mater. Sci. 2003, 38, 2125–2133. [Google Scholar] [CrossRef]
- Luo, C.J.; Stoyanov, S.D.; Stride, E.; Pelan, E.; Edirisinghe, M. Electrospinning versus fibre production methods: From specifics to technological convergence. Chem. Soc. Rev. 2012, 41, 4708–4735. [Google Scholar] [CrossRef] [PubMed]
- Katta, P.; Alessandro, M.; Ramsier, R.D.; Chase, G.G. Continuous Electrospinning of Aligned Polymer Nanofibers onto a Wire Drum Collector. Nano Lett. 2004, 4, 2215–2218. [Google Scholar] [CrossRef]
- Li, D.; Wang, Y.; Xia, Y. Electrospinning Nanofibers as Uniaxially Aligned Arrays and Layer-by-Layer Stacked Films. Adv. Mater. 2004, 16, 361–366. [Google Scholar] [CrossRef]
- McClure, M.J.; Wolfe, P.S.; Simpson, D.G.; Sell, S.A.; Bowlin, G.L. The use of air-flow impedance to control fiber deposition patterns during electrospinning. Biomaterials 2012, 33, 771–779. [Google Scholar] [CrossRef] [PubMed]
- Nayak, R.; Padhye, R.; Kyratzis, I.L.; Truong, Y.B.; Arnold, L. Recent advances in nanofibre fabrication techniques. Text. Res. J. 2012, 82, 129–147. [Google Scholar] [CrossRef]
- Mahalingam, S.; Edirisinghe, M. Forming of Polymer Nanofibers by a Pressurised Gyration Process. Macromol. Rapid Commun. 2013, 34, 1134–1139. [Google Scholar] [CrossRef] [PubMed]


| Morphology | Mixing Index (inlet) | Standard Deviation | Mixing Index (outlet) | Standard Deviation | Difference from Control Outlet | Standard Deviation |
|---|---|---|---|---|---|---|
| Control: No Fibres | 0.8 | 0.17 | 0.71 | 0.12 | - | - |
| 3 mm 1 layer | 0.56 | 0.20 | 0.41 | 0.13 | 0.30 | 0.17 |
| 3 mm 2 layer | 0.53 | 0.07 | 0.36 | 0.09 | 0.35 | 0.15 |
| 5 mm 1 layer | 0.64 | 0.08 | 0.45 | 0.11 | 0.26 | 0.16 |
| 5 mm 2 layer | 0.45 | 0.08 | 0.29 | 0.09 | 0.42 | 0.15 |
| 10 mm 1 layer | 0.74 | 0.22 | 0.52 | 0.07 | 0.19 | 0.14 |
| 10 mm 2 layer | 0.57 | 0.21 | 0.32 | 0.06 | 0.39 | 0.13 |
| Morphology | Mixing Index (Inlet) | Standard Deviation | Mixing Index (Outlet) | Standard Deviation | Difference from Control Outlet Mixing Index | Standard Deviation |
|---|---|---|---|---|---|---|
| Control: No Fibres | 0.80 | 0.17 | 0.71 | 0.12 | - | - |
| 1 layer 12.5% | 0.84 | 0.12 | 0.64 | 0.17 | 0.07 | 0.21 |
| 2 layer 12.5% | 0.77 | 0.05 | 0.56 | 0.09 | 0.15 | 0.15 |
| 1 layer 15% | 0.87 | 0.02 | 0.78 | 0.05 | −0.07 | 0.13 |
| 2 layer 15% | 0.67 | 0.05 | 0.49 | 0.03 | 0.22 | 0.12 |
| 1 layer 17.5% | 0.71 | 0.28 | 0.56 | 0.19 | 0.15 | 0.22 |
| 2 layer 17.5% | 0.72 | 0.23 | 0.57 | 0.18 | 0.14 | 0.22 |
| Mixer | Setting | Mixing Index | Reference |
|---|---|---|---|
| Split and Recombine | Re = 10 | 0.9 | Ansari et al. [65] |
| Re = 60 | 0.7 | Ansari et al. [65] | |
| Diamond Obstacles | Asymmetric Distribution | 0.2 | Bhagat et al. [57] |
| Zigzag | 0.1 | Jeon et al. [66] | |
| Circular Baffles | 0.3 | Jeon et al. [66] | |
| PVA Nanofibres | 2 layer 5 mm | 0.3 | This work |
© 2016 by the authors; licensee MDPI, Basel, Switzerland. This article is an open access article distributed under the terms and conditions of the Creative Commons Attribution (CC-BY) license (http://creativecommons.org/licenses/by/4.0/).
Share and Cite
Matlock-Colangelo, L.; Colangelo, N.W.; Fenzl, C.; Frey, M.W.; Baeumner, A.J. Passive Mixing Capabilities of Micro- and Nanofibres When Used in Microfluidic Systems. Sensors 2016, 16, 1238. https://doi.org/10.3390/s16081238
Matlock-Colangelo L, Colangelo NW, Fenzl C, Frey MW, Baeumner AJ. Passive Mixing Capabilities of Micro- and Nanofibres When Used in Microfluidic Systems. Sensors. 2016; 16(8):1238. https://doi.org/10.3390/s16081238
Chicago/Turabian StyleMatlock-Colangelo, Lauren, Nicholas W. Colangelo, Christoph Fenzl, Margaret W. Frey, and Antje J. Baeumner. 2016. "Passive Mixing Capabilities of Micro- and Nanofibres When Used in Microfluidic Systems" Sensors 16, no. 8: 1238. https://doi.org/10.3390/s16081238