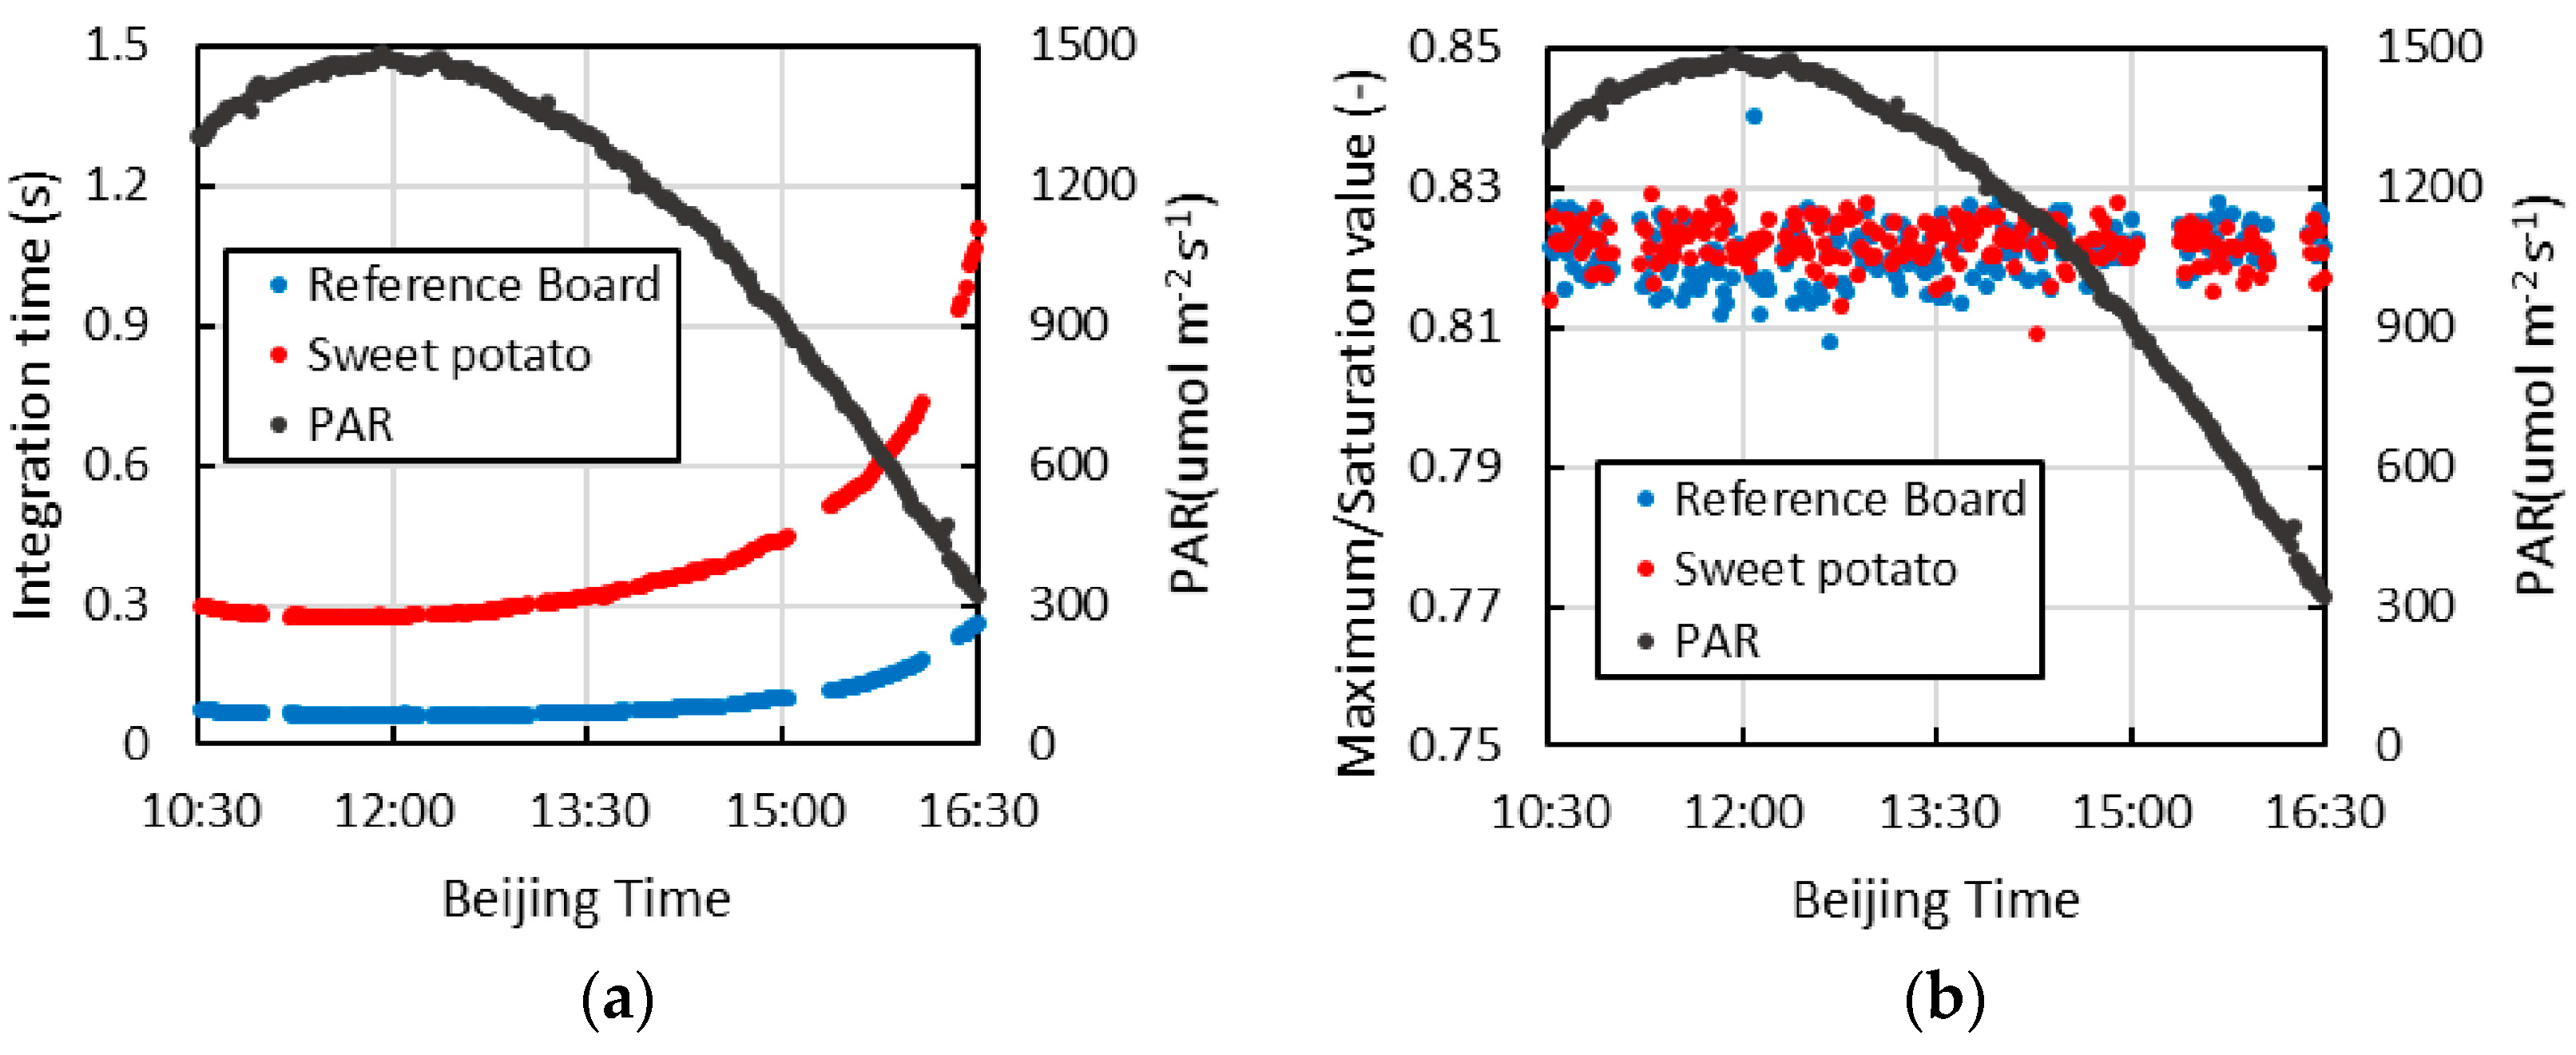
Figure 9a is the integration time of using this continuous observation system to measure the spectrum of the reference plate and the canopy of sweet potatoes. Because the optimization method for integration time is adopted, the integration time of measuring the spectrum of the reference plate and canopy of sweet potatoes gradually increases with a decrease in PAR. Within the scope of the observation time, the integration time of measuring the spectrum of the reference plate is always less than 0.3 s, and that of measuring the spectrum of the canopy of sweet potatoes is always less than 1.2 s. With addition of the time of turning of the device-rotation motors (approximately 3~4 s) and the time of optimizing the integration time (less than the time of measuring the spectrum of the reference plate and canopy of sweet potatoes), from 10:30 A.M. to 4 P.M., the time of entire group of measurements can remain at approximately 5 s. Even after 4 P.M., when PAR decreases to 300 µmol·m
−2·s
−1, the measurement time for the entire group of can still be approximately 7 s. Therefore, this continuous observation system can decrease the uncertainty of fluorescence extraction caused by variation in illumination during the period of measurement.
Figure 9b is the rate of the maximum counts after optimizing the integration time to the saturated counts. Because the dark current is not deducted from the saturated counts in the process of optimizing the integration time, the practical counts are slightly larger than the expected value. During the entire measurement, the rate shown in
Figure 9b is stable between 0.81 and 0.84. Therefore, the effect of this integration time optimization method is good. However, the sustained time of optimizing the integration time is far less than the iterative optimizing integration time method proposed by Cogliati
et al. [
6].
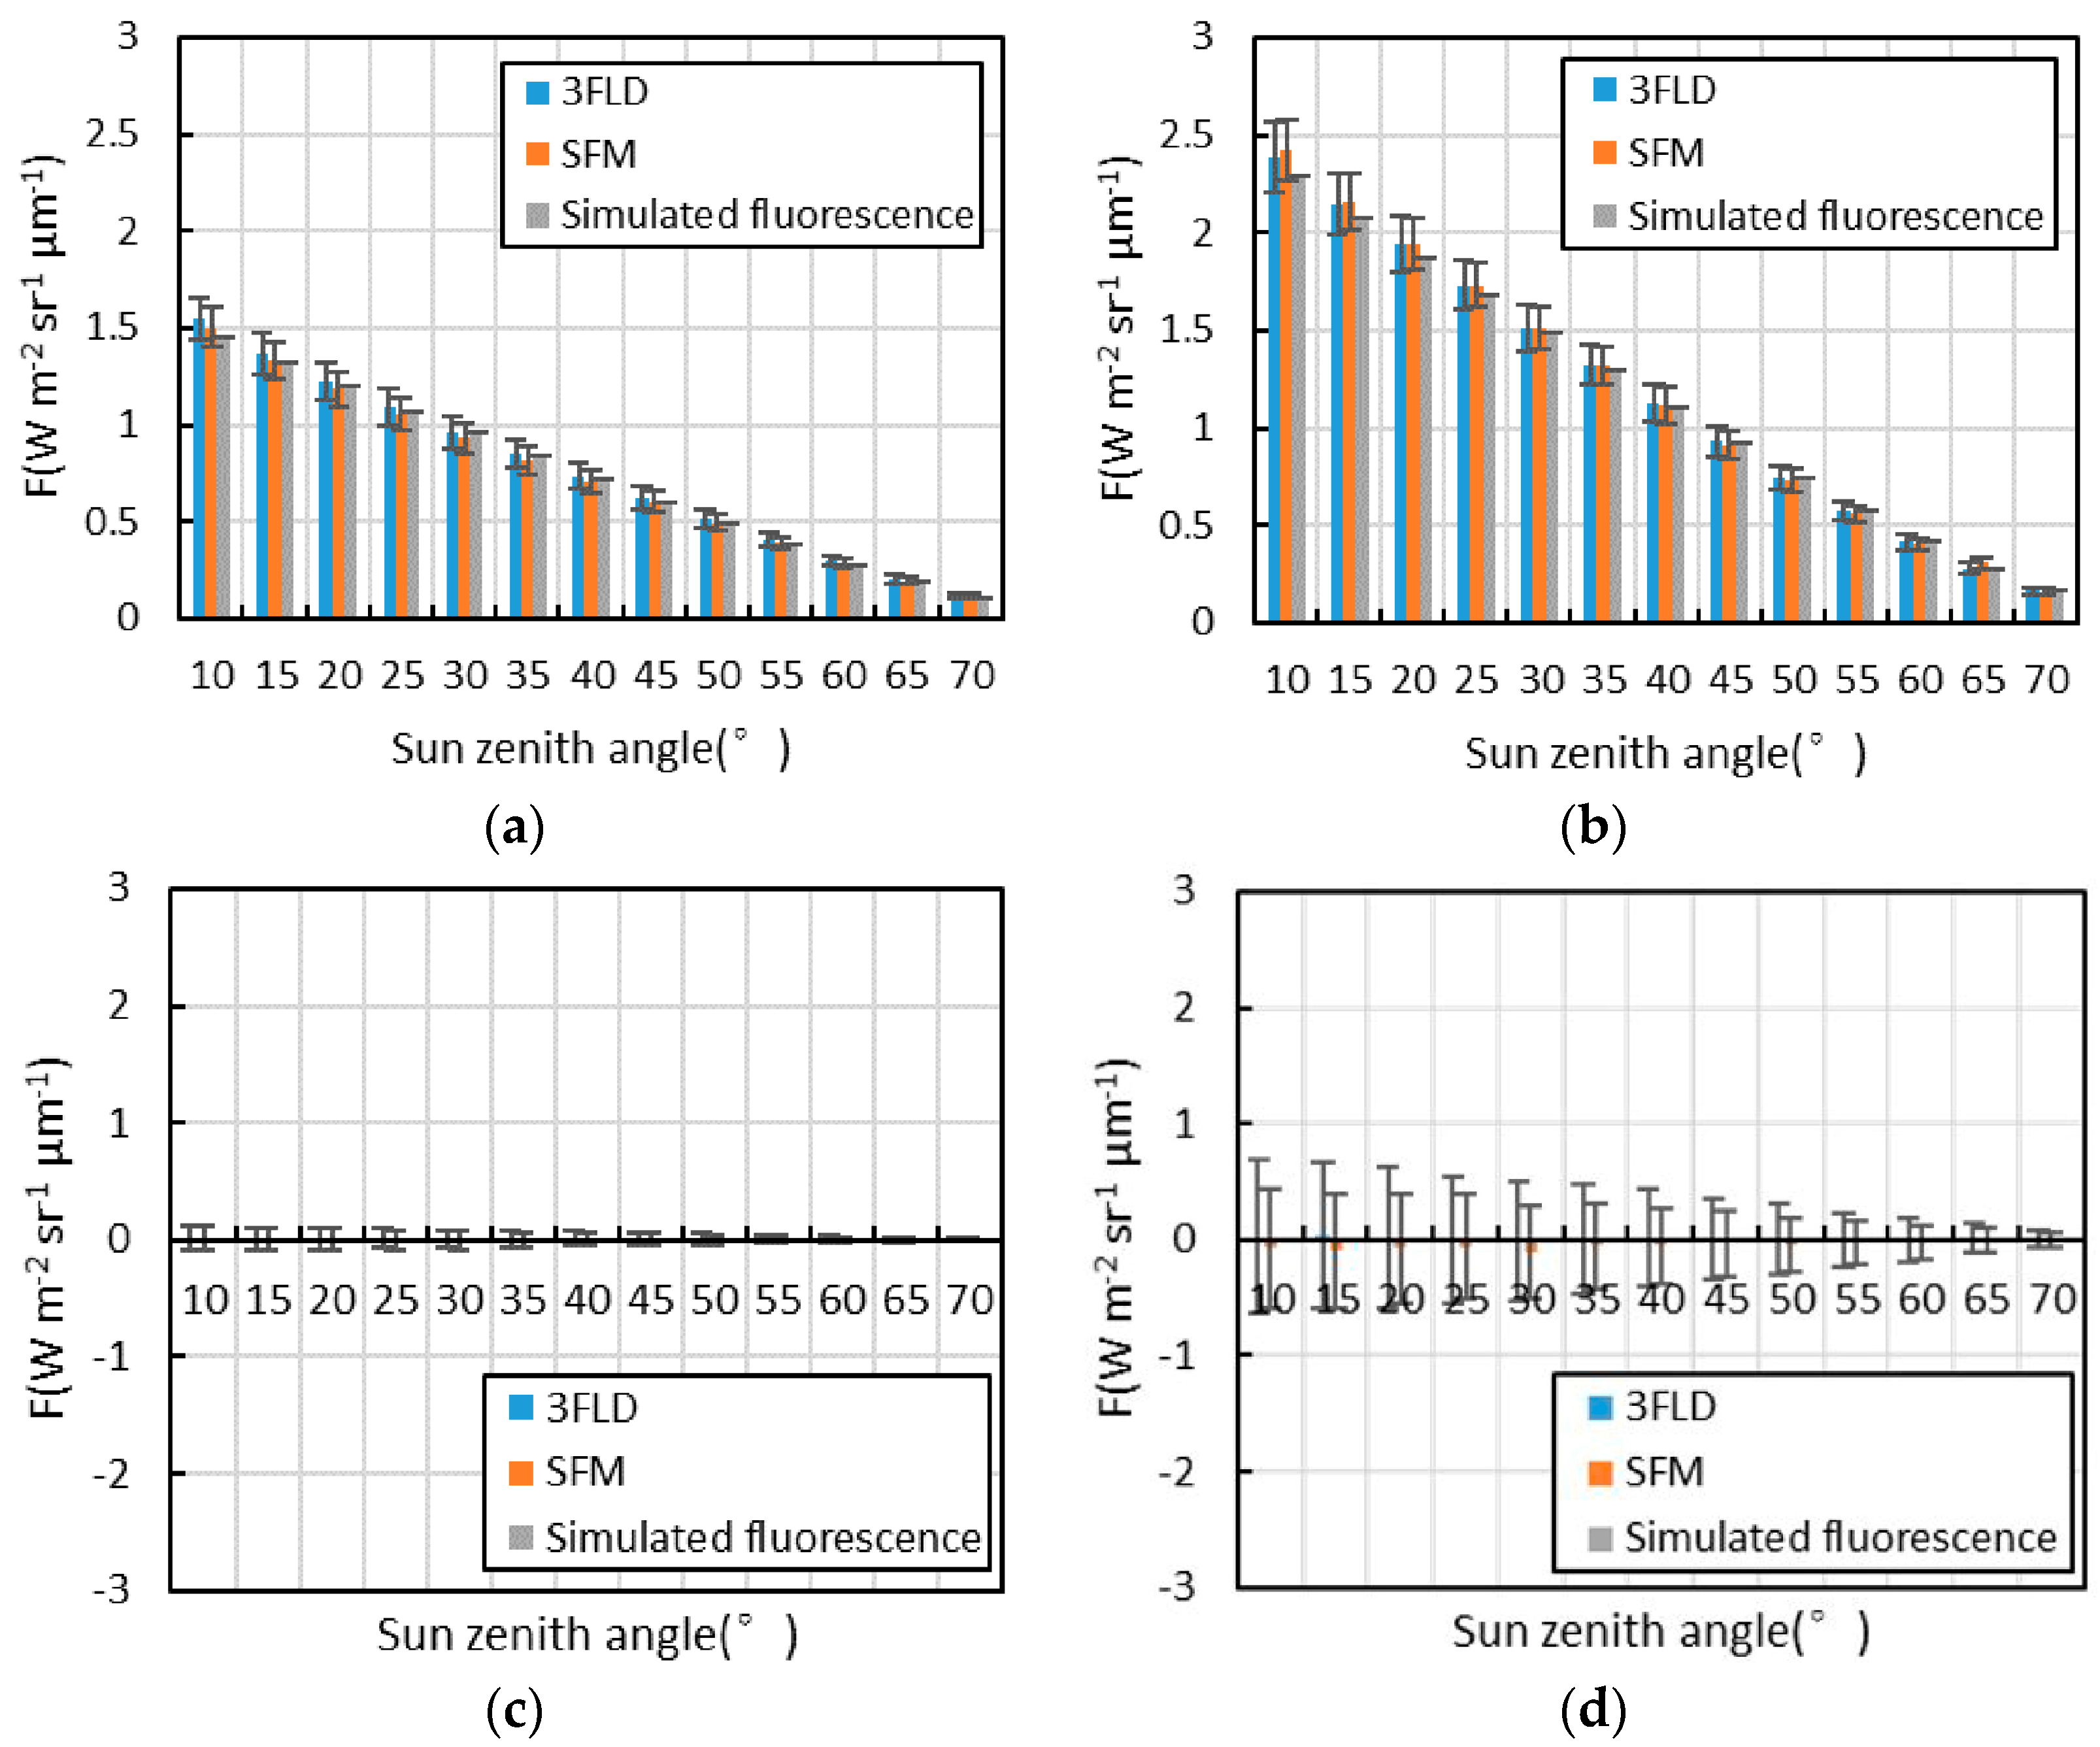
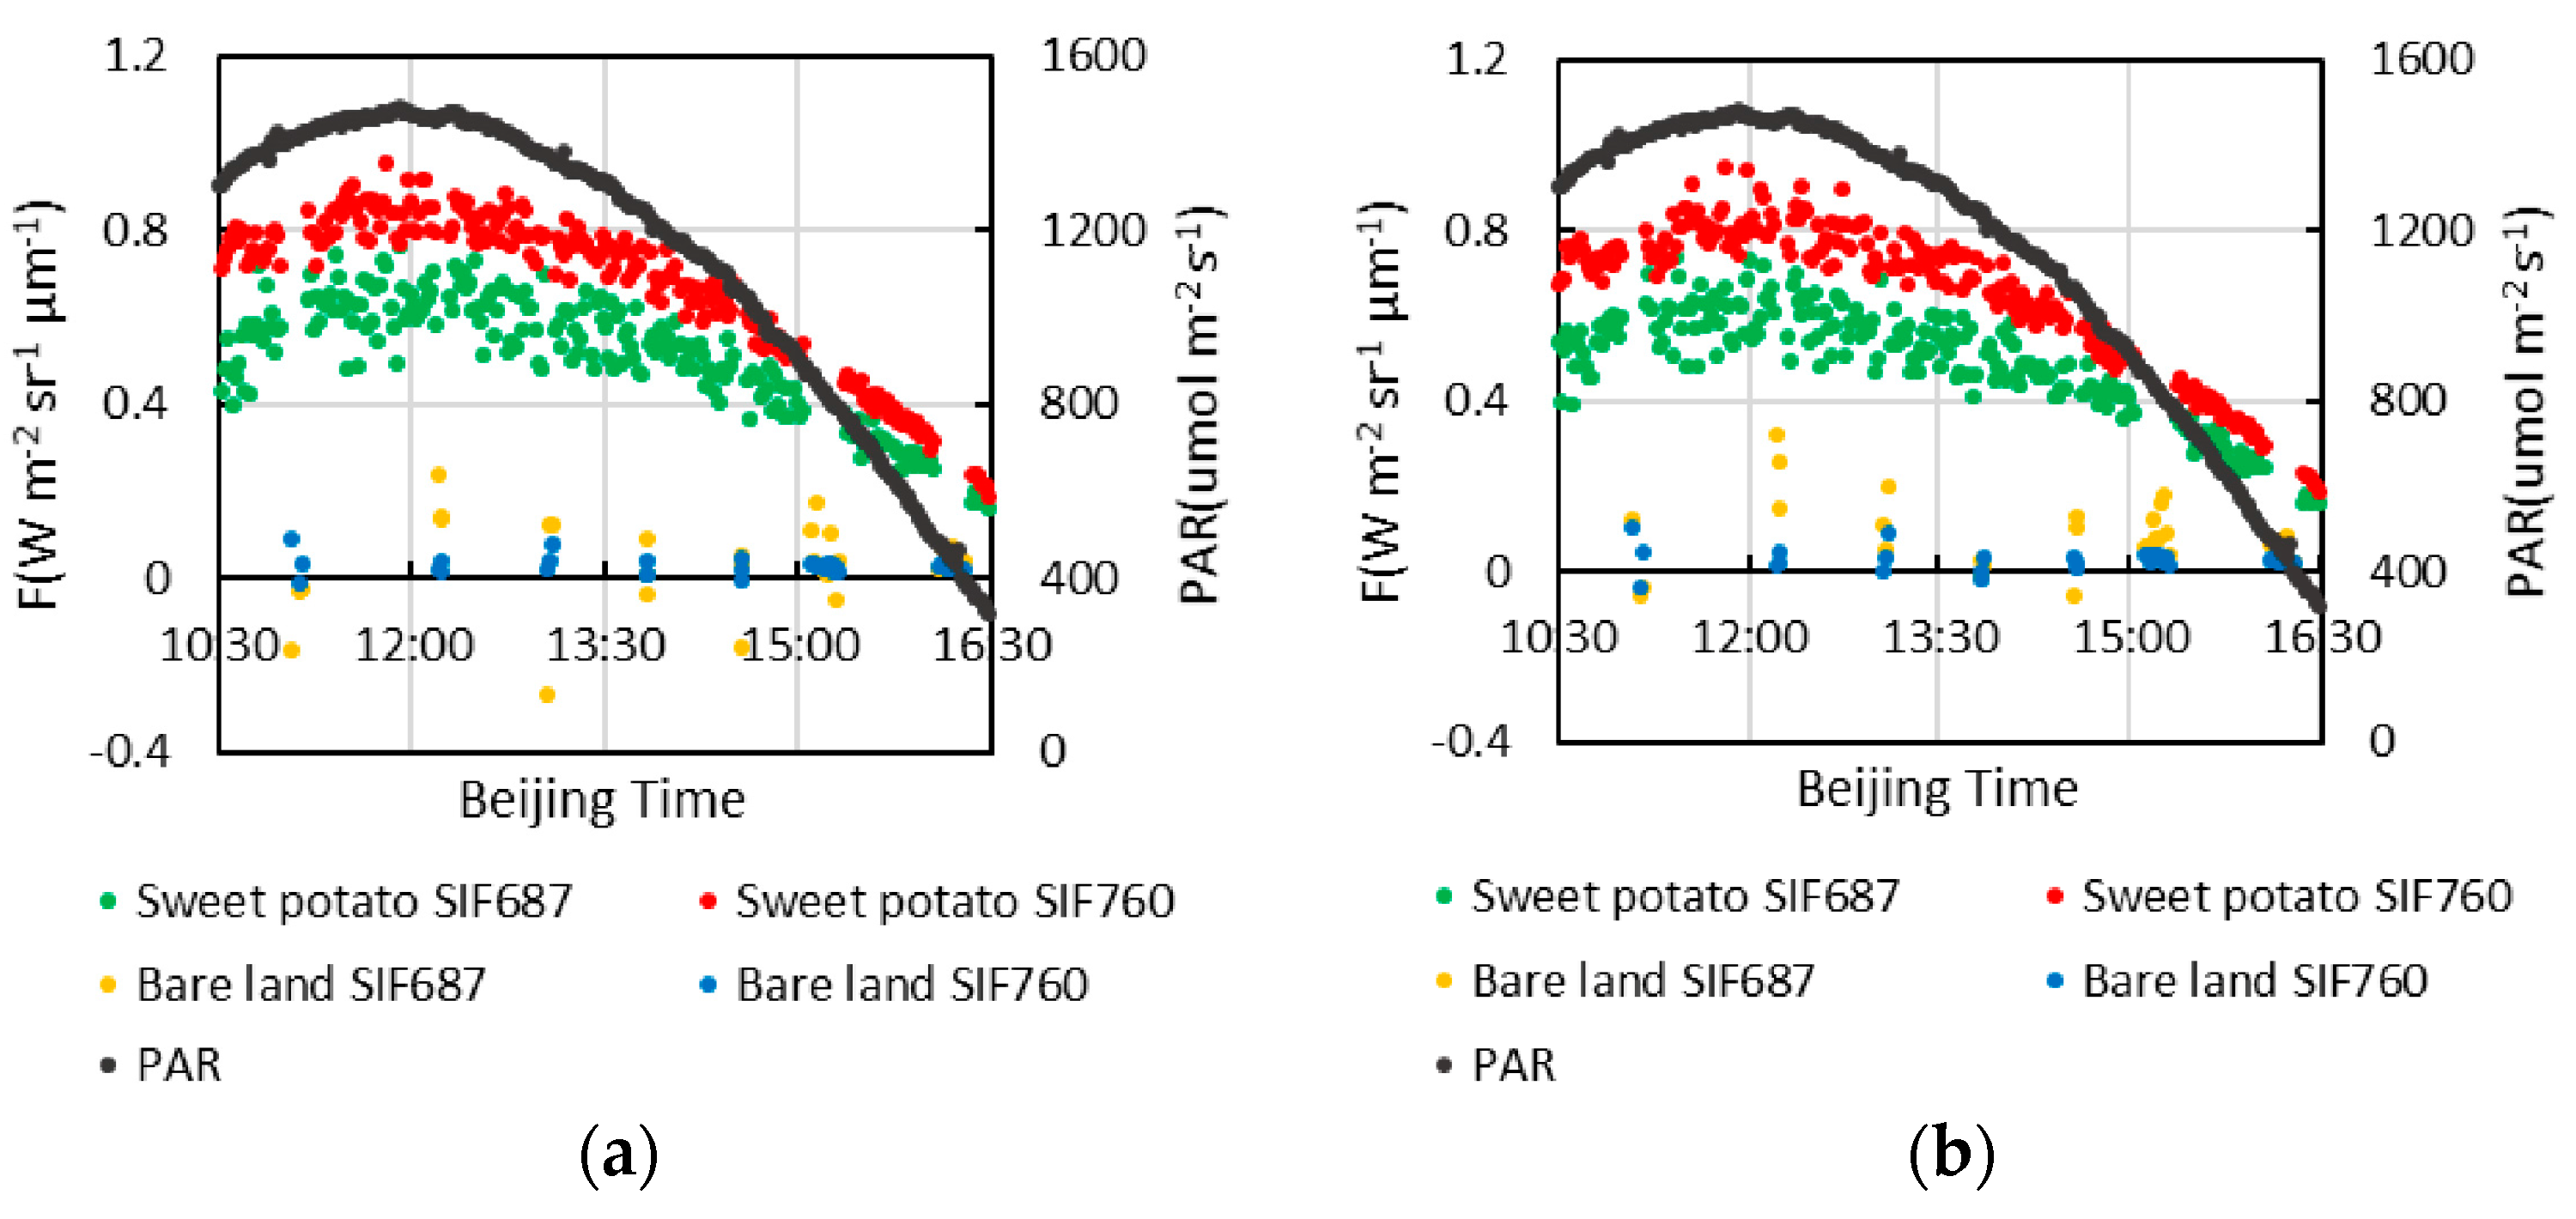
The SIF values at 687 nm and 760 nm (SIF687 and SIF760) of the sweet potato canopy and bare land extracted by 3FLD and by SFM and the diurnal variation curve of PAR are shown in
Figure 10a,b. The fluorescence extraction results of these two algorithms are essentially the same, and the trend of the daily variation in SIF687 and SIF760 is basically the same as that of PAR. The value of SIF687 is smaller than that of SIF760, the size relationship of which is related to some factor such as the chlorophyll concentration, photosynthetic capacity or stress state [
4]. The fluctuation in the diurnal variation curve of SIF687 and SIF760 results from environmental factors (e.g., rapid change in light, change in wind speed) or a change in physiology or noise. With the decrease in PAR, the fluctuation range of the diurnal variation curve of SIF also decreases gradually. Because the depth of the O
2-B absorption band is much smaller than that of the O
2-A absorption band, the fluorescence extracted in the O
2-B absorption band is strongly affected by noise [
16], which results in a relatively large fluctuation in the fluorescence extraction value. The SIF of bare land is much smaller than that of sweet potato in the same time period and is close to 0. Thus, the value extracted by this observation system is fluorescence rather than noise. However, the fluctuation in the SIF687 of bare land is much larger than that of SIF760, which is also related to the smaller depth of the O
2-B absorption band. Moreover, the fluctuation in the SIF687 of bare land is much larger than that of vegetation, which is related to the fact that the noise of the bare land spectrum at this wavelength is larger than that of the vegetation spectrum according to Equations (3) and (4). Although the noise of the bare land spectrum in the O
2-A absorption band is also very large, the depth of the O
2-A absorption band is much larger than that of the O
2-B absorption band. The influence of the noise to fluorescence value is therefore small, which results in the SIF760 fluctuation of bare land being relatively small. These results are essentially the same as those based on the simulated data, and the daily variation in SIF760 obtained by this observation system is essentially consistent with previous studies based on other continuous observation systems [
6,
7]. Therefore, the SIF extraction effect of this observation system is good. In addition, due to the high SNR and spectral resolution of the QE65pro spectrometer, this observation system can obtain SIF687 more accurately in comparison with other observation system. Previous studies have shown that the red to far-red F ratio is sensitive to stress and that it is beneficial to simultaneously collect red and the far-red F measurements [
4,
11]. In addition, this observation system can realize contrast observation of multiple targets, such as multiple vegetation in different stress states, which is conducive for analysing the change characteristics of fluorescence under stress.
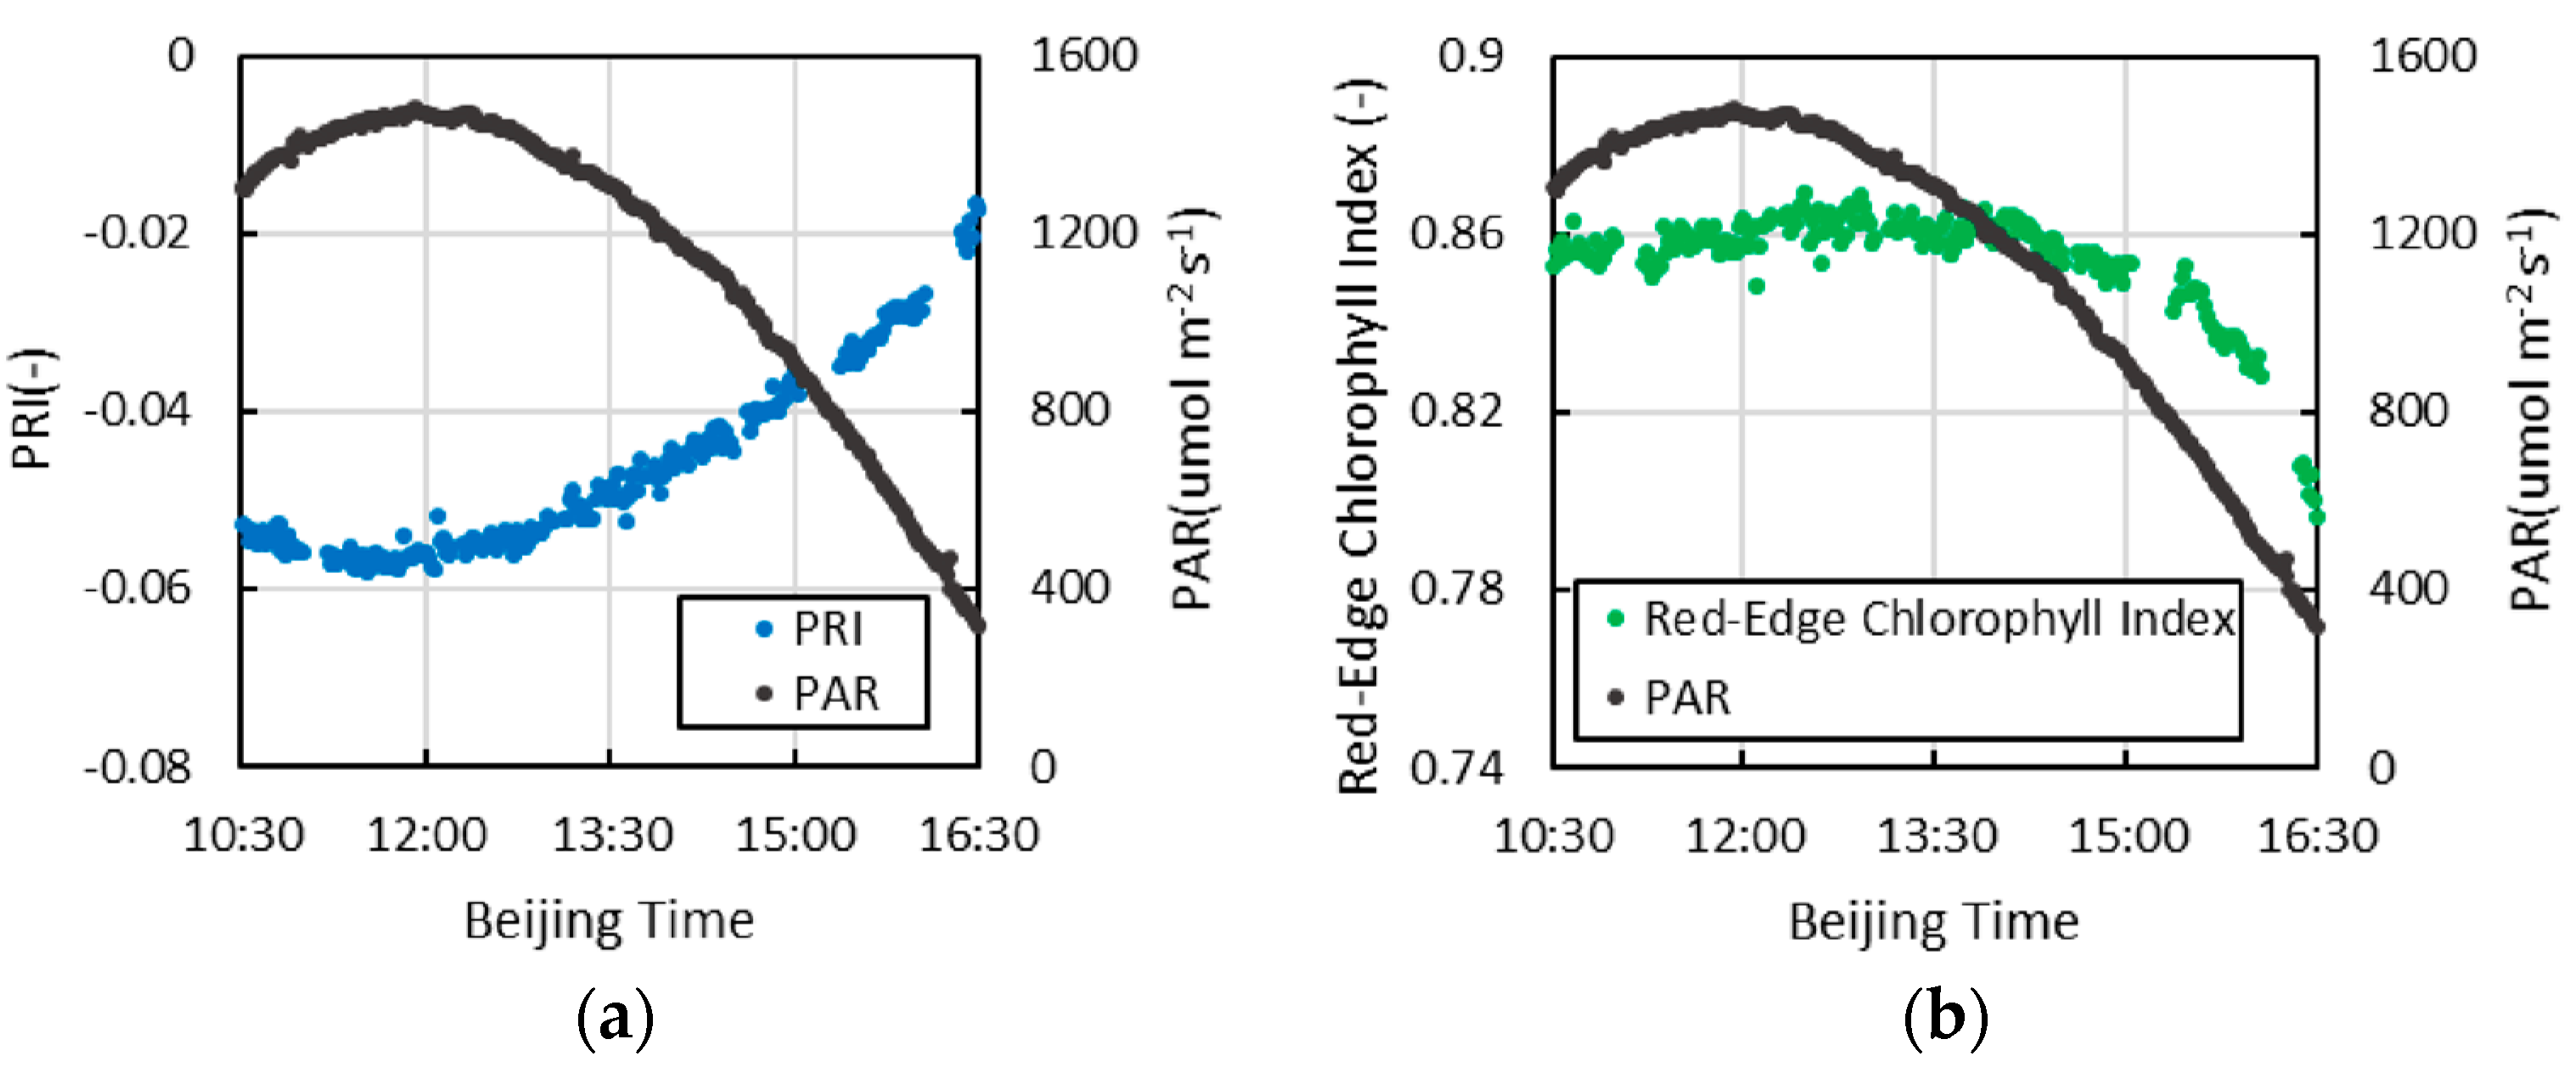
The diurnal variation in the Red-Edge Chlorophyll Index and PRI of sweet potato is shown in
Figure 11. The former at local solar noon is not very large, only approximately 1%, but begins to accelerate markedly after 14:00. Moreover, the diurnal variation of PRI is relatively large at local solar noon compared to that of the Red-Edge Chlorophyll Index, with a variation trend that is opposite to that of SIF.
In the short term, the PRI value is linked to the xanthophyll cycle of the photo-protection mechanism at the leaf scale, which can reflect the state of photosynthesis [
4]. Although the Red-Edge Chlorophyll Index is similar to the NDVI, it shows a linear relationship with the chlorophyll content and no saturation effect [
21]. As the chlorophyll content often decreases under stress, the synchronous measurement of the SIF and vegetation index is very meaningful for researching the stress responses of vegetation.


