
A Radio-Map Automatic Construction Algorithm Based on Crowdsourcing


Abstract
:
1. Introduction
- (1)
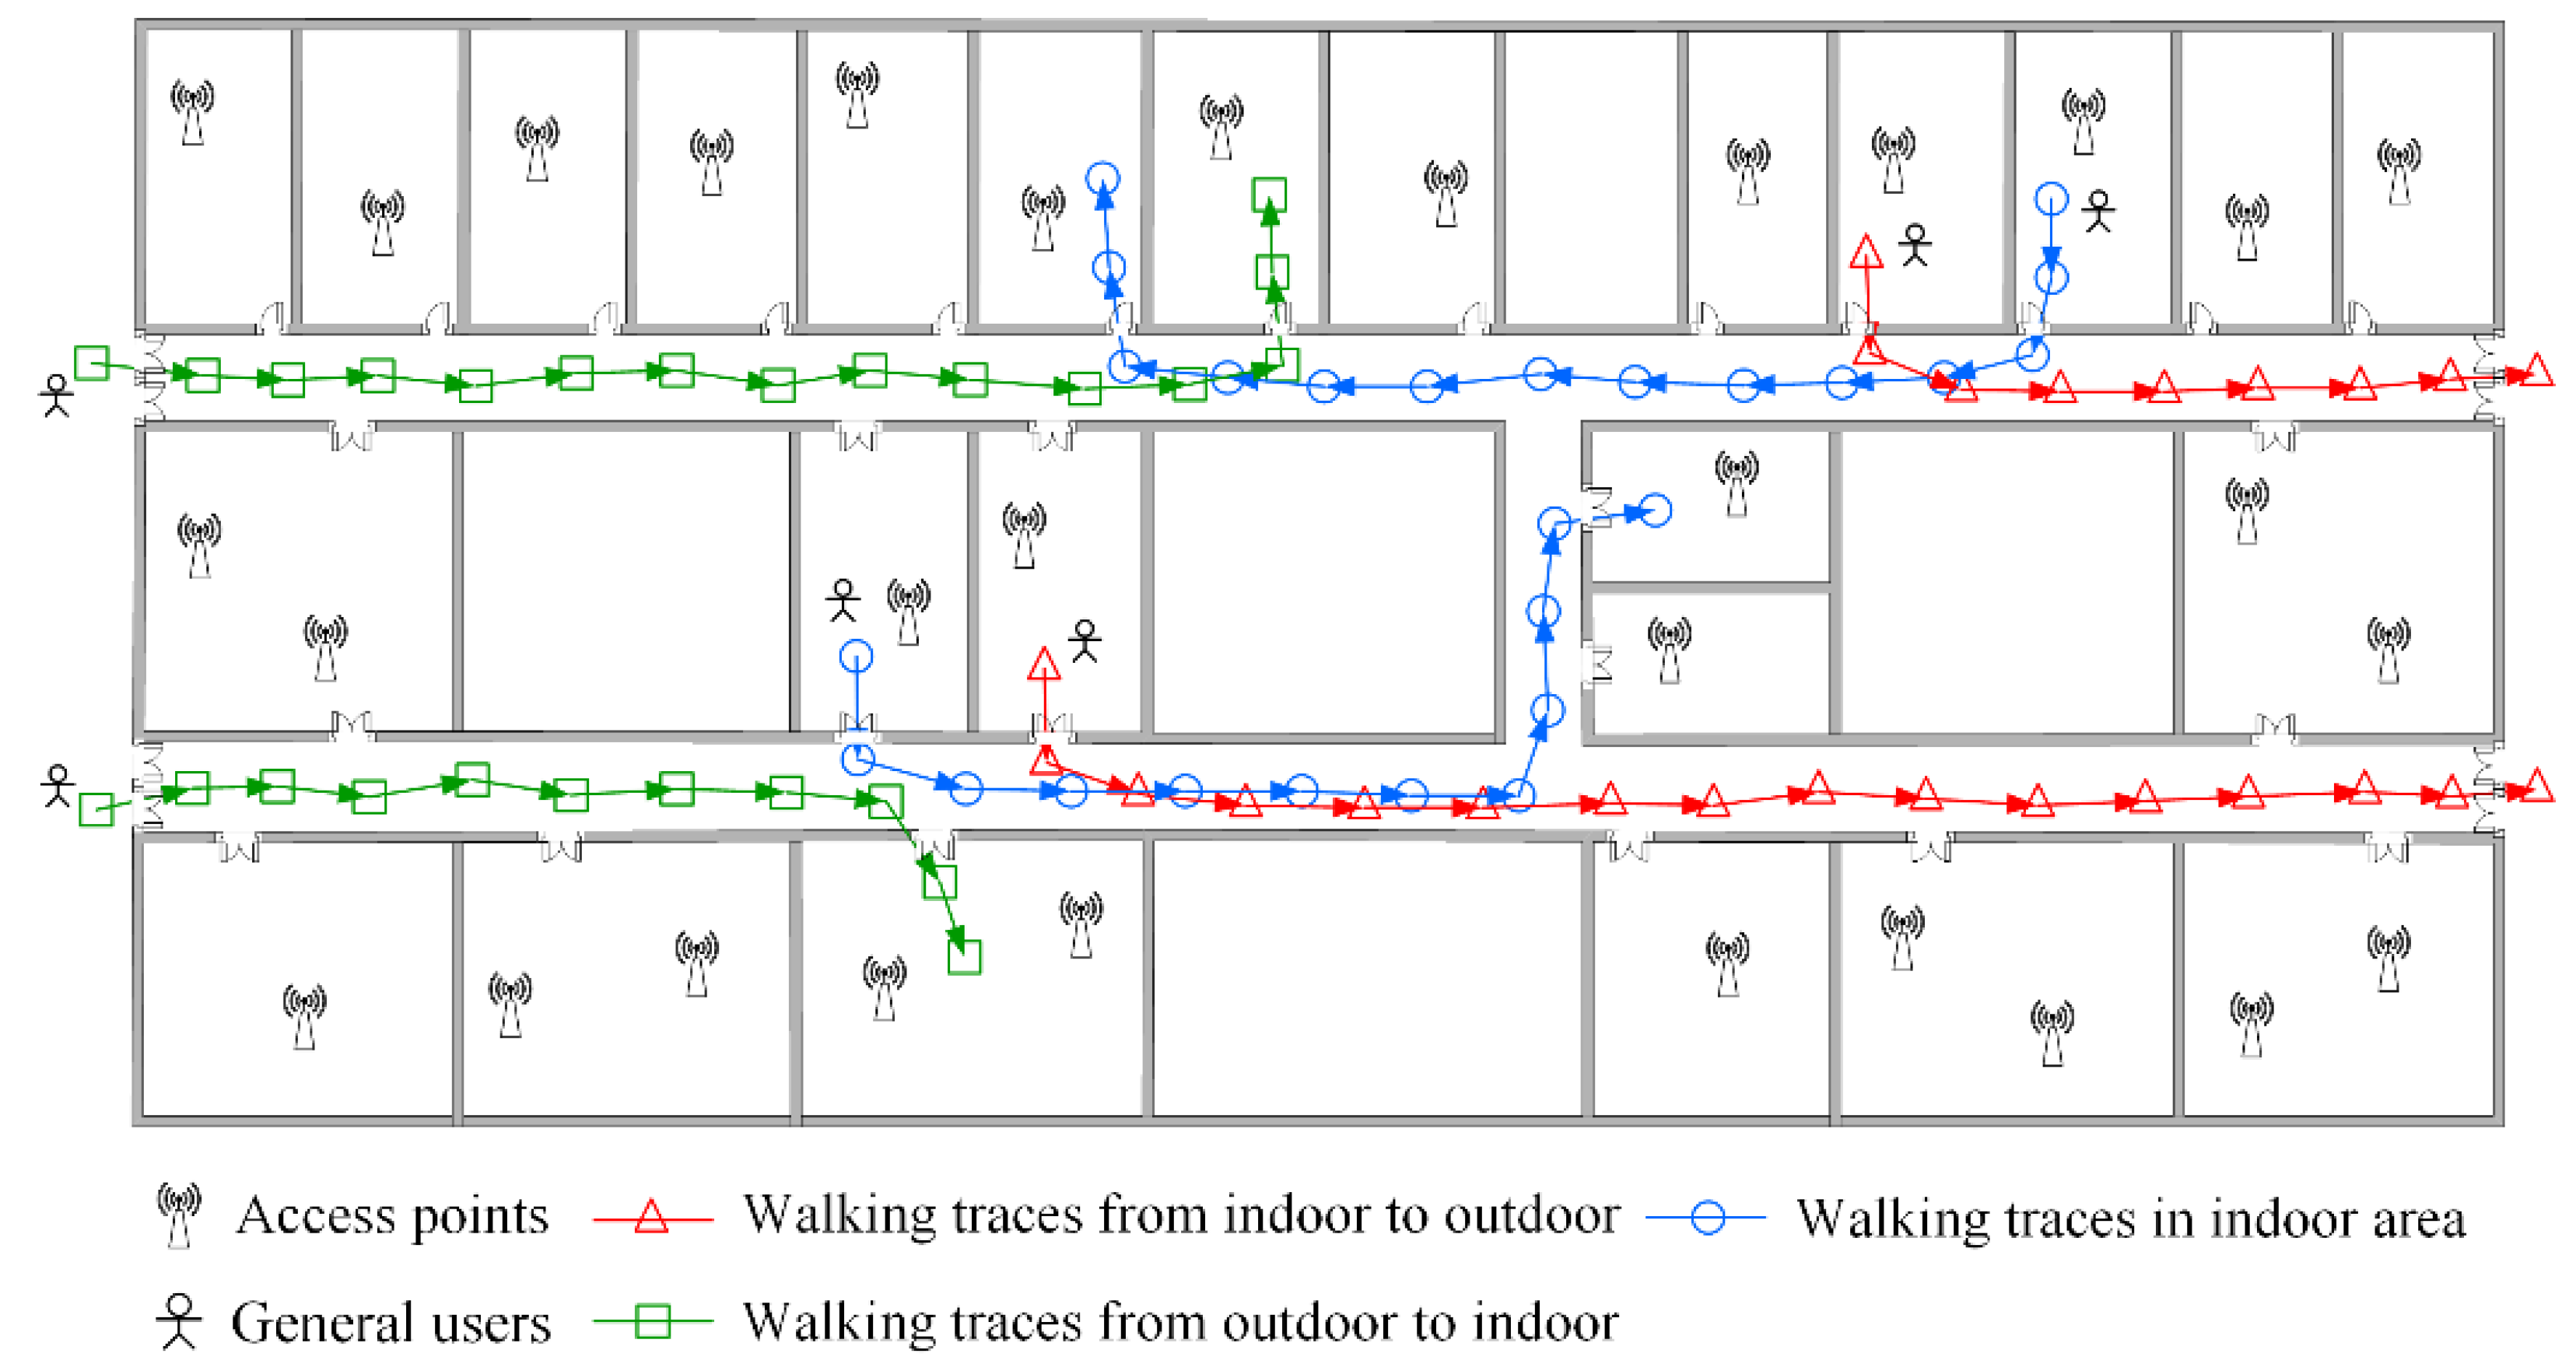
- Data is collected by exploiting crowdsourcing technologies. The daily activities of users are represented by their walkable mobile phone path in the indoor building. The WiFi location information that a user has passed by, user’s walking acceleration, walking direction and rotational angular velocity are recorded by phones automatically. The recorded data provided by a large number of users are named crowdsourced data.
- (2)
- Through the variation characteristics of users’ smartphone sensors, the indoor anchors (doors) are identified and their locations are regarded as reference positions of the radio-map. The crowdsourced data are clustered to acquire the representative fingerprints. According to the reference positions and the similarity between fingerprints, the representative fingerprints are linked to their corresponding physical locations and the radio-map is generated.
- (3)
- Online localization is realized based on the constructed radio-map. Extensive simulations show that RACC can automatically generate radio-maps with acceptable accuracy and efficiently solve the resource-consuming problem in traditional radio-map-based indoor localization methods.
2. Related Works
2.1. Offline Fingerprinting-Based Localization
2.2. Offline Fingerprinting-Free Localization
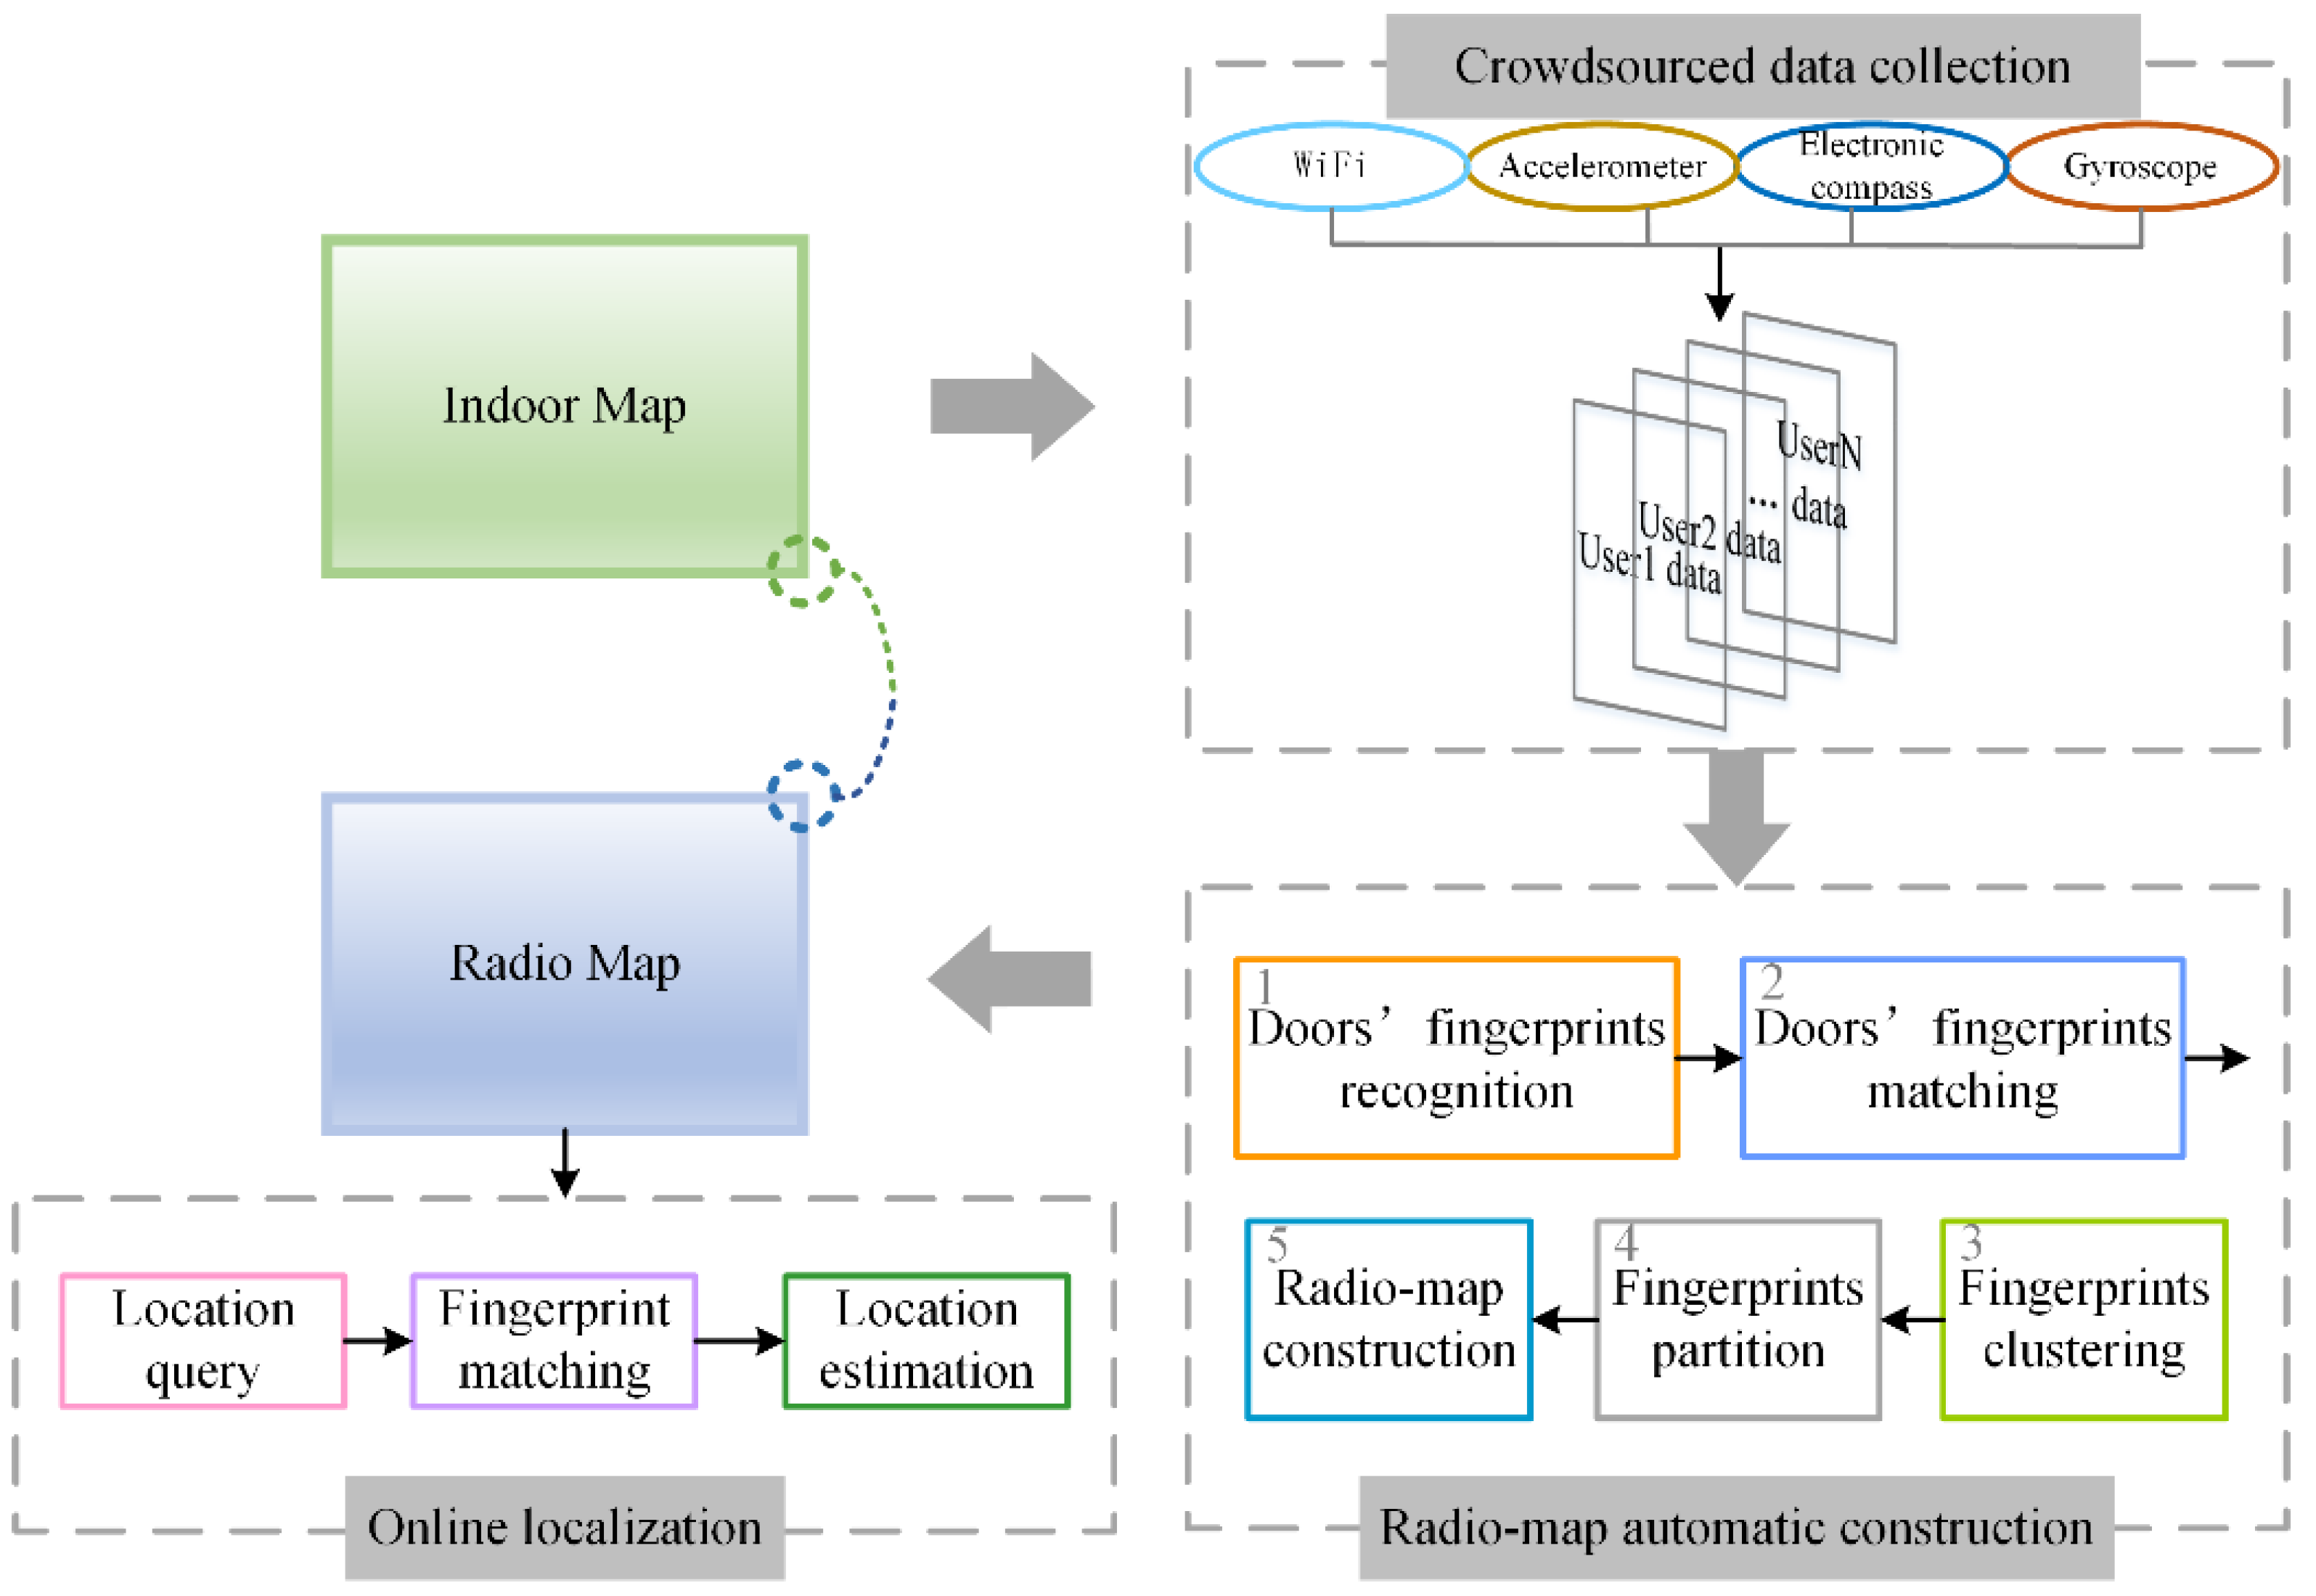
3. Methodology & System Architecture
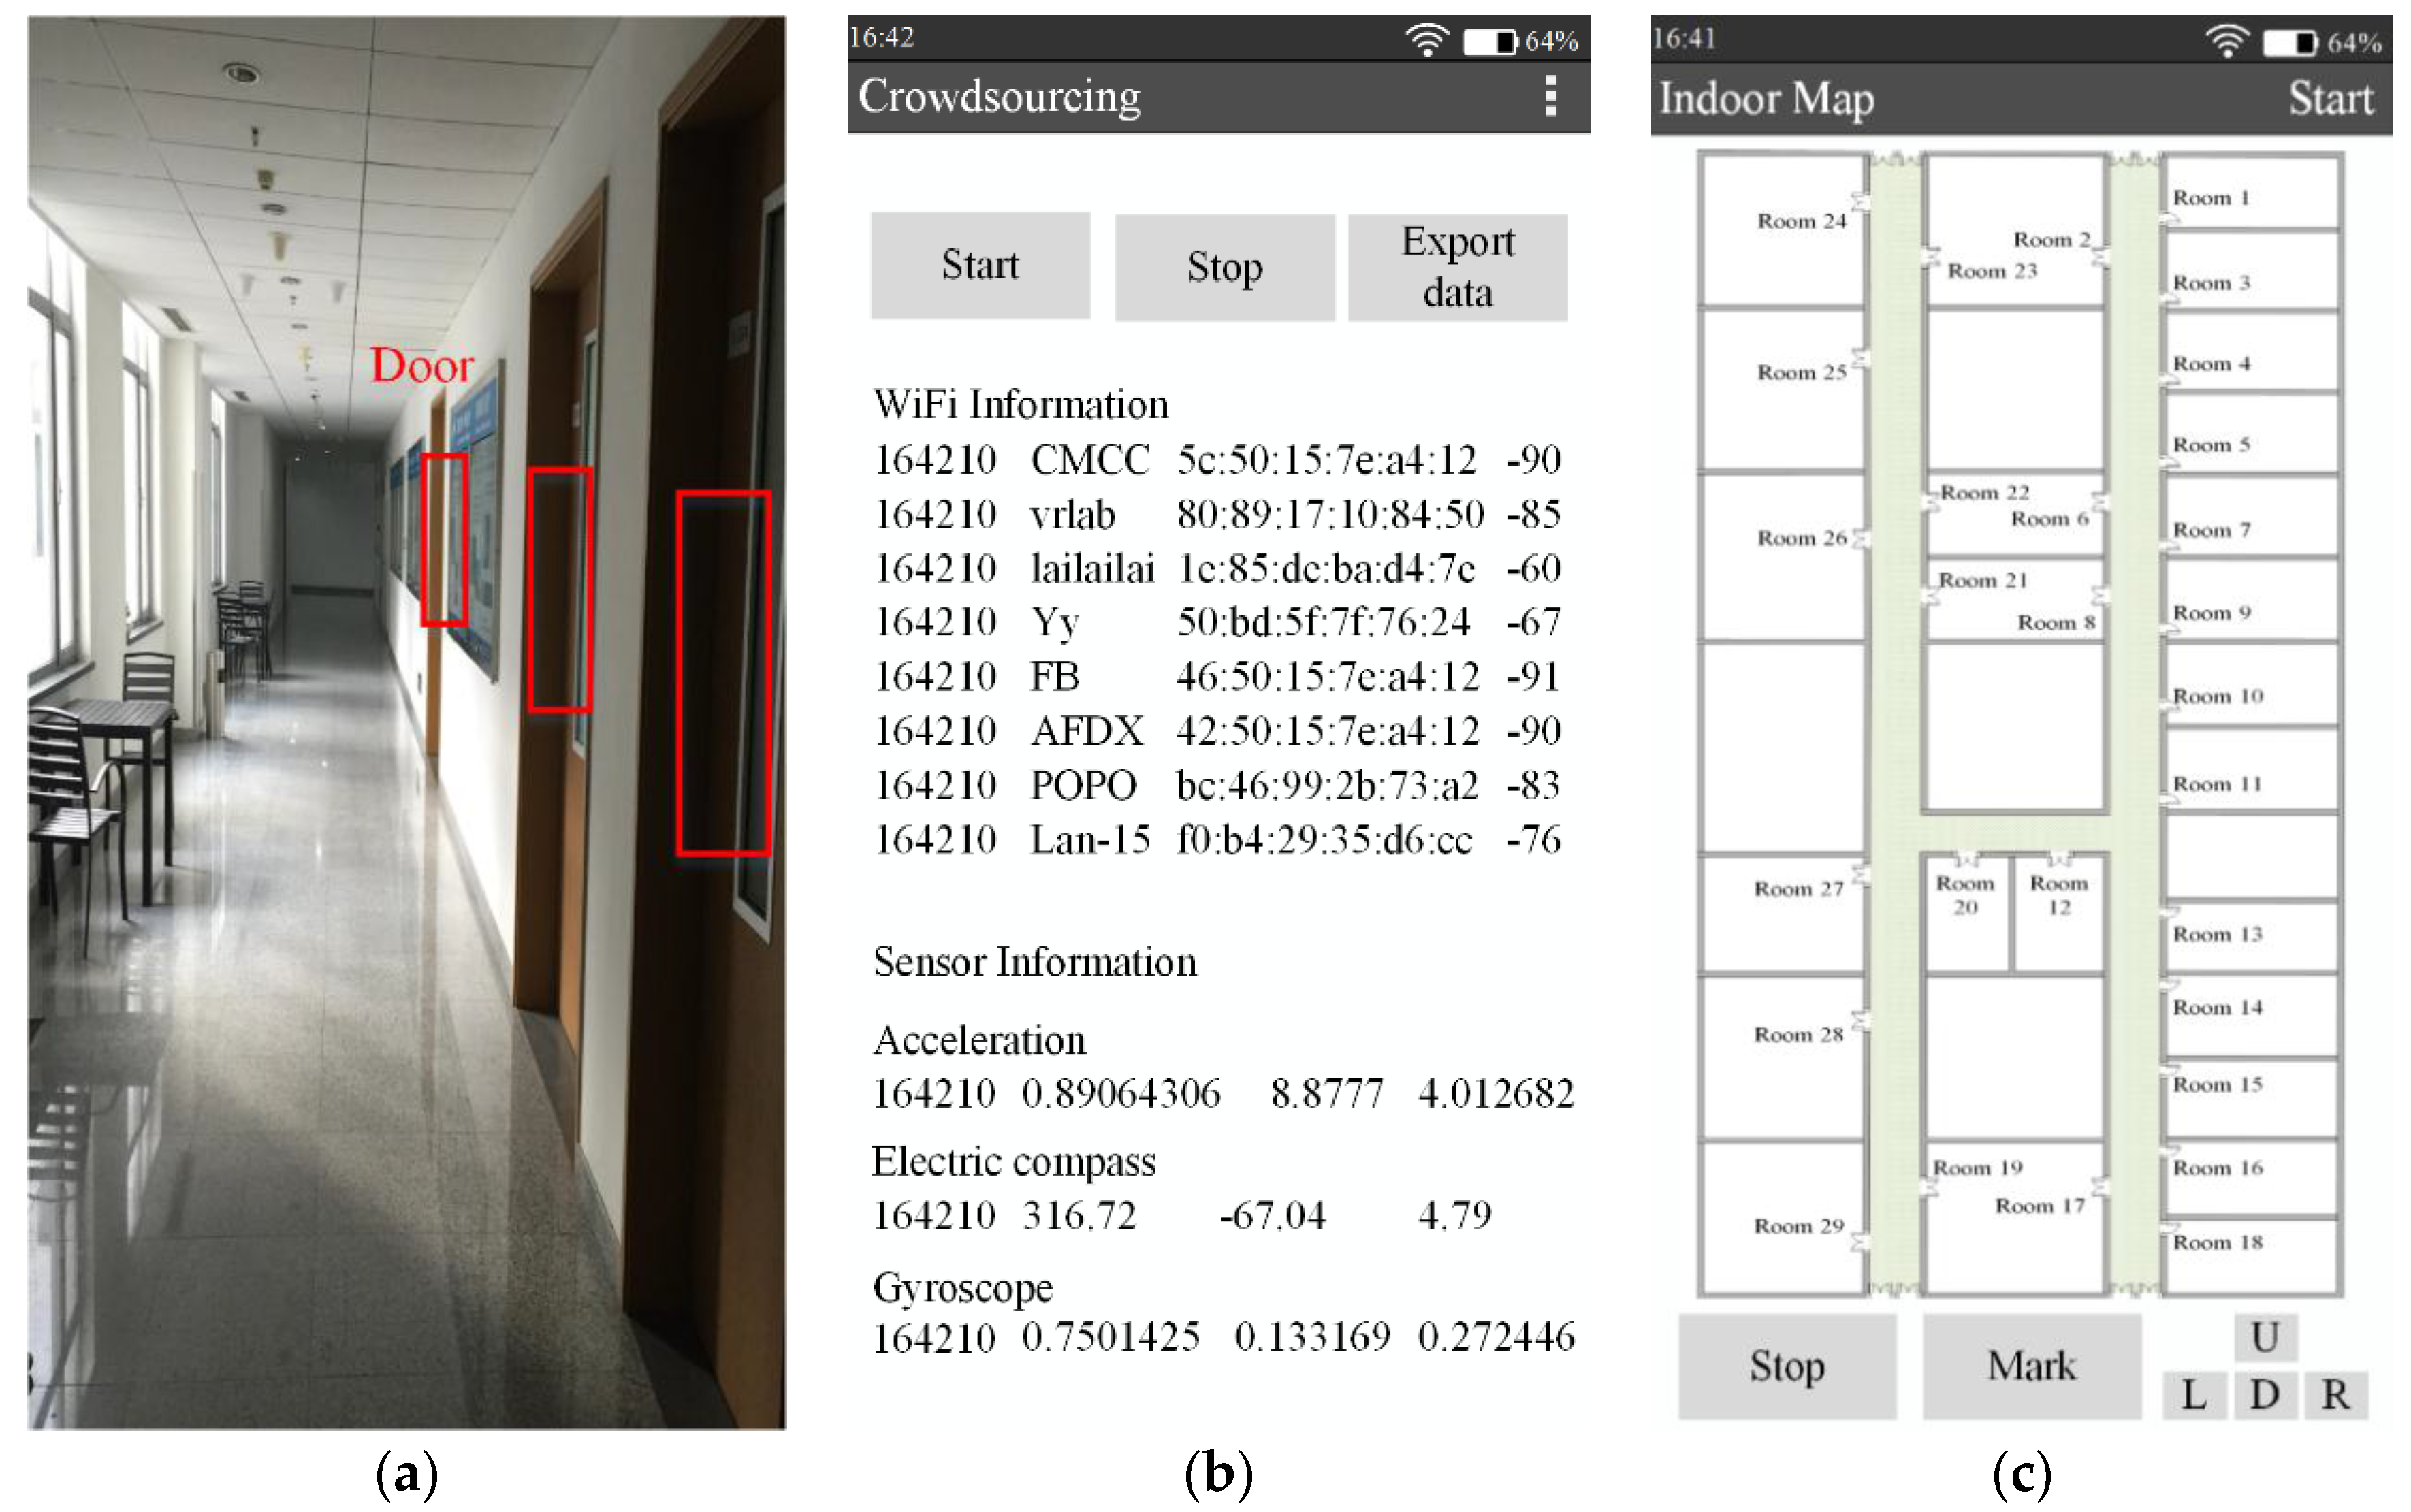
3.1. Crowdsourced Data Collection
- (1)
- User ID. Every user has an unique ID, which is utilized to identify the crowdsourced data provided by different users.
- (2)
- RSS fingerprint. RSS fingerprint includes the MAC addresses of APs {ap1,ap2,…}ti and their corresponding RSS values{rssi1,rssi2,…}.
- (3)
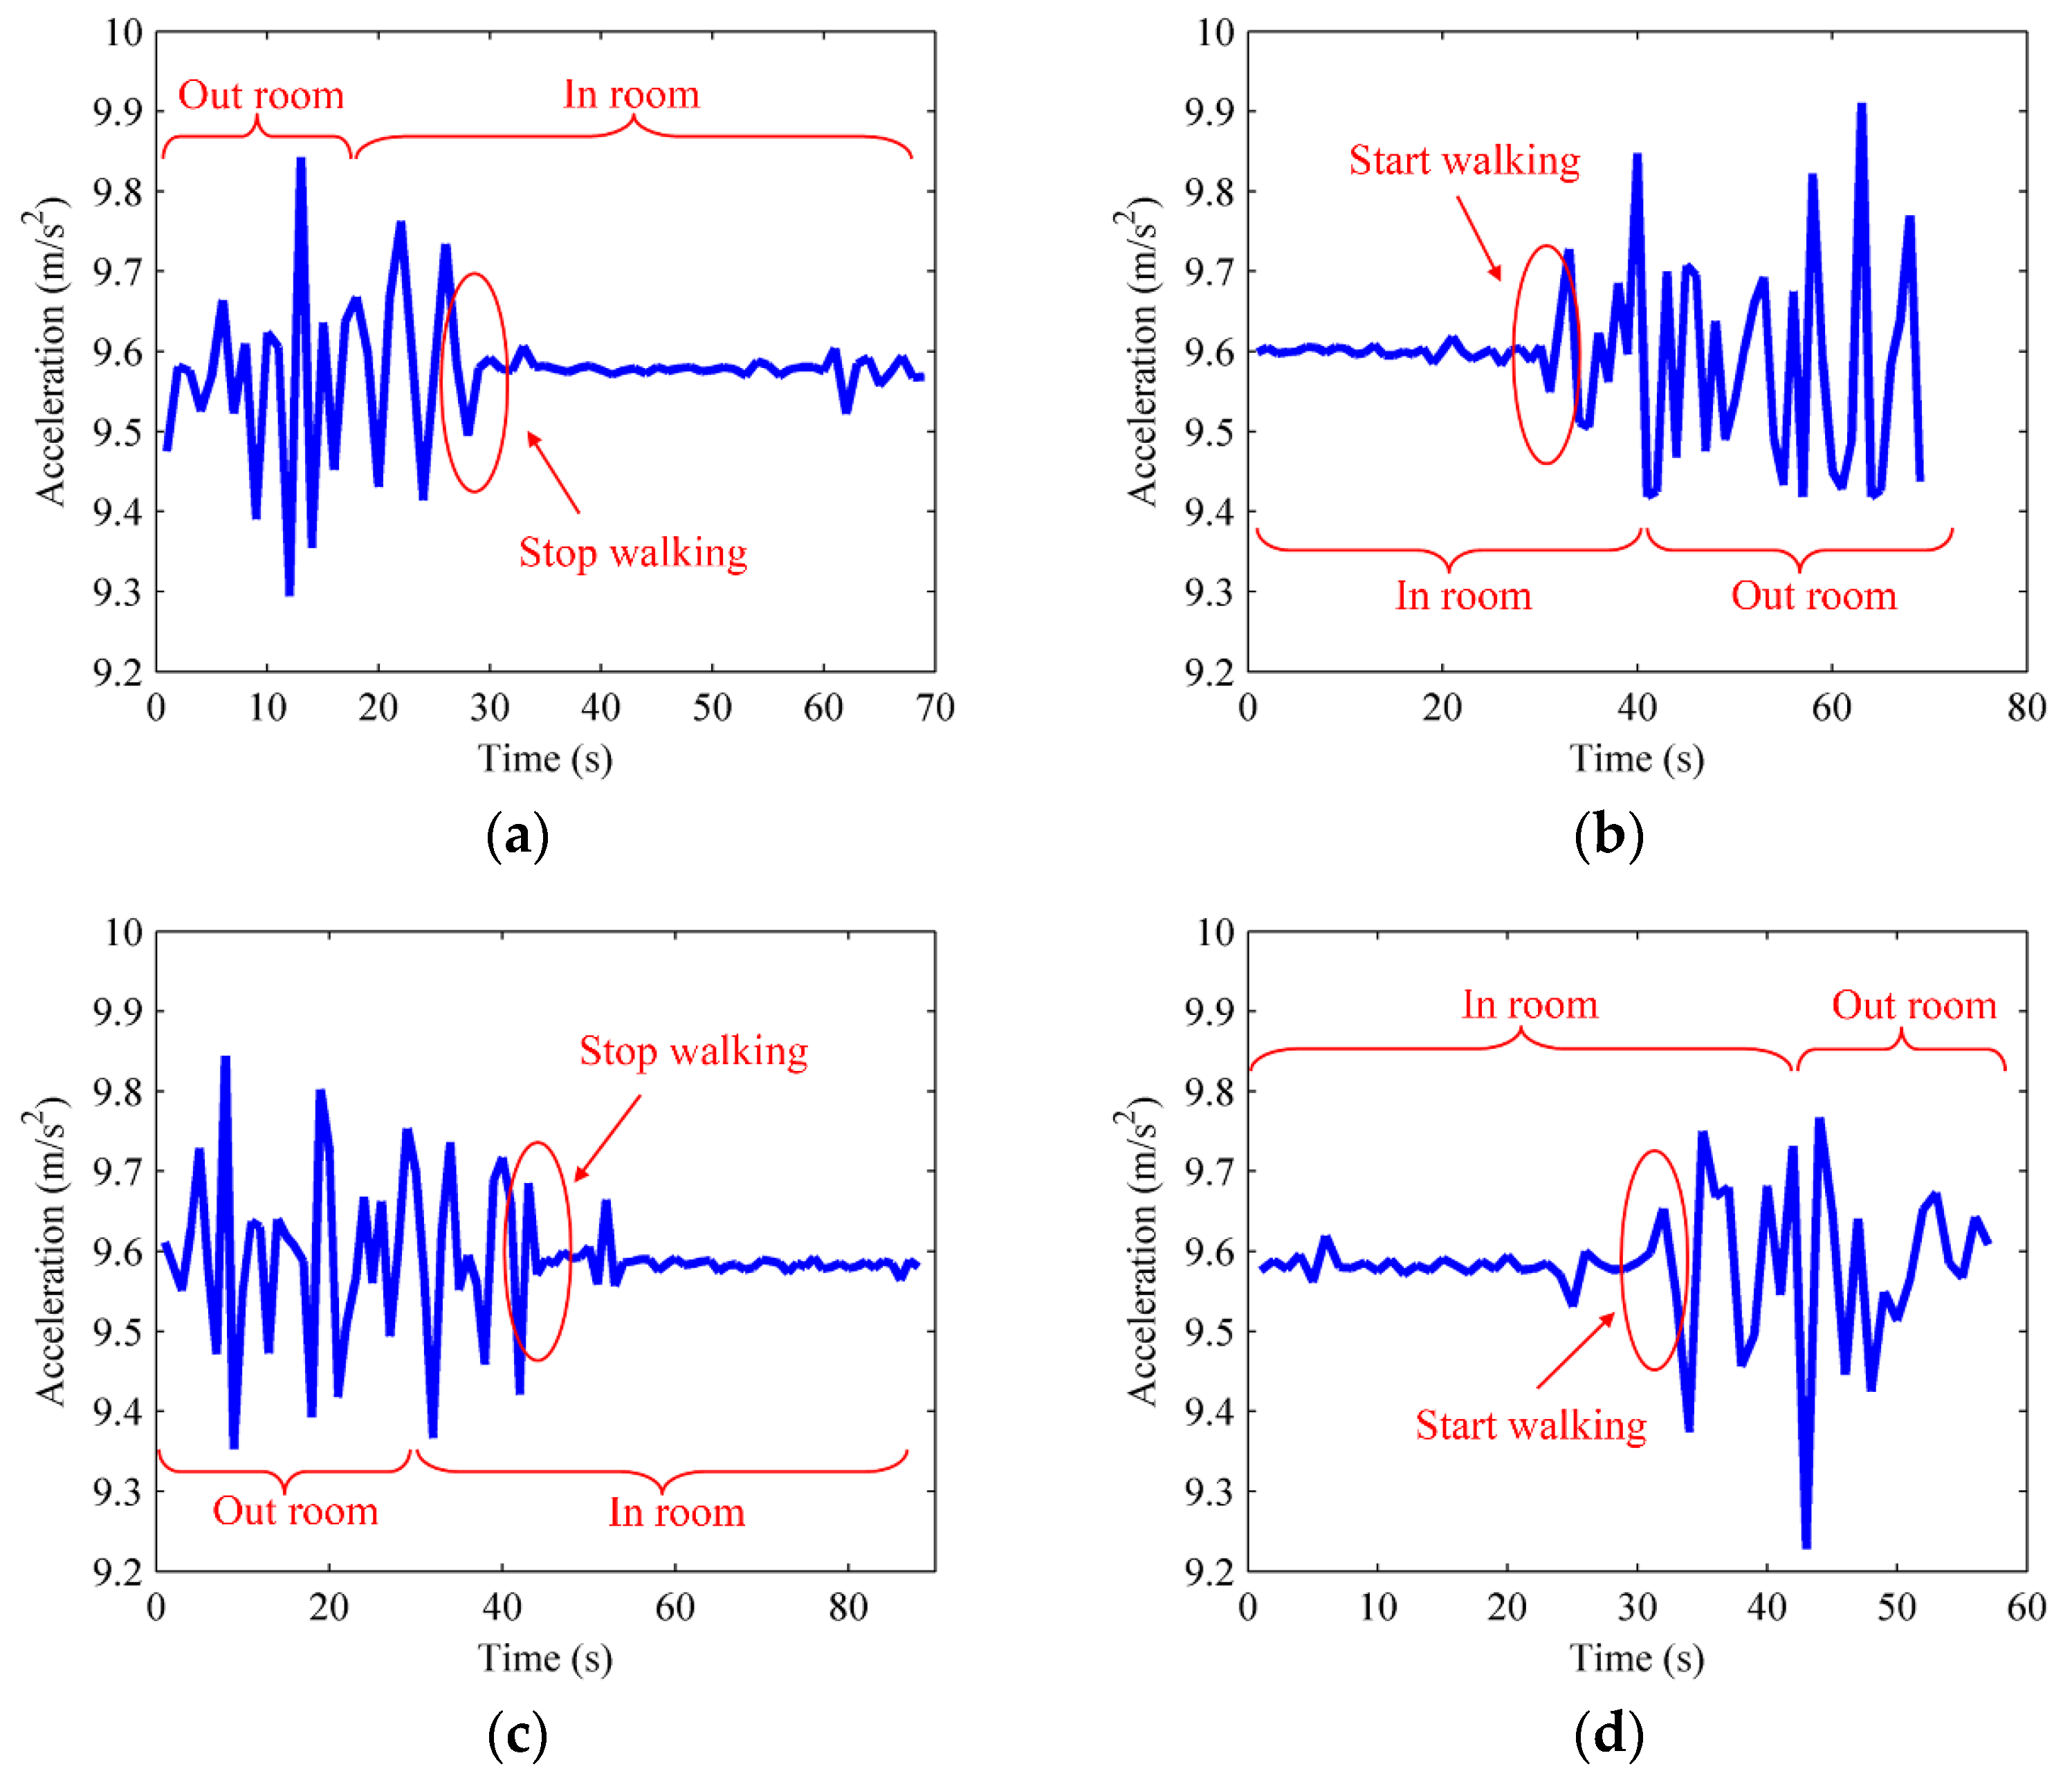
- Walking acceleration. User’s walking acceleration acc = {accX,accY,accZ} is measured by an acceleration sensor, where accX, accY and accZ are respectively the acceleration components in the X, Y and Z direction.
- (4)
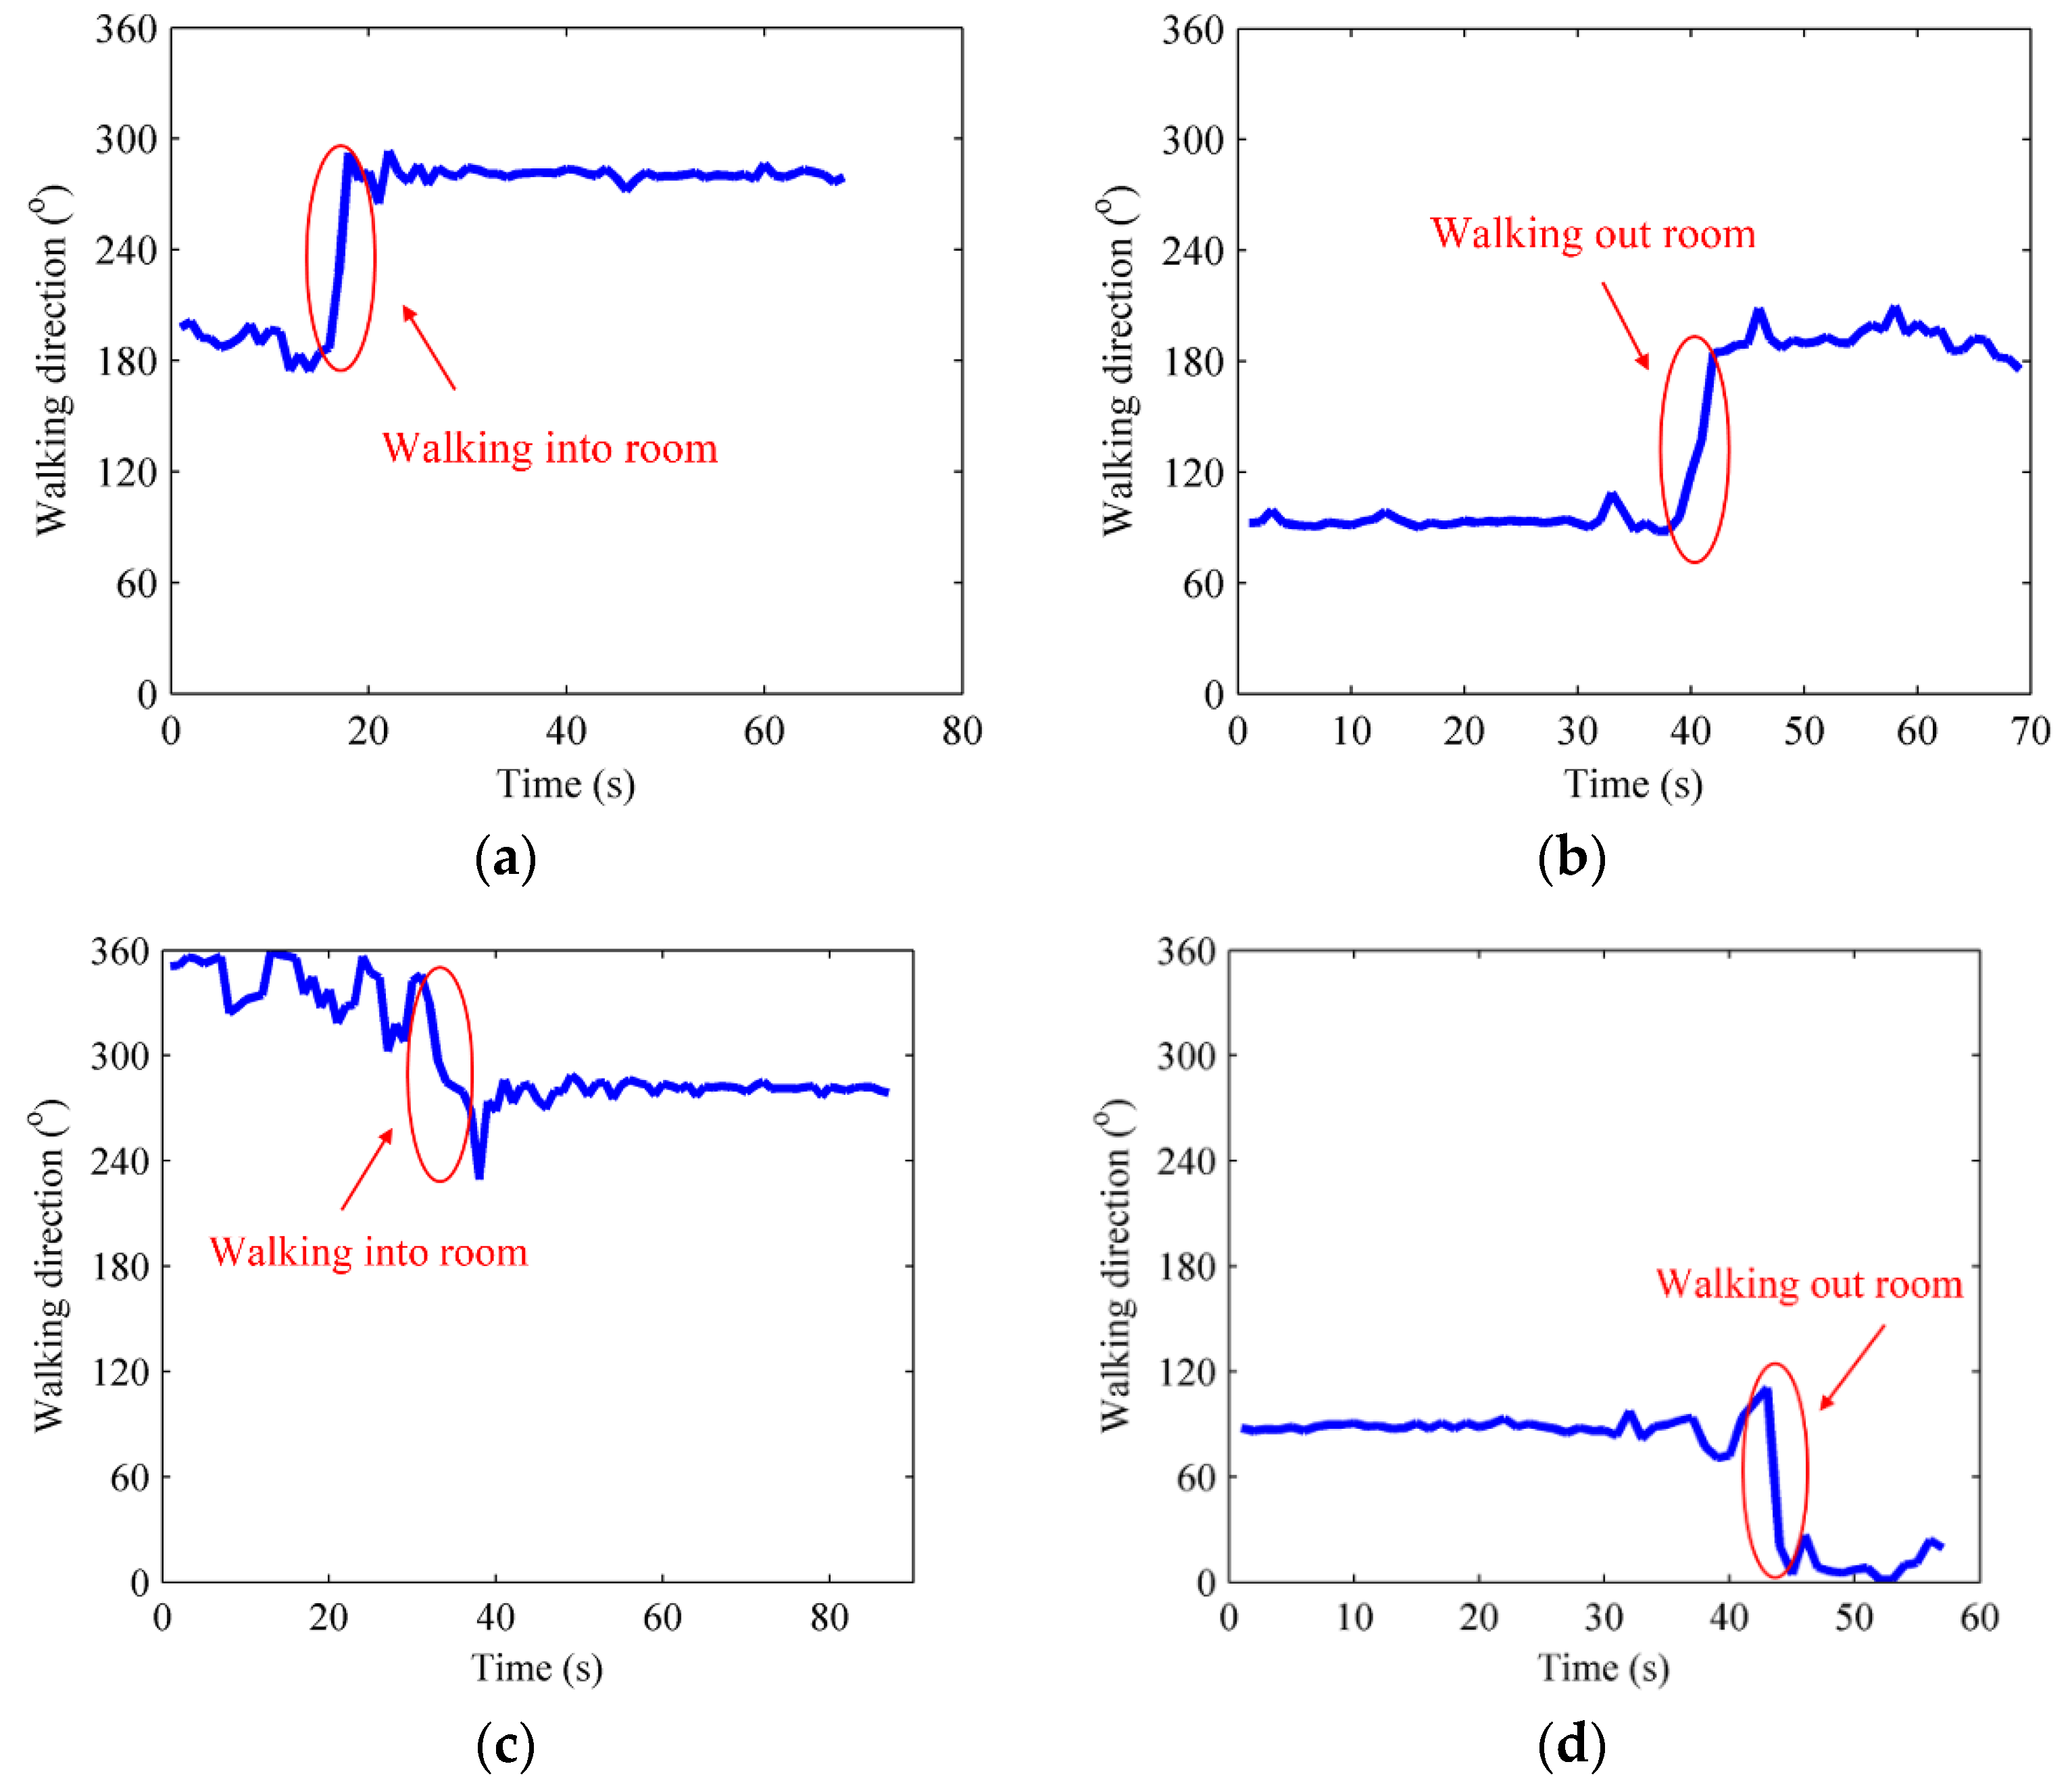
- Walking direction. The embedded electronic compass of smartphone measures three components: the angle relative to the magnetic north, the angle between x-axis orientation of smartphones and the horizontal plane, the angle between y-axis orientation of smartphones and the horizontal plane. On account of different placement of smartphones when users are moving, only the angle relative to the magnetic north is recorded into the crowdsourced data.
- (5)
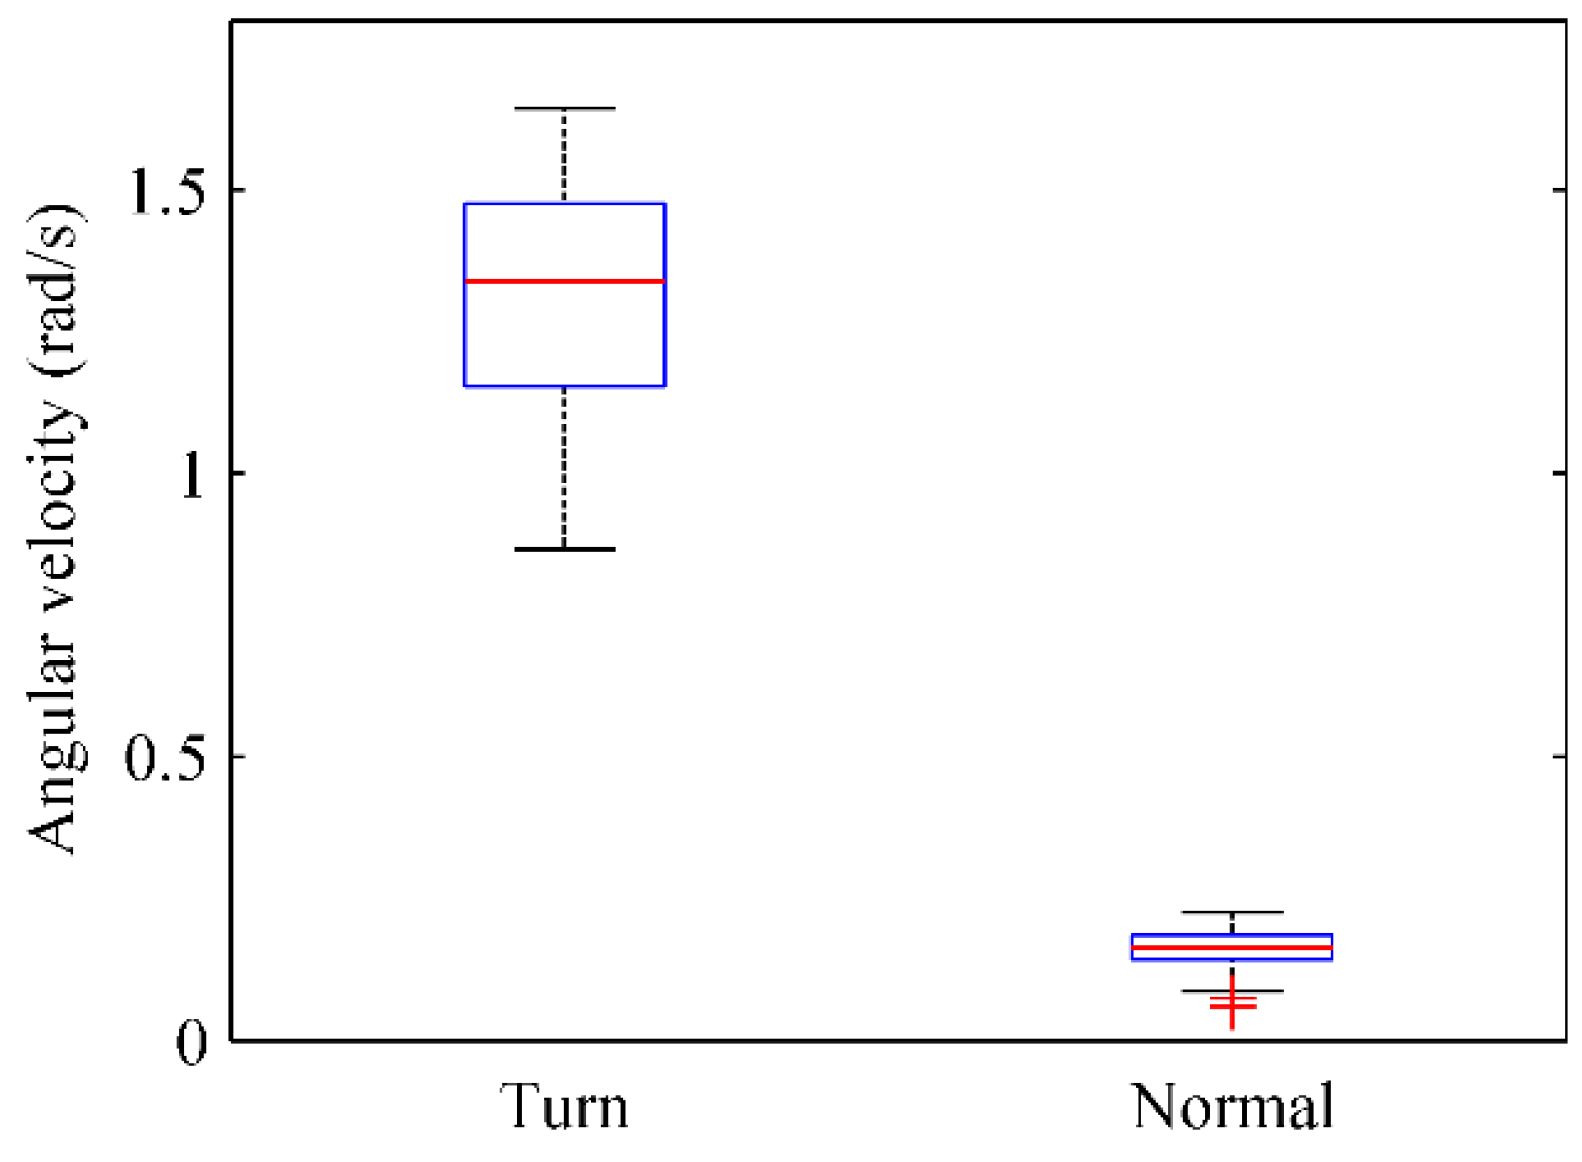
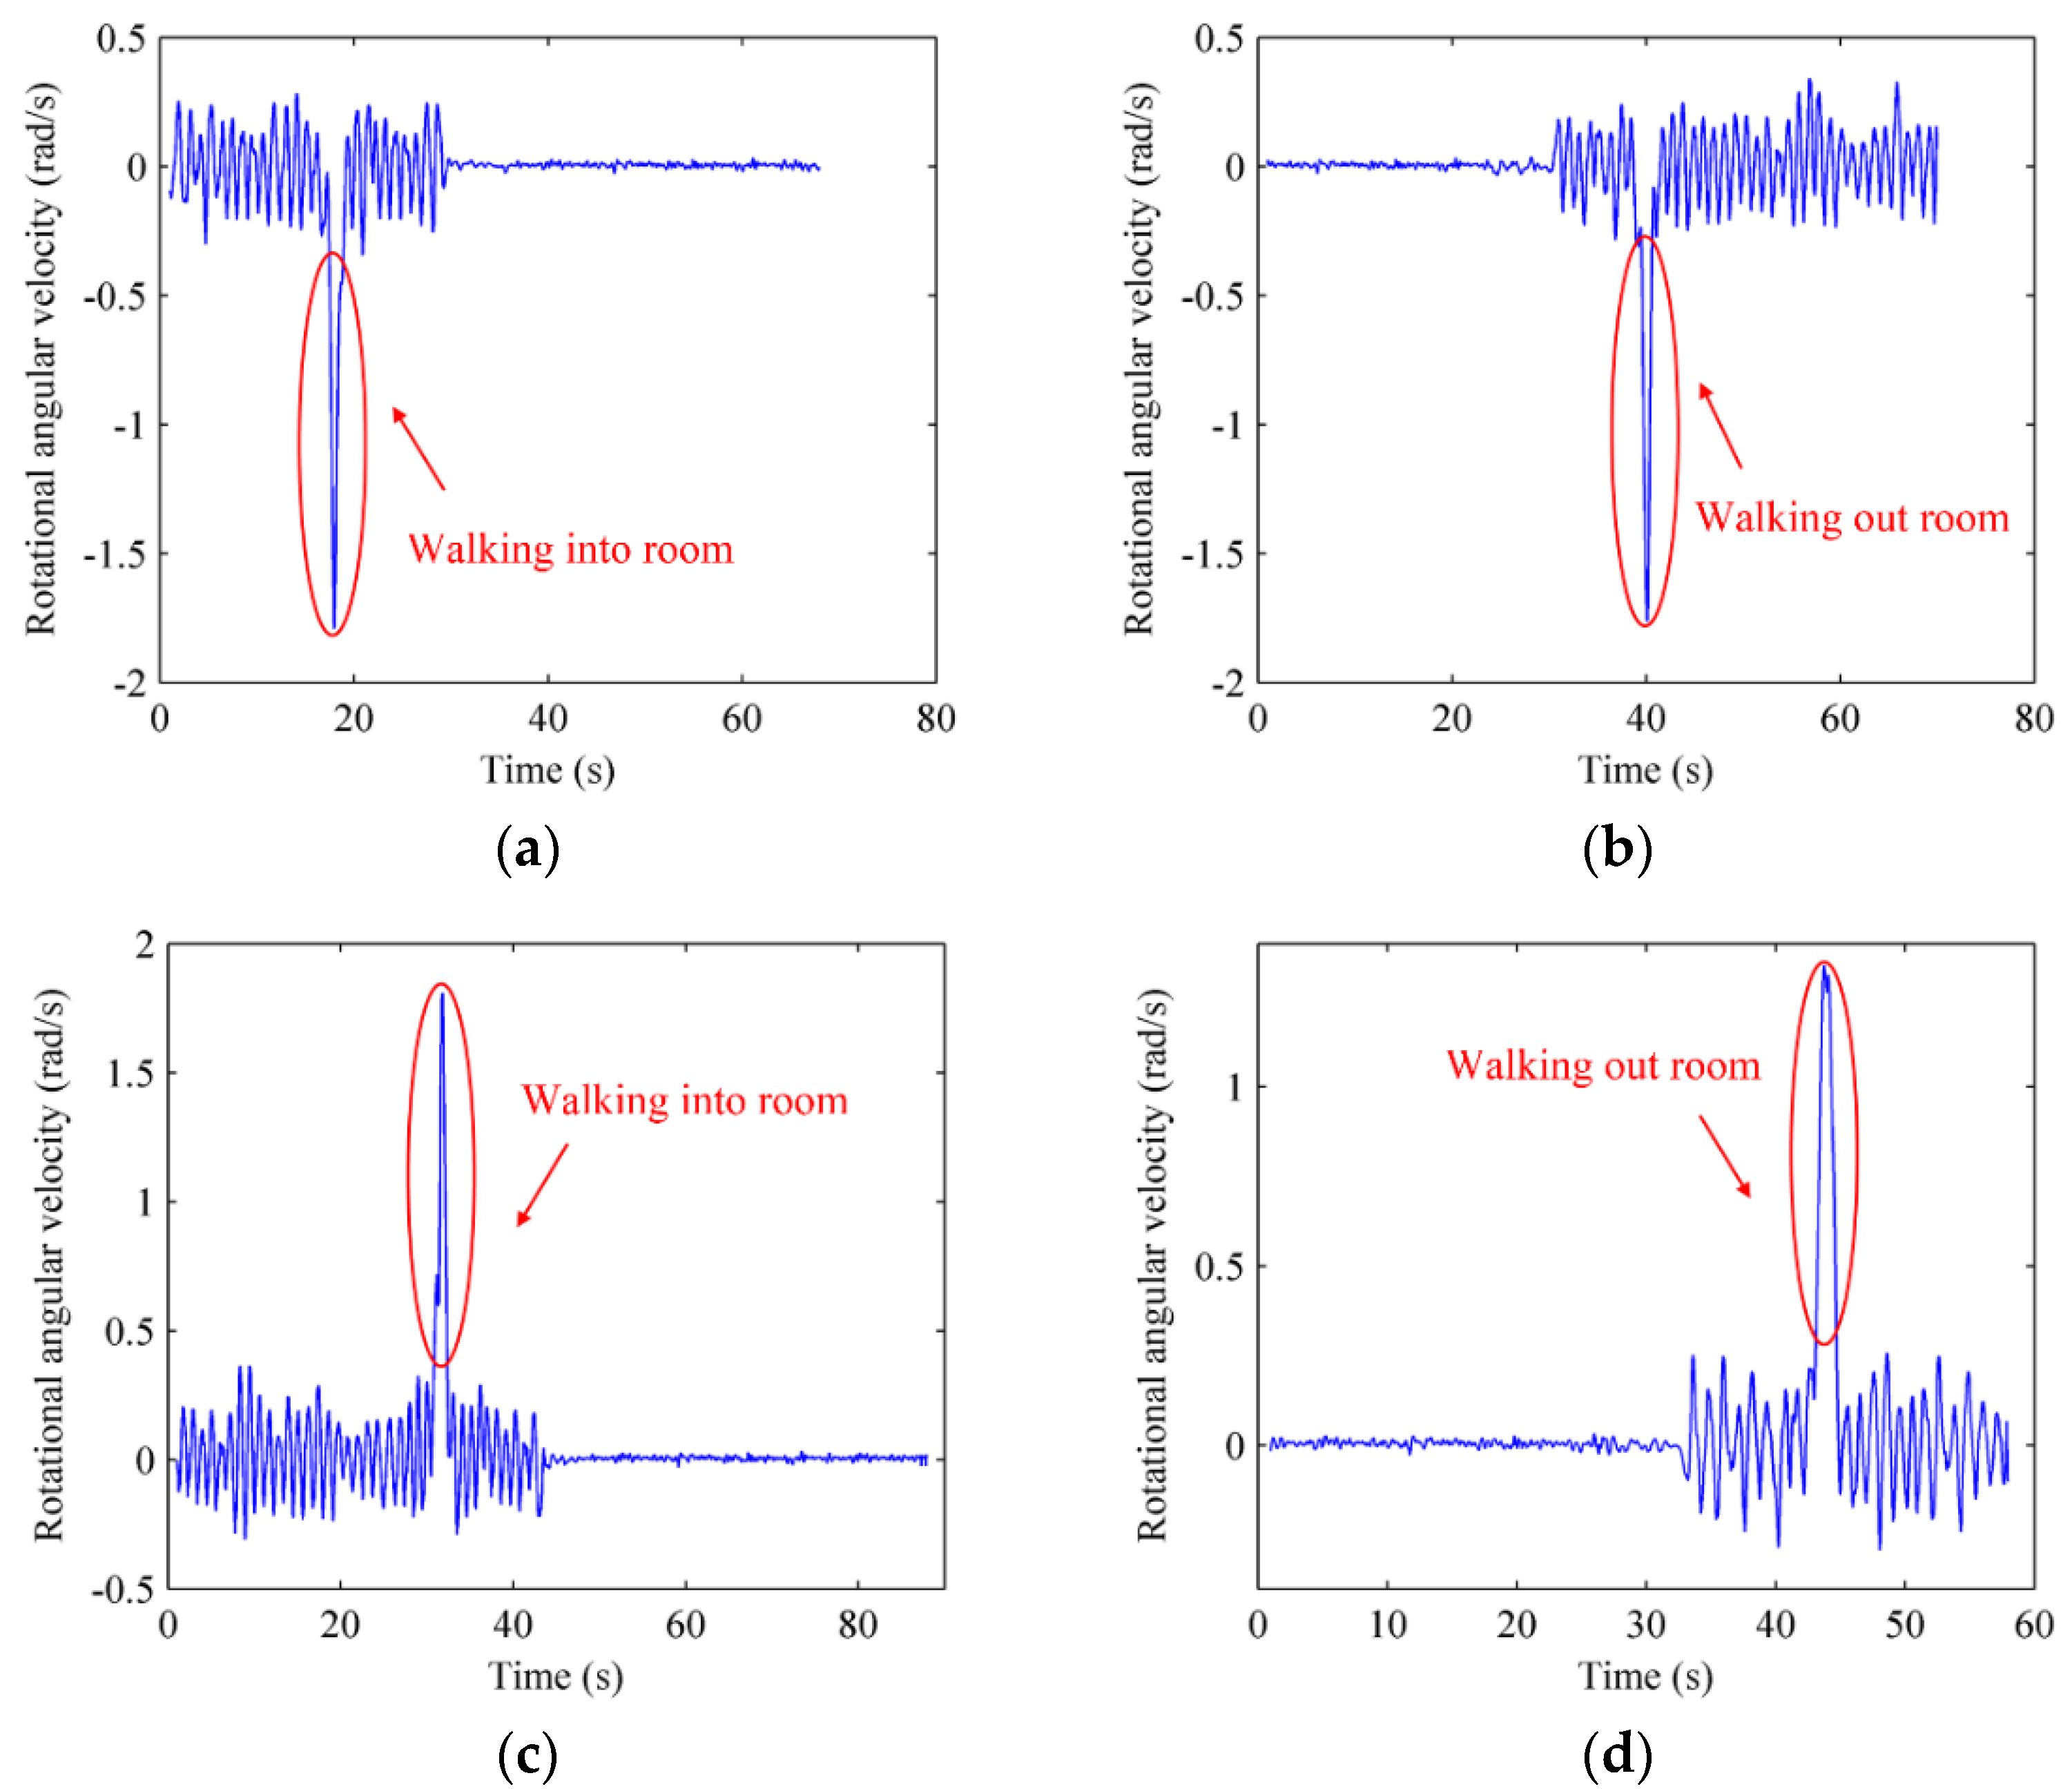
- Rotational angular velocity. Users’ rotational angular velocity rot = {rotX,rotY,rotZ} is measured by the gyroscope in smartphones. The rotational angular velocity in X, Y and Z orientation would all get a change when users make a turn due to the different placement of smartphones, but one of the three parameters changes more evidently than the other two.
3.2. Automatic Construction of Radio Map
3.3. Online Localization
4. RACC Algorithm
4.1. Doors’ Fingerprint Recognition
4.2. Doors’ Fingerprint Matching
- (1)
- D-fingerprint’ matching of the nearest door to the entrance
- (2)
- Recursive D-fingerprint’ matching of adjacent doors
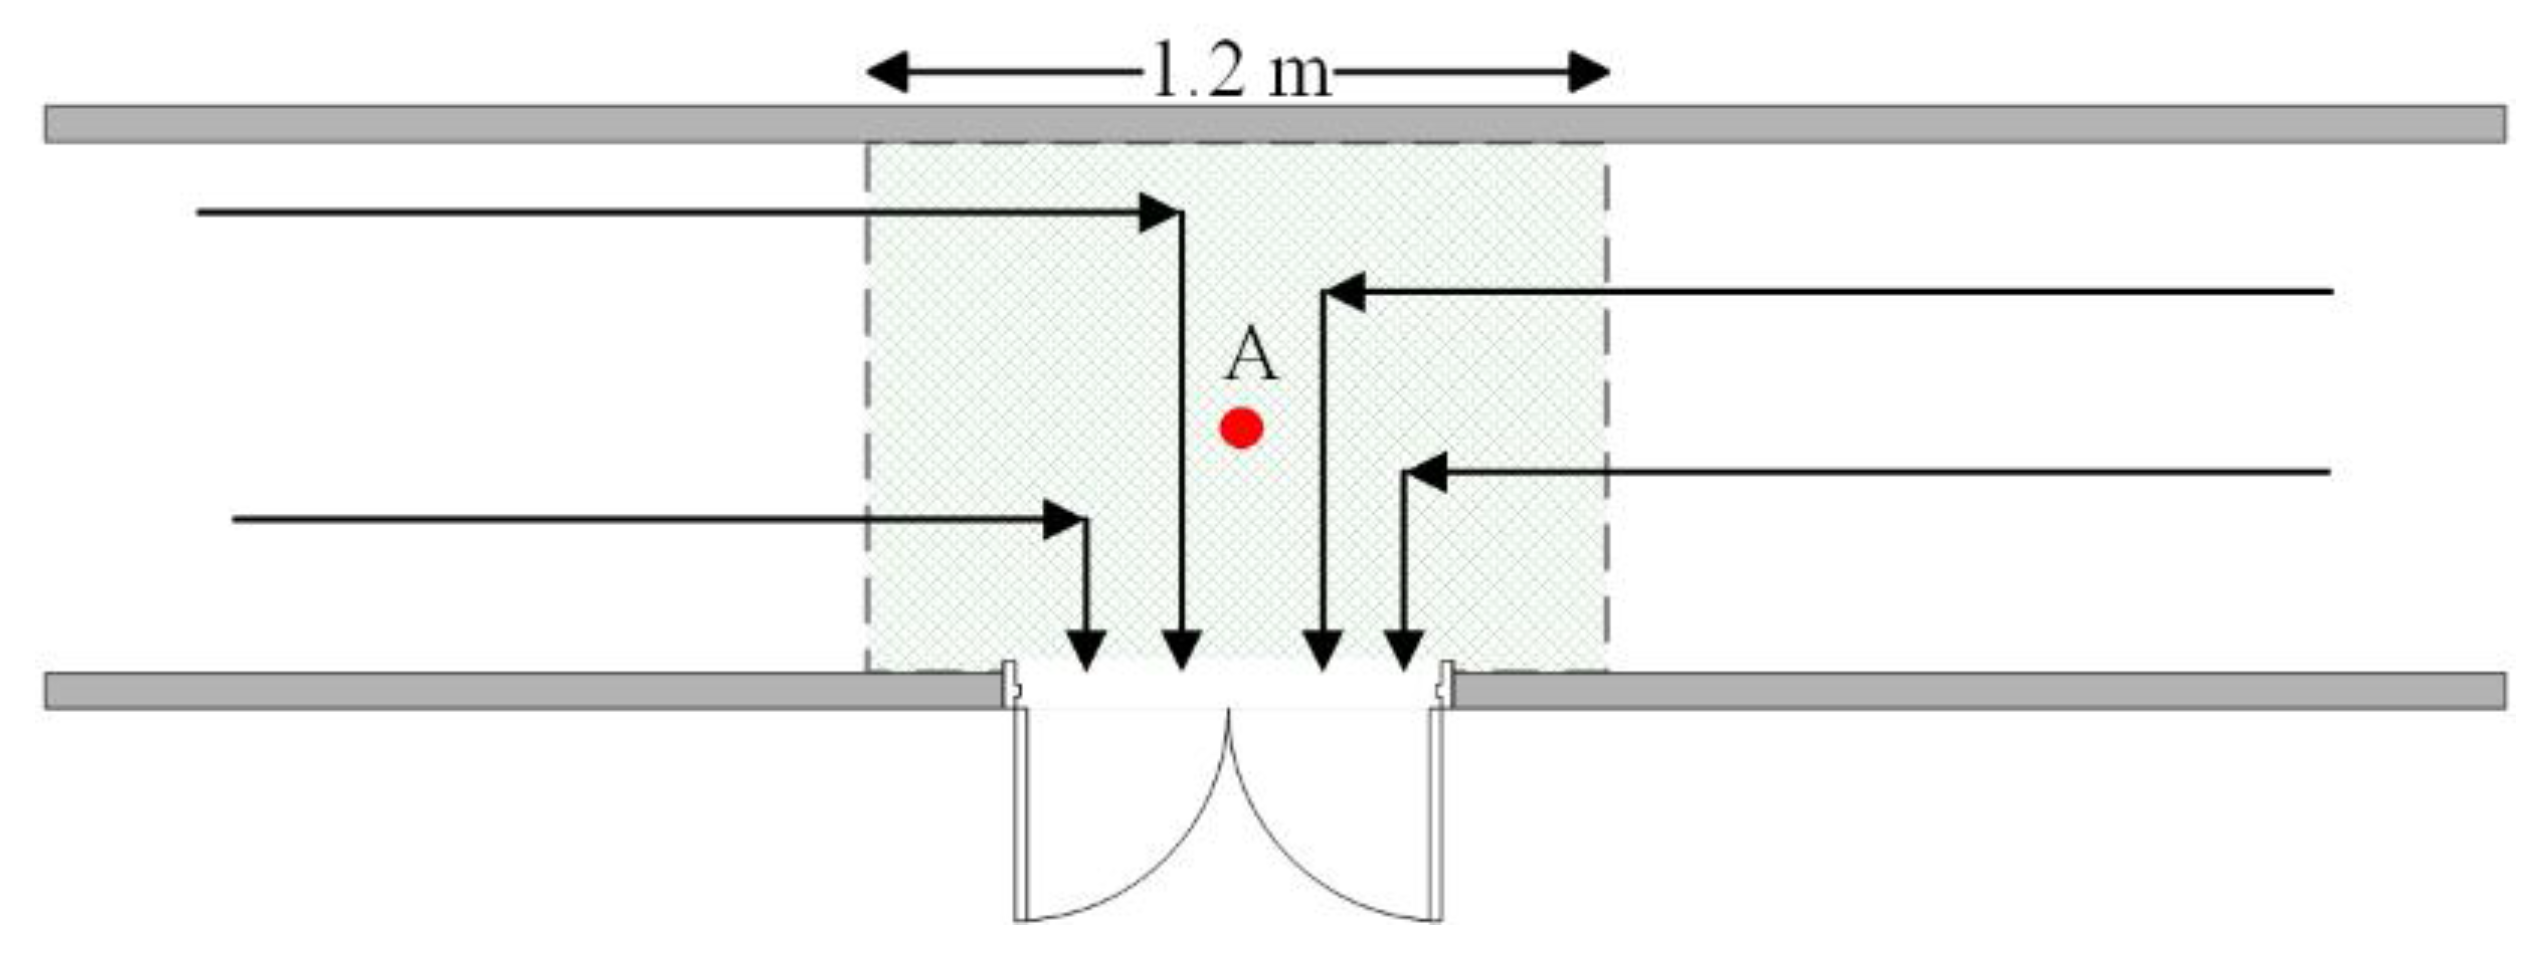
- (1)
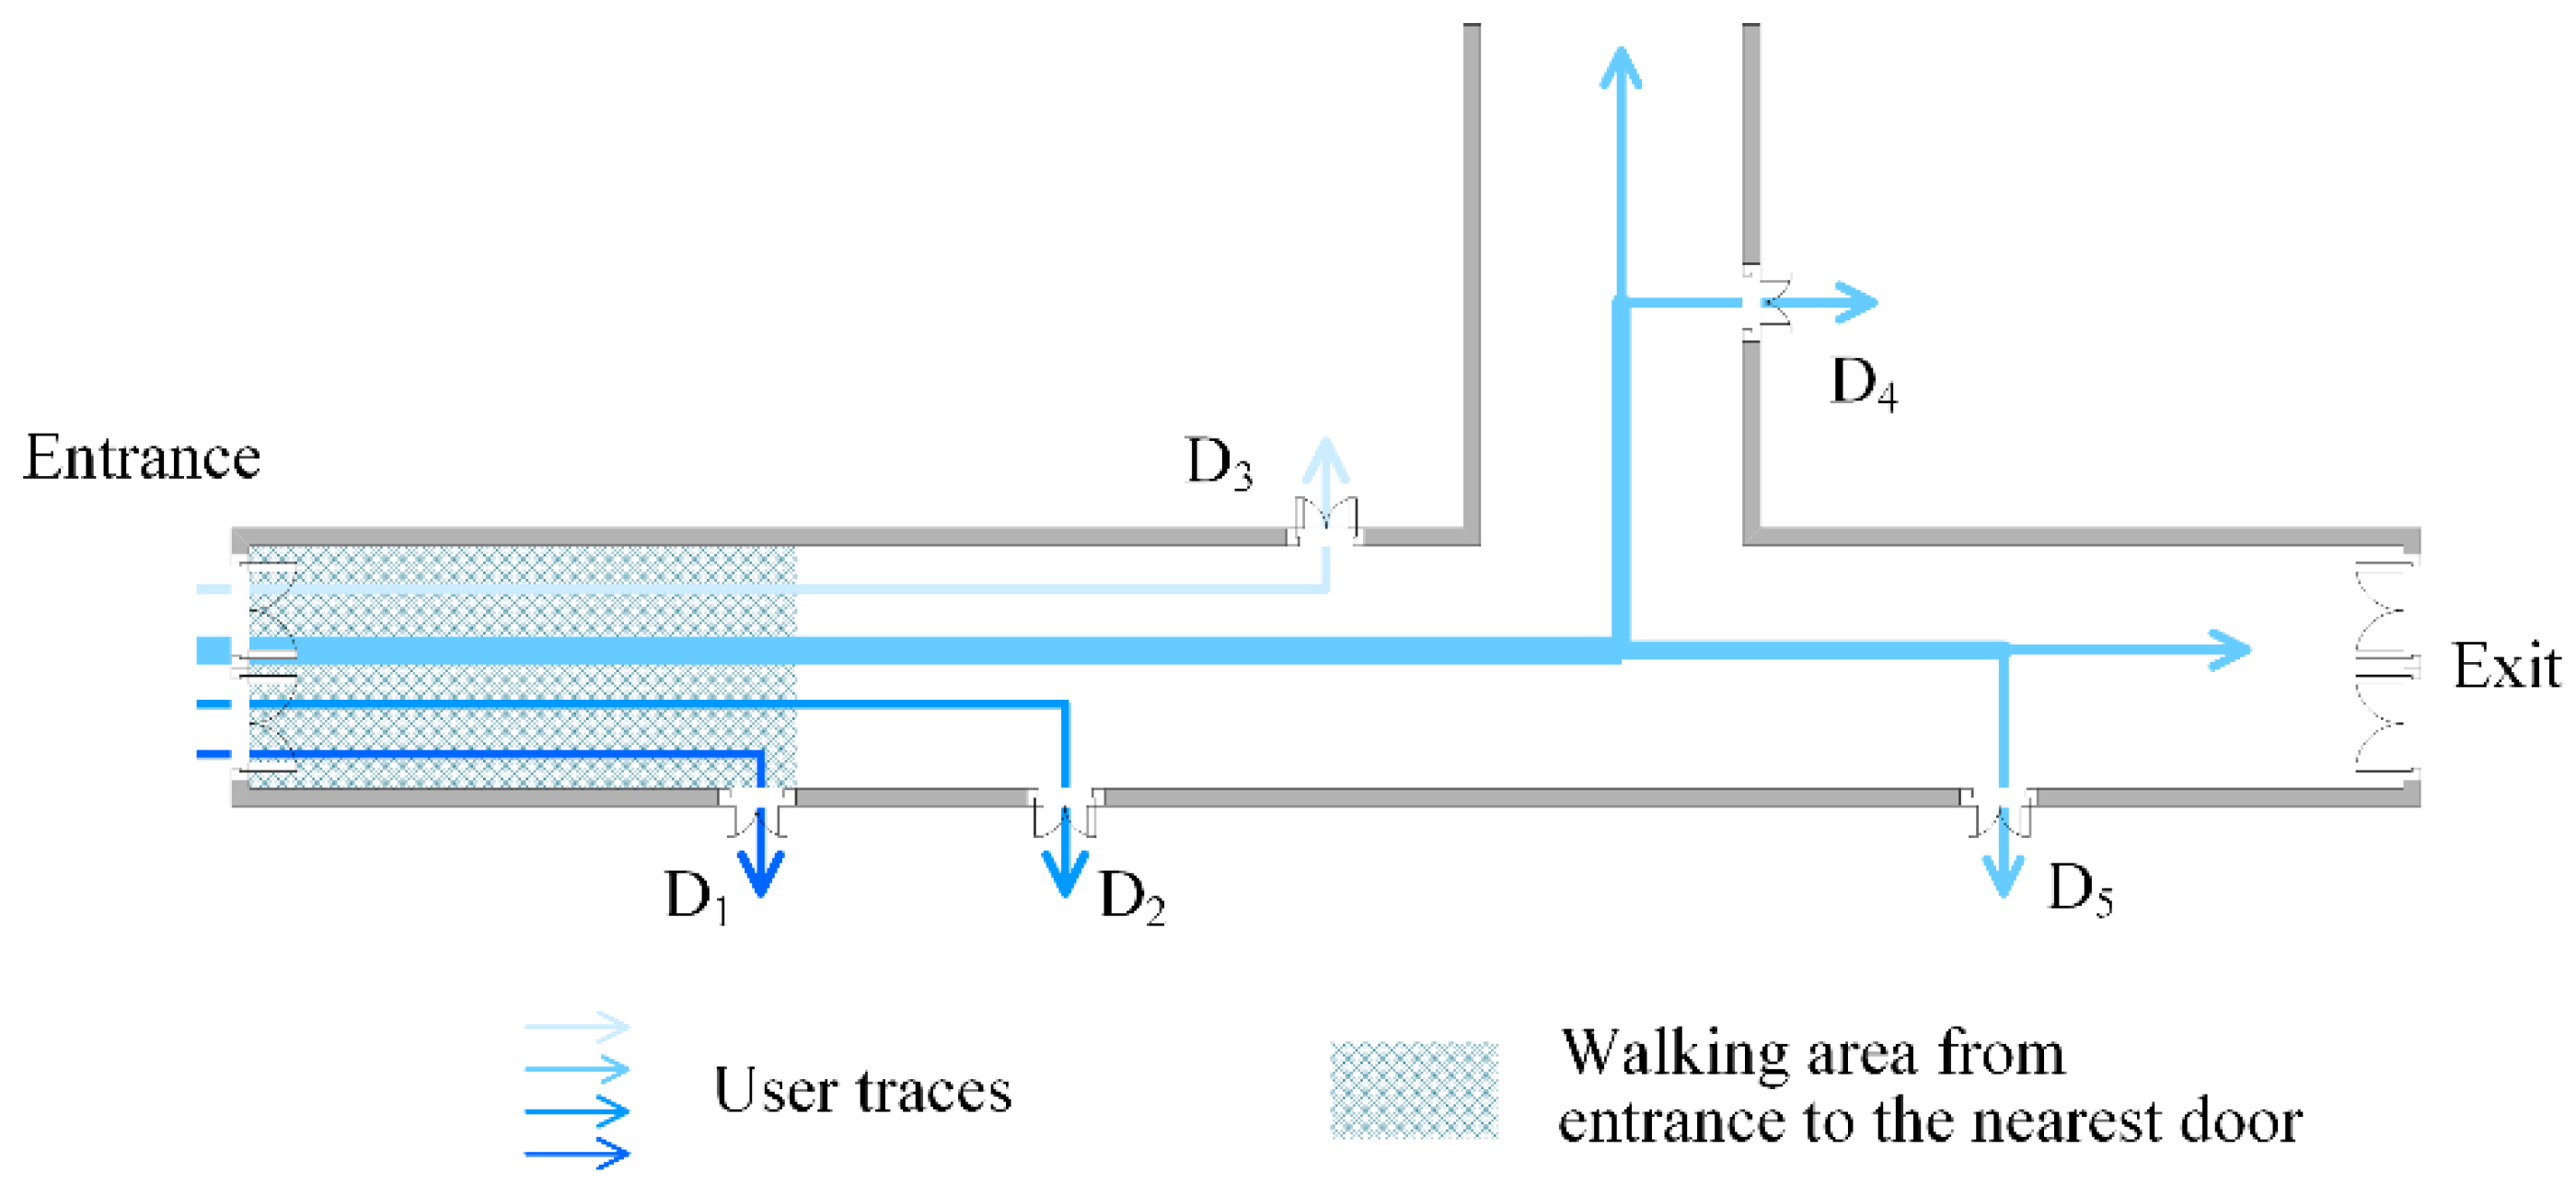
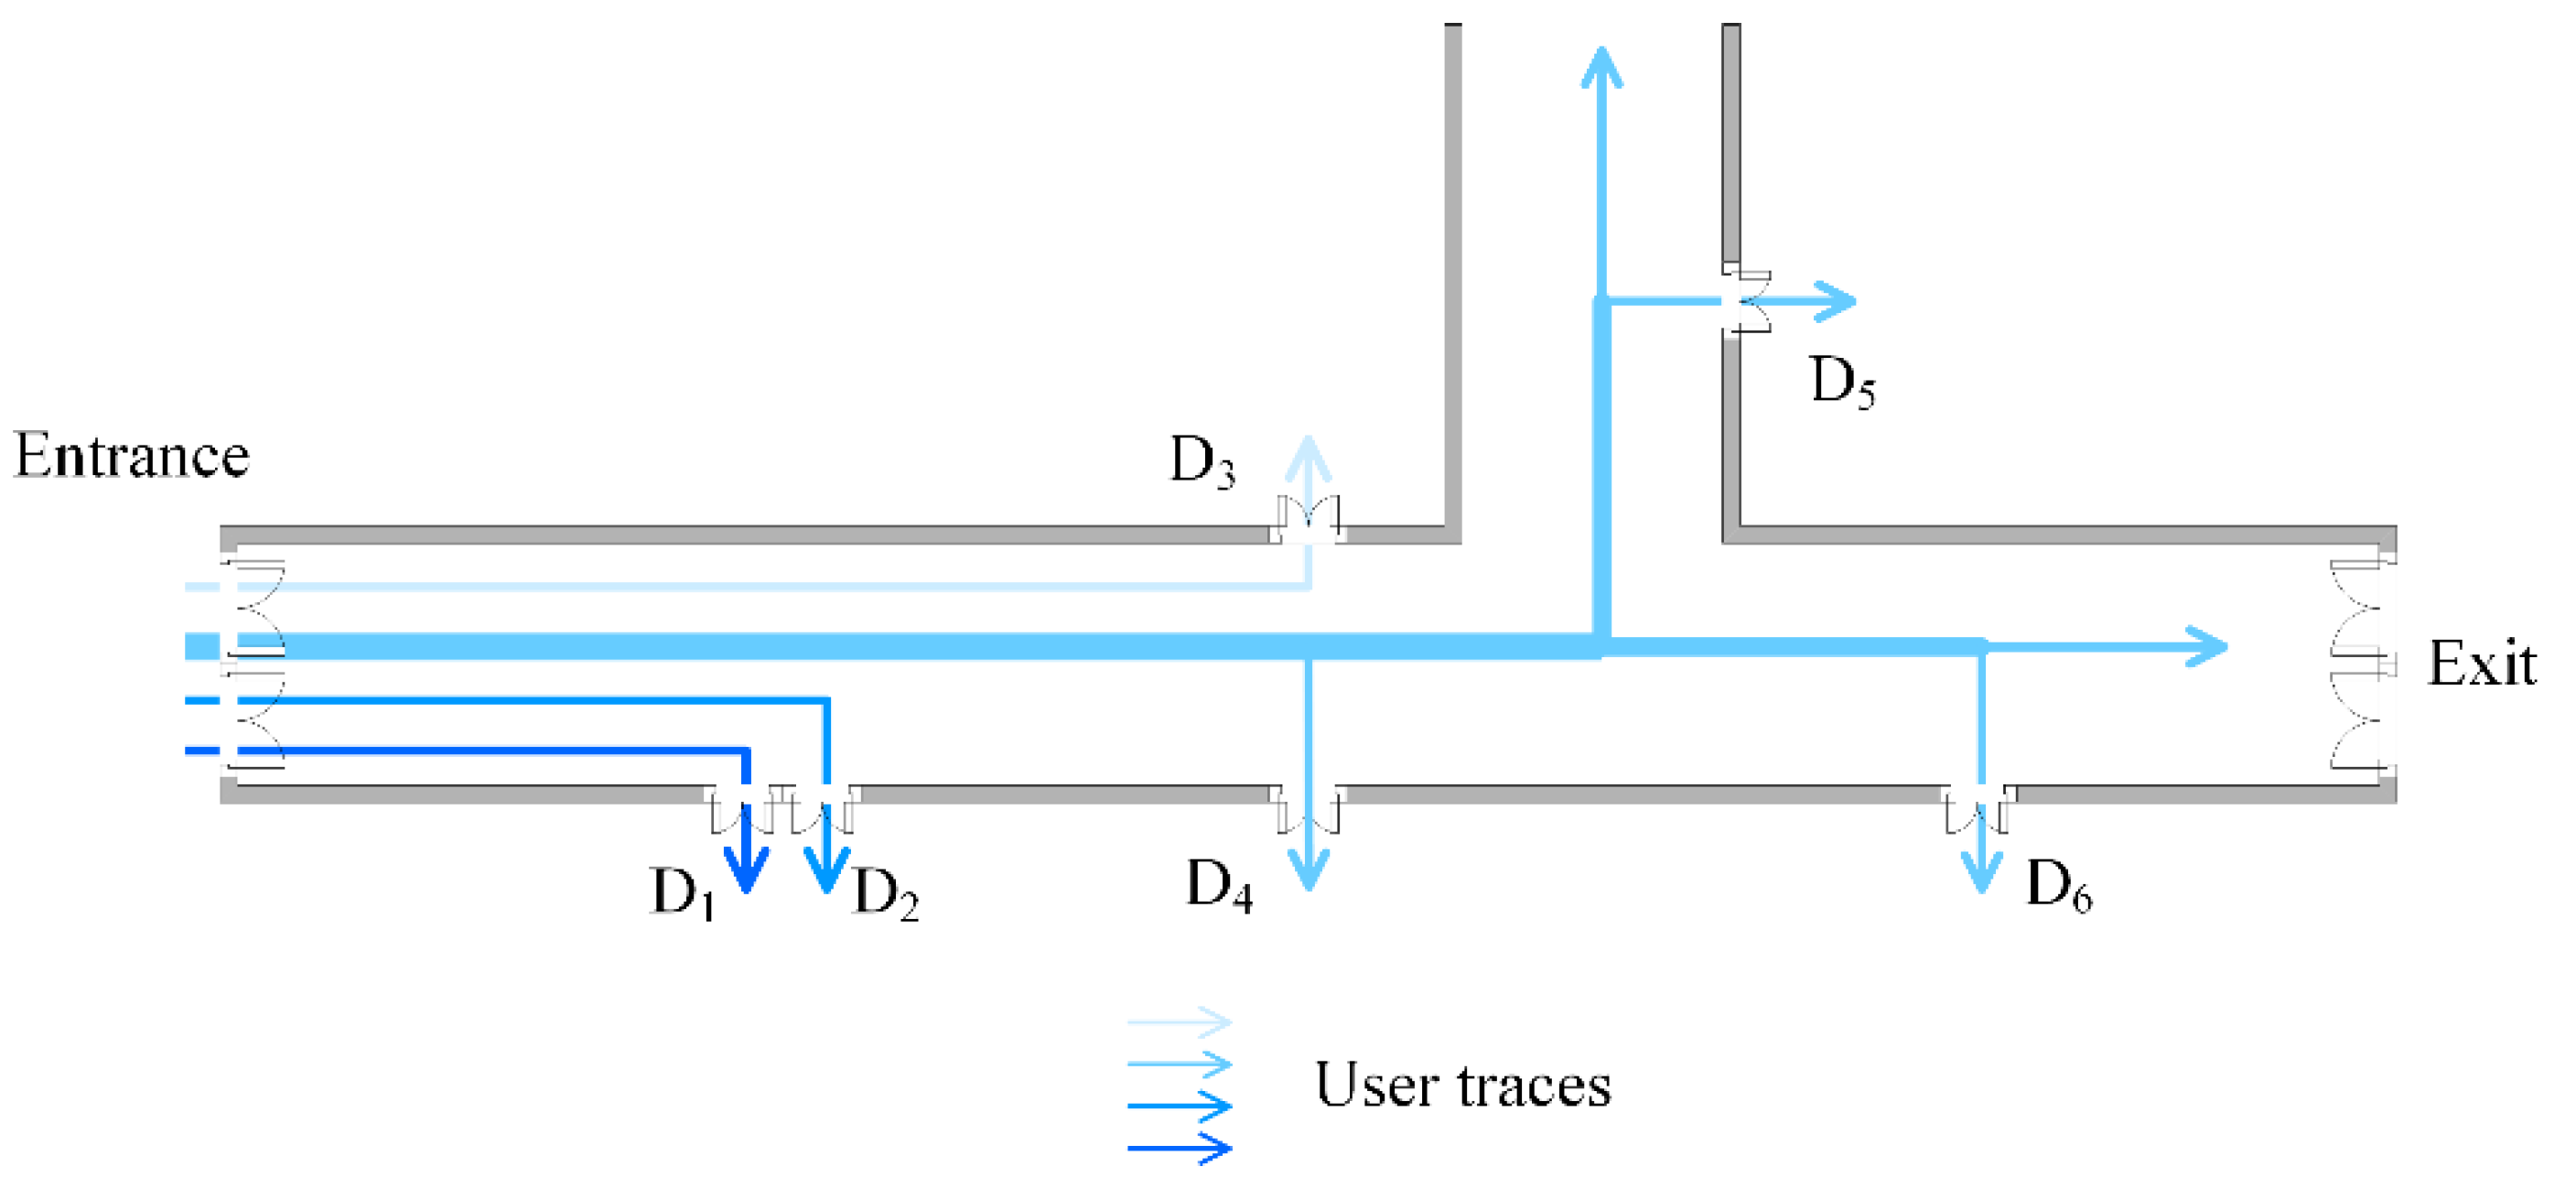
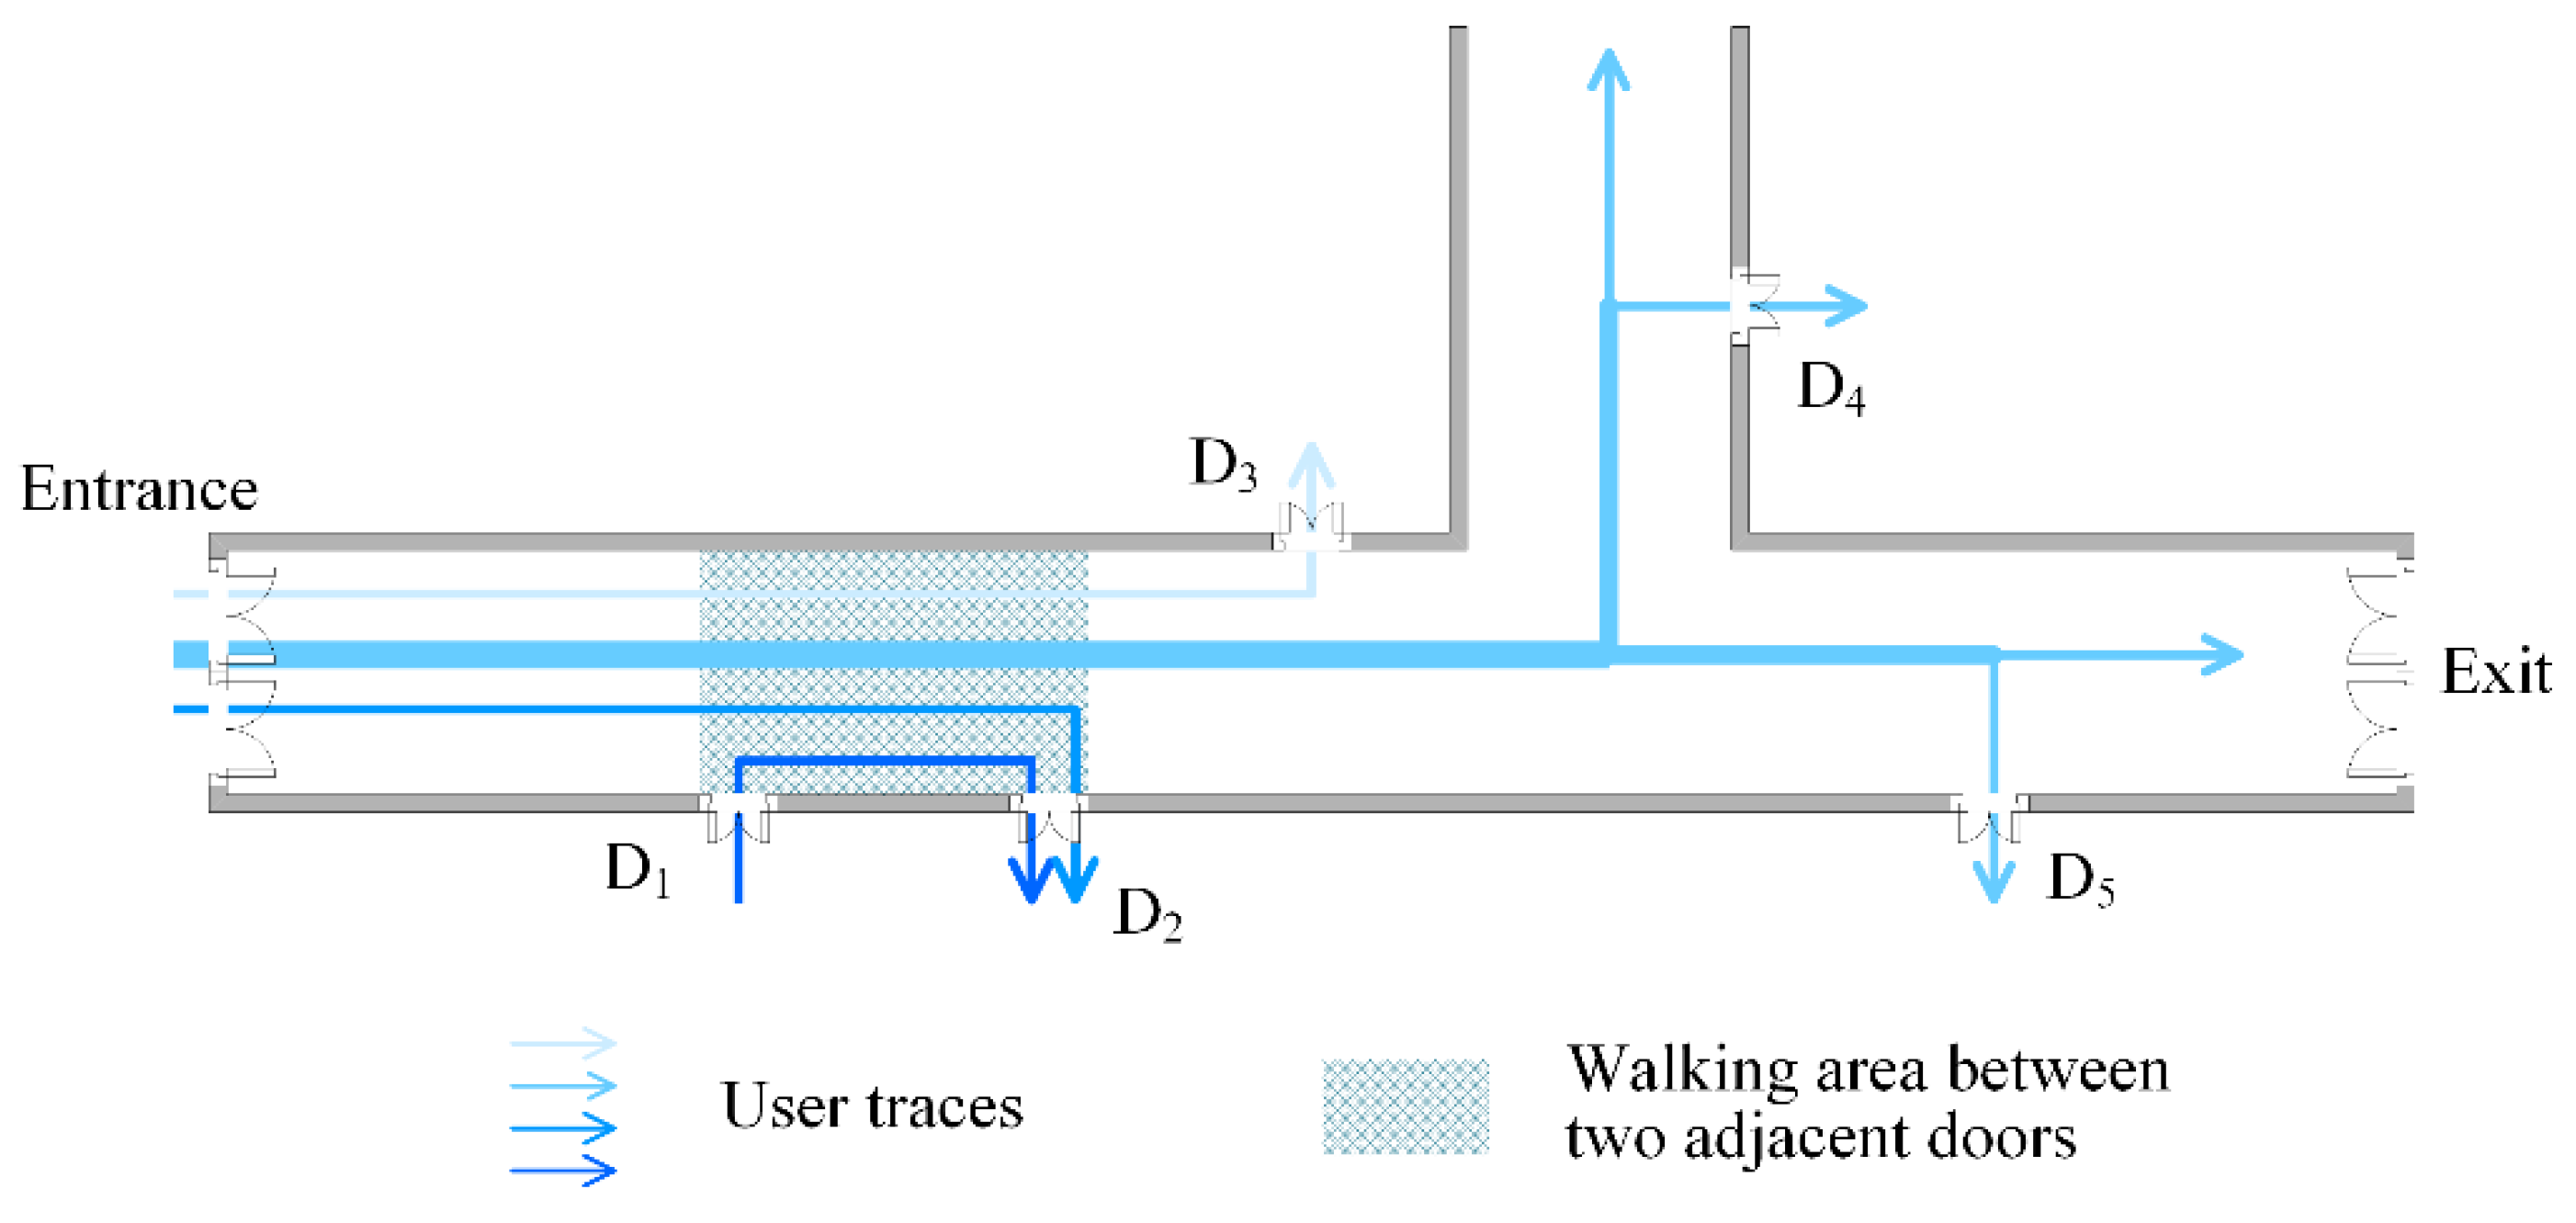
- For the case that D1 is close to D2, if D1 and D2 are closer than the coverage distance of a fingerprint (1~2 m), the fingerprints generated by D1 and D2 can be merged into one fingerprint, that is, they are calibrated as the same fingerprint. If D1 is far from D2, two different fingerprints will be generated separately, and the corresponding location of these two fingerprints will be identified according to their users’ sequential trajectories.
- (2)
- For the case that D3 is opposite to D4, since walking direction and rotational angular velocity are different when users take turns in front of them, the fingerprints of D3 and D4 can be identified according to users’ trajectories.
4.3. Crowdsourced Fingerprint Clustering
- (1)
- Fingerprint RSSk is chosen to be cluster representative when r(RSSk,RSSk) + a(RSSk,RSSk) > 0;
- (2)
- Fingerprint RSSi is subordinate to RSSk when RSSk maximizes r(RSSi,RSSk) + a(RSSi,RSSk)(i ≠ k).
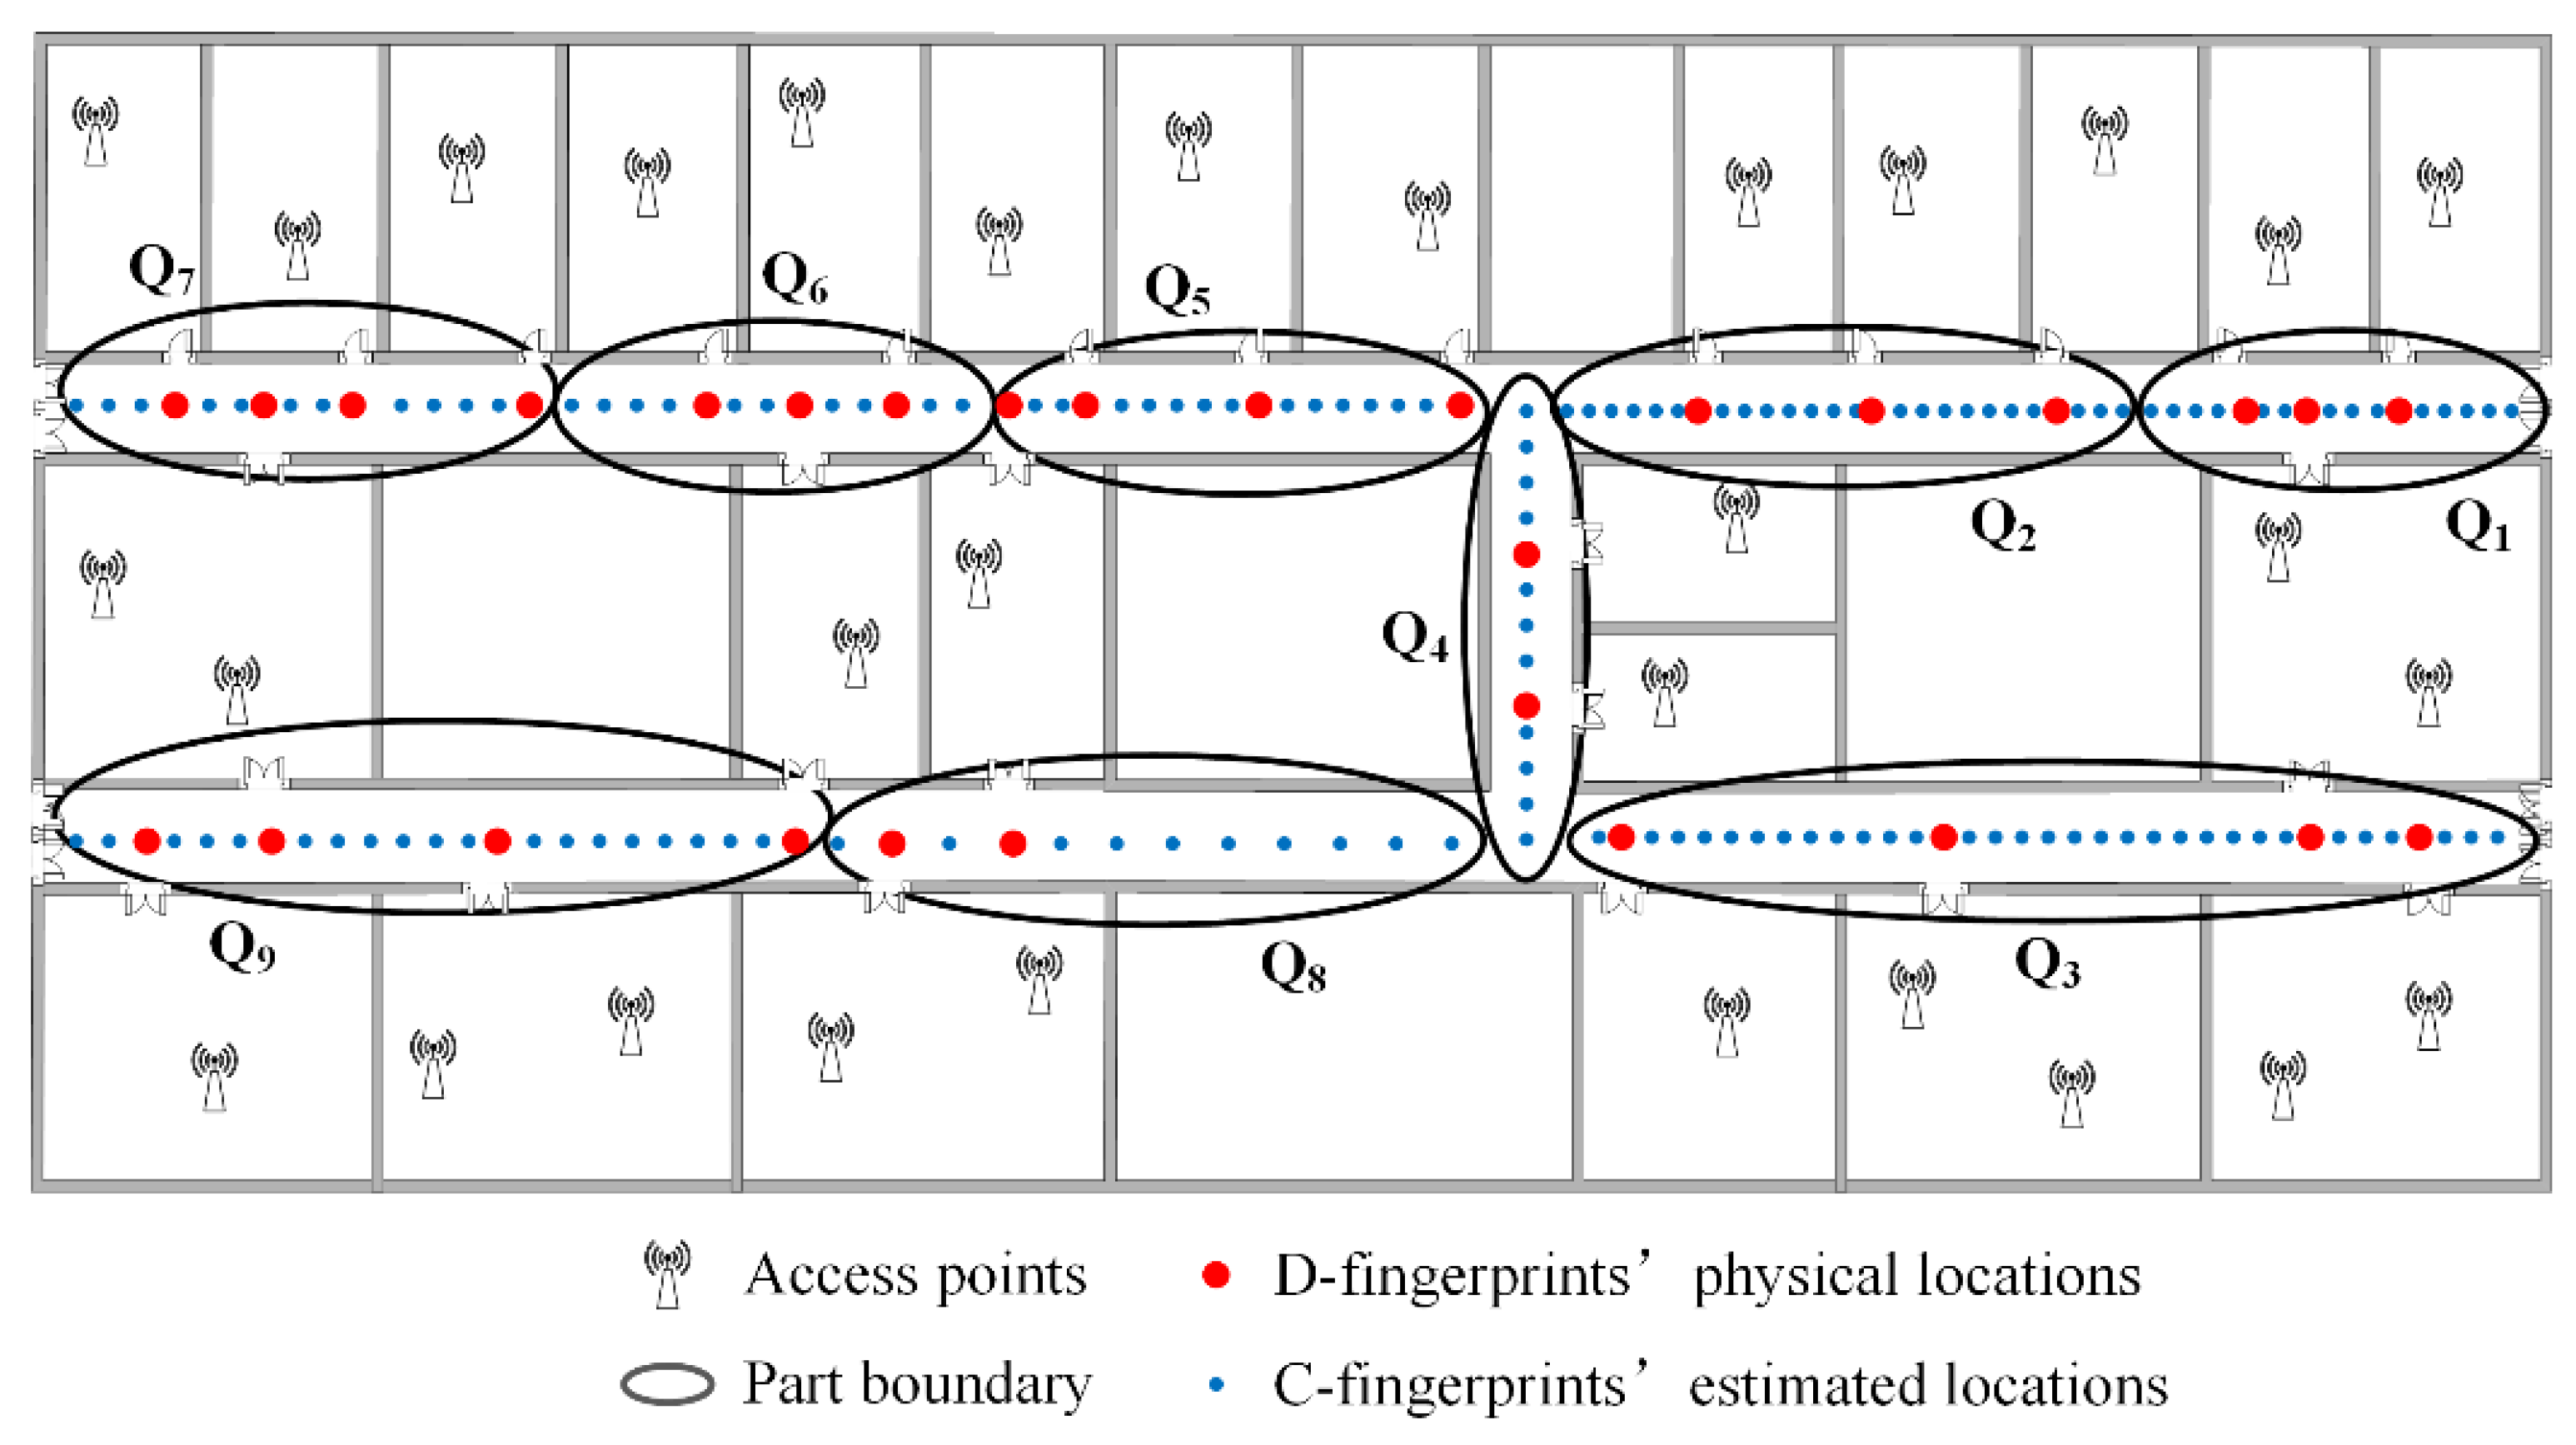
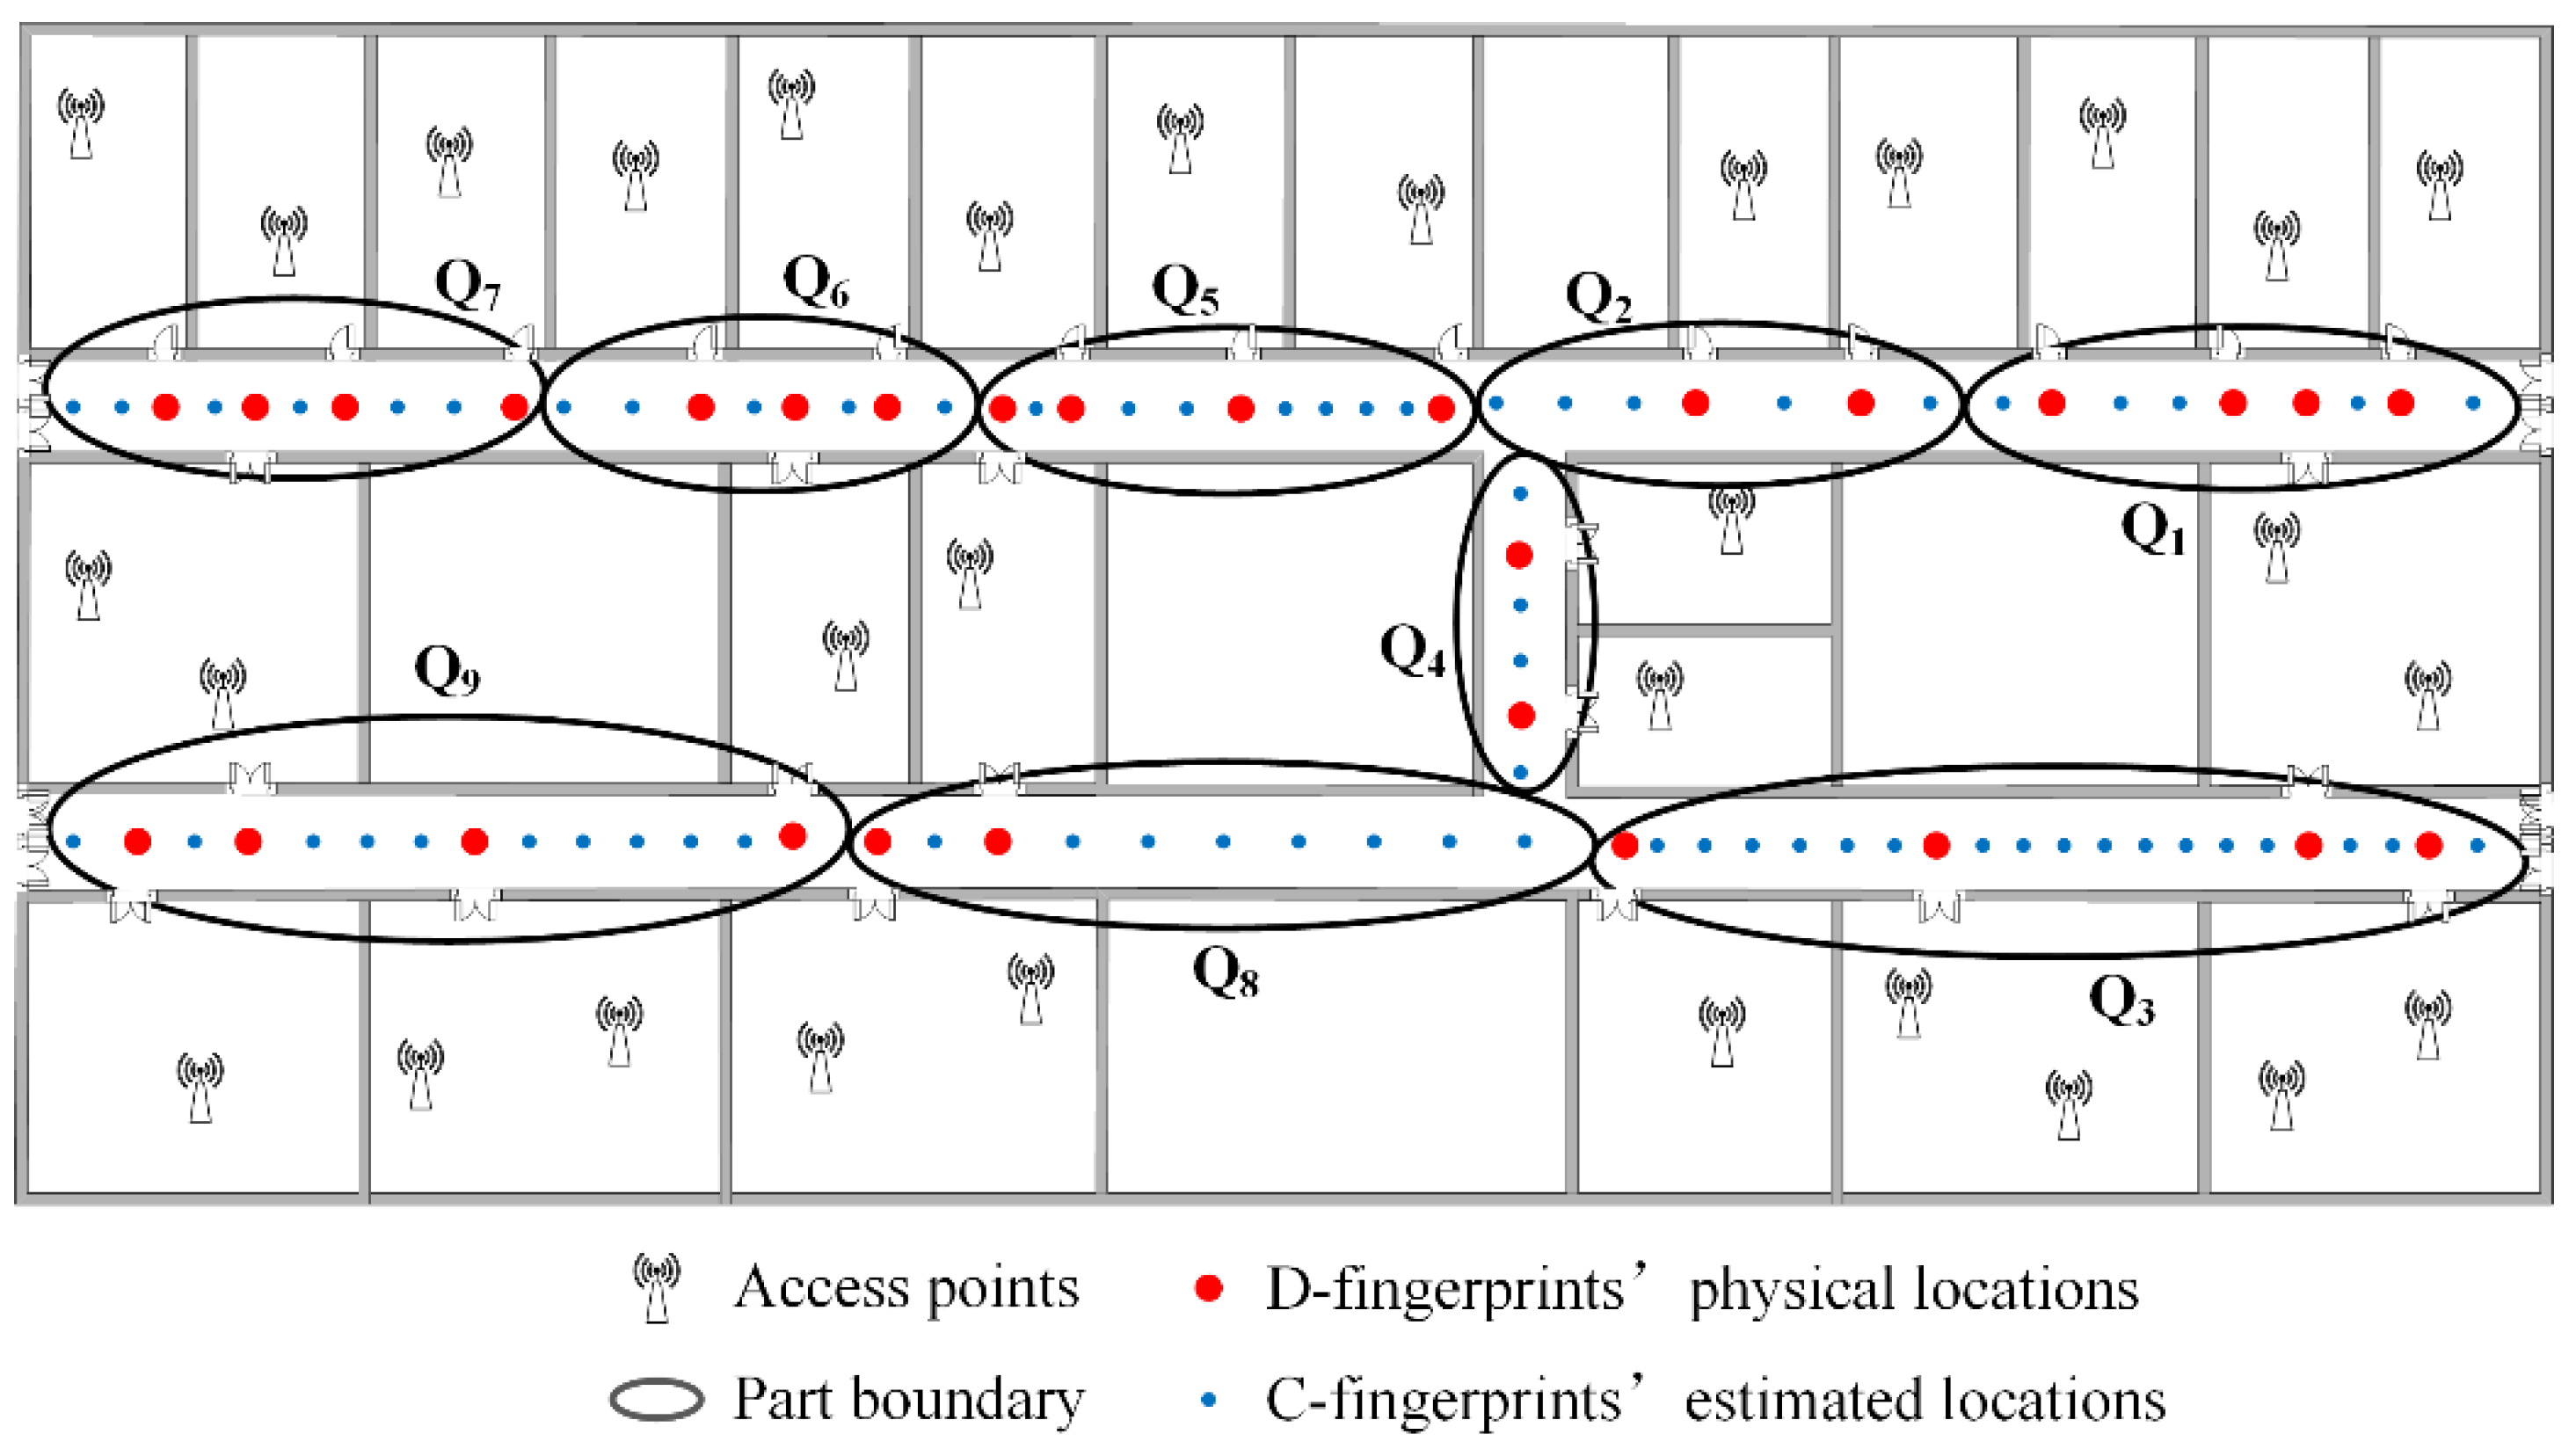
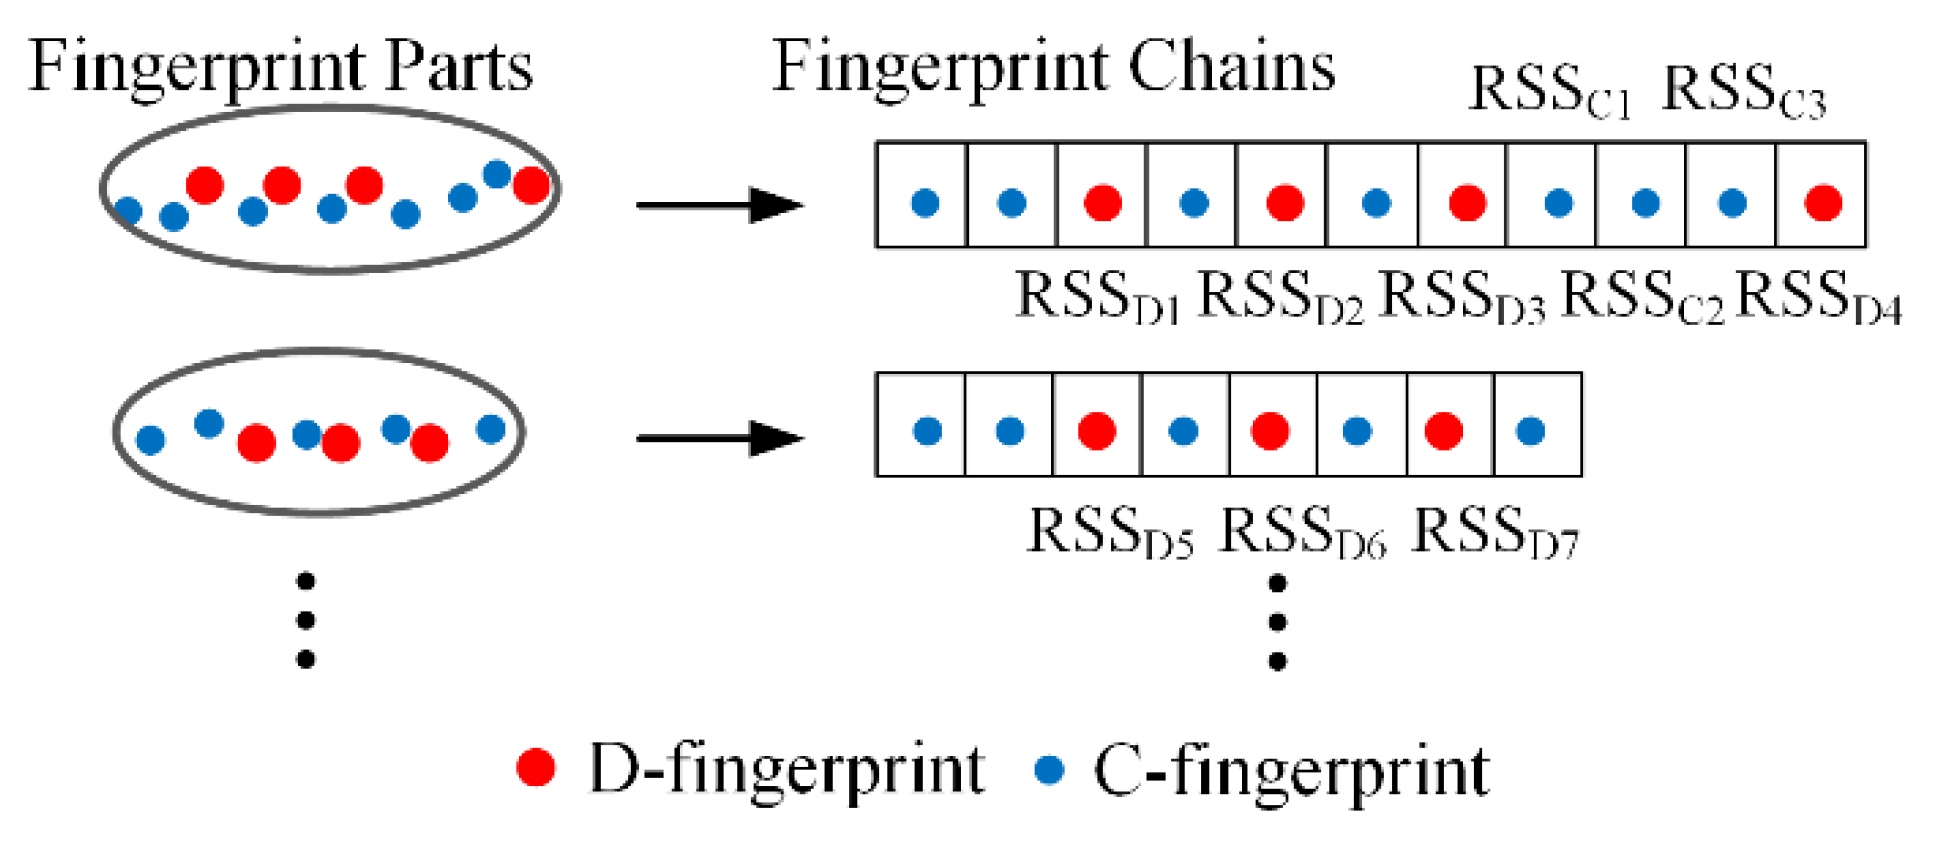
4.4. Fingerprint Partition
4.5. Radio-Map Construction
- (1)
- Calculate the physical distance d between two doors whose D-fingerprints are both nearest to C-fingerprint based on the reference of fingerprint chain (e.g., the physical distance dD3D4 between door D3 and door D4 in Figure 11).
- (2)
- Calculate the similarity δ between the two doors’ D-fingerprints (e.g., the similarity δD3D4 between door D3’s D-fingerprint RSSD3 and door D4’s D-fingerprint RSSD4).
- (3)
- Calculate the similarity δ’ between C-fingerprint and the D-fingerprint that is closest to C-fingerprint in fingerprint chain (e.g., the similarity δC1D3 between RSSC1 and RSSD3).
- (4)
- Calculate the physical distance Δd between C-fingerprint and the D-fingerprint that is closest to the C-fingerprint in the fingerprint chain (e.g., the distance ΔdC1D3 between C-fingerprint RSSC1 and D-fingerprint RSSD3):
4.6. An Example of RACC
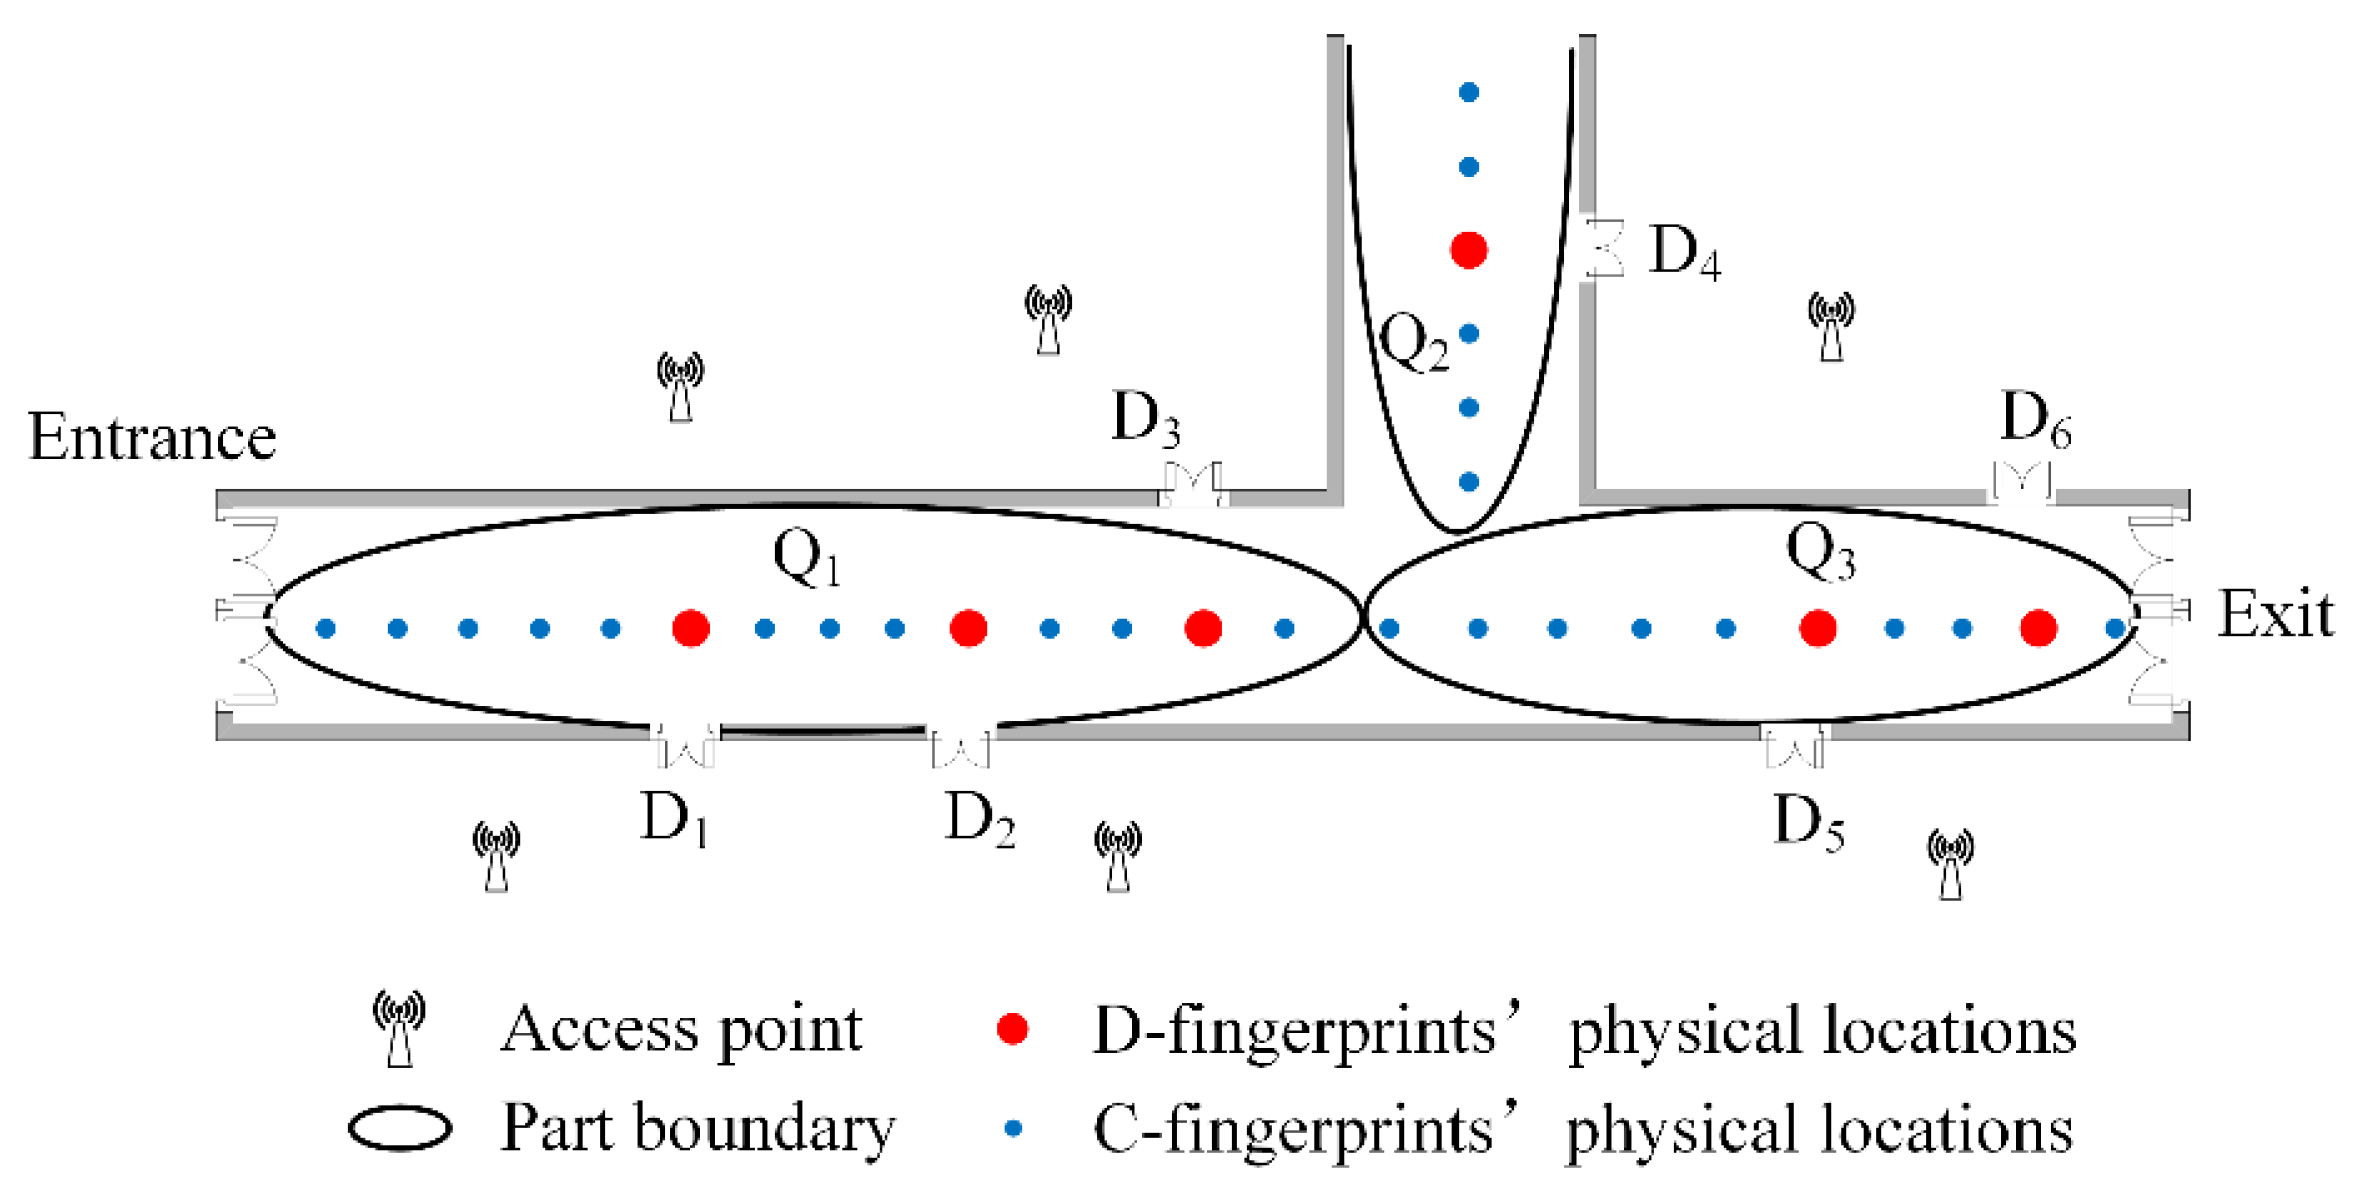
- (1)
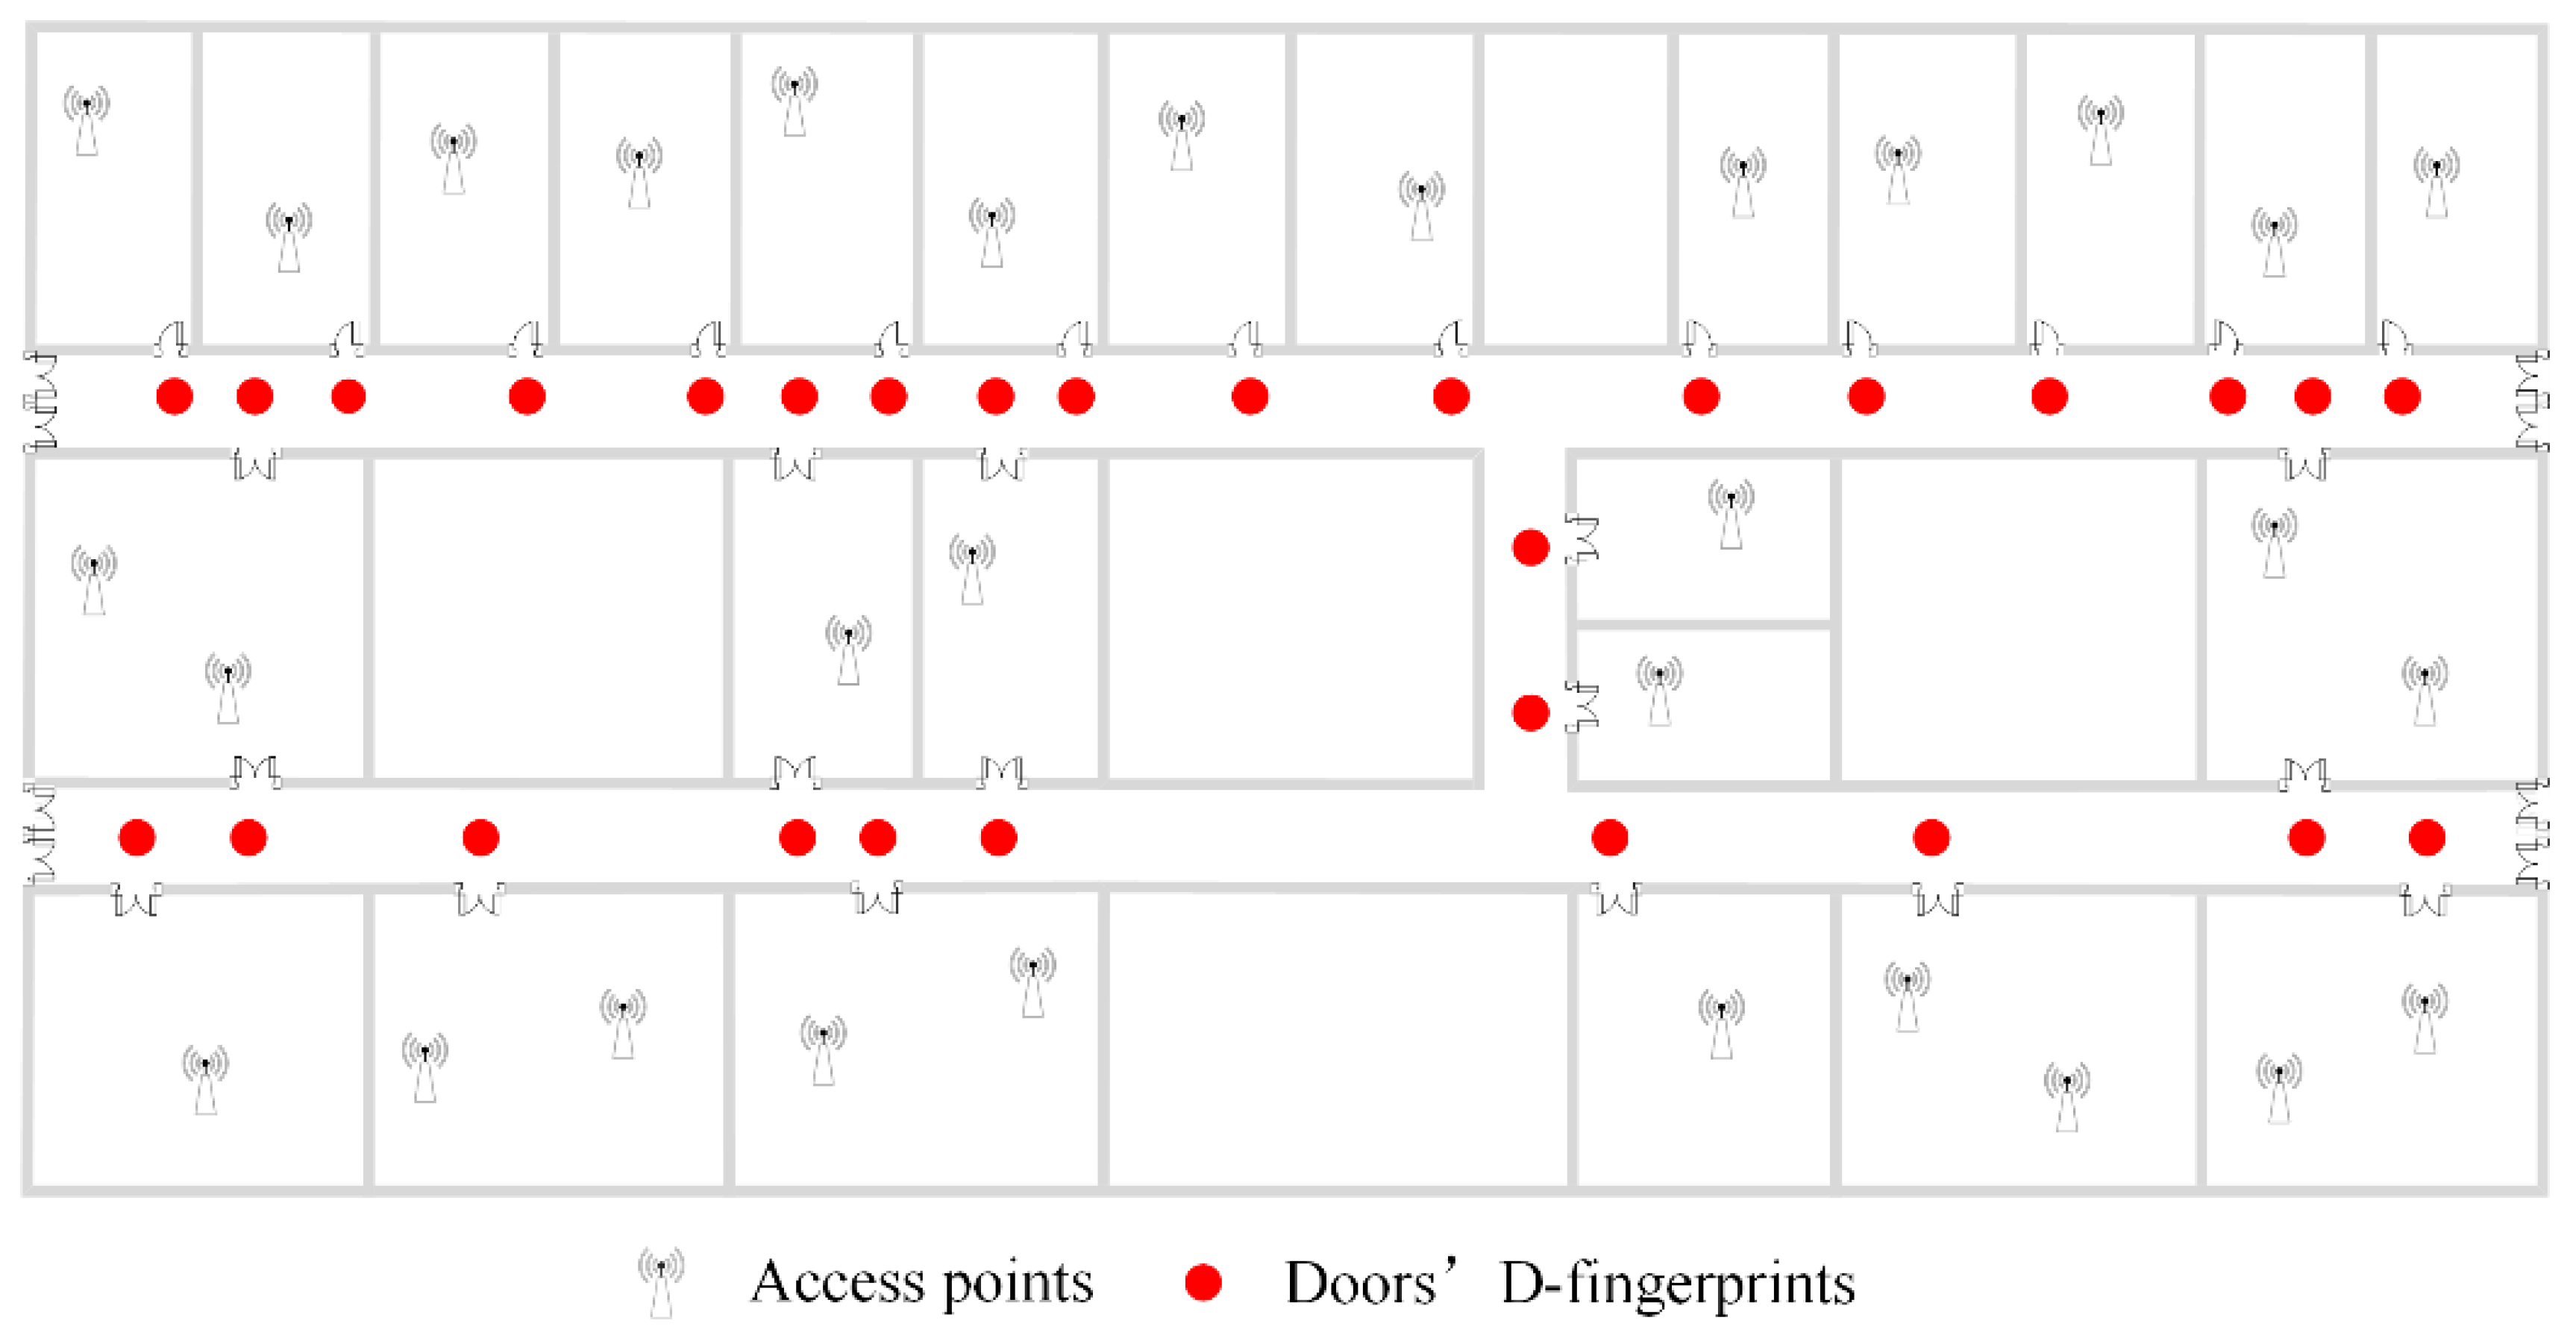
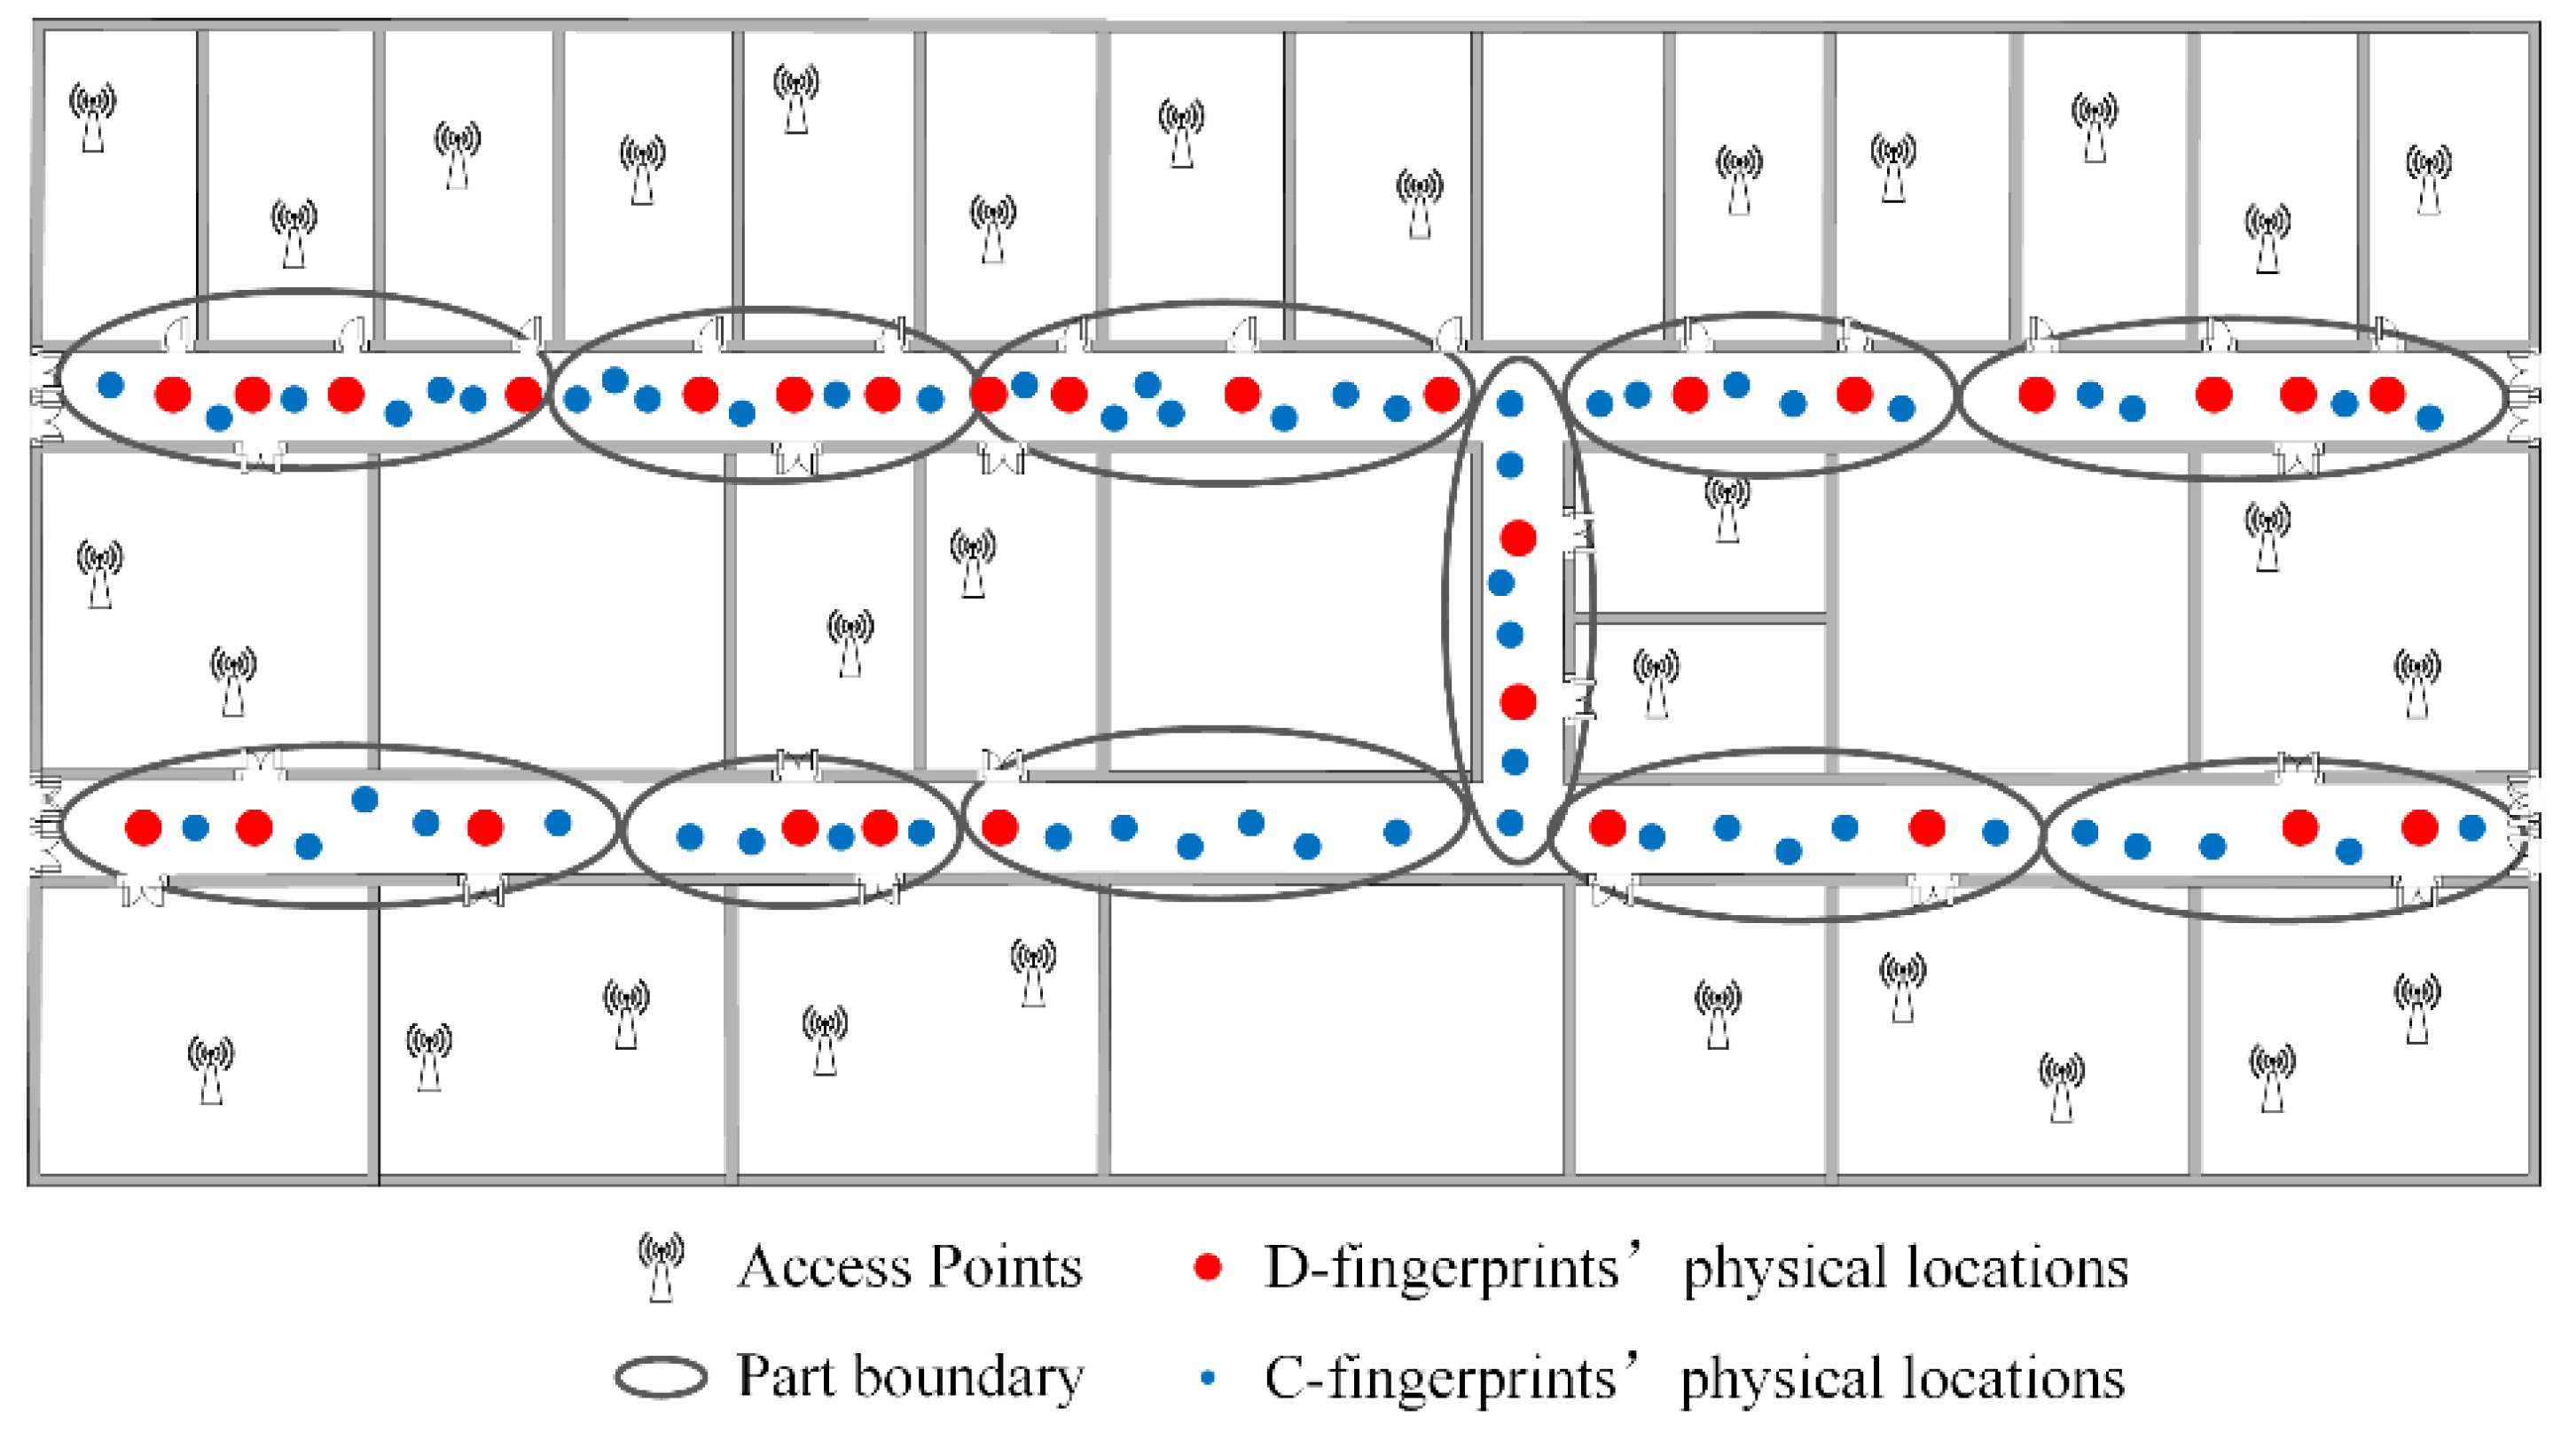
- D-fingerprints are recognized. Users’ walking direction and rotational angular velocity will change when users traverse doors D1~D6. Therefore, doors D1~D6 are identified and the fingerprints (D-fingerprints) near them are recorded, as the red dots show in Figure 13.
- (2)
- D-fingerprints are matched to their physical locations. According to the geographical constraints between doors D1~D6 and users’ walking trajectories, D1~D6’s fingerprints can be matched to their corresponding physical locations.
- (3)
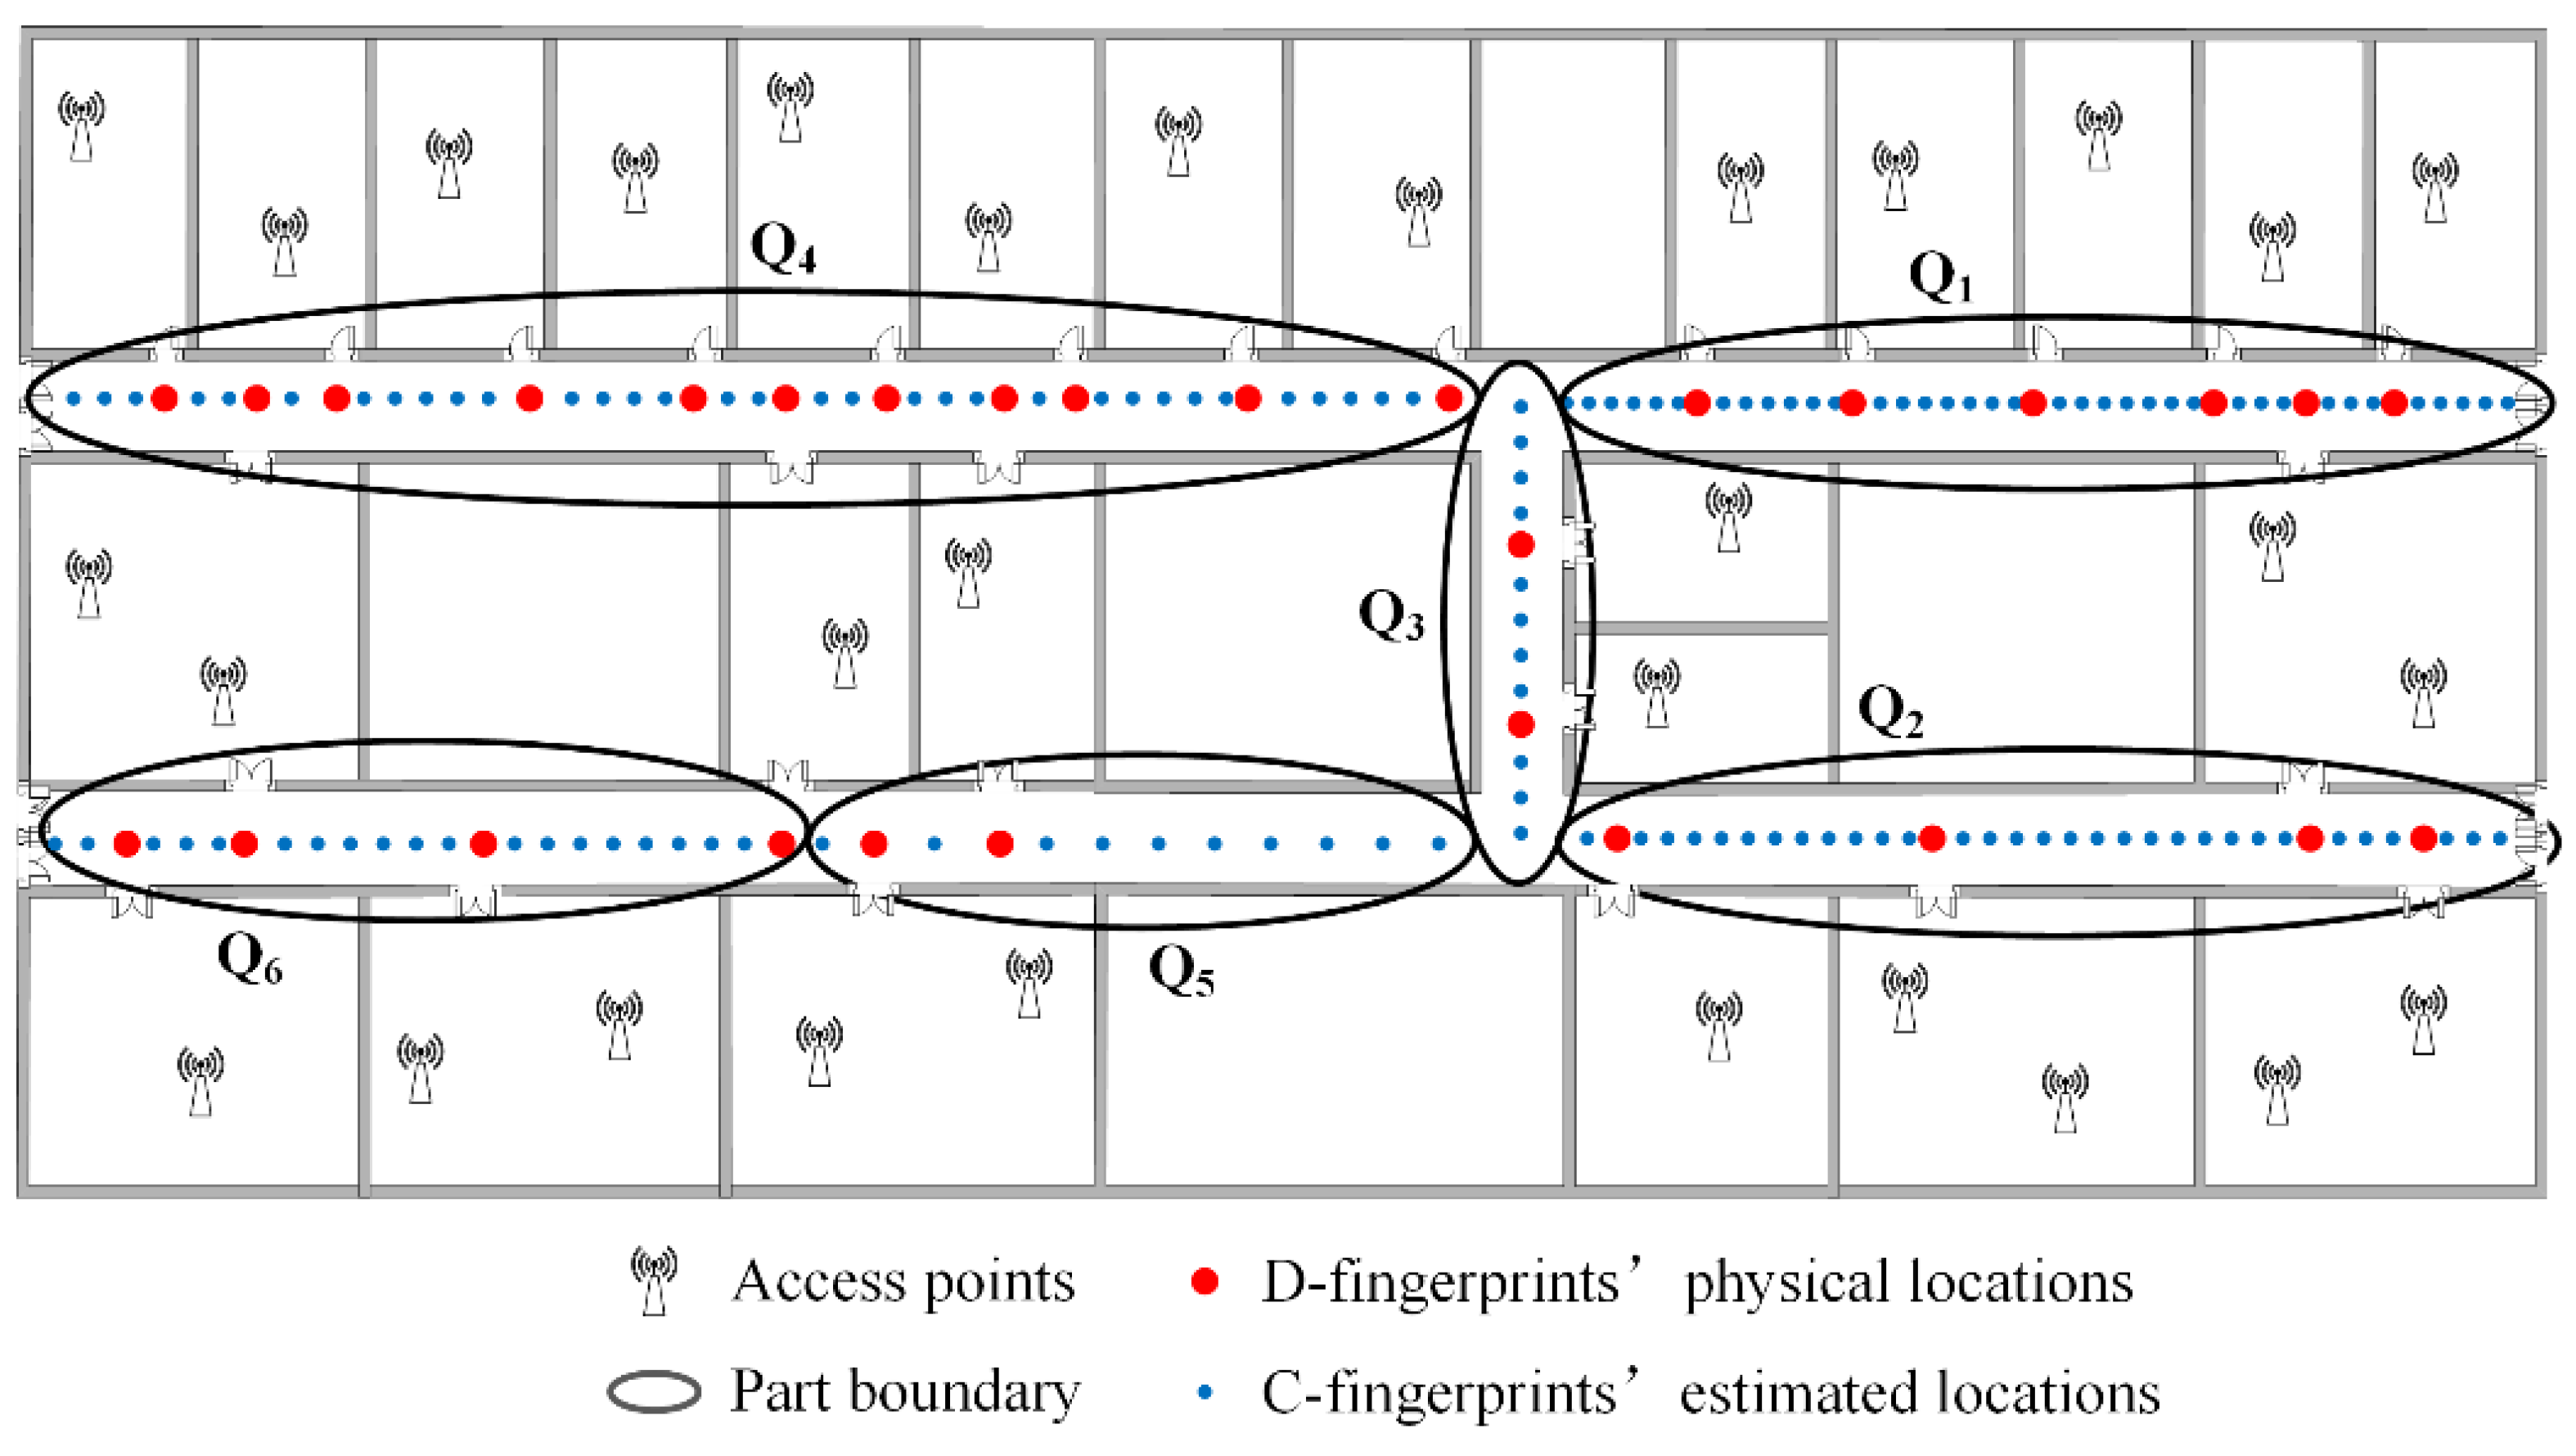
- C-fingerprints are selected. The crowdsourced fingerprints collected in the area are clustered using the AP-Cluster method to obtain the representative fingerprints (C-fingerprints), as the blue dots shown in Figure 13.
- (4)
- Fingerprints are partitioned. All fingerprints (D-fingerprints and C-fingerprints) in the area are partitioned to three parts: Q1, Q2 and Q3.
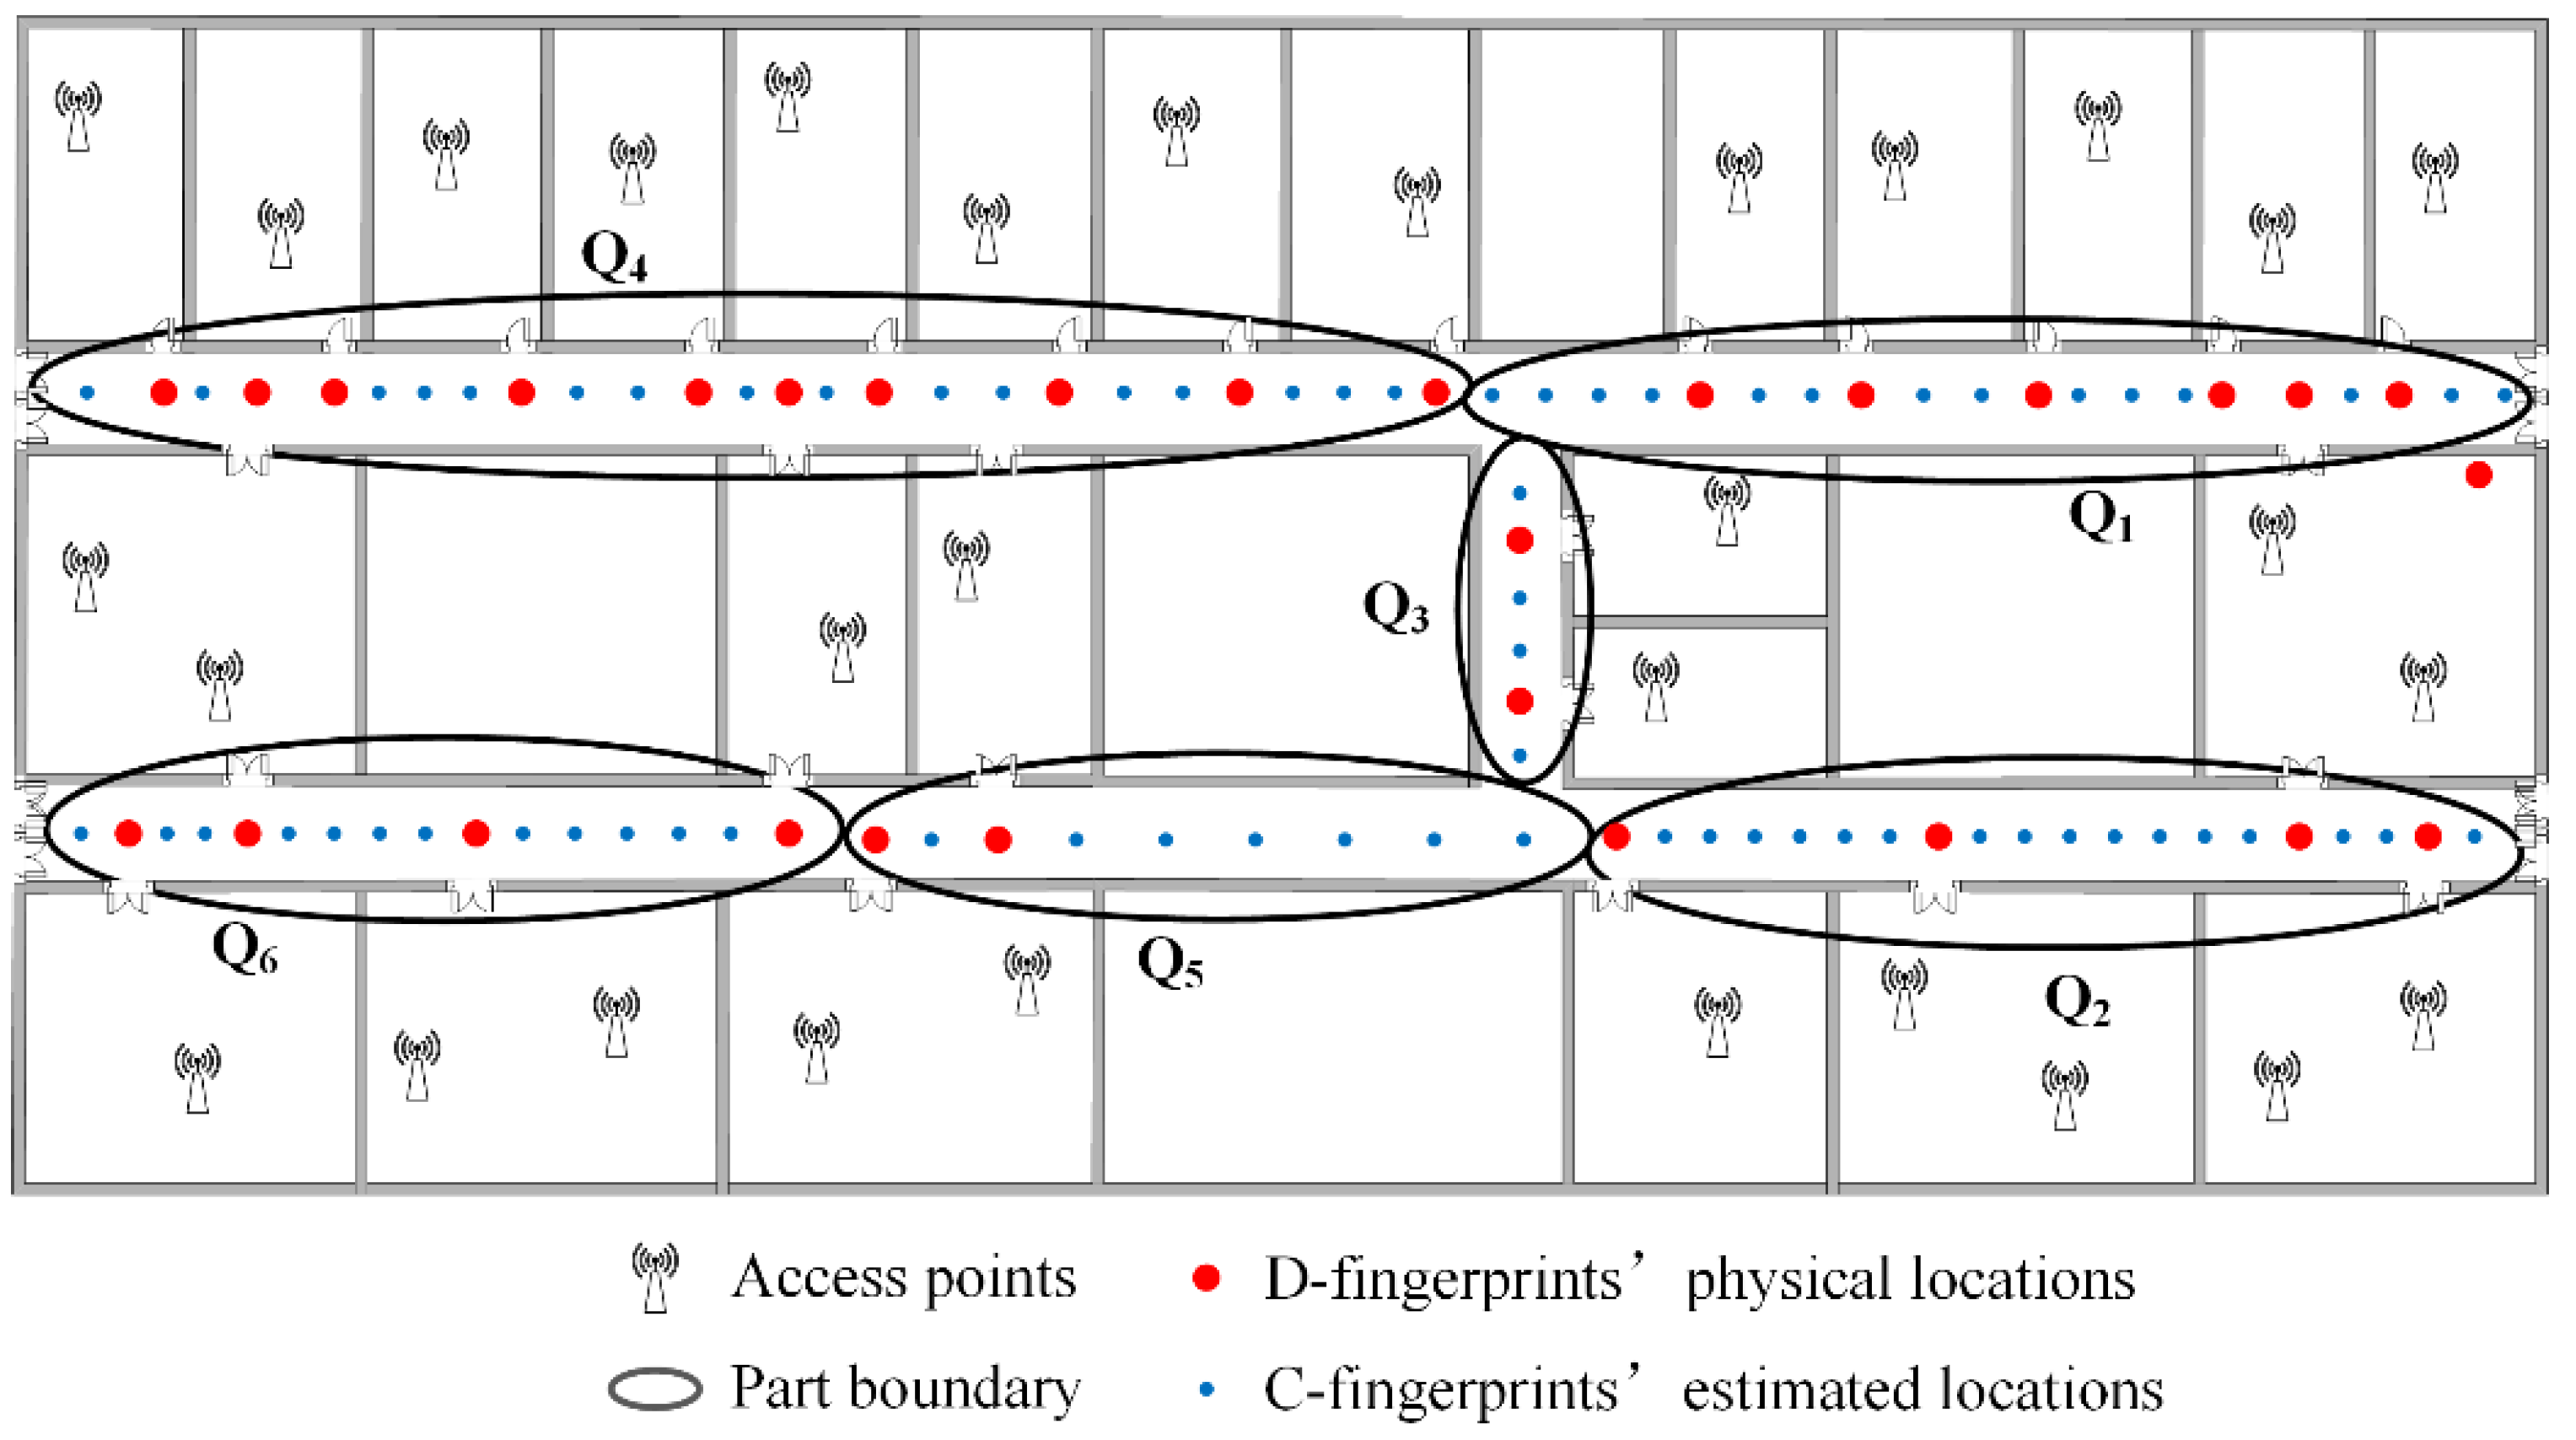
- (5)
- The radio-map is constructed. For every part, C-fingerprints’ physical locations can be calculated based on the similarity between D-fingerprints and C-fingerprints. When all C-fingerprints are linked to their corresponding physical locations, the radio map is constructed.
5. Performance Evaluation
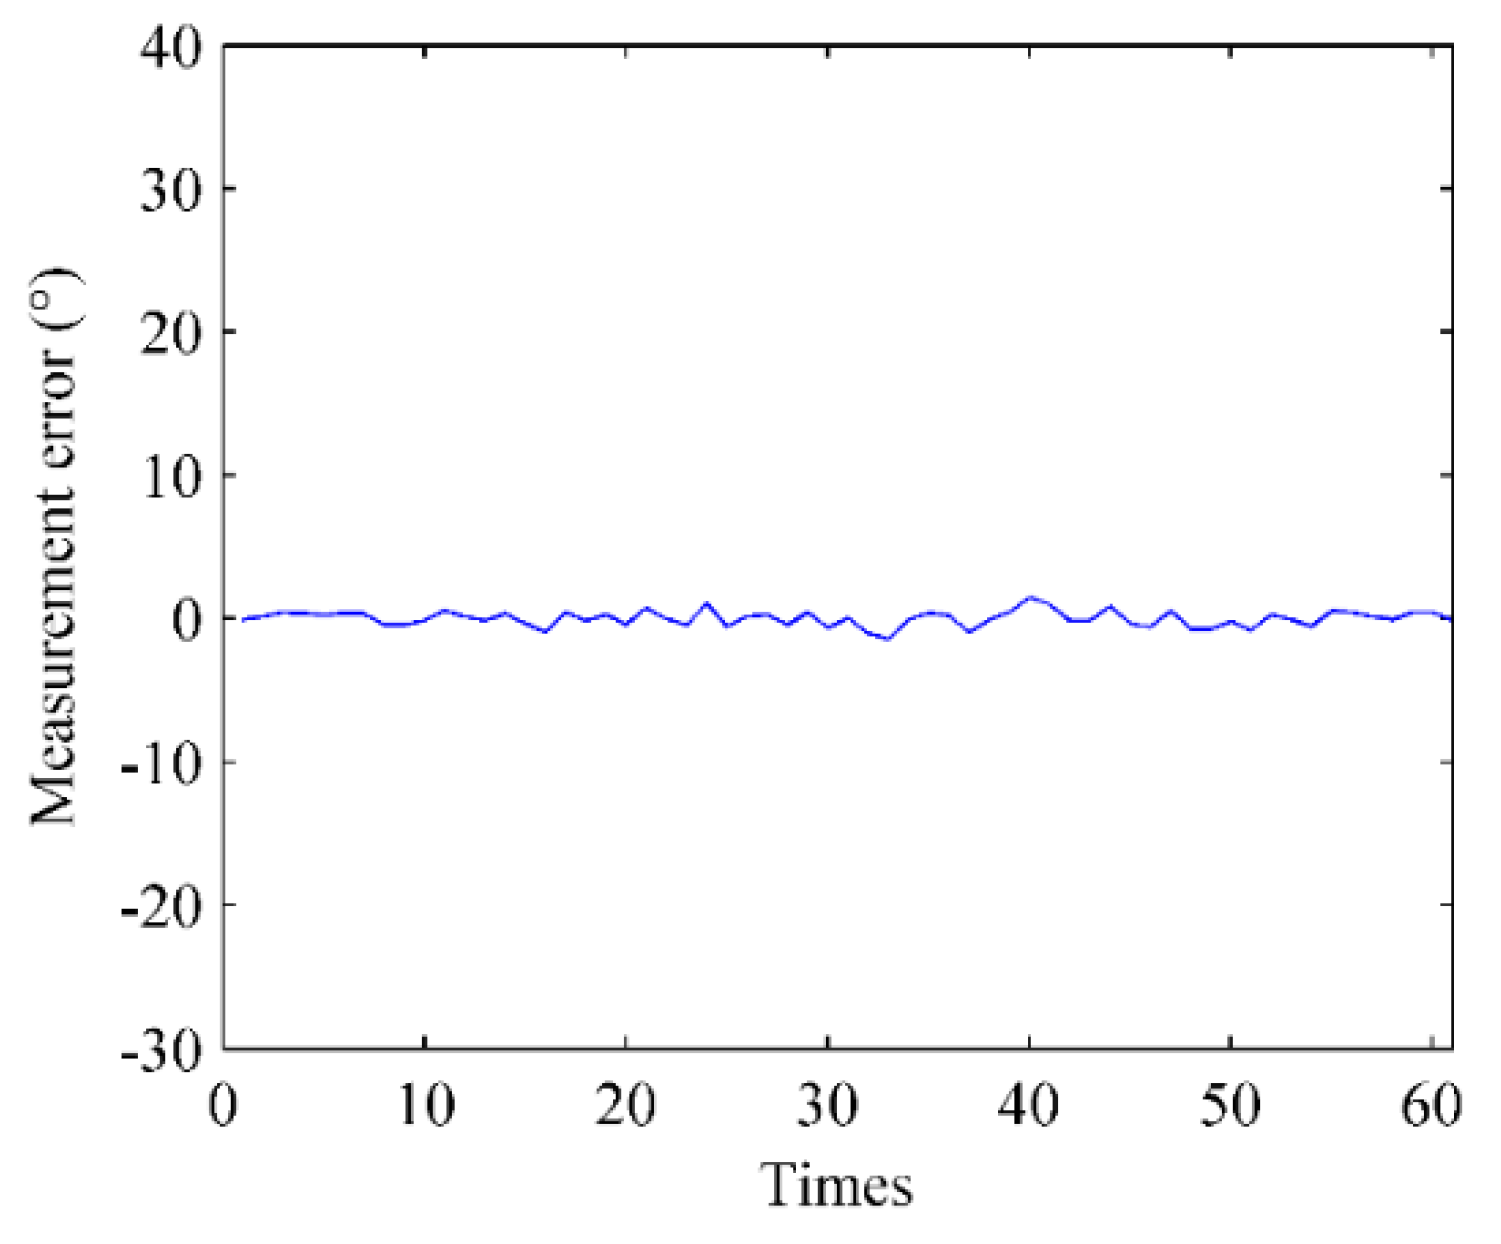
5.1. Smartphone Measurement Analysis
5.2. Results of Doors’ Fingerprint Recognition and Matching
5.3. Results of Radio-map Construction
5.4. Localization Results
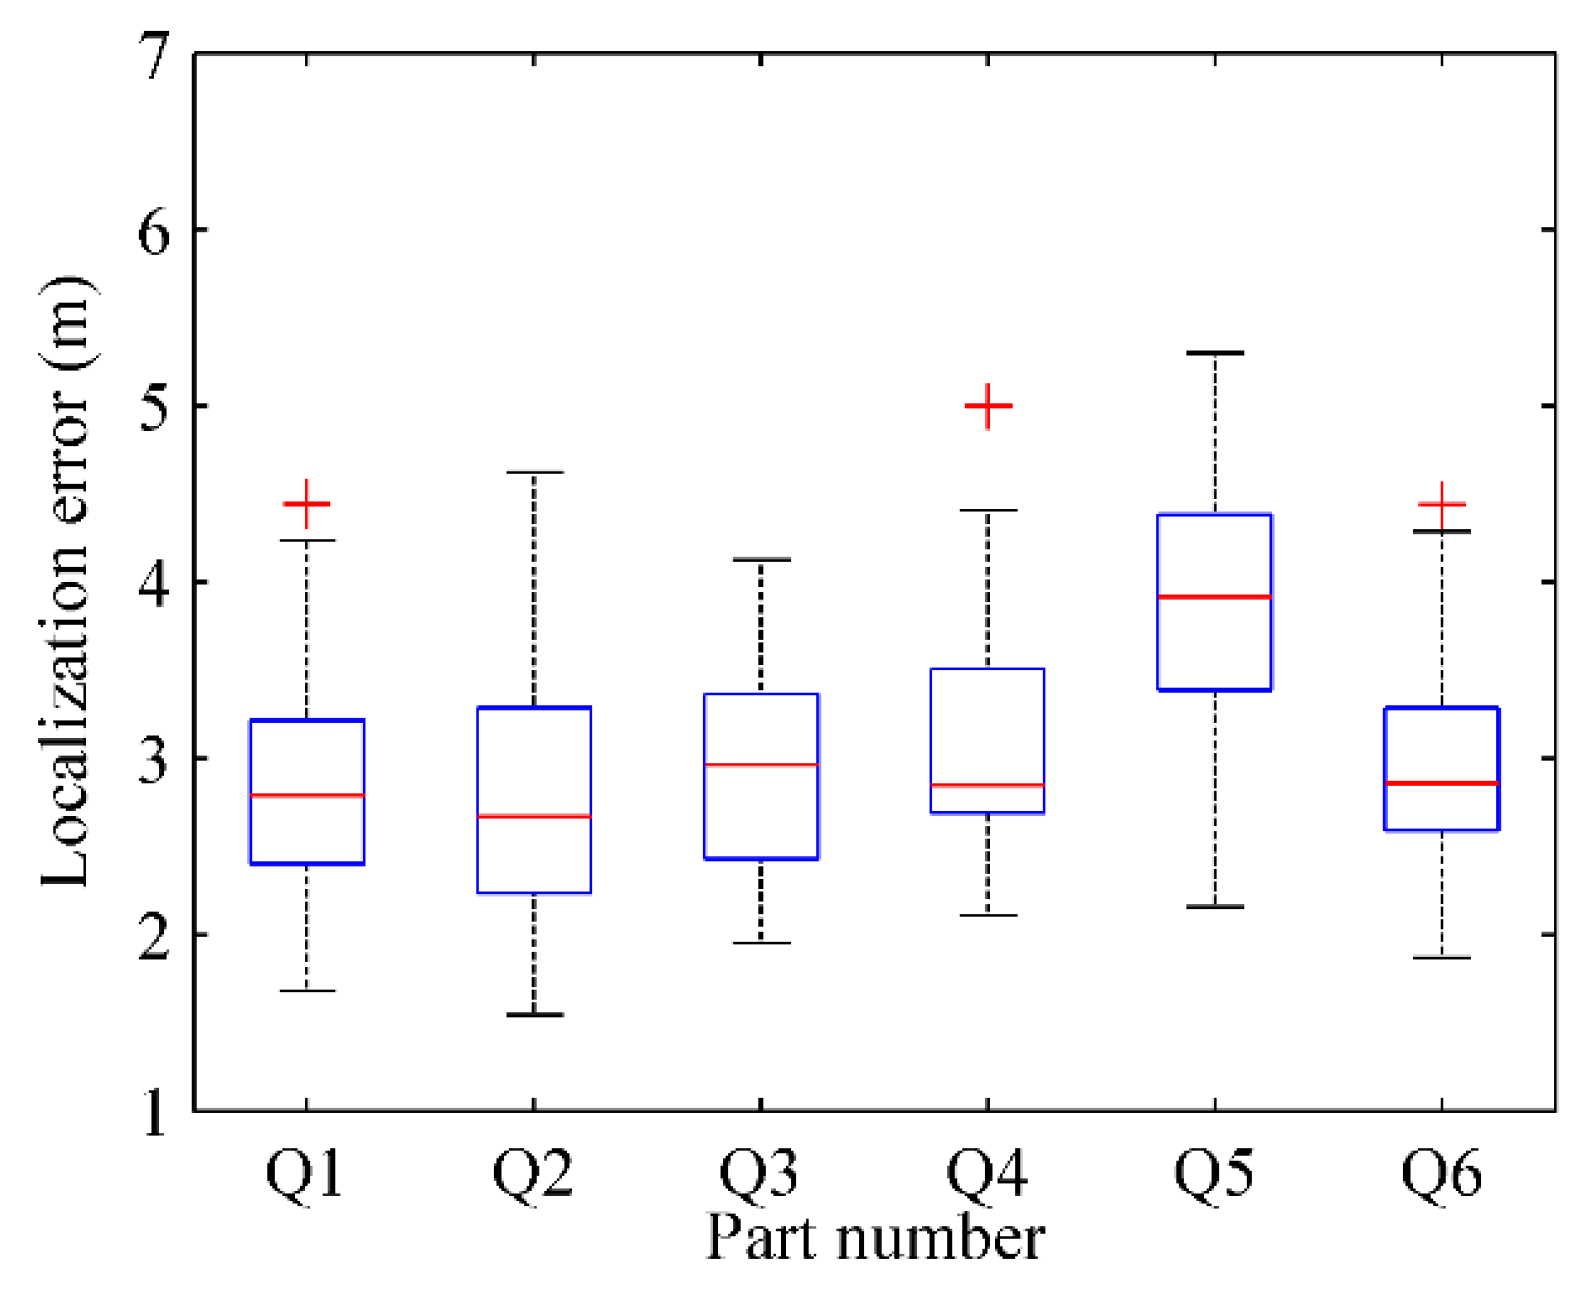
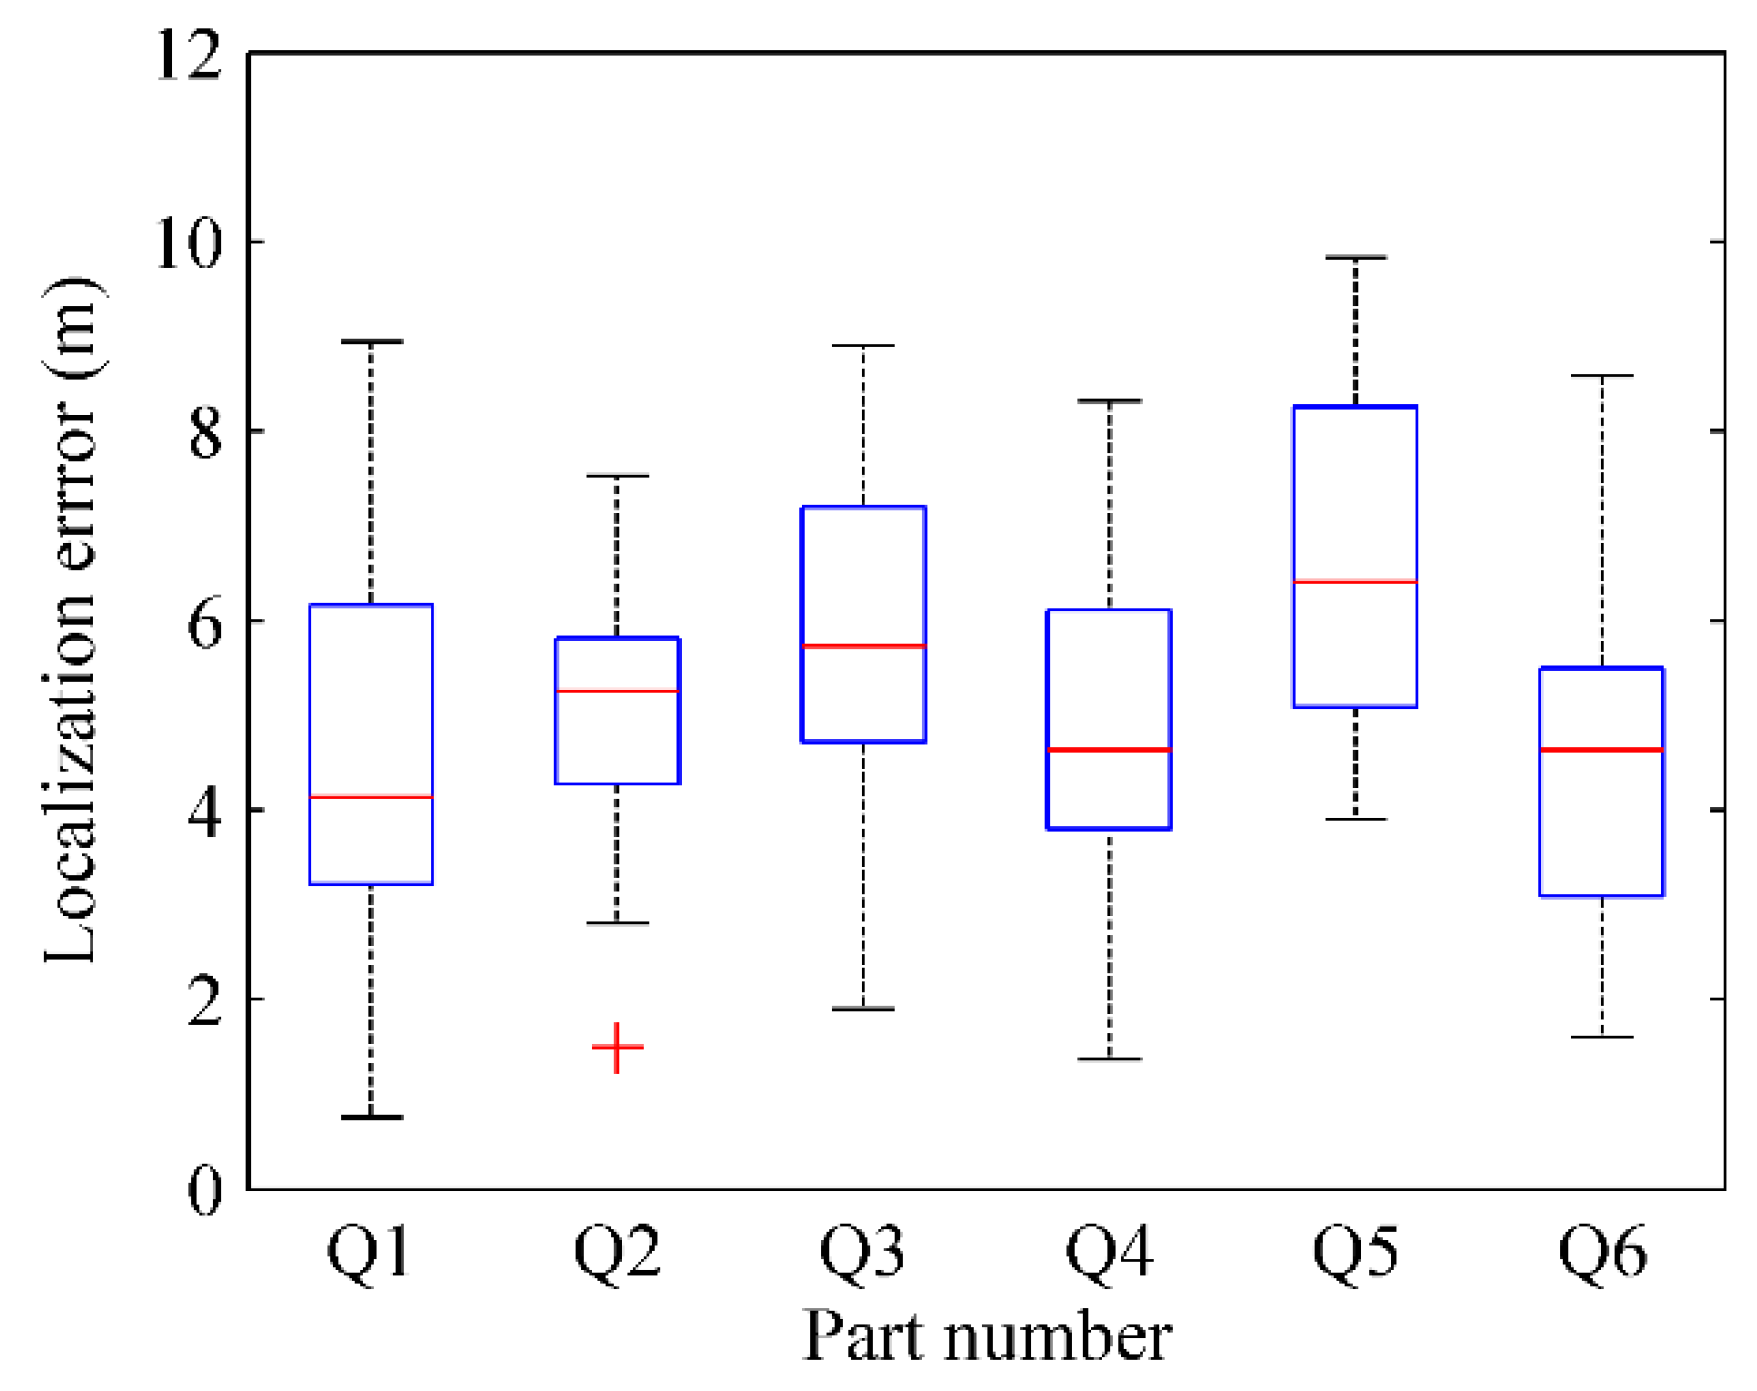
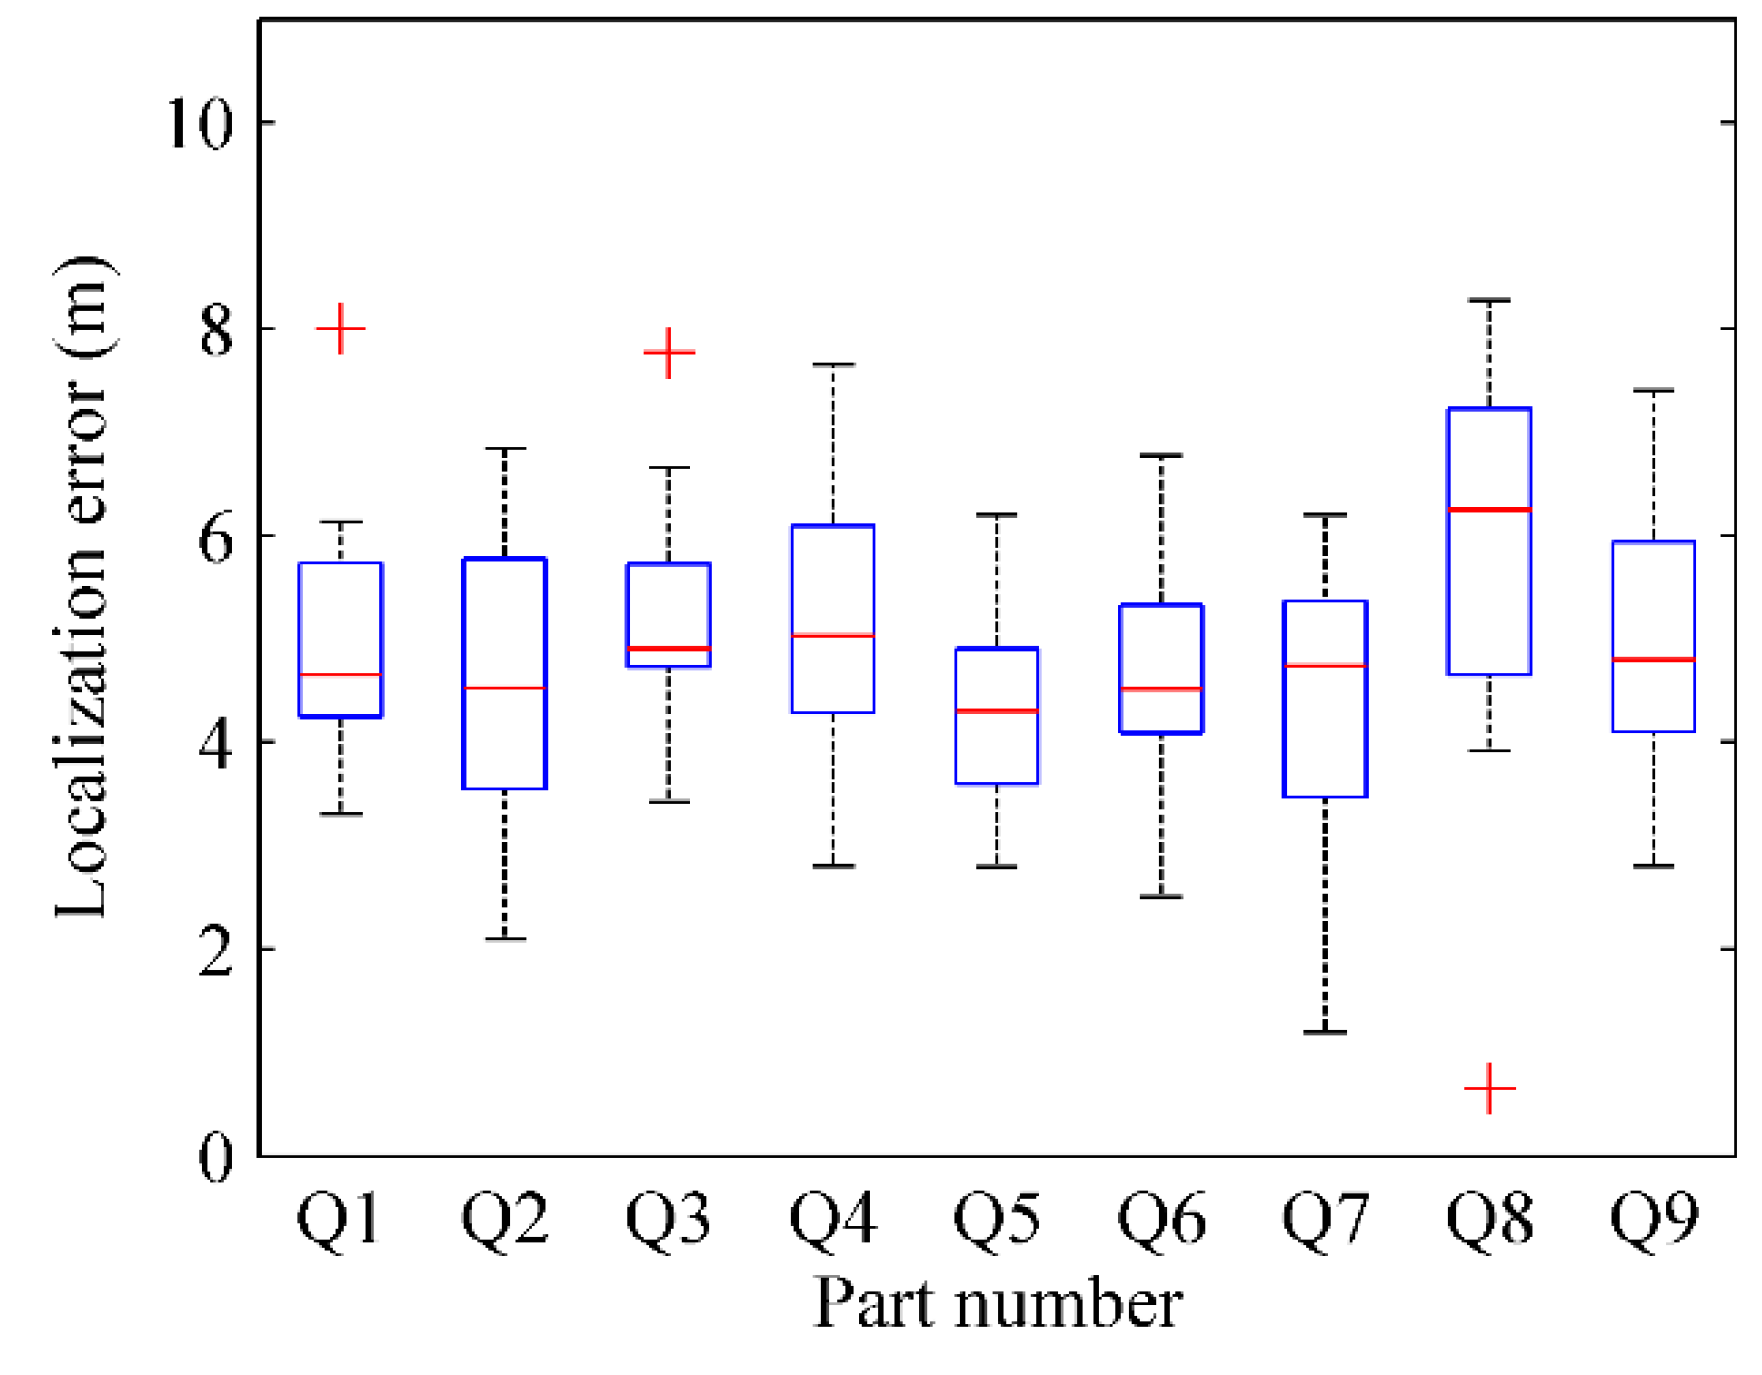
5.4.1. Localization Based on Parts of Radio-Map
5.4.2. Impact of Parameters on Localization
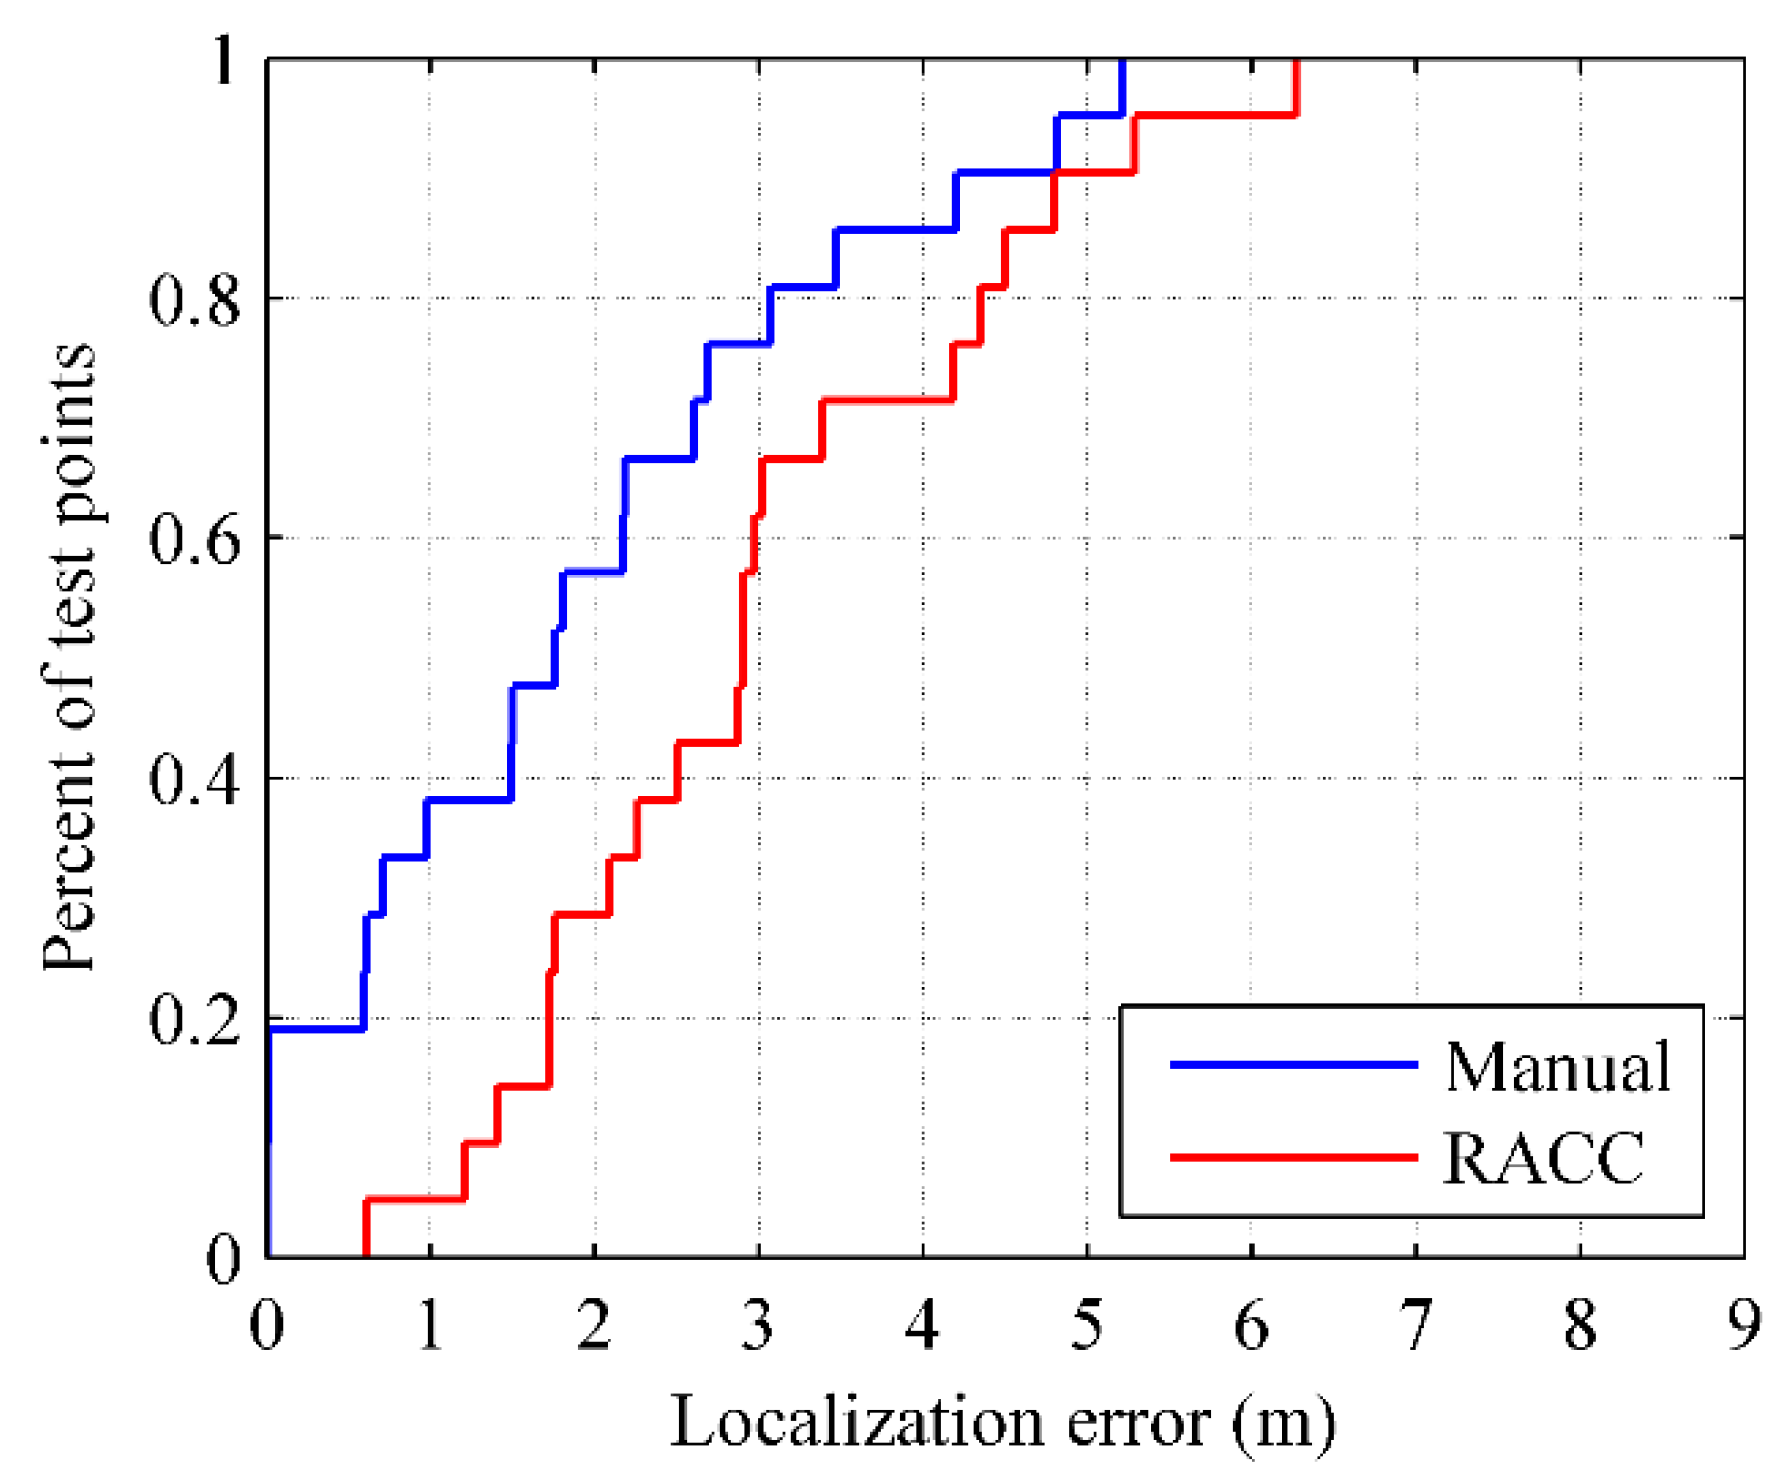
5.4.3. Comparison with Manual Calibration
5.4.4. Comparison with Other Localization Methods
6. Conclusions
Acknowledgments
Author Contributions
Conflicts of Interest
References
- Han, G.; Xu, H.H.; Duong, T.Q.; Jiang, J.F.; Hara, T. Localization algorithms of wireless sensor networks: A survey. Telecommun. Syst. 2013, 52, 2419–2436. [Google Scholar] [CrossRef]
- Ikeda, Y.; Hatano, H.; Fujii, M.; Ito, A.; Watanabe, Y. A study on GPS positioning method with assistance of a distance sensor. In Proceedings of the Fourteenth International Conference on Networks, Barcelona, Spain, 19–24 April 2015; pp. 109–114.
- Denkovski, D.; Angjelichinoski, M.; Atanasovski, V.; Gavrilovska, L. RSS-based self-localization framework for future wireless networks. Wirel. Pers. Commun. 2014, 78, 1755–1776. [Google Scholar] [CrossRef]
- Shen, J.; Molisch, A.F.; Salmi, J. Accurate passive location estimation using TOA measurements. IEEE Trans. Wirel. Commun. 2012, 11, 2182–2192. [Google Scholar] [CrossRef]
- Singh, P.; Agrawal, S. TDOA based node localization in WSN using neural networks. In Proceedings of the 2013 International Conference on Communication Systems and Network Technologies, Gwalior, India, 6–8 April 2013; pp. 400–404.
- Shao, H.J.; Zhang, X.P.; Wang, Z. Efficient closed-form algorithms for AOA based self-Localization of sensor nodes using auxiliary variables. IEEE Trans. Signal Proc. 2014, 62, 2580–2594. [Google Scholar] [CrossRef]
- Liu, H.; Darabi, H.; Banerjee, P.; Liu, J. Survey of wireless indoor positioning techniques and systems. IEEE Trans. Syst. Man Cybern. 2007, 37, 1067–1080. [Google Scholar] [CrossRef]
- Zhou, M.; Tian, Z.; Xu, K.; Yu, X.; Wu, H. Theoretical entropy assessment of fingerprint-based Wi-Fi localization accuracy. Expert Syst. Appl. 2013, 40, 6136–6149. [Google Scholar] [CrossRef]
- Kanaris, L.; Kokkinis, A.; Raspopoulos, M.; Liotta, A.; Stavrou, S. Improving RSS fingerprint-based localization using directional antennas. In Proceedings of the 8th European Conference on Antennas and Propagation, Hague, Holland, 6–11 April 2014; pp. 1593–1597.
- Stella, M.; Russo, M.; Begušić, D. Fingerprinting based localization in heterogeneous wireless networks. Expert Syst. Appl. 2014, 41, 6738–6747. [Google Scholar] [CrossRef]
- Ding, G.; Tan, Z.; Wu, J.; Zhang, J.B. Efficient indoor fingerprinting localization technique using regional propagation model. IEICE Trans. Commun. 2014, 97, 1728–1741. [Google Scholar] [CrossRef]
- Ma, R.; Guo, Q.; Hu, C.; Xue, J. An improved WiFi indoor positioning algorithm by weighted fusion. Sensors 2015, 15, 21824–21843. [Google Scholar] [CrossRef] [PubMed]
- Sun, Y.; Liu, M.; Meng, M.Q.H. WiFi signal strength-based robot indoor localization. In Proceedings of the ICIA, Hailar, China, 28–30 July 2014; pp. 250–256.
- Rai, A.; Chintalapudi, K.K.; Padmanabhan, V.N.; Sen, R. Zee: Zero-effort crowdsourcing for indoor localization. In Proceedings of the 18th annual international conference on Mobile computing and networking, Istanbul, Turkey, 22–26 August 2012; pp. 293–304.
- Su, X.; Tong, H.; Ji, P. Activity recognition with smartphone sensors. Tsinghua Sci. Technol. 2014, 19, 235–249. [Google Scholar]
- Bahl, P.; Padmanabhan, V.N. RADAR: An in-building RF-based user location and tracking system. In Proceedings of the IEEE INFOCOM, Tel Aviv, Israel, 26–30 March 2000; pp. 775–784.
- Castro, P.; Chiu, P.; Kremenek, T.; Muntz, R. A probabilistic room location service for wireless networked environments. In Proceedings of the Ubicomp’01, Atlanta, GA, USA, 30 September–2 October 2001; pp. 18–34.
- Roos, T.; Myllymäki, P.; Tirri, H.; Misikangas, P.; Sievänen, J. A probabilistic approach to WLAN user location estimation. Int. J. Wirel. Inf. Netw. 2002, 9, 155–164. [Google Scholar] [CrossRef]
- Youssef, M.; Agrawala, A. The Horus location determination system. Wirel. Netw. 2008, 14, 357–374. [Google Scholar] [CrossRef]
- Brunato, M.; Battiti, R. Statistical learning theory for location fingerprinting in wireless LANs. Comput. Netw. 2005, 47, 825–845. [Google Scholar] [CrossRef]
- Battiti, R.; Le, N.T.; Villani, A. Location-aware computing: A neural network model for determining location in wireless LANs. Int. Semicond. Conf. 2002, 4, 175–179. [Google Scholar]
- Laoudias, C.; Eliades, D.G.; Kemppi, P. Indoor localization using neural networks with location fingerprints. In Proceedings of the ICANN ’09, Limassol, Cyprus, 14–17 September 2009; pp. 954–963.
- Yin, J.; Yang, Q.; Ni, L. Adaptive temporal radio maps for indoor location estimation. In Proceedings of the PerCom ’05, Auai Island, HI, USA, 8–12 March 2005; pp. 85–94.
- Pan, J.J.; Pan, S.J.; Yin, J.; Ni, L.M.; Yang, Q. Tracking mobile users in wireless networks via semi-supervised co-localization. IEEE Trans. Pattern Anal. Mach. Intell. 2012, 34, 587–600. [Google Scholar] [CrossRef] [PubMed]
- Au, A.W.S.; Chen, F.; Valaee, S.; Reyes, S.; Sorour, S.; Markowitz, S.N.; Gold, D.; Gordon, K.; Eizenman, M. Indoor tracking and navigation using received signal strength and compressive sensing on a mobile device. IEEE Trans. Mob. Comput. 2013, 12, 2050–2062. [Google Scholar] [CrossRef]
- Qiu, K.; Zhang, F.; Liu, M. Visible light communication-based indoor localization using Gaussian Process. In Proceedings of the IROS, Hamburg, Germany, 28 September–2 October 2015; pp. 3125–3130.
- Bolliger, P. Redpin: Adaptive, zero-configuration indoor localization through user collaboration. In Proceedings of the MELT ’08, San Francisco, CA, USA, 19 September 2008; pp. 55–60.
- Lee, M.; Yang, H.; Han, D.; Yu, C. Crowdsourced radiomap for room-level place recognition in urban environment. In Proceedings of the 8th International Conference on PERCOM Workshops, Mannheim, Germany, 29 March–2 April 2010; pp. 648–653.
- Yang, S.; Dessai, P.; Verma, M.; Gerla, M. FreeLoc: Calibration-free crowdsourced indoor localization. In Proceedings of the INFOCOM, Turin, Italy, 14–19 April 2013; pp. 2481–2489.
- Park, J.; Charrow, B.; Curtis, D.; Battat, J. Growing an organic indoor location system. In Proceedings of the 8th international conference on Mobile Systems, Applications and Services, San Francisco, CA, USA, 15–18 June 2010; pp. 271–284.
- Ledlie, J.; Park, J.G.; Curtis, D.; Cavalcante, A.; Camara, L.; Costa, A.; Vieira, R. Molé: A scalable, user-generated WiFi positioning engine. J. Locat. Based Serv. 2012, 6, 21–23. [Google Scholar] [CrossRef]
- Sorour, S.; Lostanlen, Y.; Valaee, S. Reduced-effort generation of indoor radio maps using crowdsourcing and manifold alignment. In Proceedings of the IST ’12, Tehran, Iran, 6–8 November 2012; pp. 354–358.
- Azizyan, M.; Constandache, I.; Choundhury, R.R. SurroundSense: Mobile phone localization via ambience fingerprinting. In Proceedings of the MoiCom ’09, Beijing, China, 20–25 September 2009; pp. 261–272.
- Wu, C.; Yang, Z.; Liu, Y.; Xi, W. WILL: Wireless indoor localization without site survey. IEEE Trans. Parallel Distrib. Syst. 2012, 24, 64–72. [Google Scholar]
- Wu, C.; Yang, Z.; Liu, Y. Smartphones based crowdsourcing for indoor localization. IEEE Trans. Mob. Comput. 2015, 14, 444–457. [Google Scholar] [CrossRef]
- Alzantot, M.; Youssef, M. CrowdInside: Automatic construction of indoor floorplans. In Proceedings of the ACM SIGSPATIAL GIS’12, Redondo Beach, CA, USA, 6–9 November 2012; pp. 99–108.
- Frey, B.J.; Delbert, D. Clustering by passing messages between data points. Science 2007, 315, 972–976. [Google Scholar] [CrossRef] [PubMed]
- Sssikumar, P.; Khara, S. K-means clustering in wireless sensor networks. In Proceedings of the IEEE Fourth International Conference on Computational Intelligence and Communication Networks, Mathura, India, 3–5 November 2012; pp. 140–144.


| Croudsourced Data | ||||||
|---|---|---|---|---|---|---|
| User ID | ID | |||||
| Data Type | RSS Fingerprints | Acceleration | Walking Direction | Rotational Angular Velocity | ||
| Time | AP | RSS | ||||
| t1 | ||||||
| t2 | ||||||
| … | … | … | … | … | … | |
| ts | ||||||
| Floor Area (m2) | 3600 | Sampling Frequency | 1 Hz |
|---|---|---|---|
| Corridor area (m2) | 385 | Sampling time | 8:00~18:00 |
| Number of volunteers | 10 |
| Fingerprint Groups Number | Number of User Traces | Fingerprint Groups Number | Number of User Traces | Fingerprint Groups Number | Number of User Traces | Fingerprint Groups Number | Number of User Traces |
|---|---|---|---|---|---|---|---|
| 1 | 54 | 11 | 38 | 21 | 24 | 31 | 16 |
| 2 | 52 | 12 | 36 | 22 | 24 | 32 | 6 |
| 3 | 52 | 13 | 32 | 23 | 22 | 33 | 5 |
| 4 | 50 | 14 | 28 | 24 | 22 | 34 | 3 |
| 5 | 50 | 15 | 28 | 25 | 22 | 35 | 2 |
| 6 | 46 | 16 | 28 | 26 | 20 | 36 | 2 |
| 7 | 44 | 17 | 26 | 27 | 18 | 37 | 1 |
| 8 | 44 | 18 | 26 | 28 | 18 | 38 | 1 |
| 9 | 42 | 19 | 26 | 29 | 18 | 39 | 1 |
| 10 | 40 | 20 | 26 | 30 | 18 | 40 | 1 |
| Part Number | Part Length (m) | Number of Doors | Number of RSS Fingerprints after Clustering | Average Distance between Fingerprints (m) |
|---|---|---|---|---|
| Q1 | 20 | 4 | 9 | 2.22 |
| Q2 | 16 | 2 | 7 | 2.29 |
| Q3 | 39 | 4 | 21 | 1.86 |
| Q4 | 15 | 2 | 6 | 2.50 |
| Q5 | 20 | 4 | 11 | 1.82 |
| Q6 | 15 | 3 | 8 | 1.88 |
| Q7 | 19 | 4 | 10 | 1.90 |
| Q8 | 25 | 2 | 10 | 2.50 |
| Q9 | 26 | 4 | 14 | 1.86 |
| SUM | 195 | 29 | 96 | 2.03 |
| Method | Sensors | Floor Plan | Experimental Areas | Reported 50%ile Accuracy | Reported 80%ile Accuracy | Fingerprint Density |
|---|---|---|---|---|---|---|
| Zee | Accelerometer | Yes | Corridor | 7 m (ZeeHorus) | 13 m (ZeeHorus) | - |
| 6 m (ZeeEZ) | 13 m (ZeeEZ) | |||||
| 1.2 m (ZeeHorus-Path Only) | 3 m (ZeeHorus-Path Only) | |||||
| Gyroscope | ||||||
| 1.0 m (ZeeEZ-Path Only) | 2.3 m (ZeeEZ-Path Only) | |||||
| Compass | ||||||
| LIFS | Accelerometer | Yes | Corridor & Room | 4.5 m (LIFS) | 7 m (LIFS) | /4 m2 |
| 1.5 m (LIFS-TM) | 3.5 m (LIFS-TM) | |||||
| RACC | Accelerometer | Yes | Corridor | 1.7 m | 2.2 m | /1 m |
| Gyroscope | ||||||
| Compass | ||||||
| 2.9 m | 4.3 m | /2 m |
© 2016 by the authors; licensee MDPI, Basel, Switzerland. This article is an open access article distributed under the terms and conditions of the Creative Commons by Attribution (CC-BY) license (http://creativecommons.org/licenses/by/4.0/).
Share and Cite
Yu, N.; Xiao, C.; Wu, Y.; Feng, R. A Radio-Map Automatic Construction Algorithm Based on Crowdsourcing. Sensors 2016, 16, 504. https://doi.org/10.3390/s16040504
Yu N, Xiao C, Wu Y, Feng R. A Radio-Map Automatic Construction Algorithm Based on Crowdsourcing. Sensors. 2016; 16(4):504. https://doi.org/10.3390/s16040504
Chicago/Turabian StyleYu, Ning, Chenxian Xiao, Yinfeng Wu, and Renjian Feng. 2016. "A Radio-Map Automatic Construction Algorithm Based on Crowdsourcing" Sensors 16, no. 4: 504. https://doi.org/10.3390/s16040504
APA StyleYu, N., Xiao, C., Wu, Y., & Feng, R. (2016). A Radio-Map Automatic Construction Algorithm Based on Crowdsourcing. Sensors, 16(4), 504. https://doi.org/10.3390/s16040504