
Human Detection Based on the Generation of a Background Image and Fuzzy System by Using a Thermal Camera

Abstract
:1. Introduction
- -
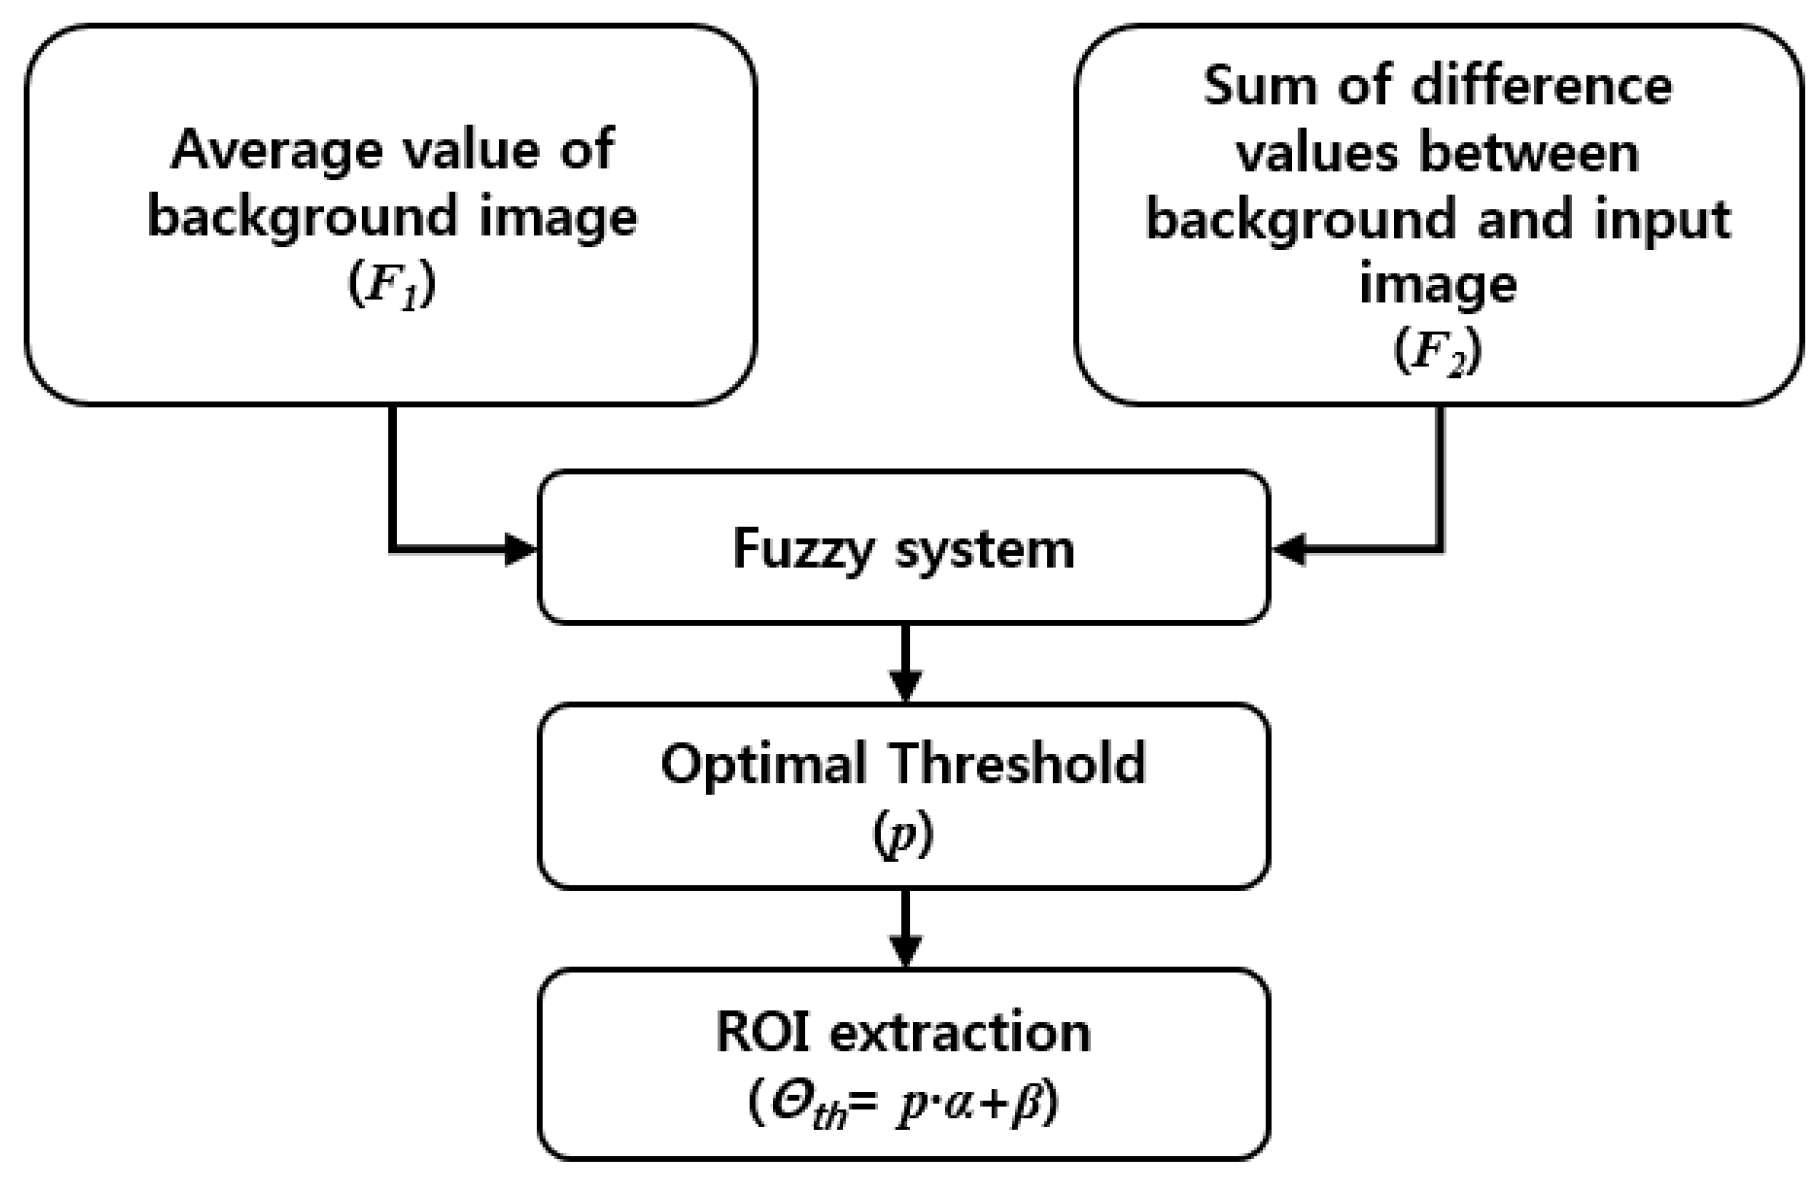
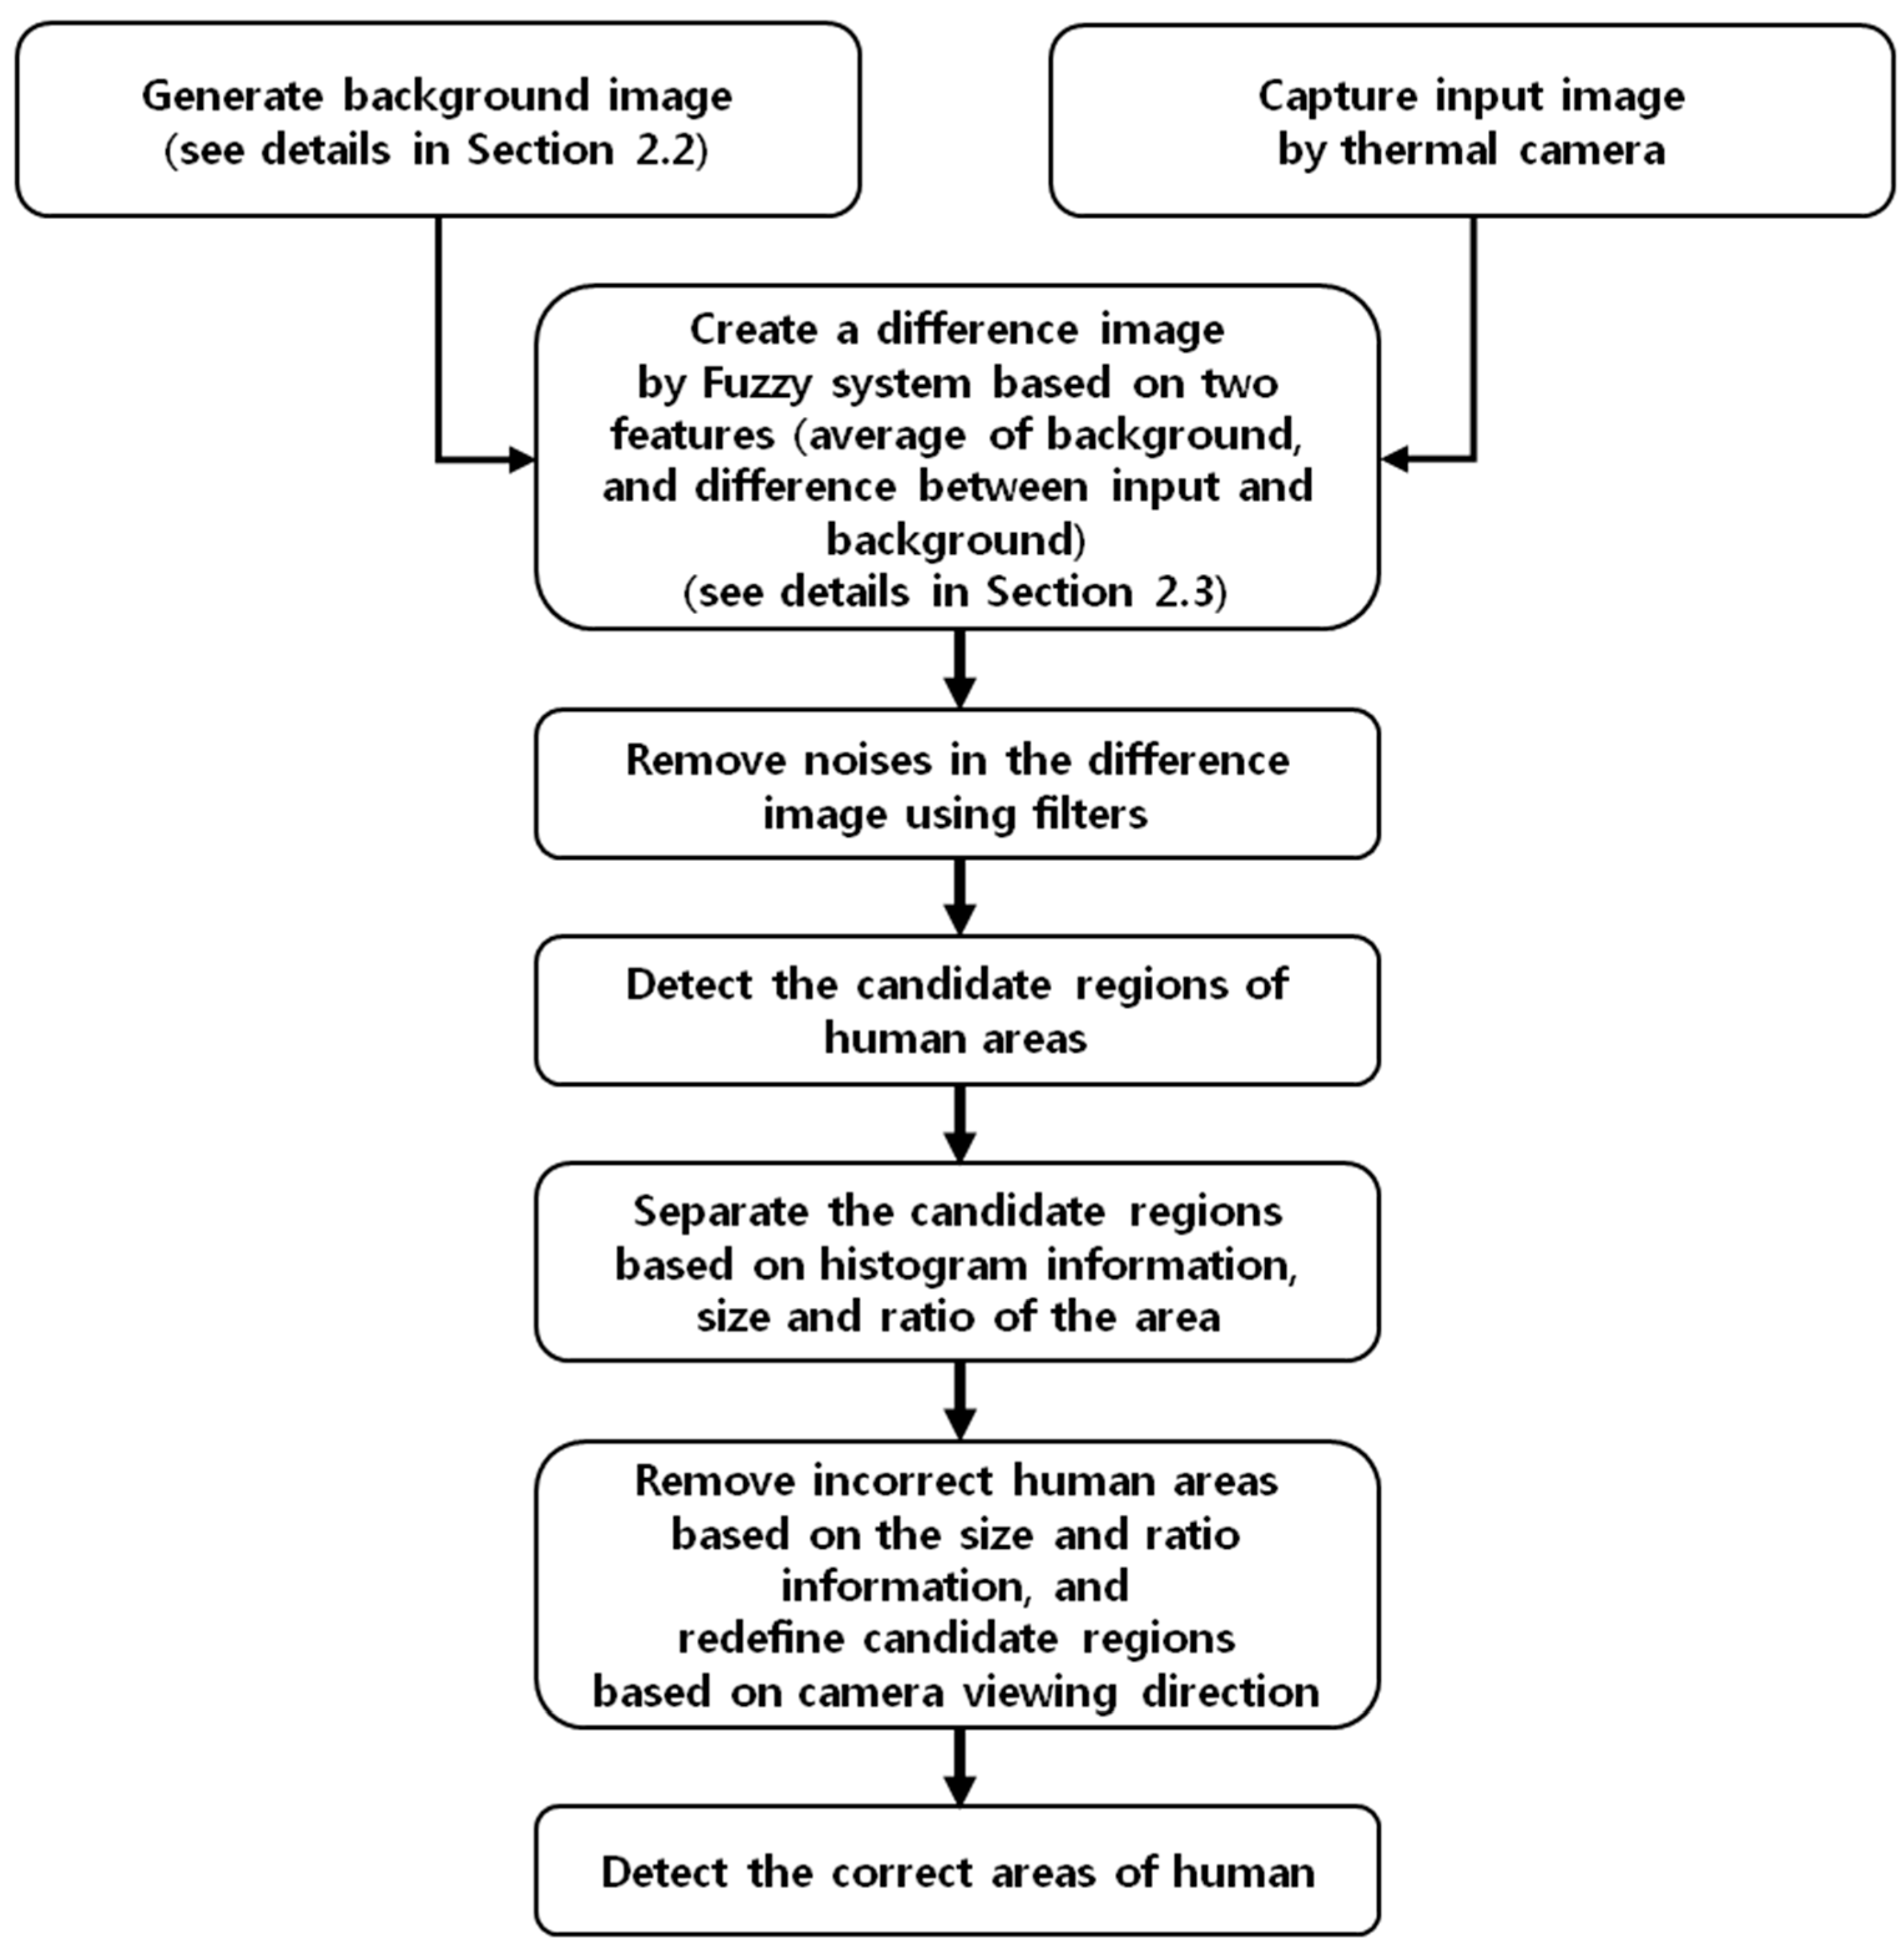
- First, the threshold for background subtraction is adaptively determined based on a fuzzy system. This system uses the information derived from the background image and difference values between the background and input image.
- -
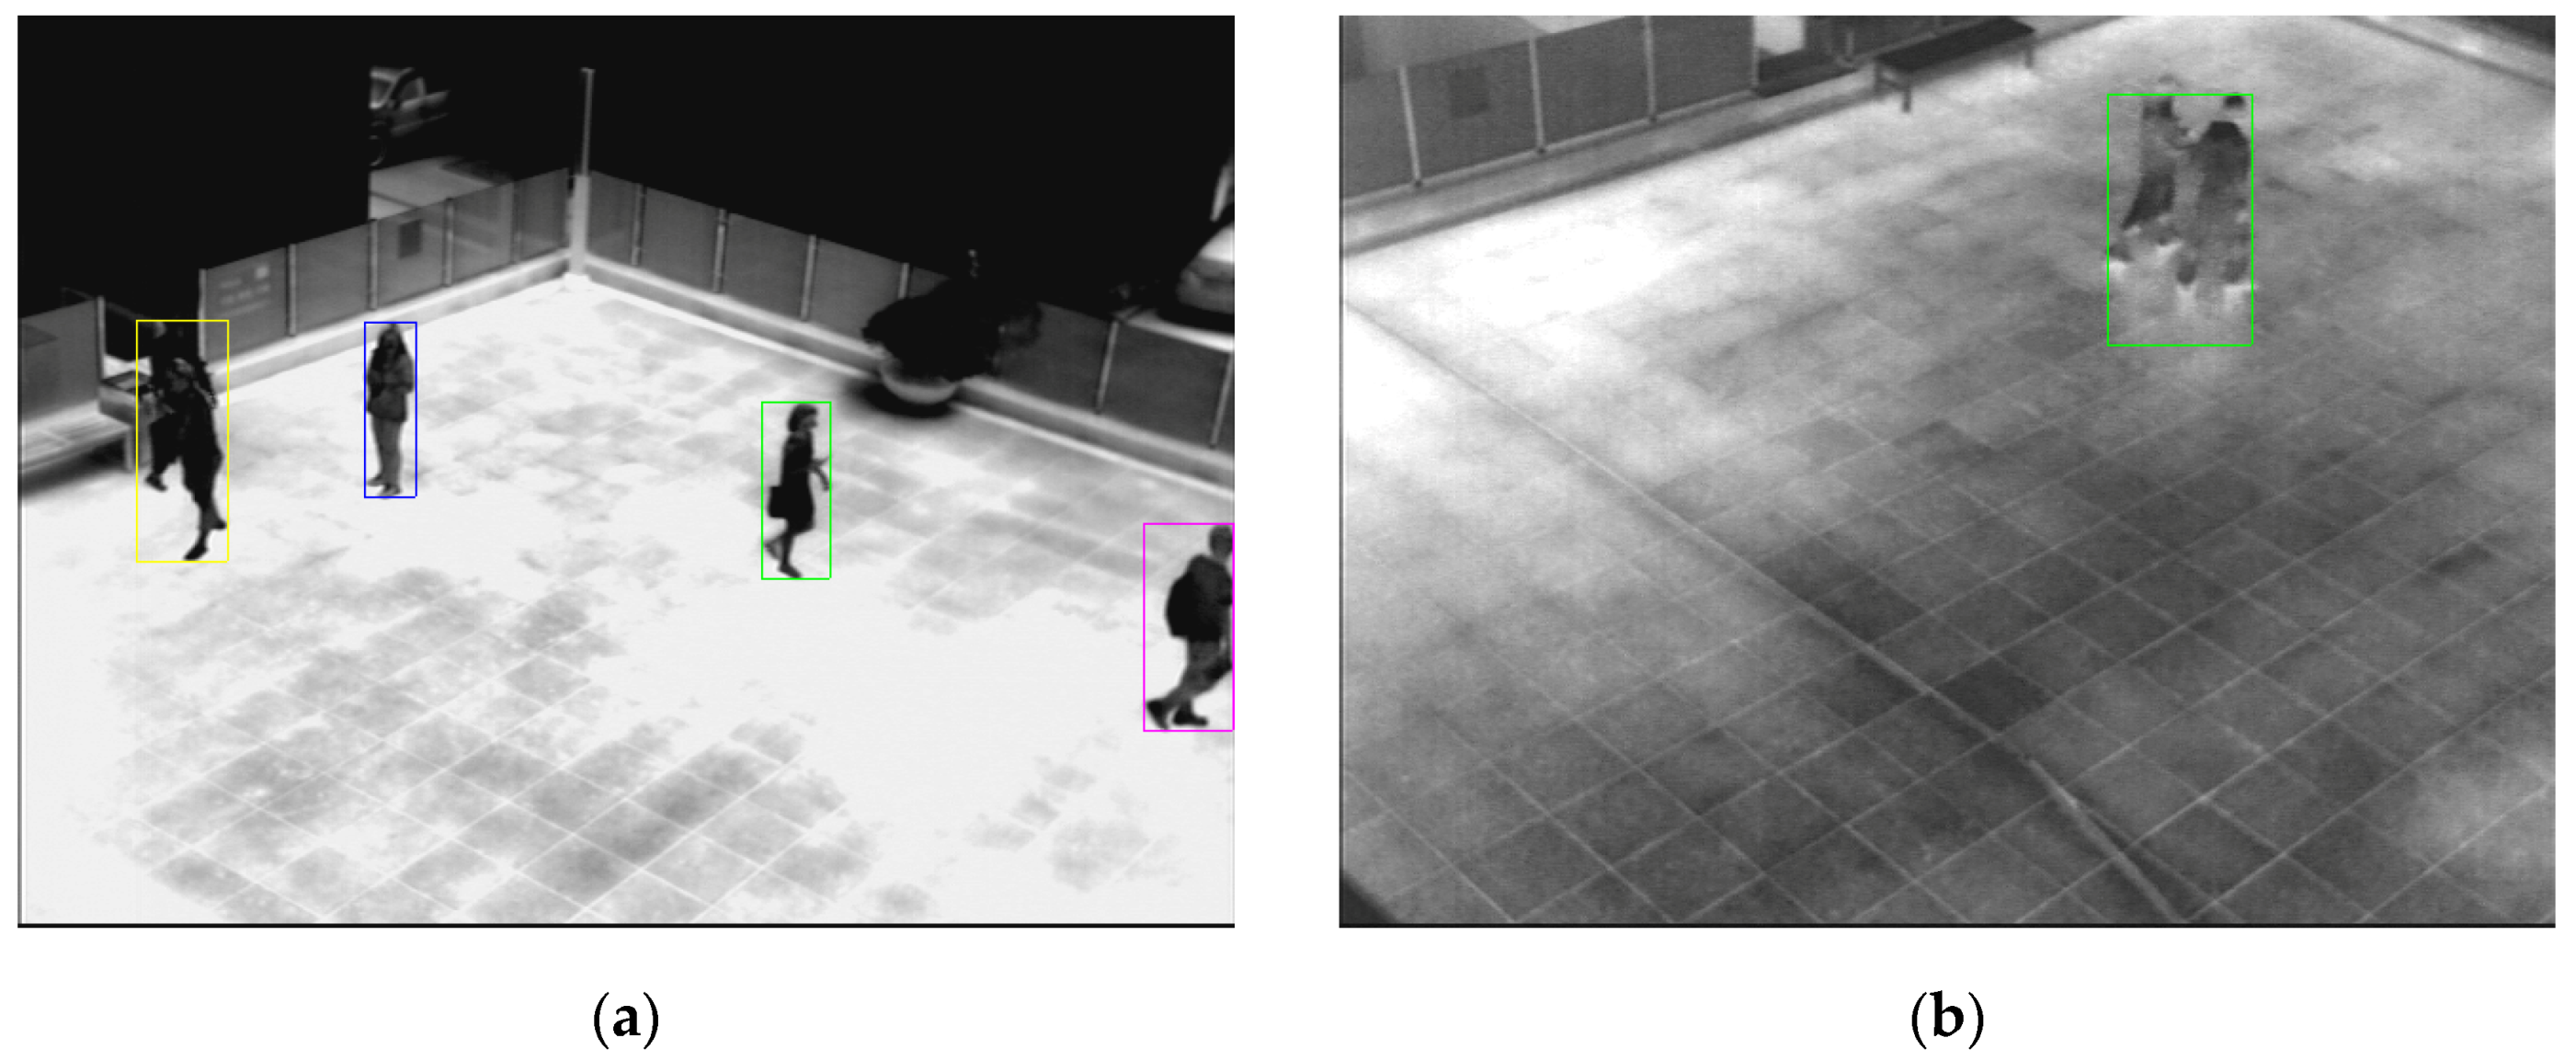
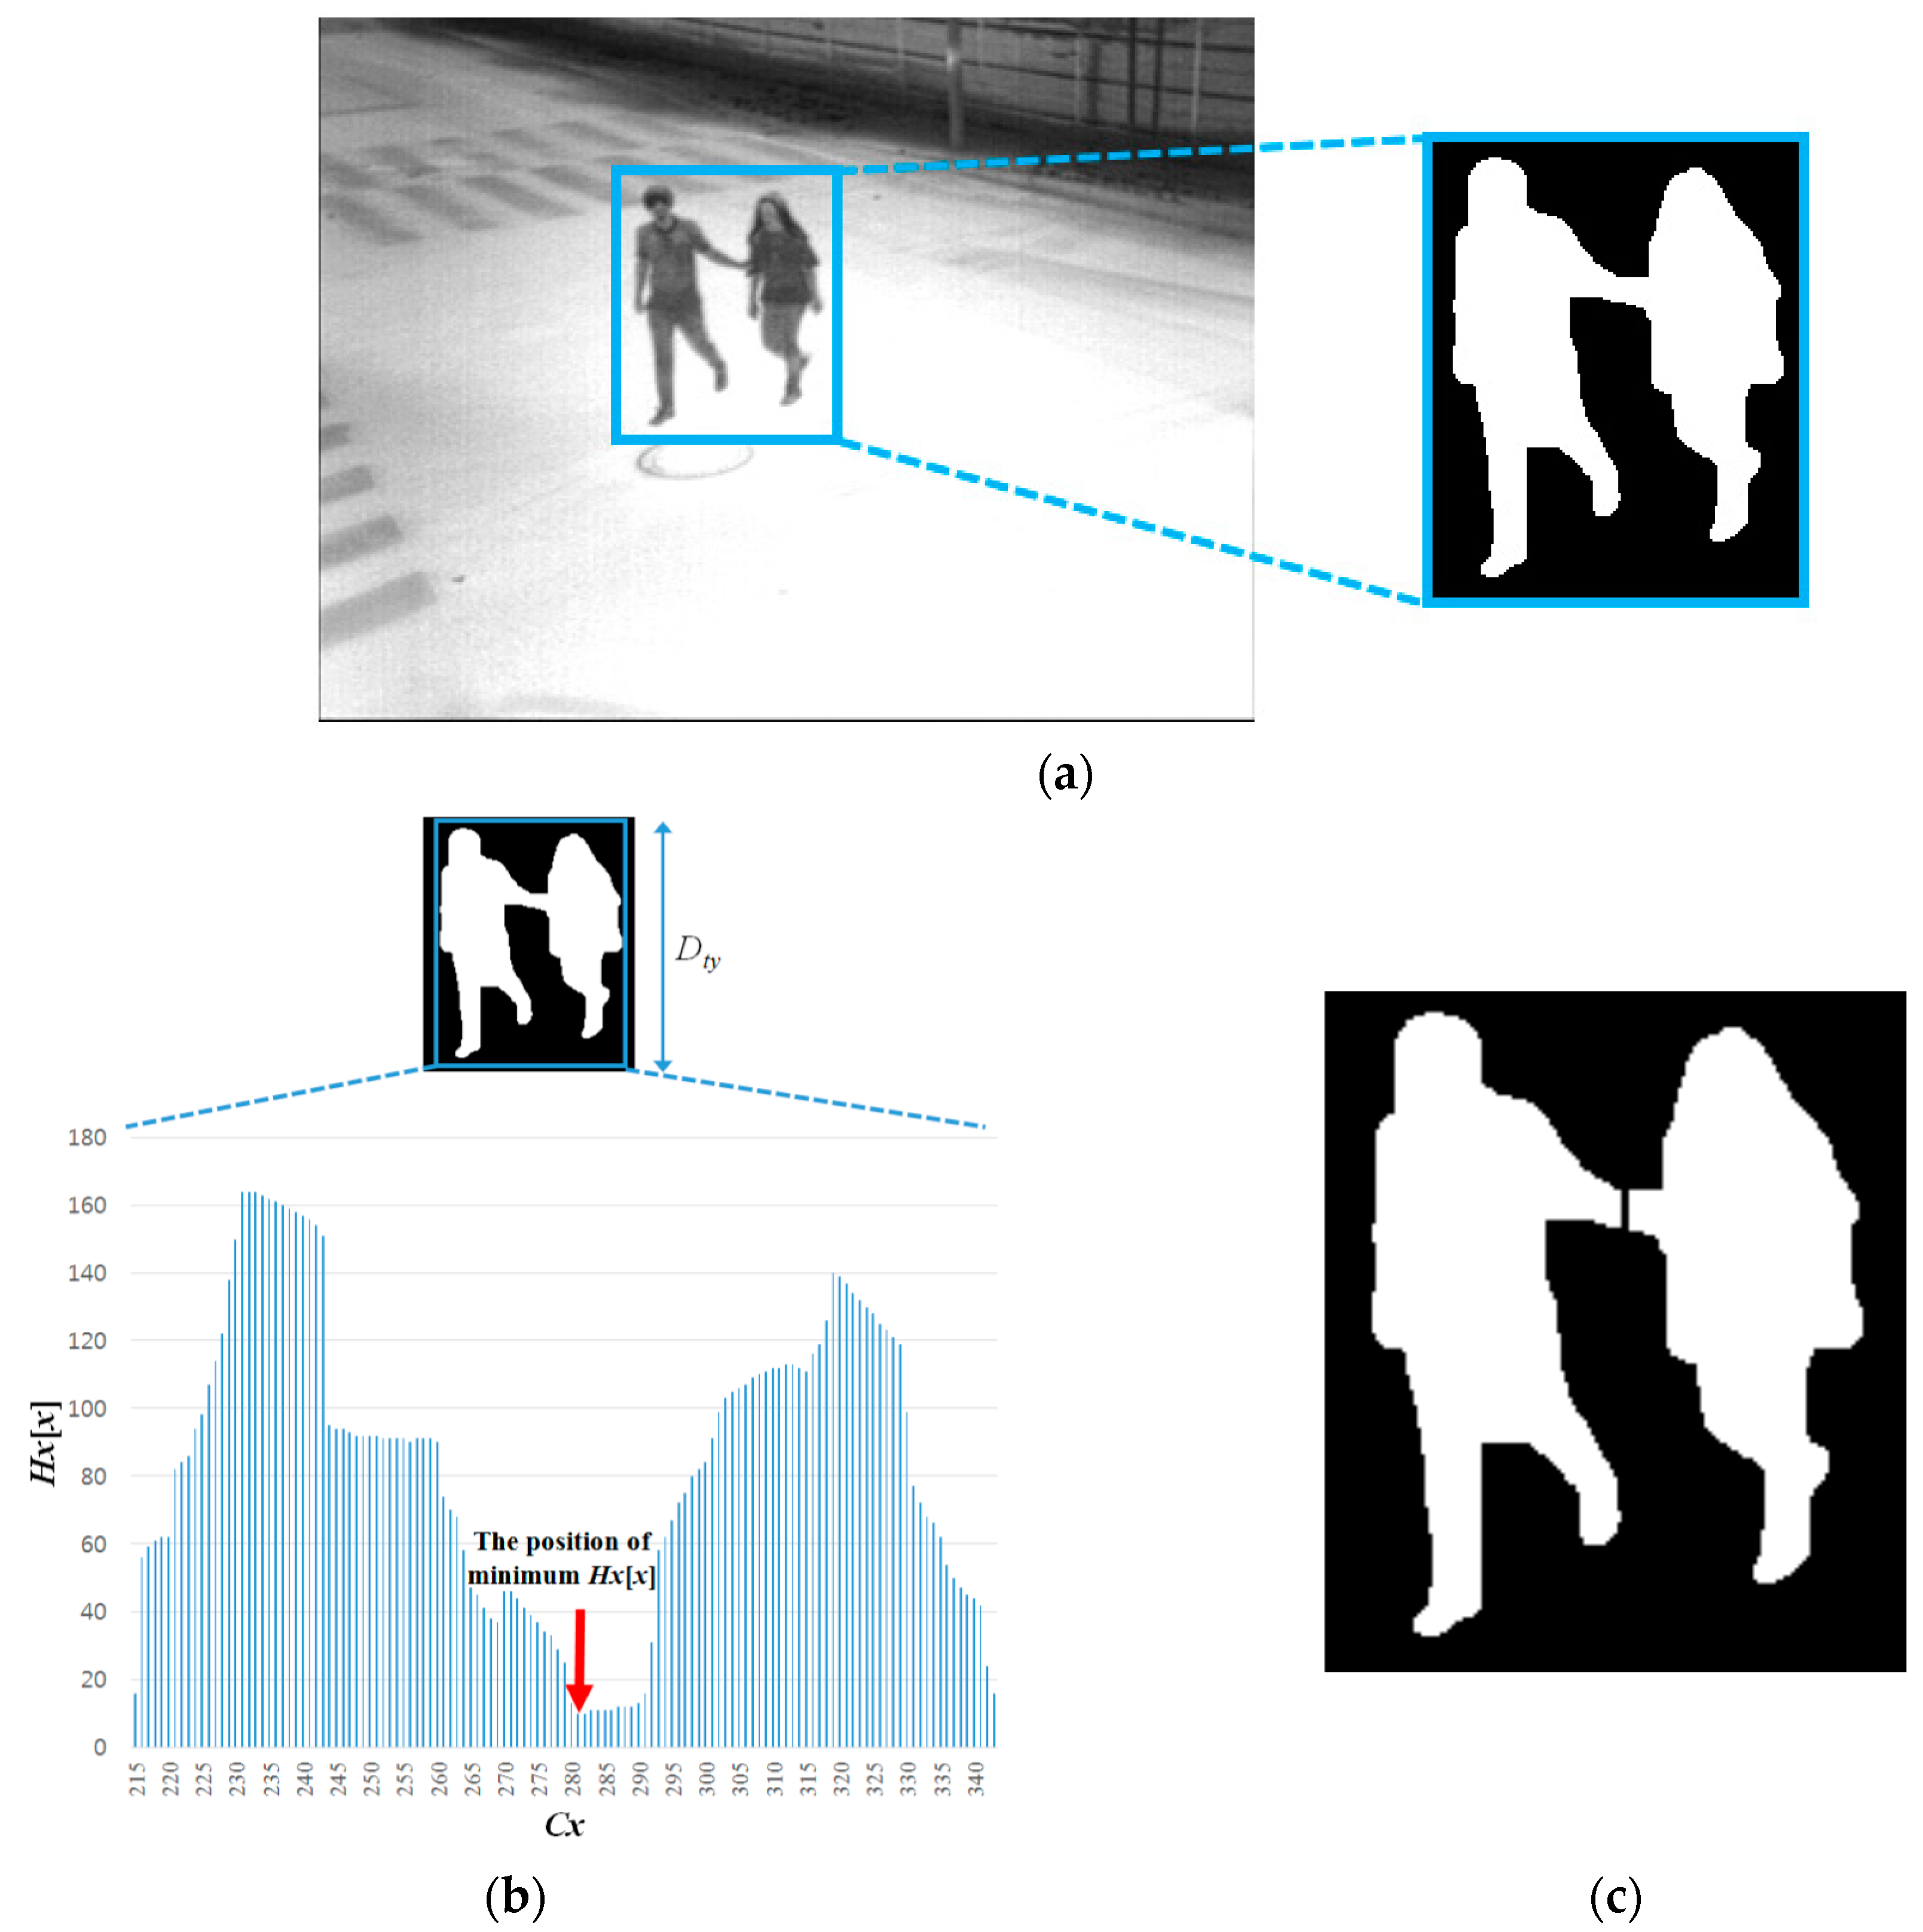
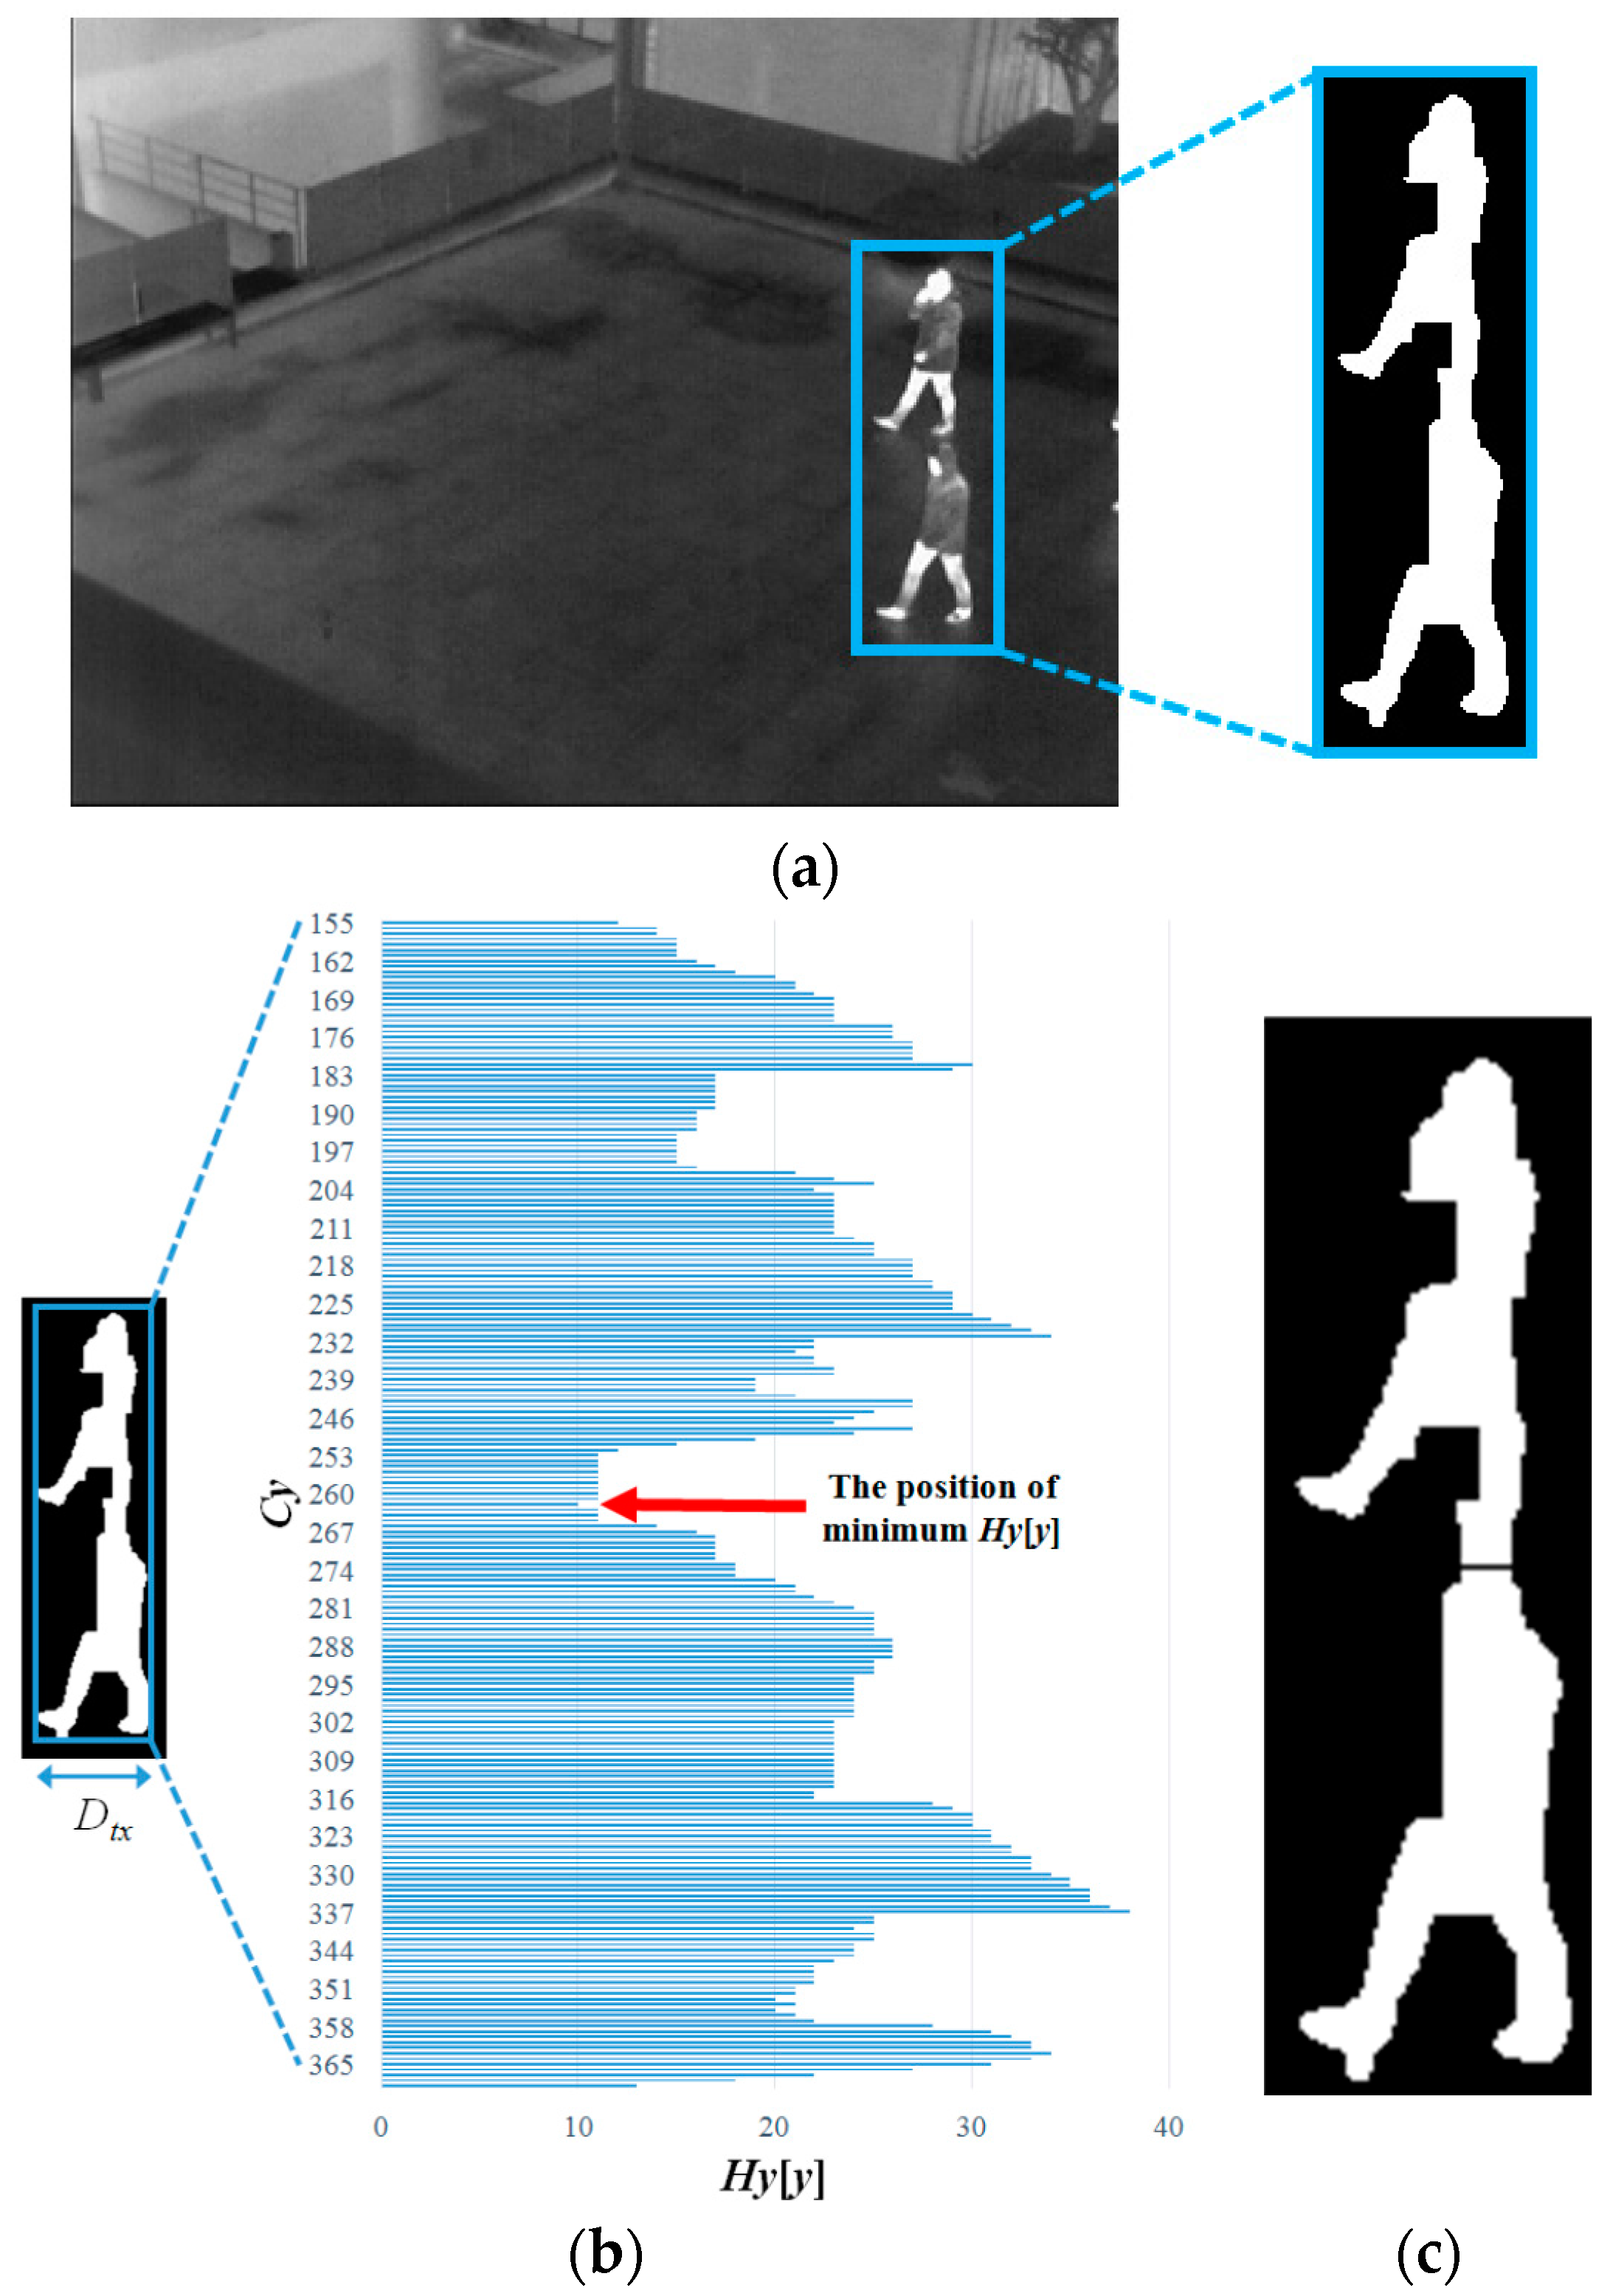
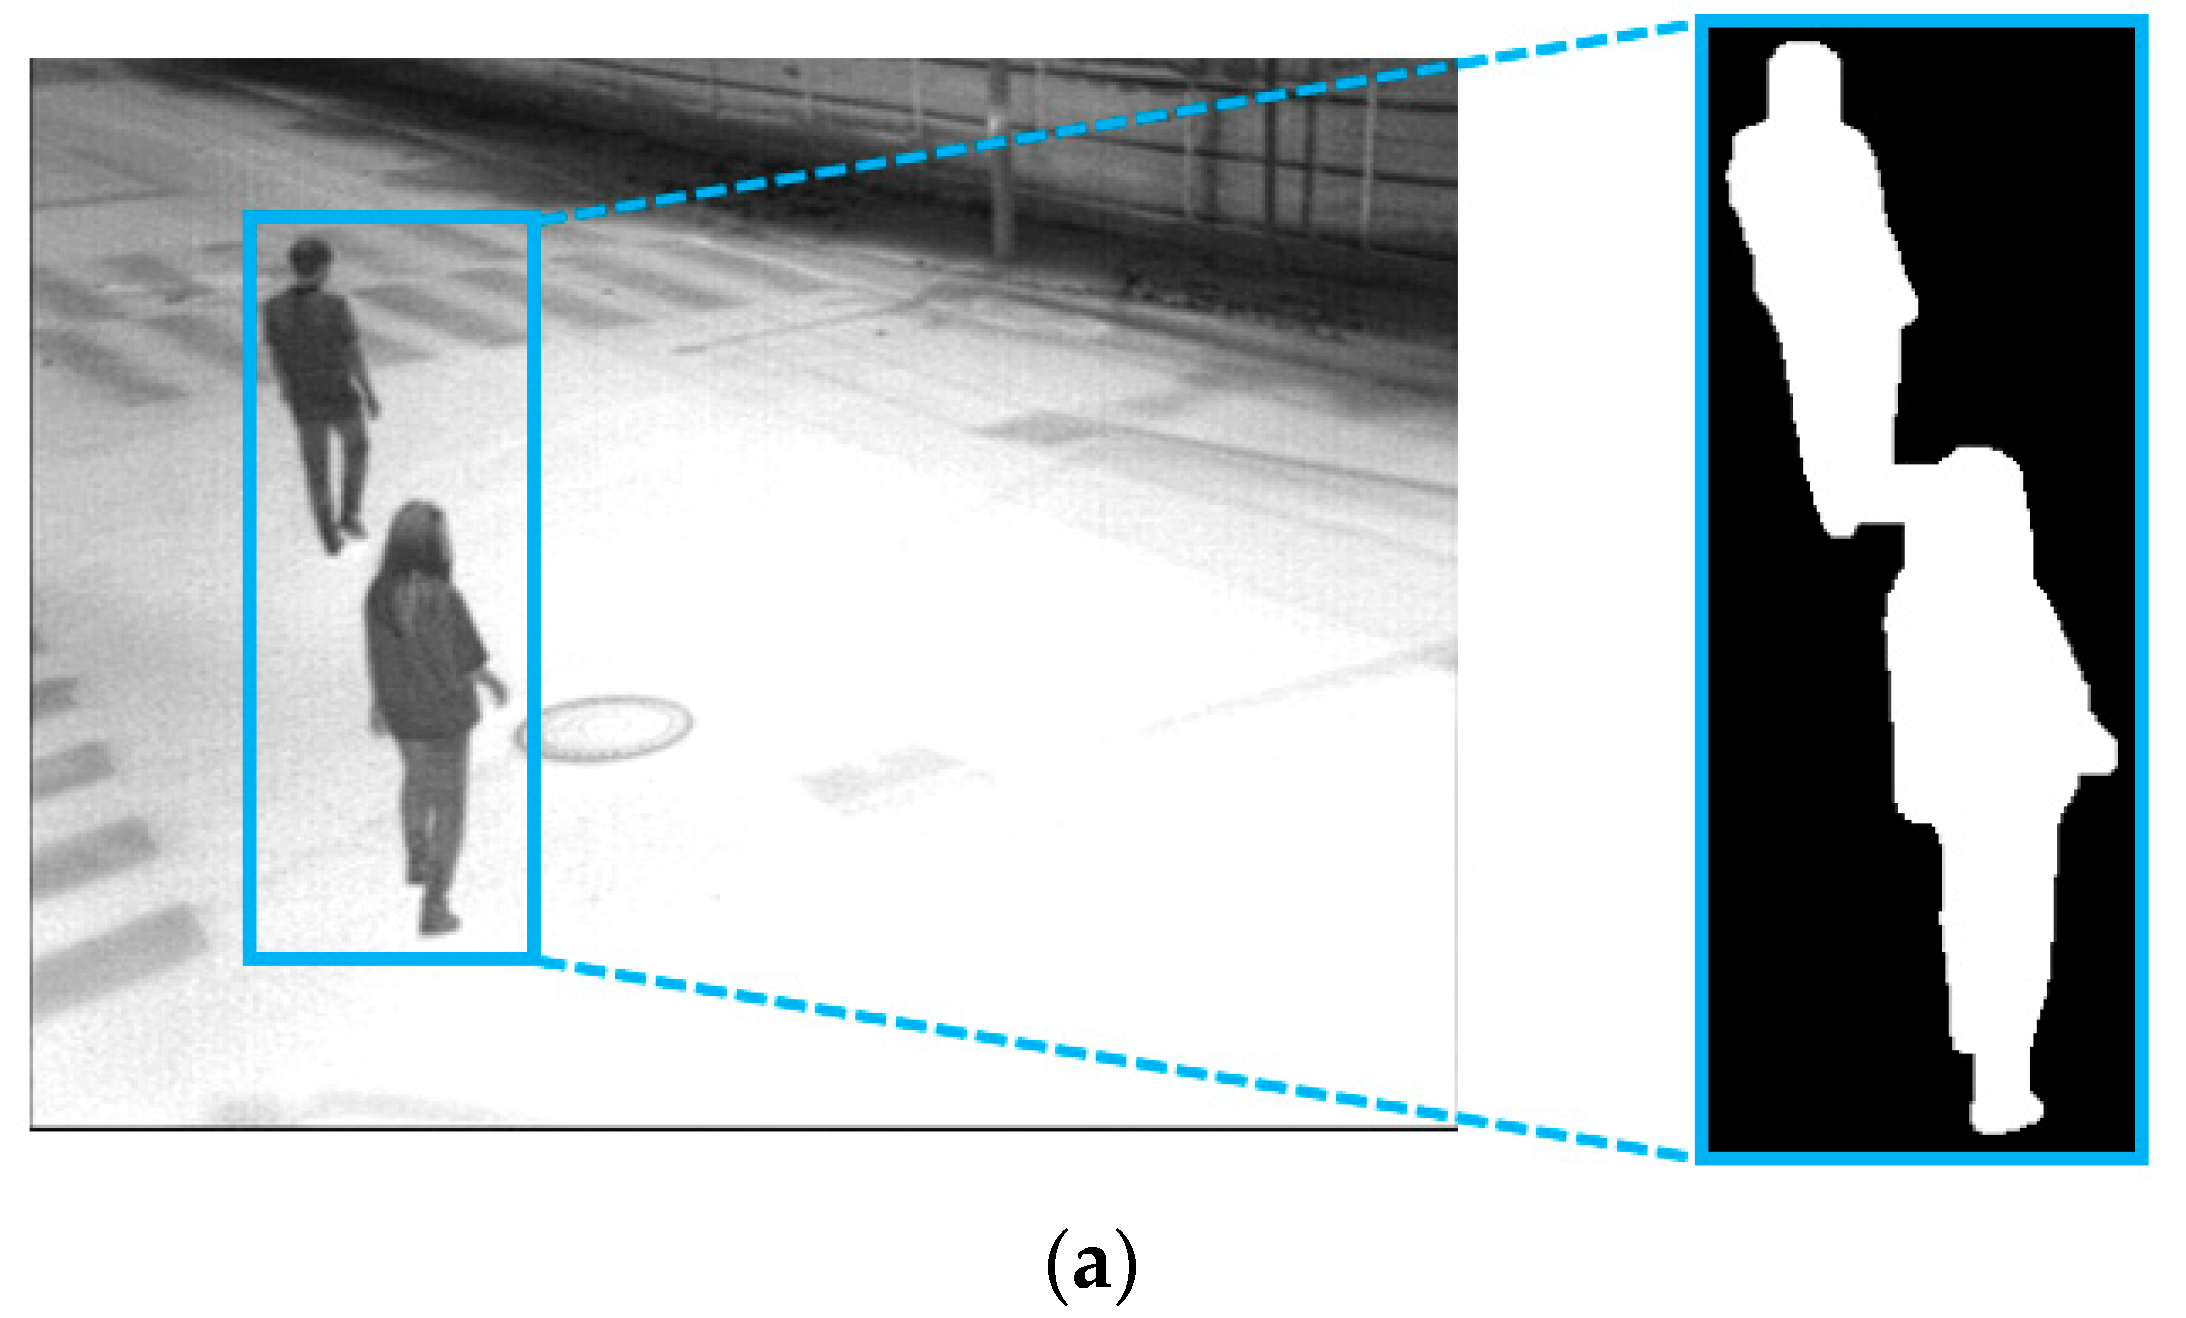
- Second, the problem of two or more than two people being in the similar place with occlusion is solved by our method. Based on four conditions (the width, height, size, and ratio of height to width), the candidate region is separated into two parts. In addition, if the width or height of the detected box is larger than a threshold, our algorithm also checks whether there exist two or more than two histogram values which are lower than the threshold. If so, the candidate region is horizontally or vertically divided into three or more than three regions at the positions of the histogram values.
- -
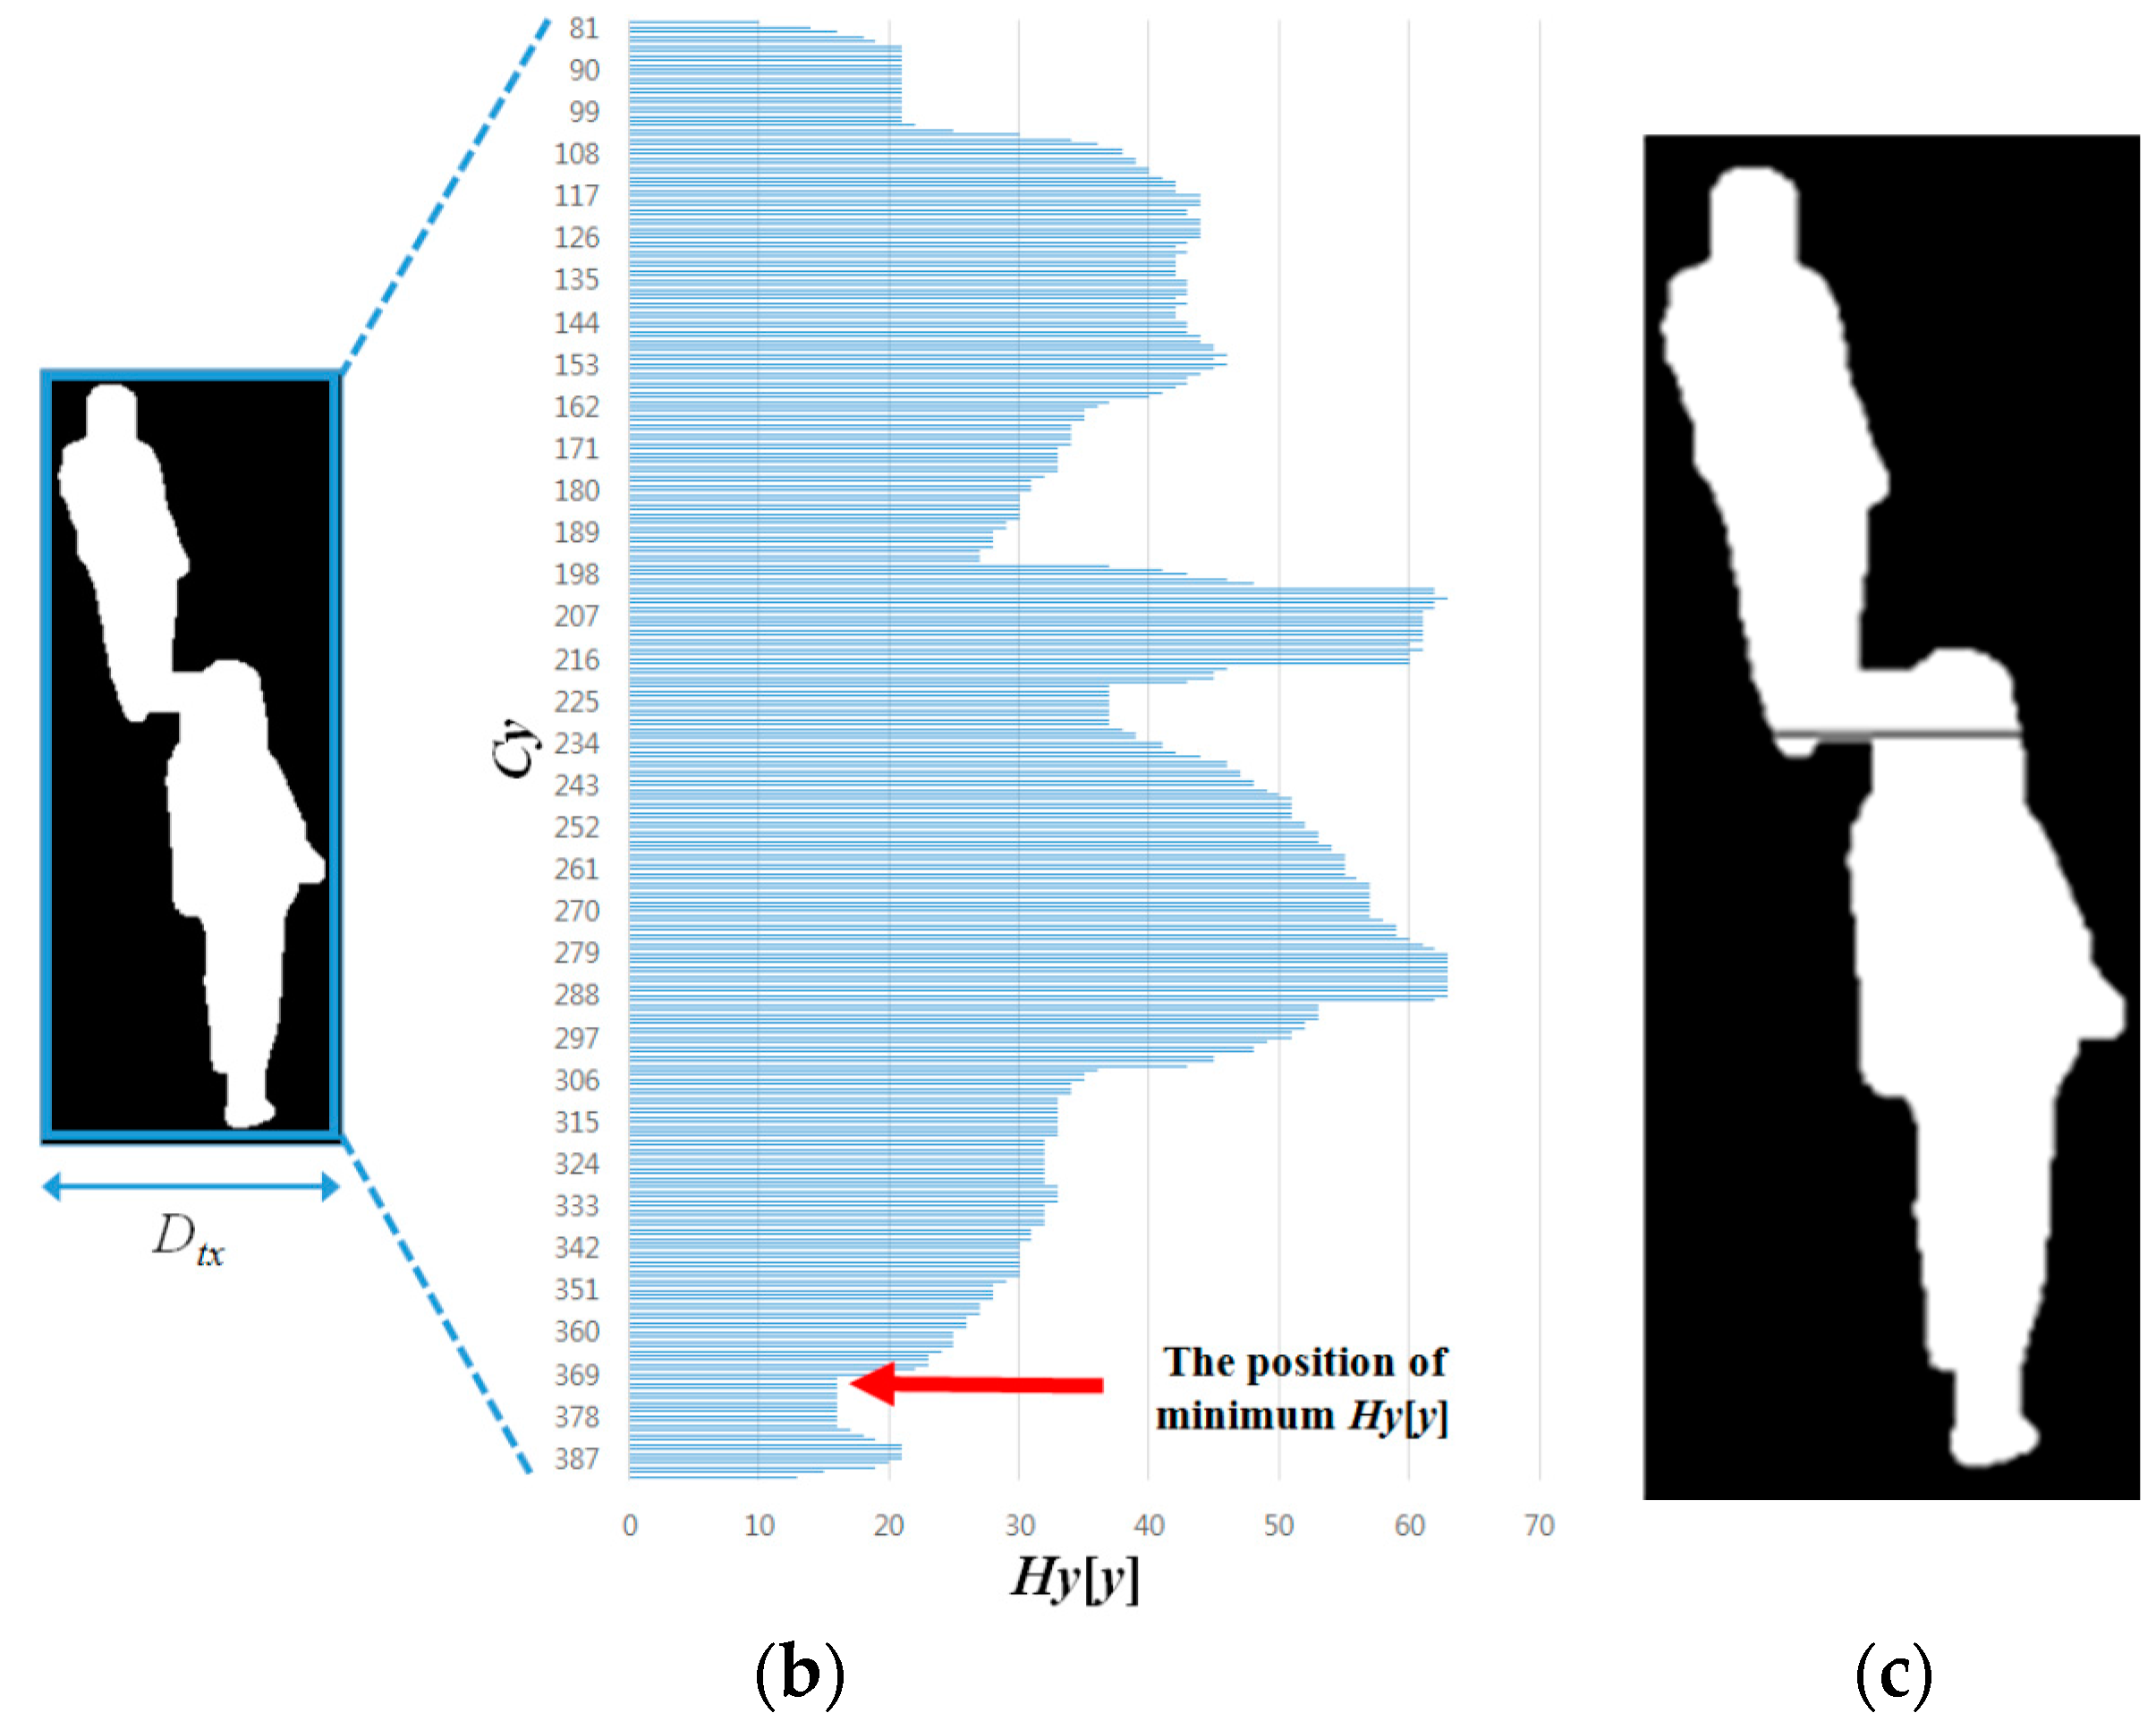
- Third, for human confirmation, the separated regions are verified based on the size and the distance between two or more regions in close proximity to one another. If a region is small and there is another small region nearby, these two regions are merged as an exact human region.
- -
- Fourth, our method is confirmed to robustly detect human areas in various environments through intensive experiments with 15 sets of data (captured under different weather and light conditions) and an open database.
2. Proposed Method
2.1. Overall Procedure of Proposed Method
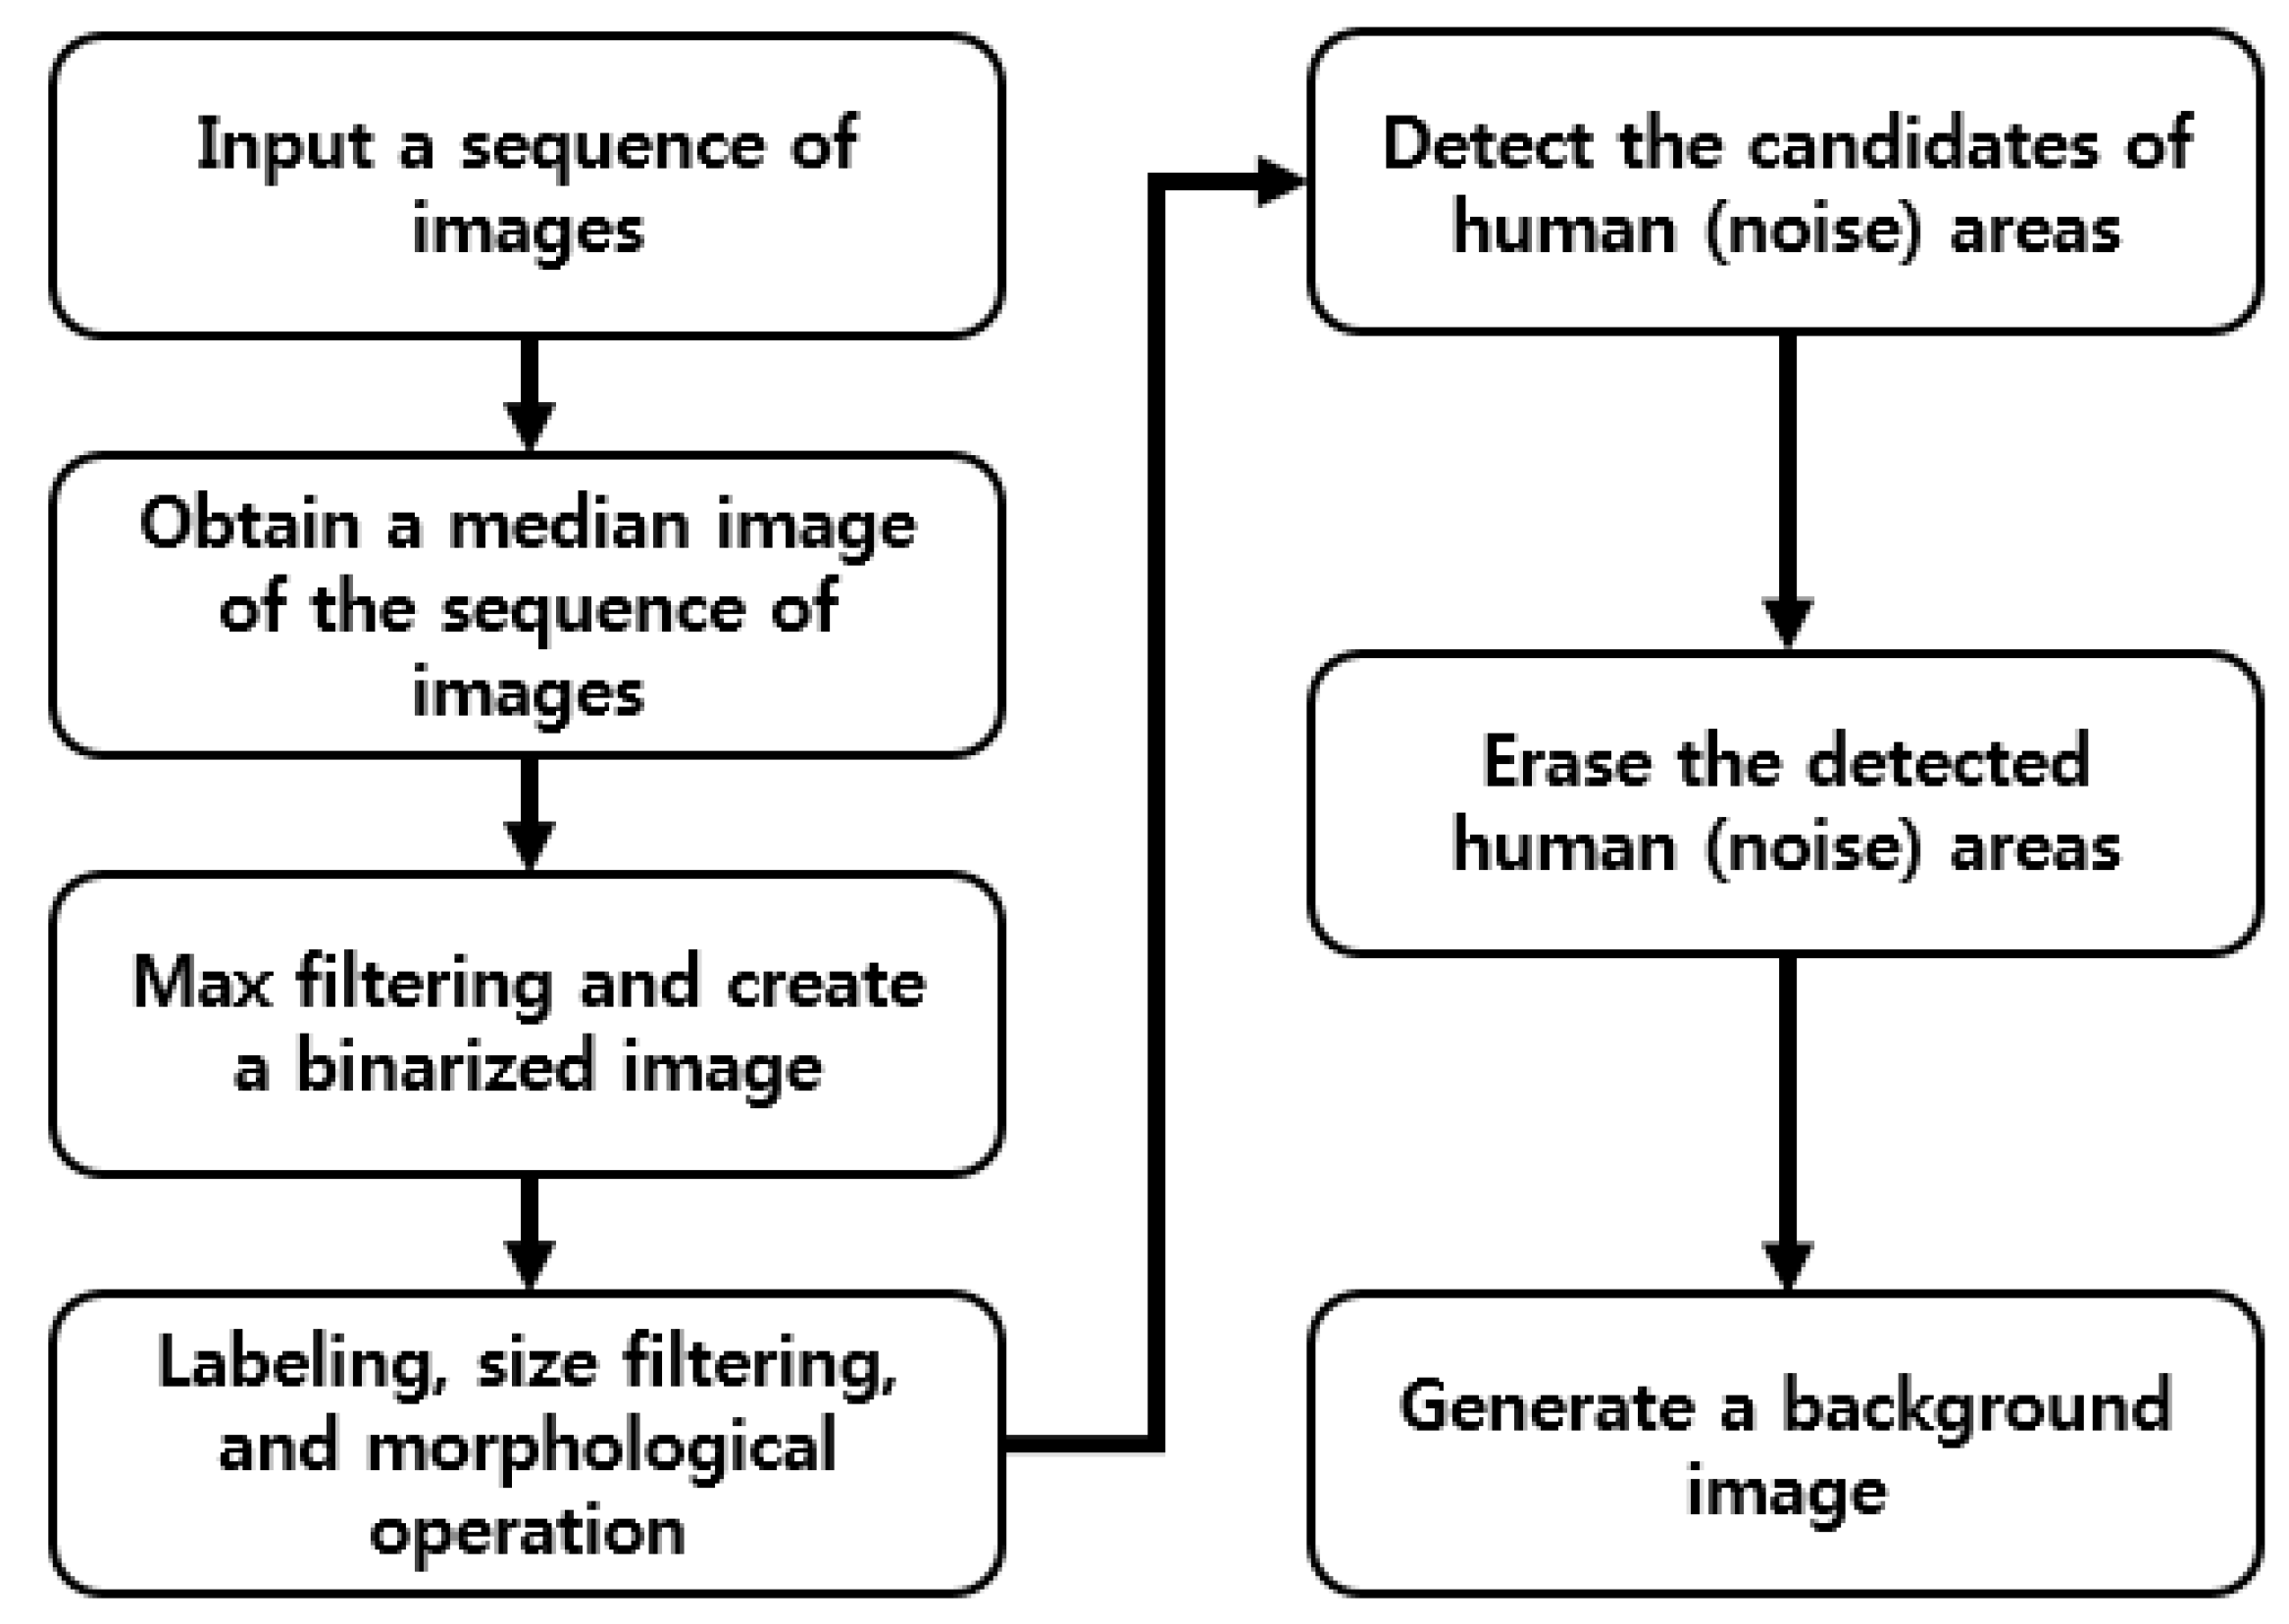
2.2. Generating a Background Image
2.3. Generating a Difference Image Based on the Fuzzy System Given Background and Input Image
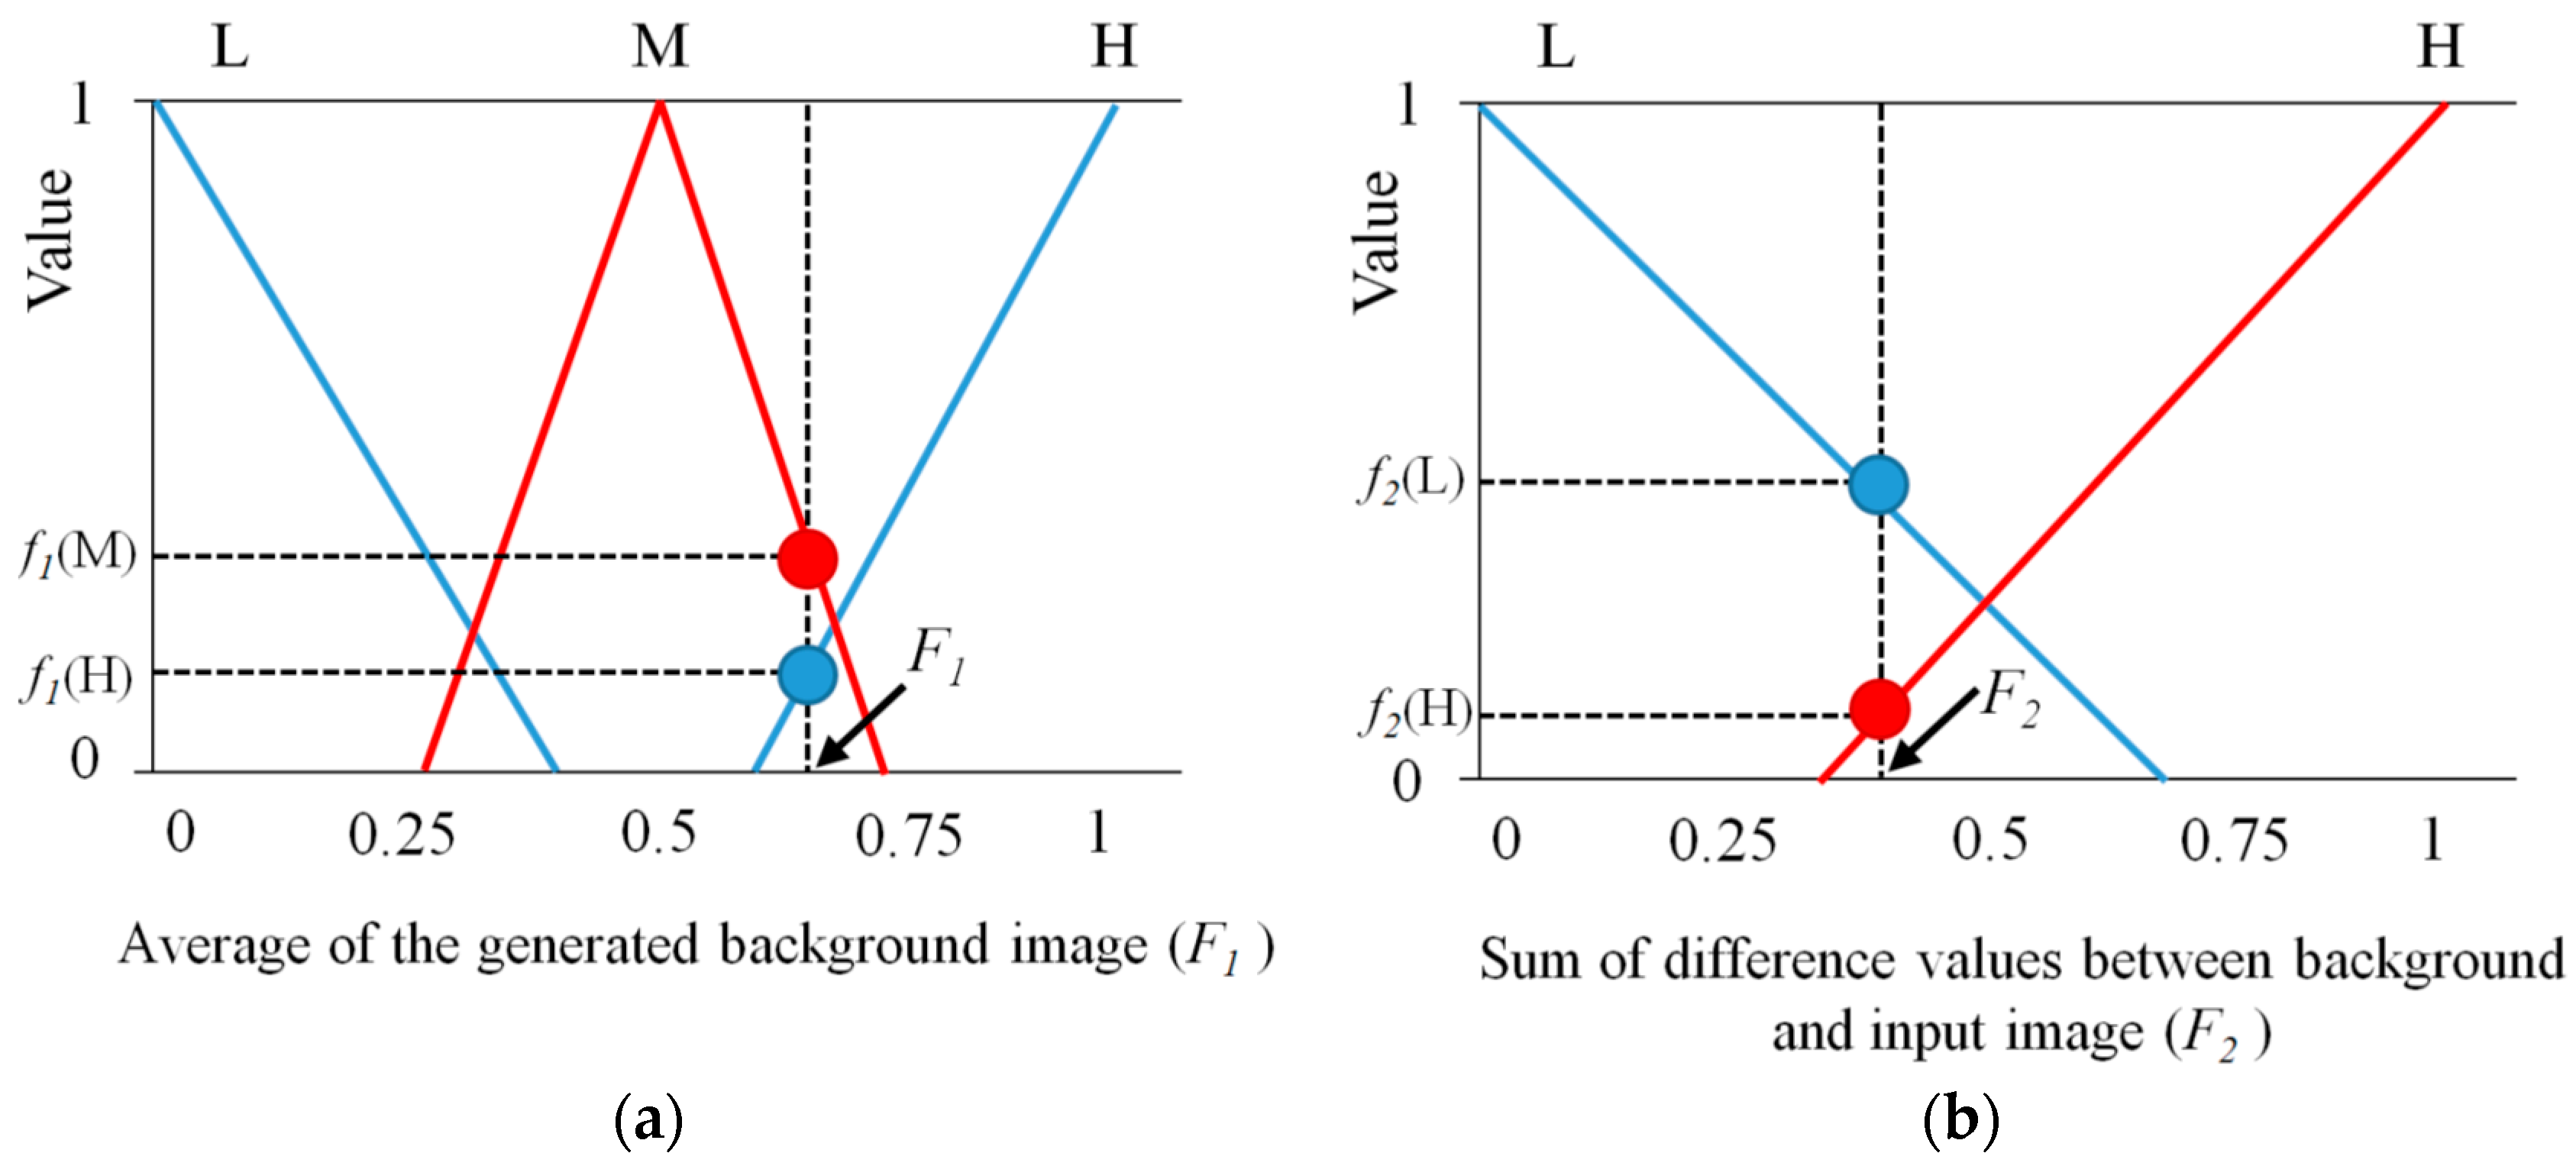
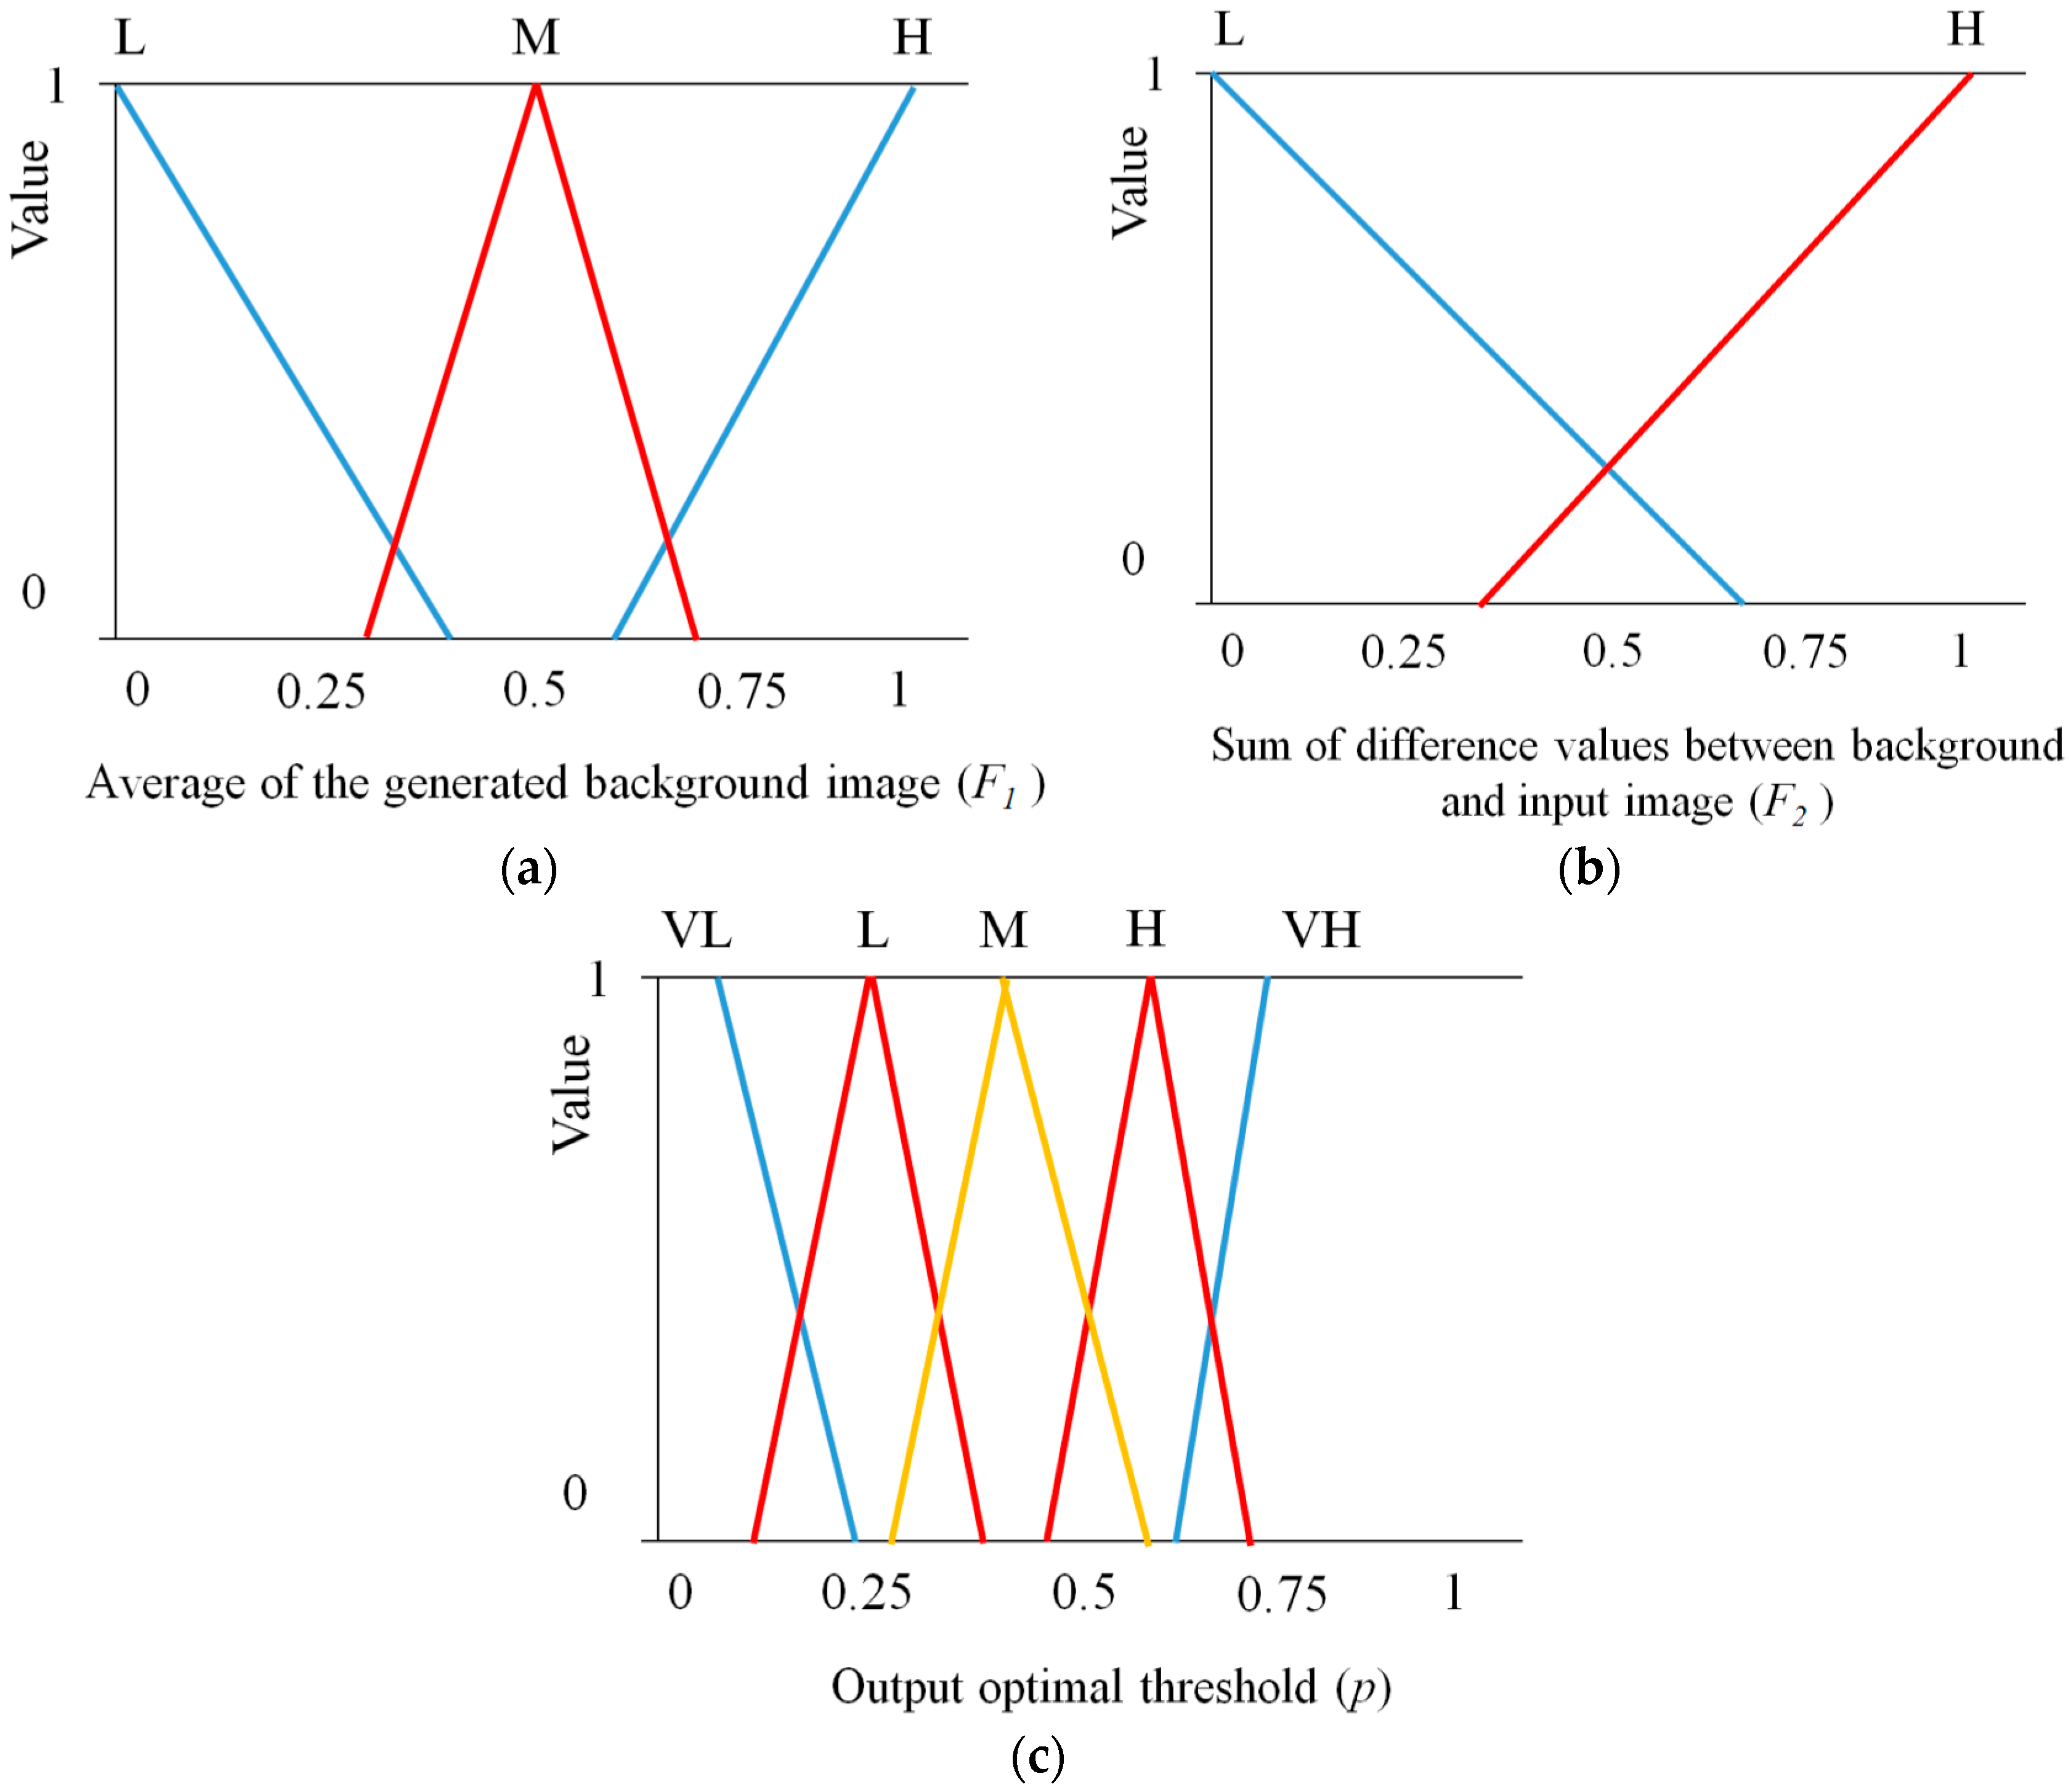
2.3.1. Definition of the Membership Function
2.3.2. Fuzzy Rules with Considering the Characteristics of Background and Input Images
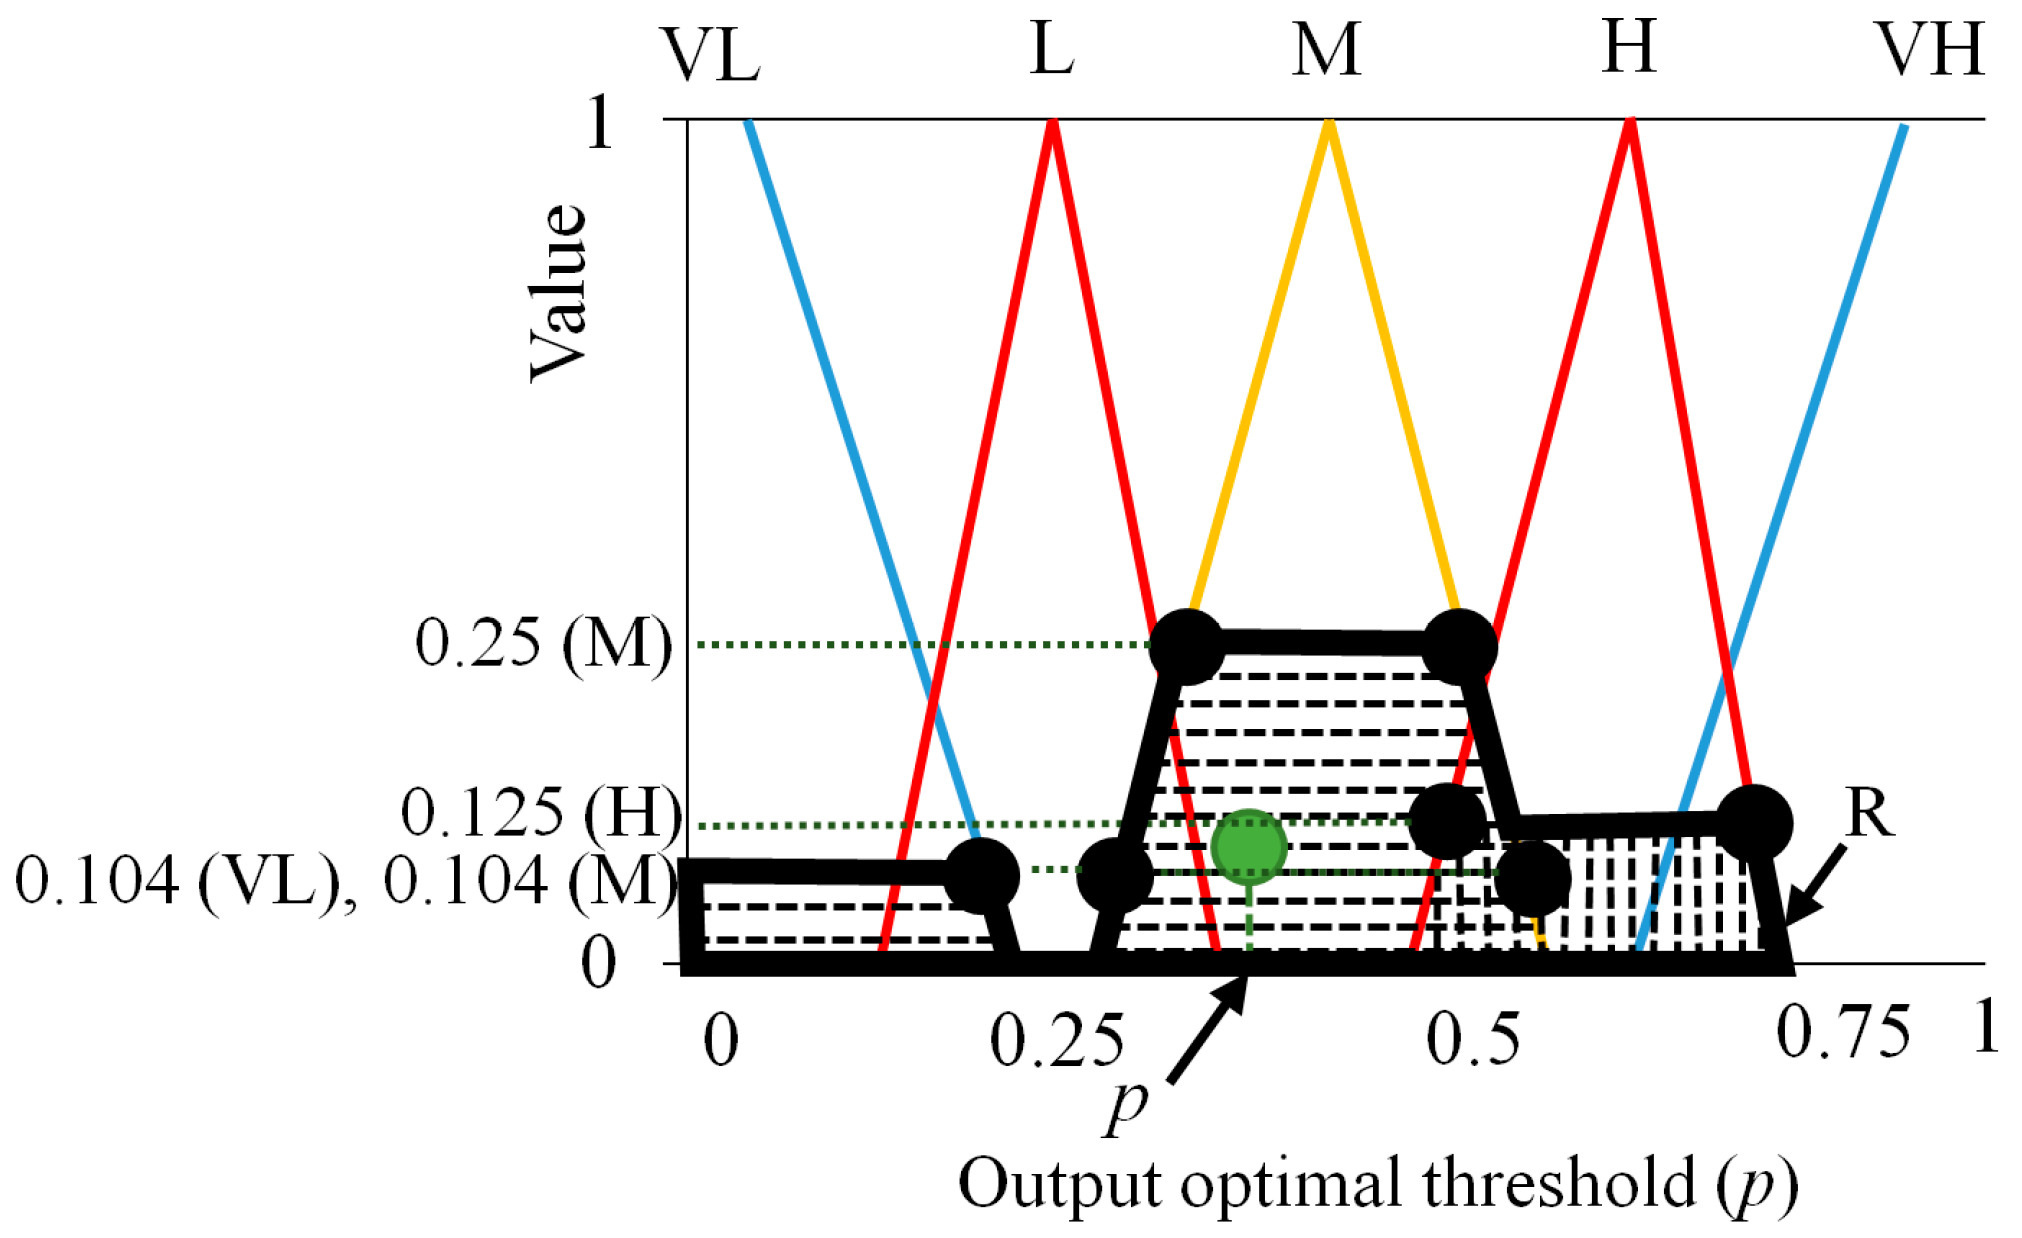
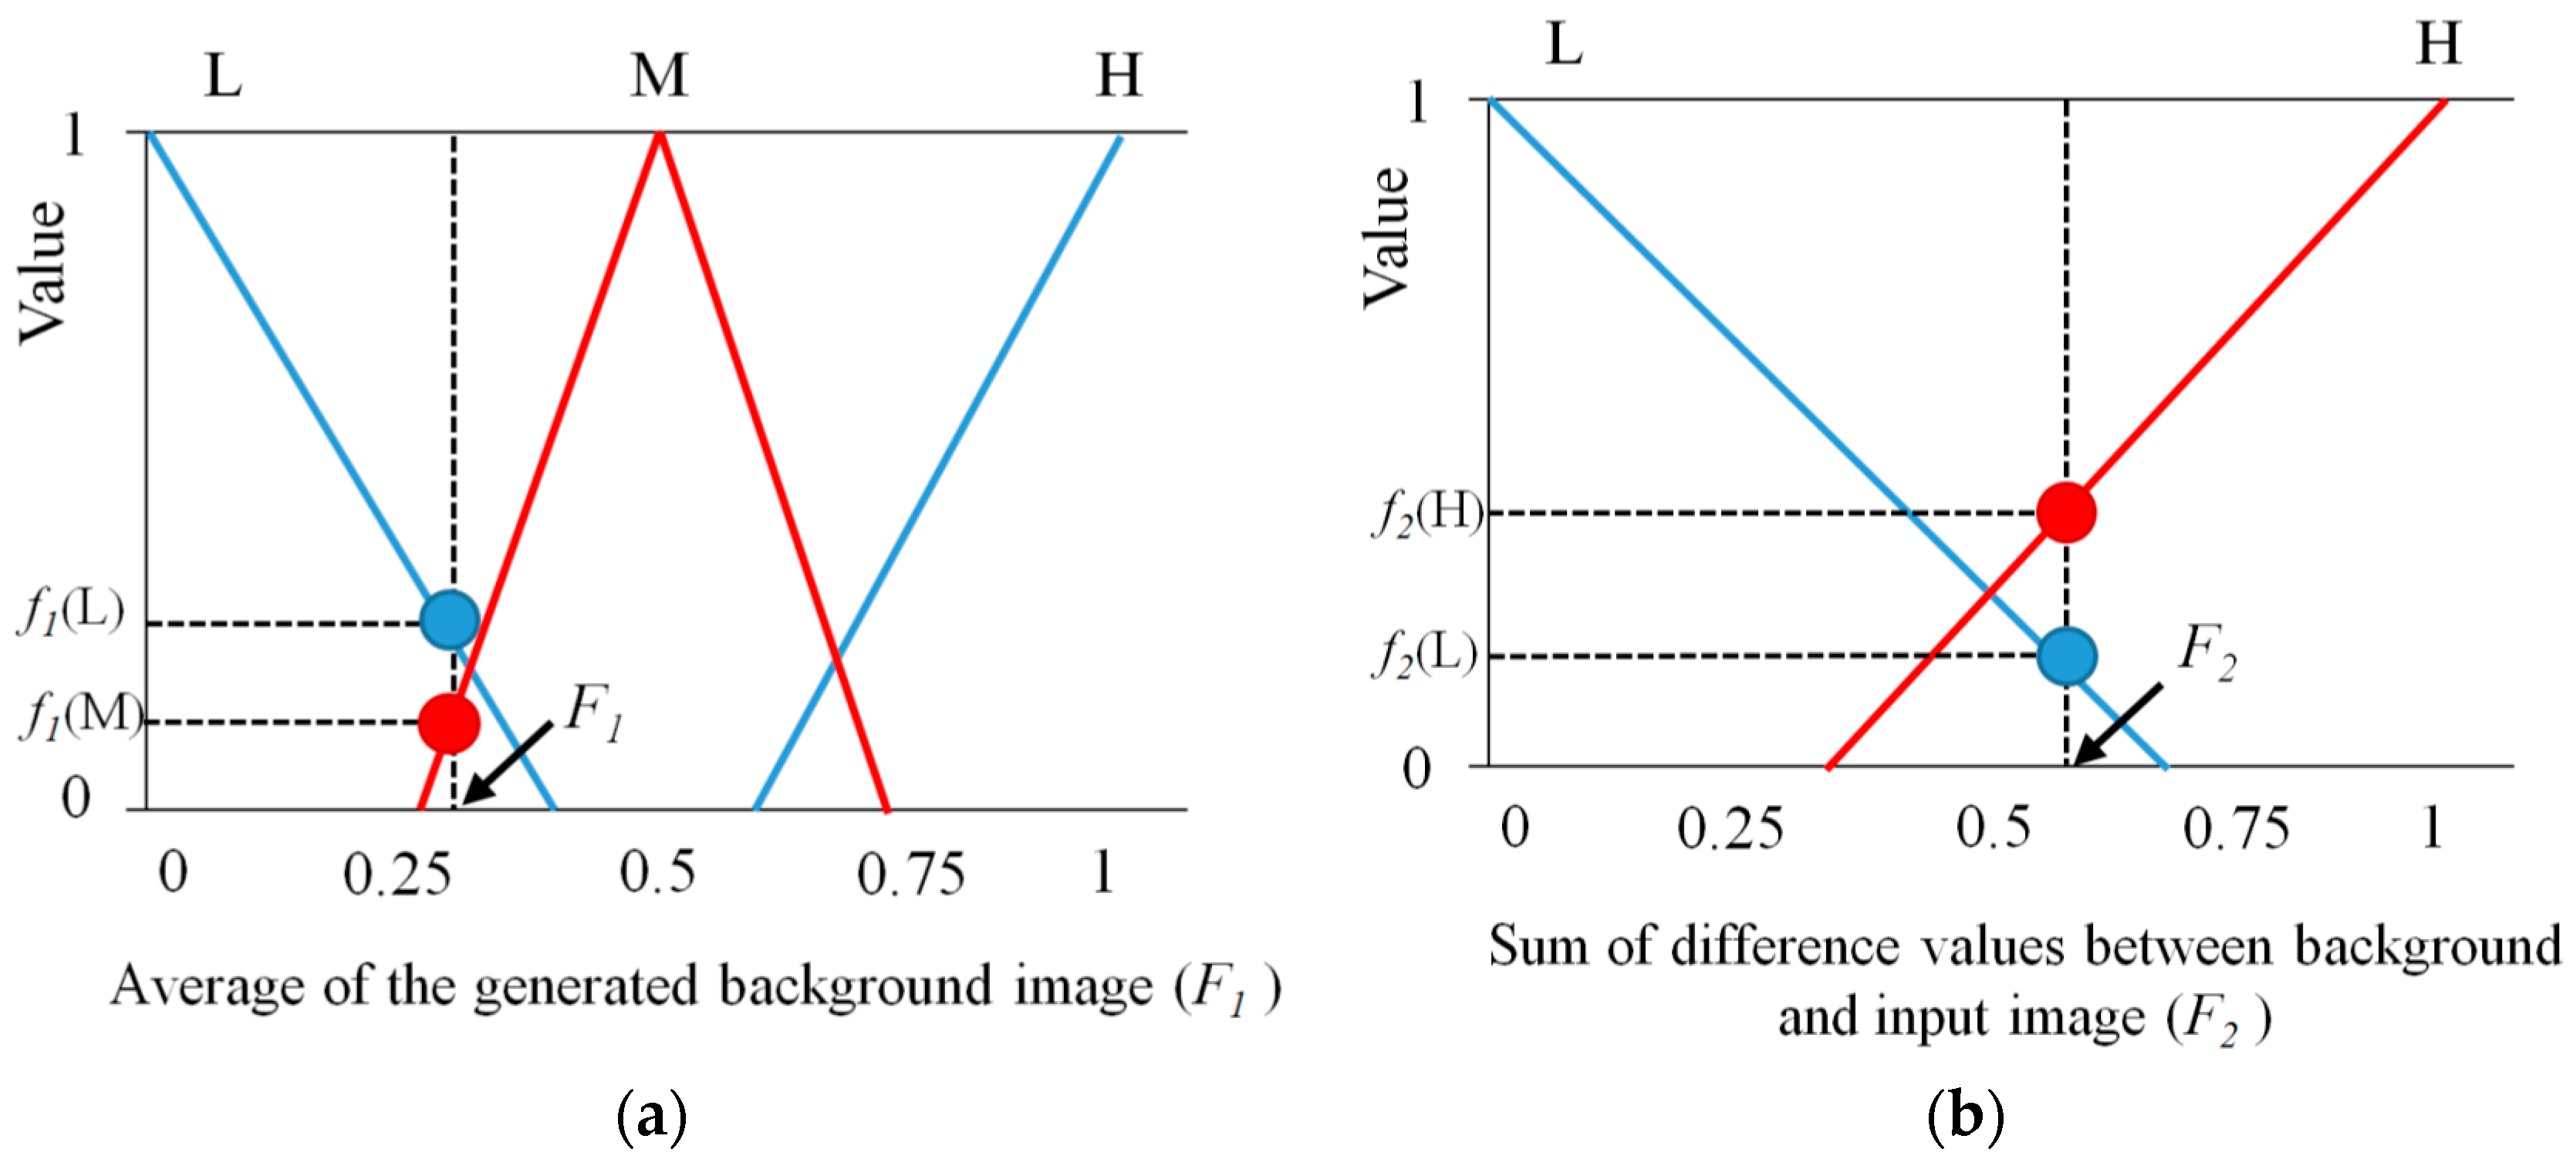
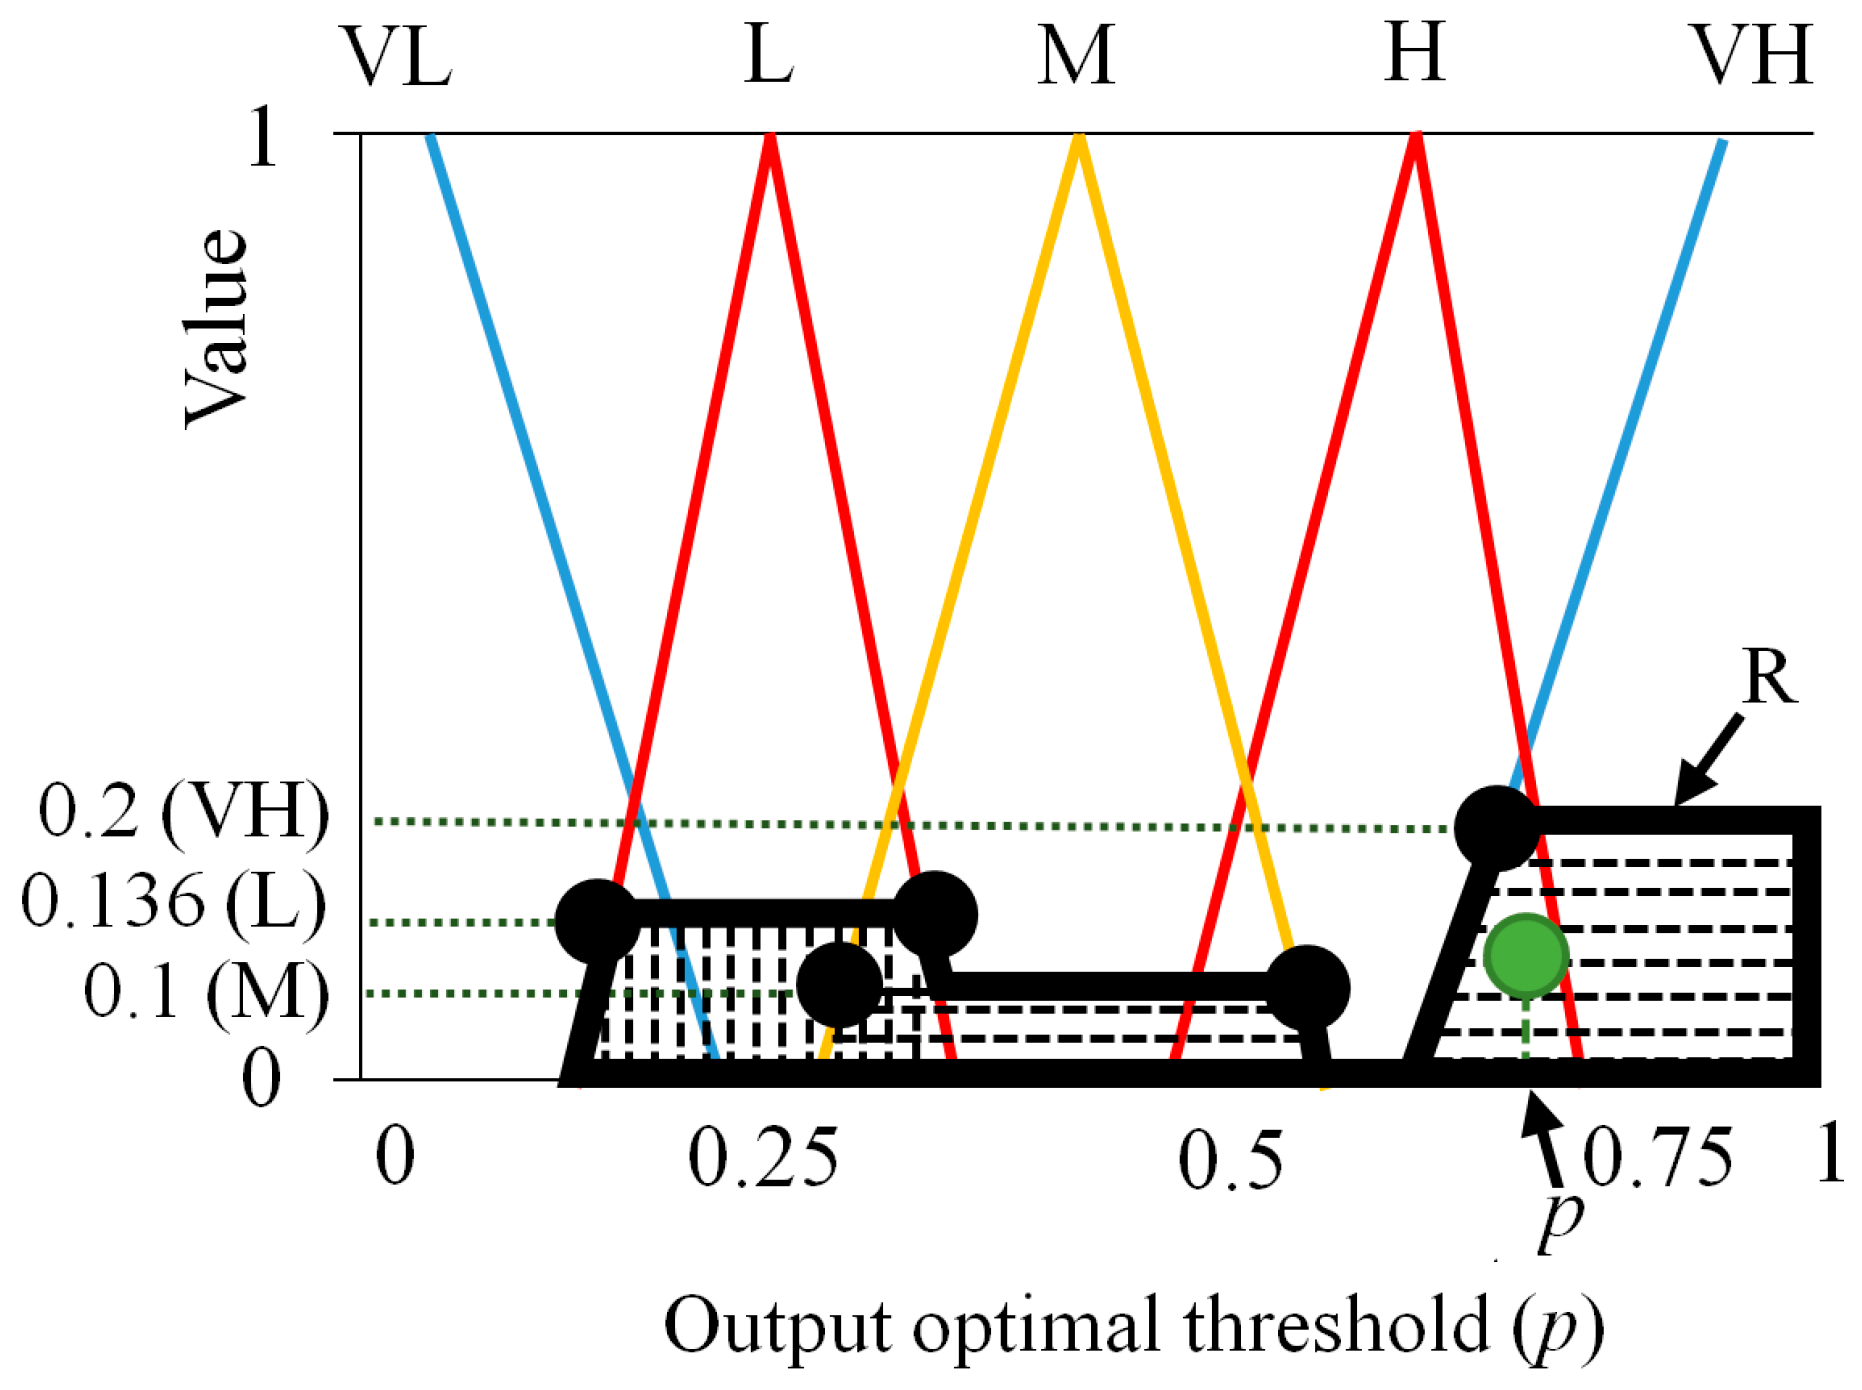
2.3.3. Decision of the Optimal Threshold Using Defuzzification
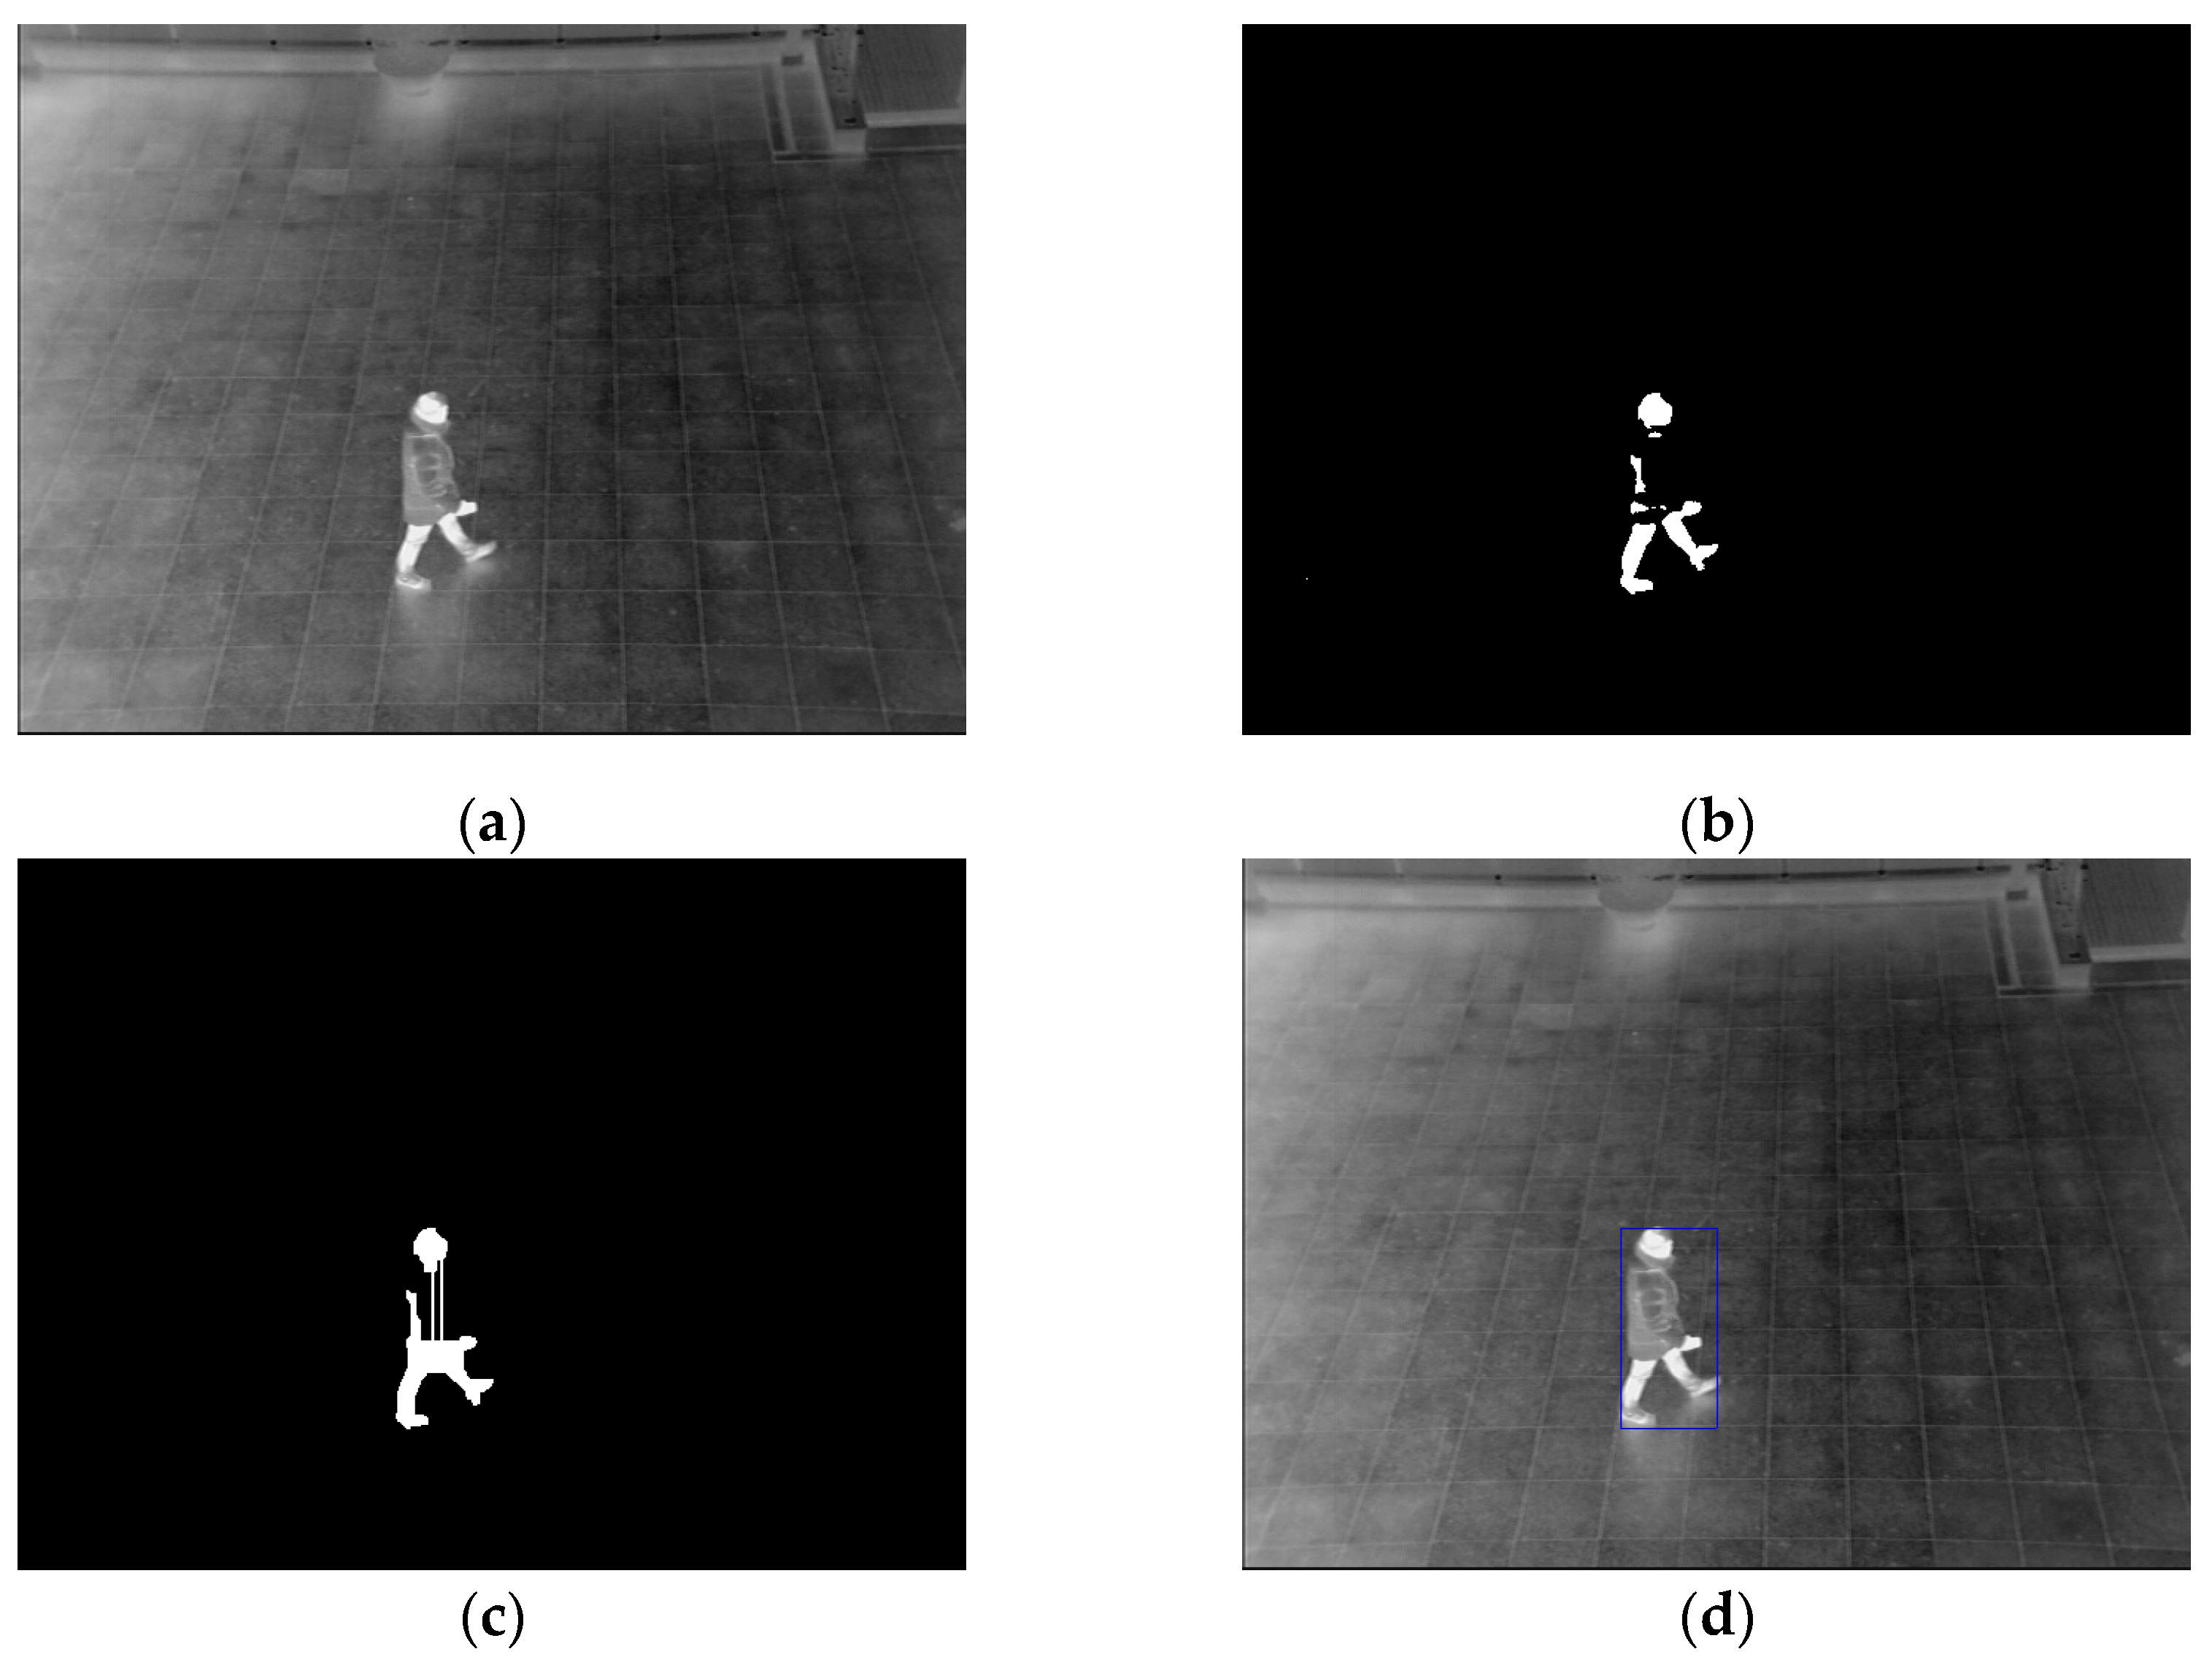
2.3.4. Generating a Difference Image
2.4. Confirmation of Human Region
2.4.1. Vertical and Horizontal Separation of Candidate Region
2.4.2. Confirmation of Human Area Based on Camera Viewing Direction
3. Experimental Results
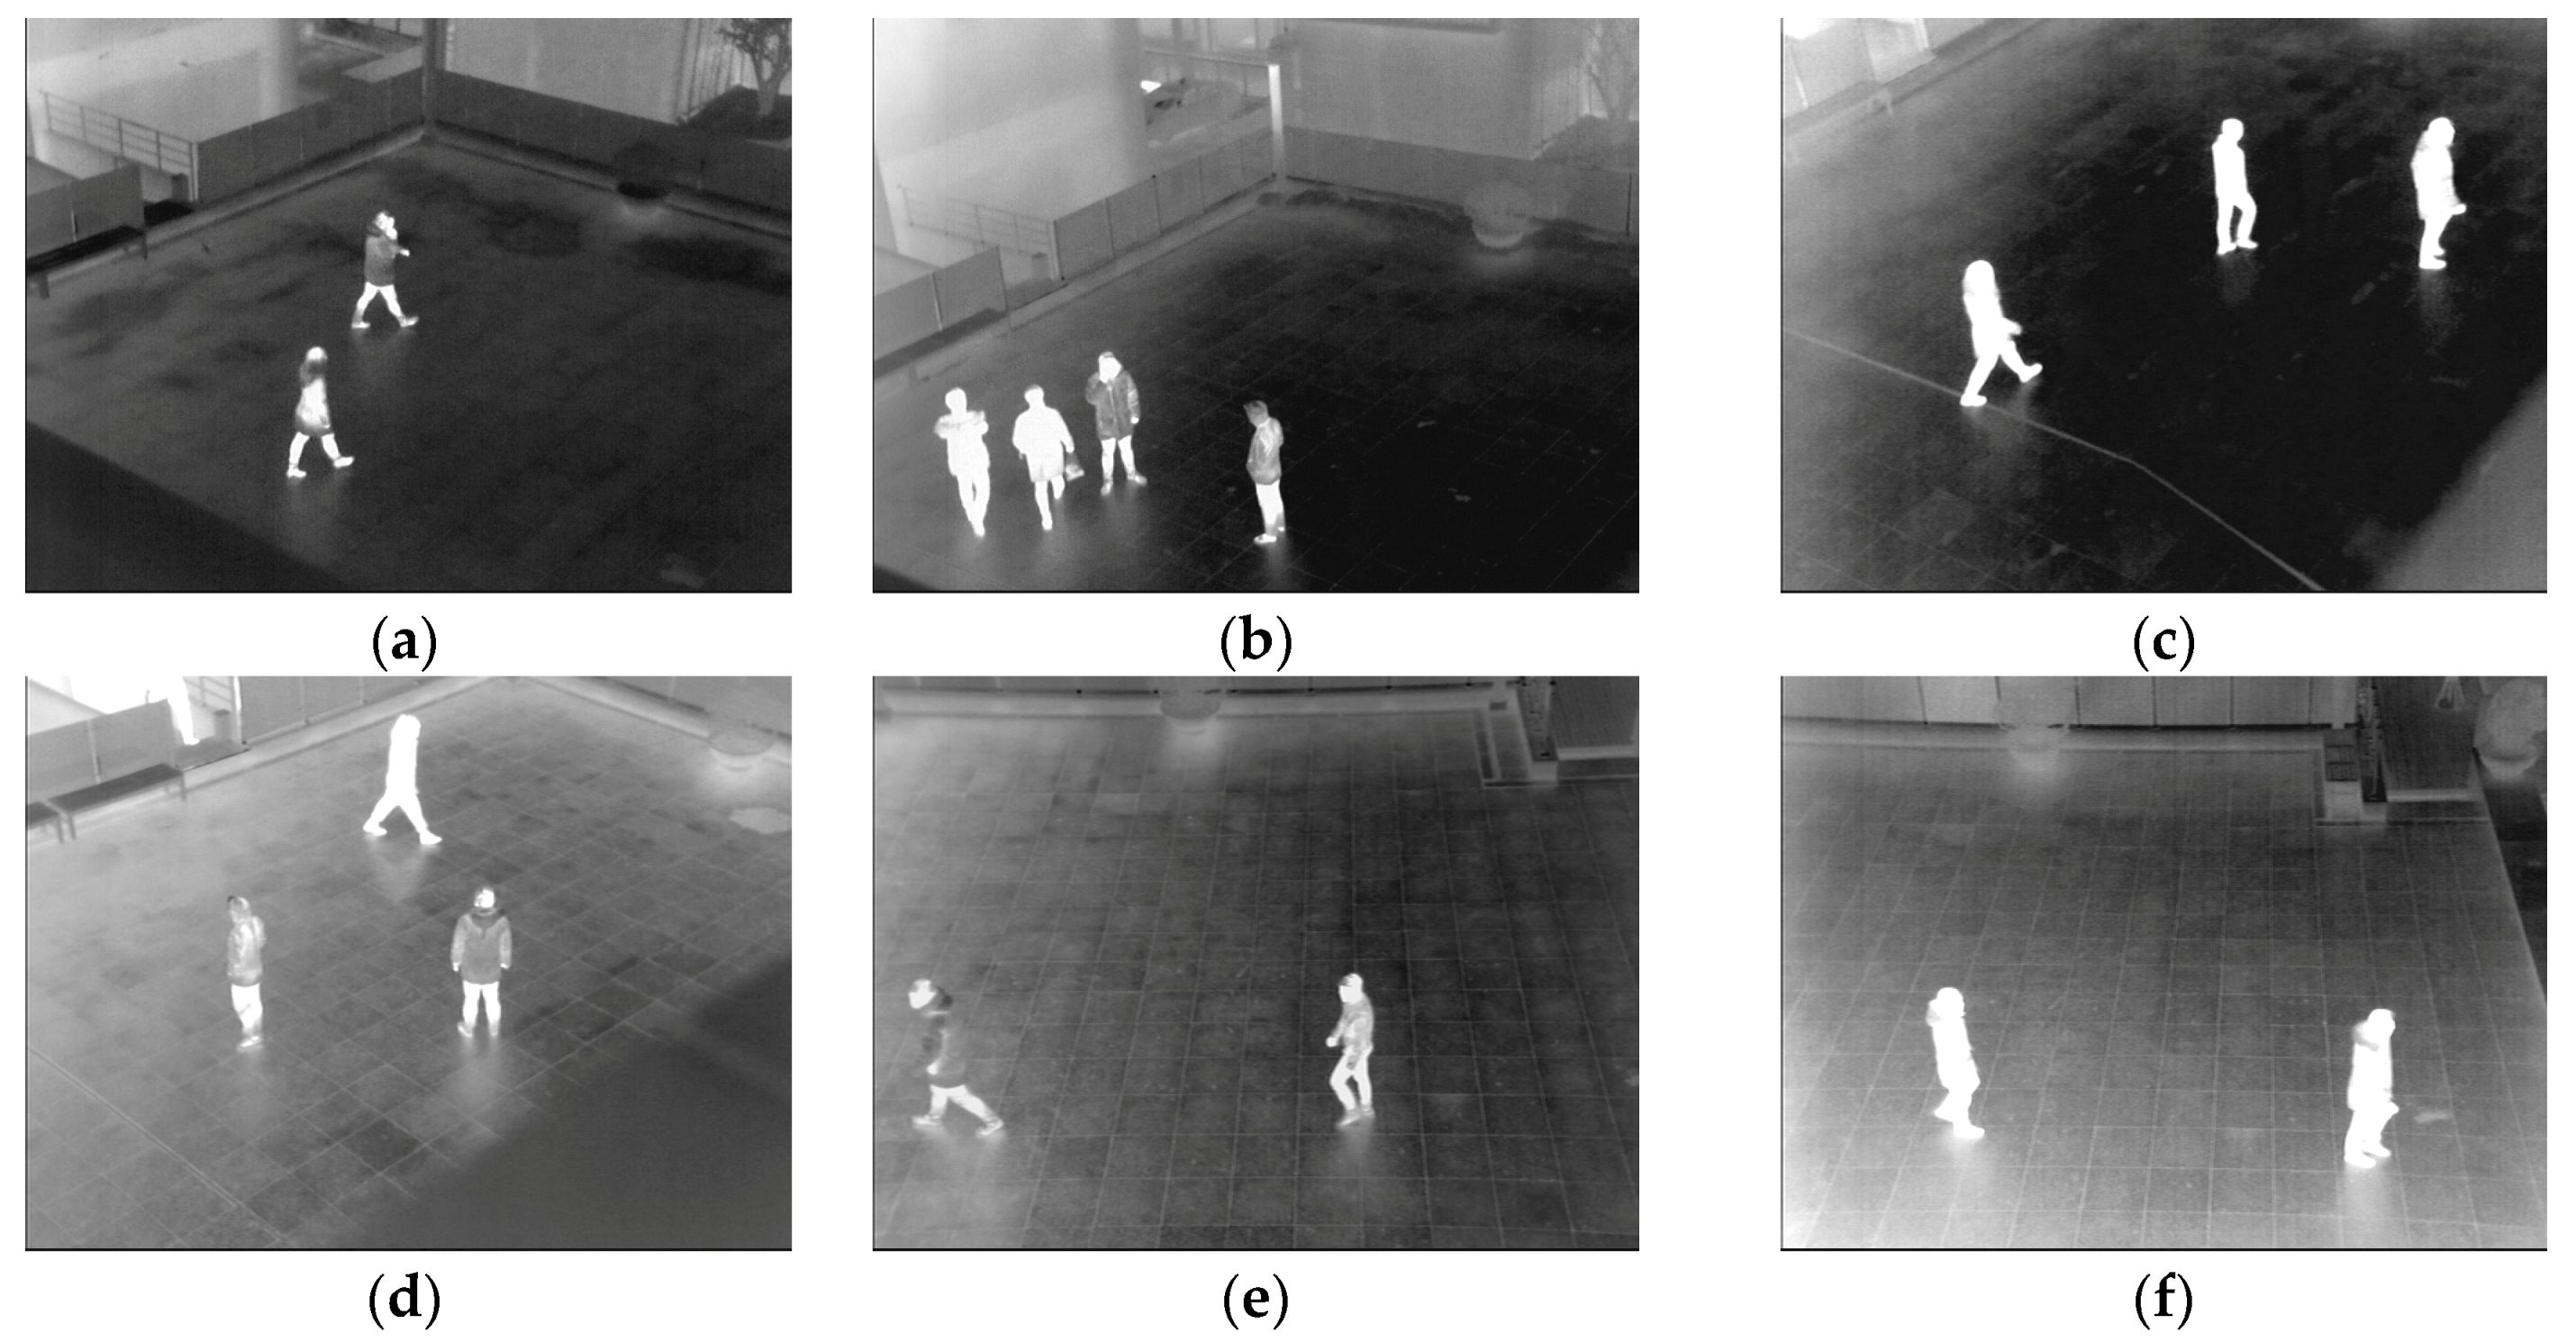
3.1. Dataset Description
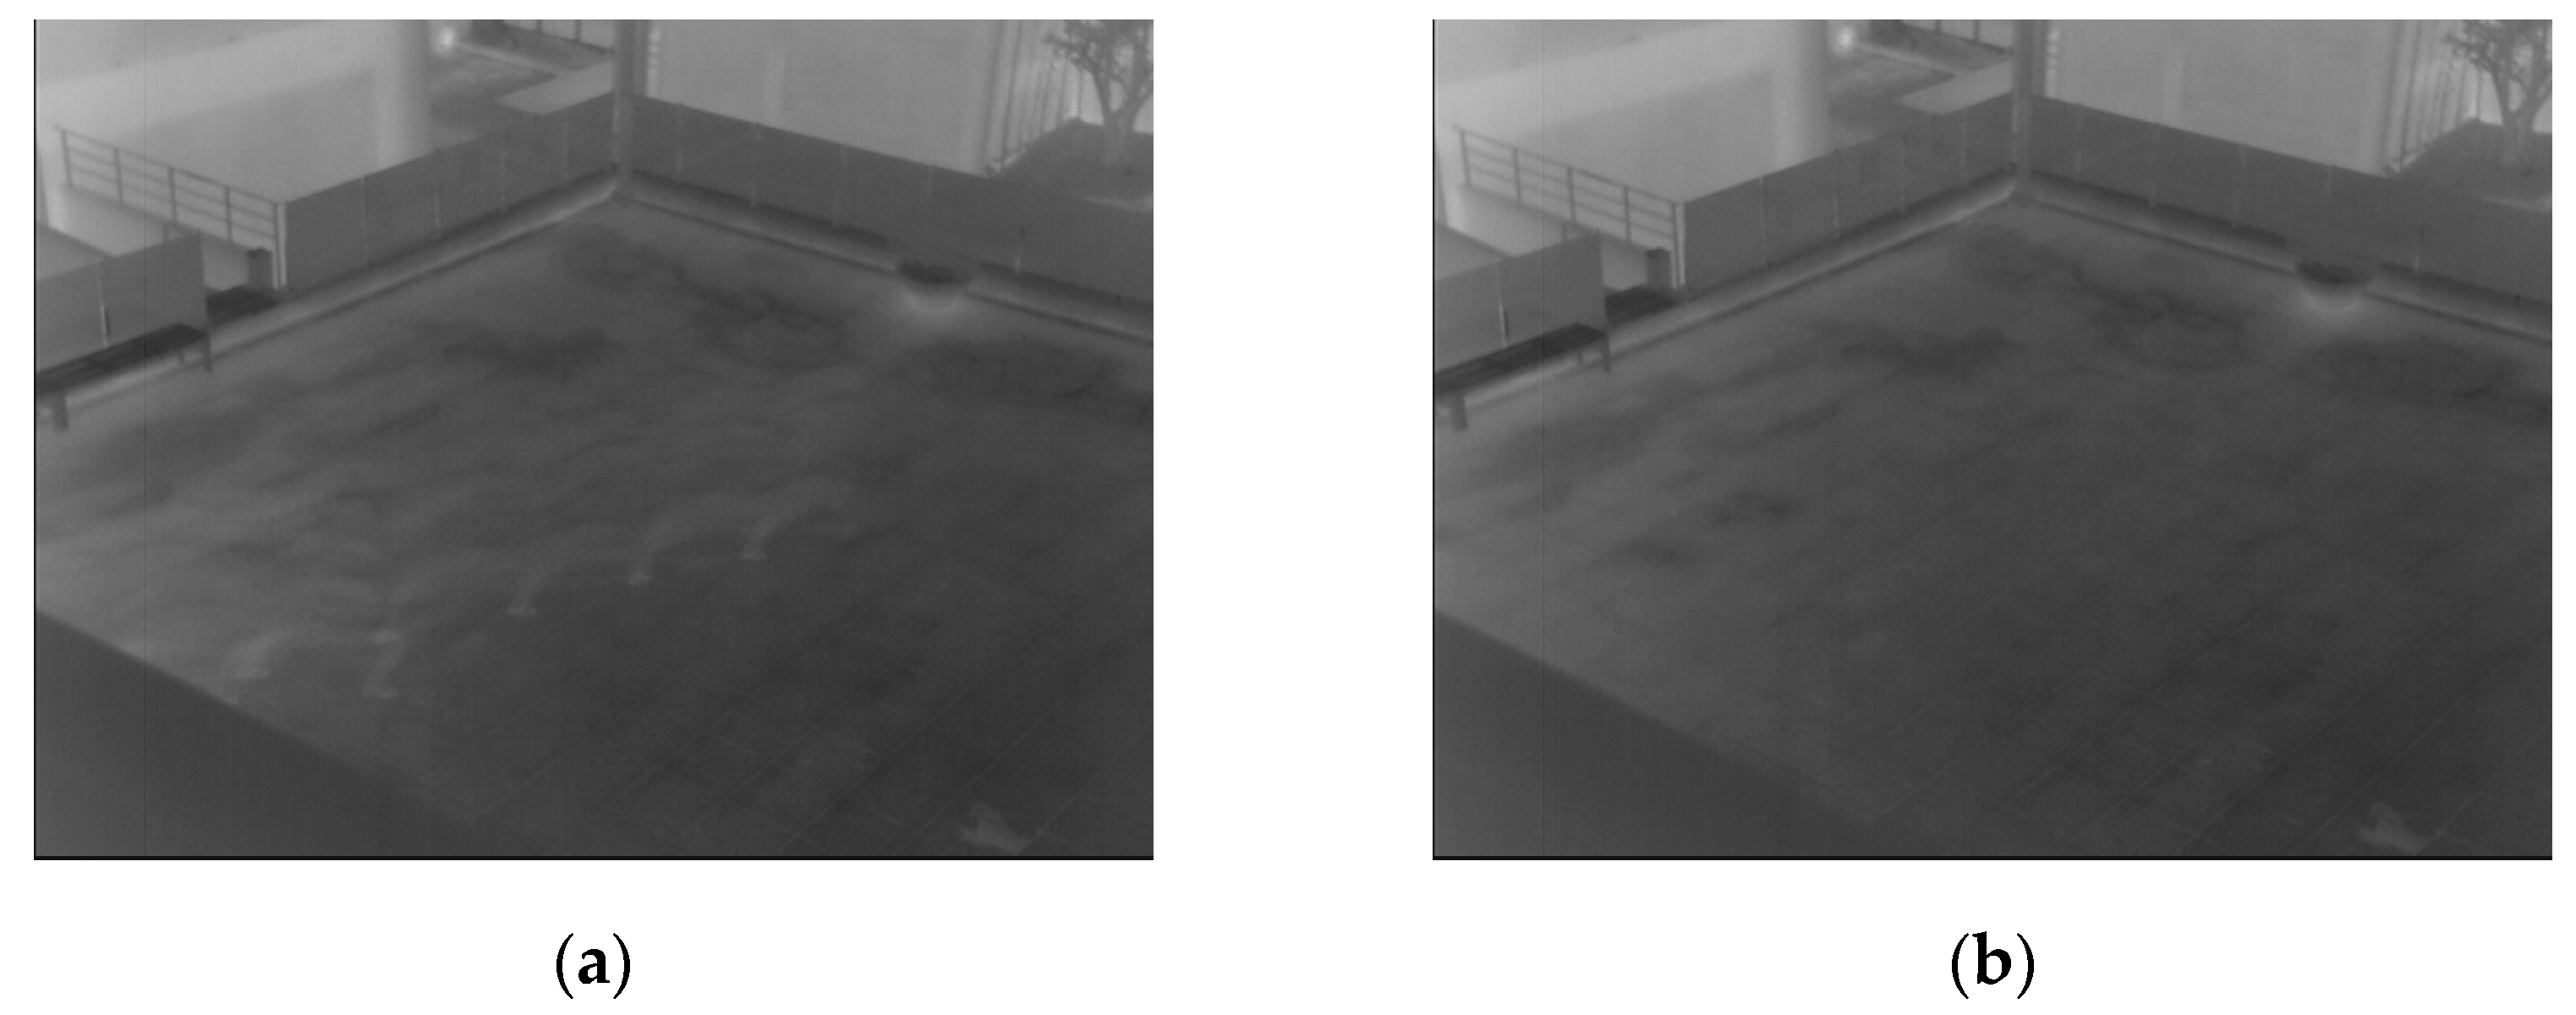
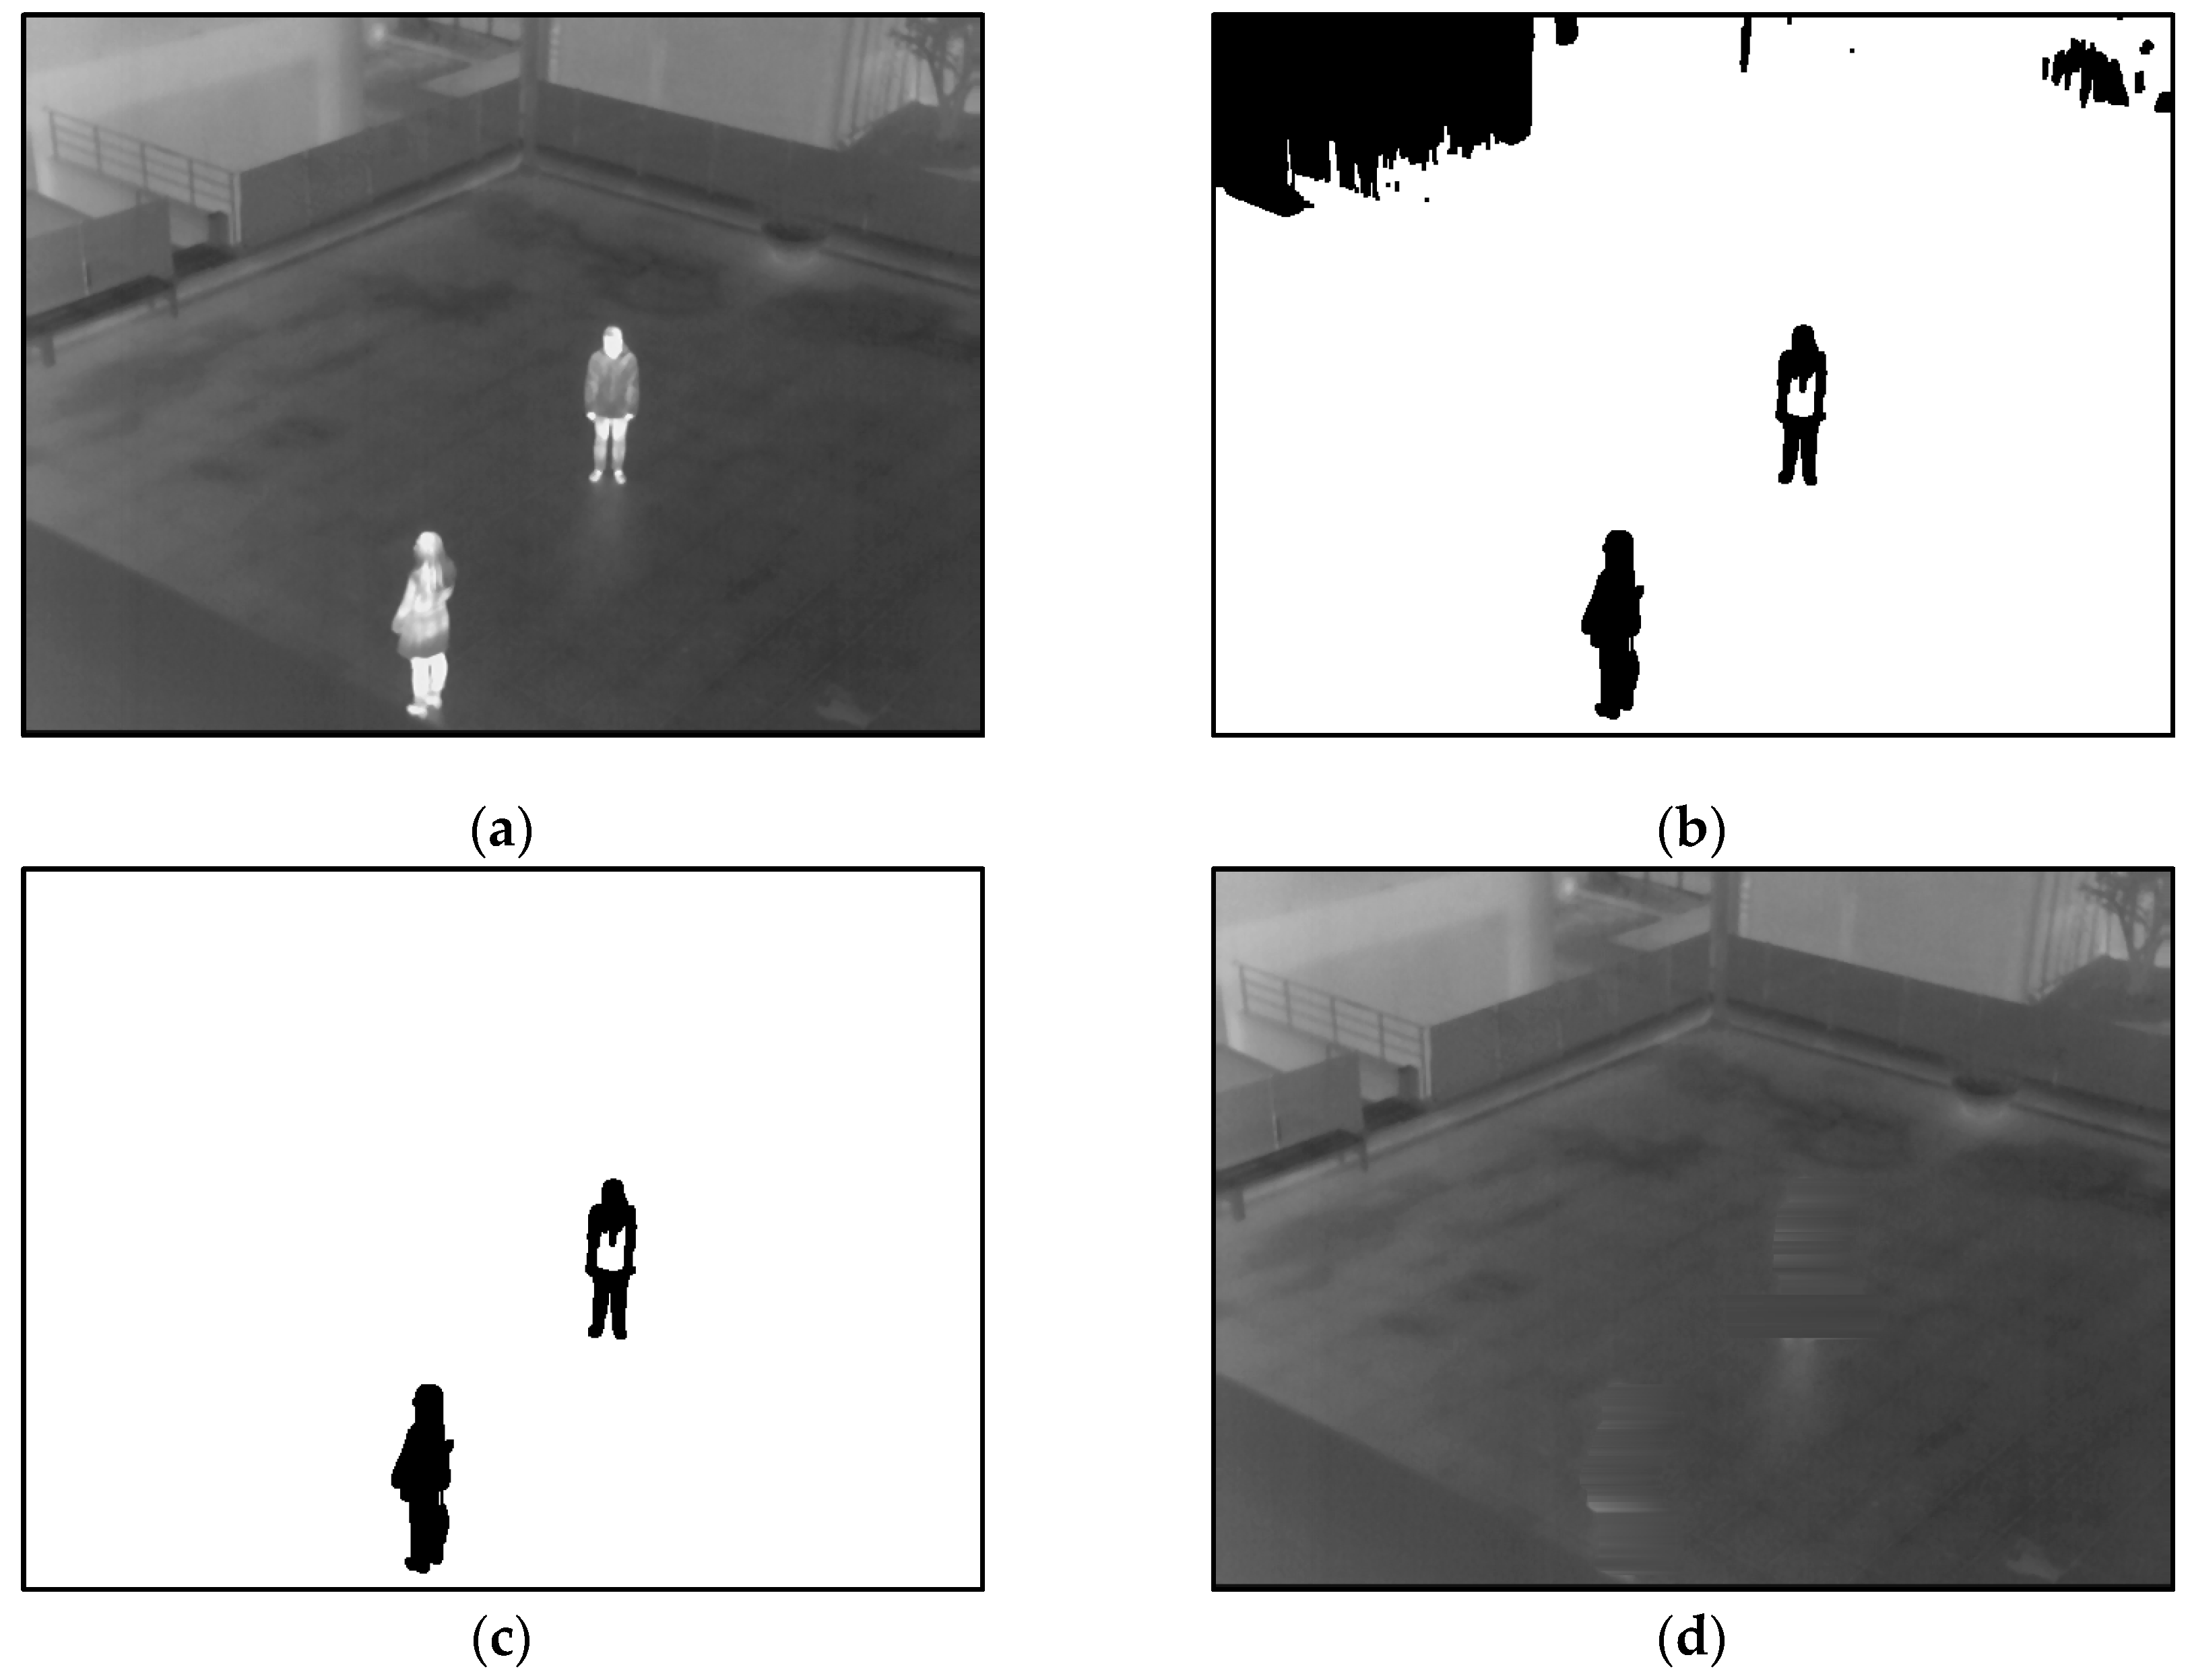
3.2. Results of Generating Background Model
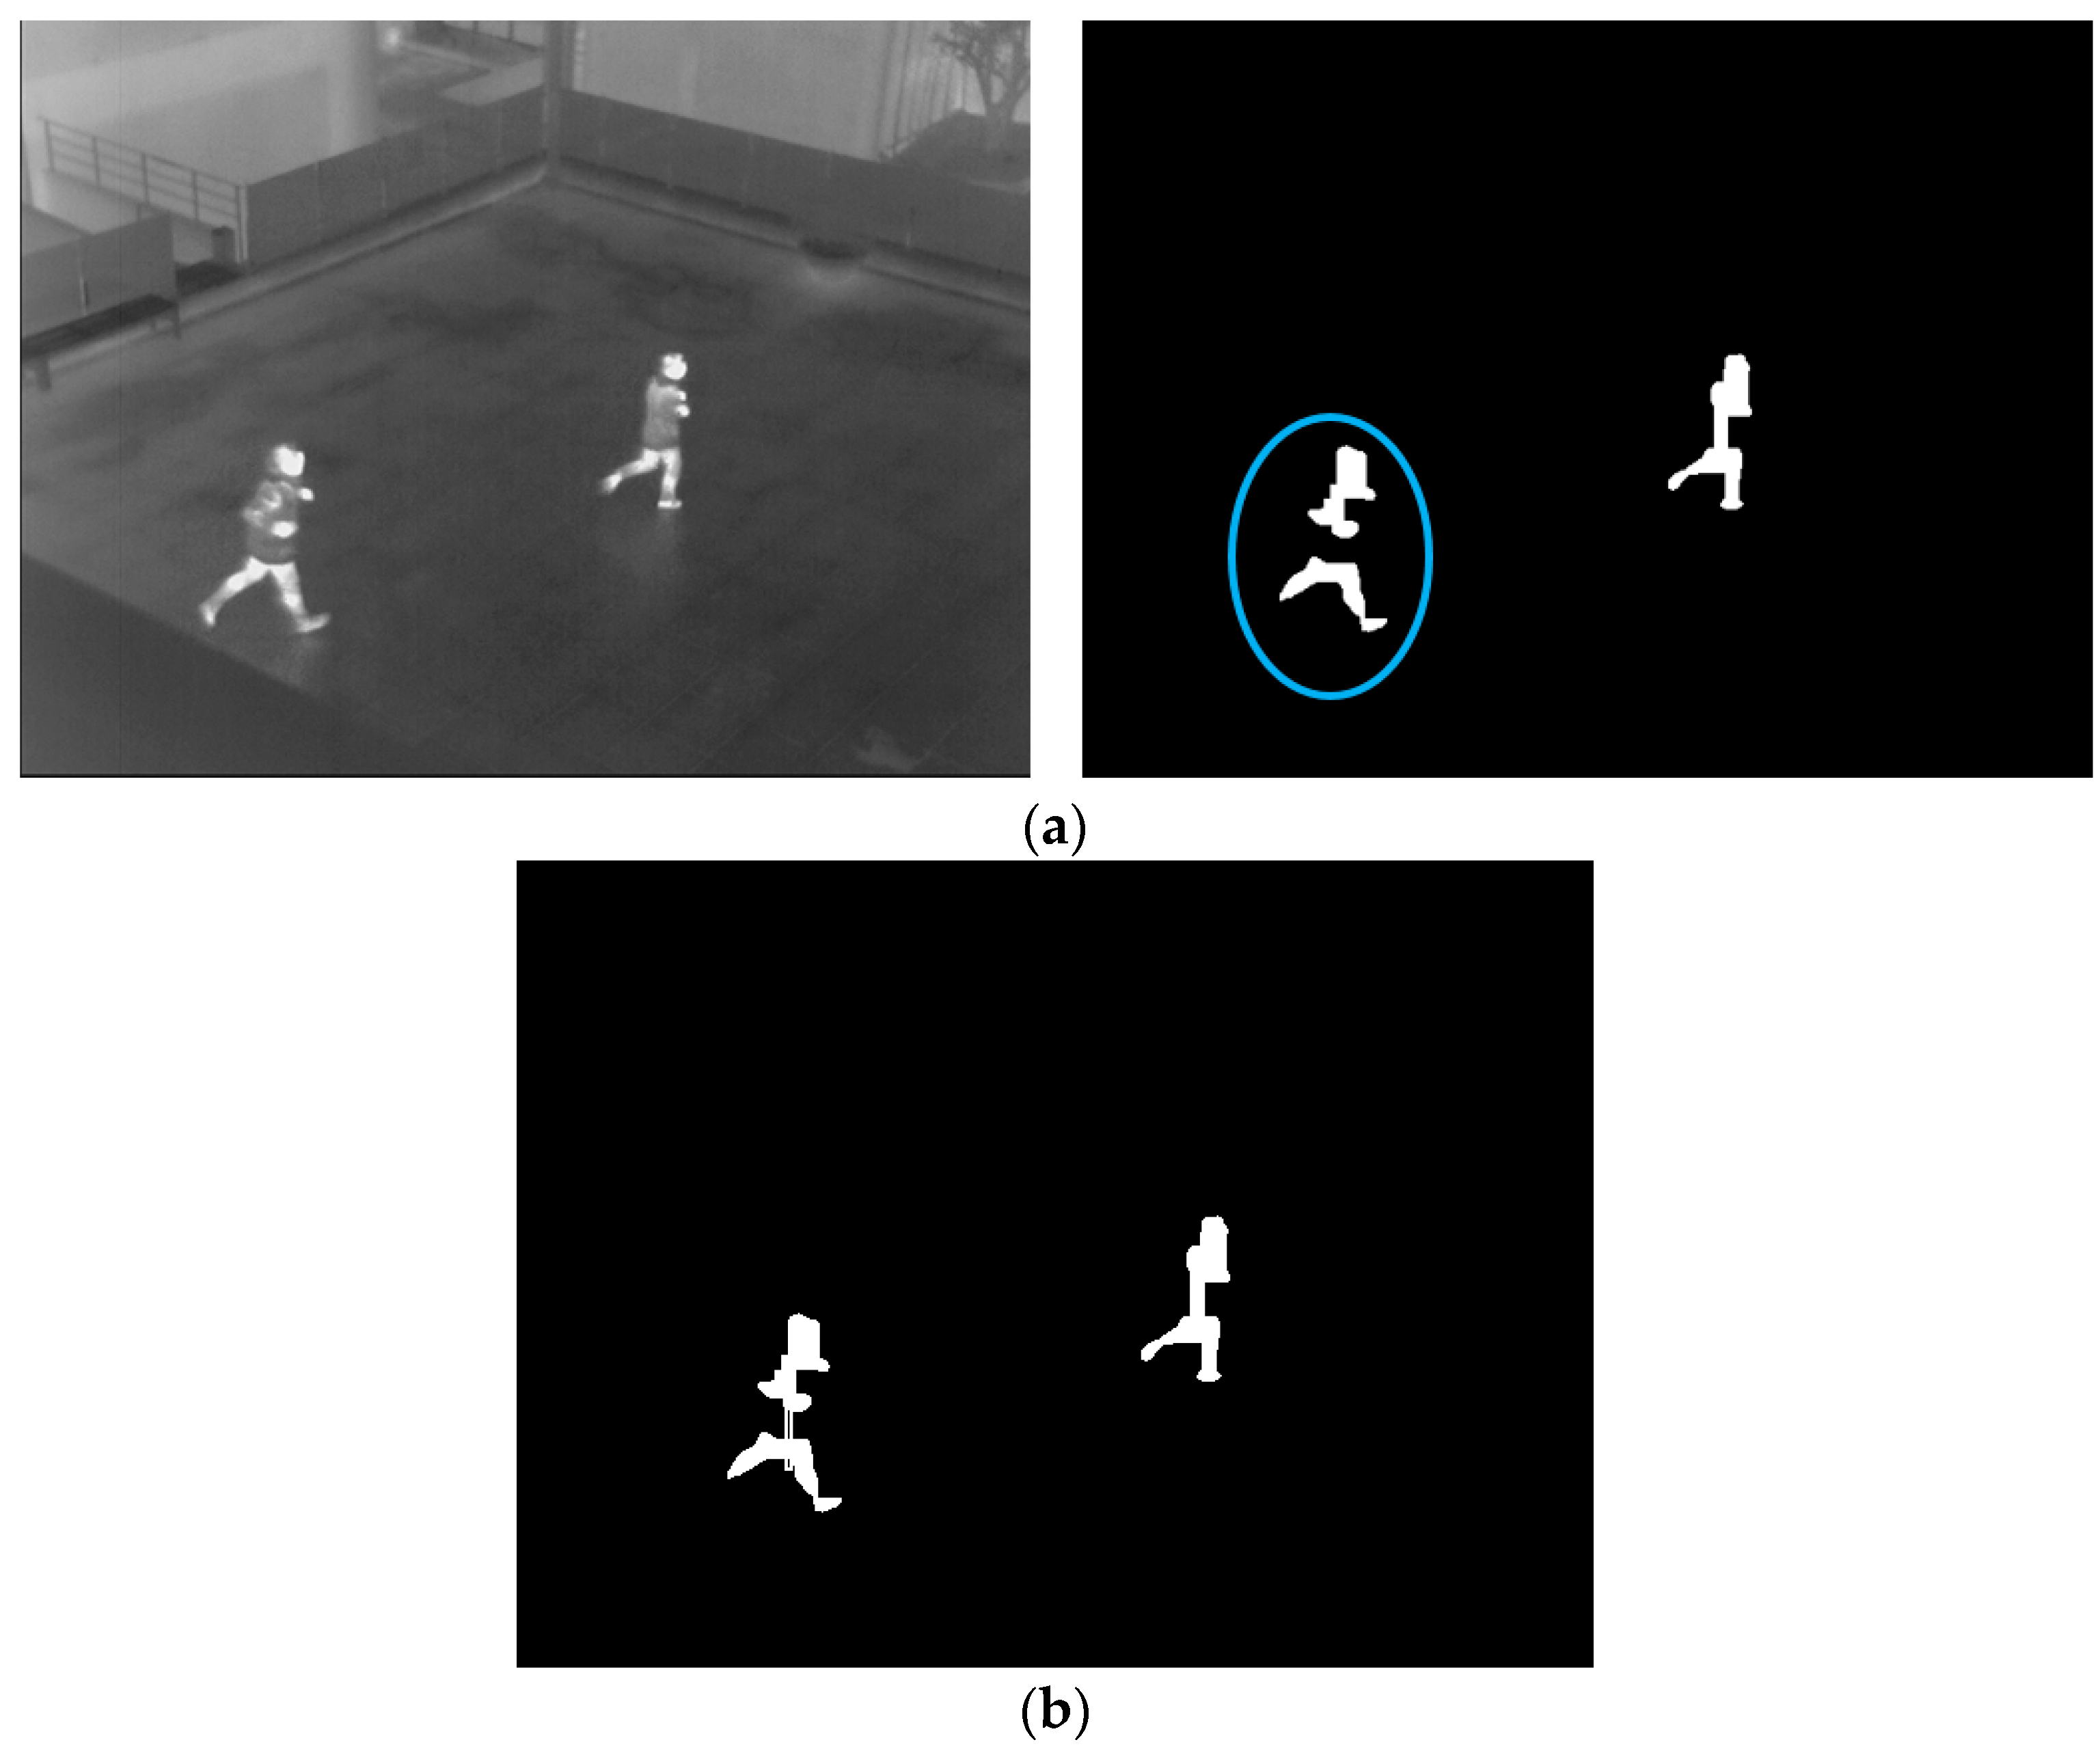
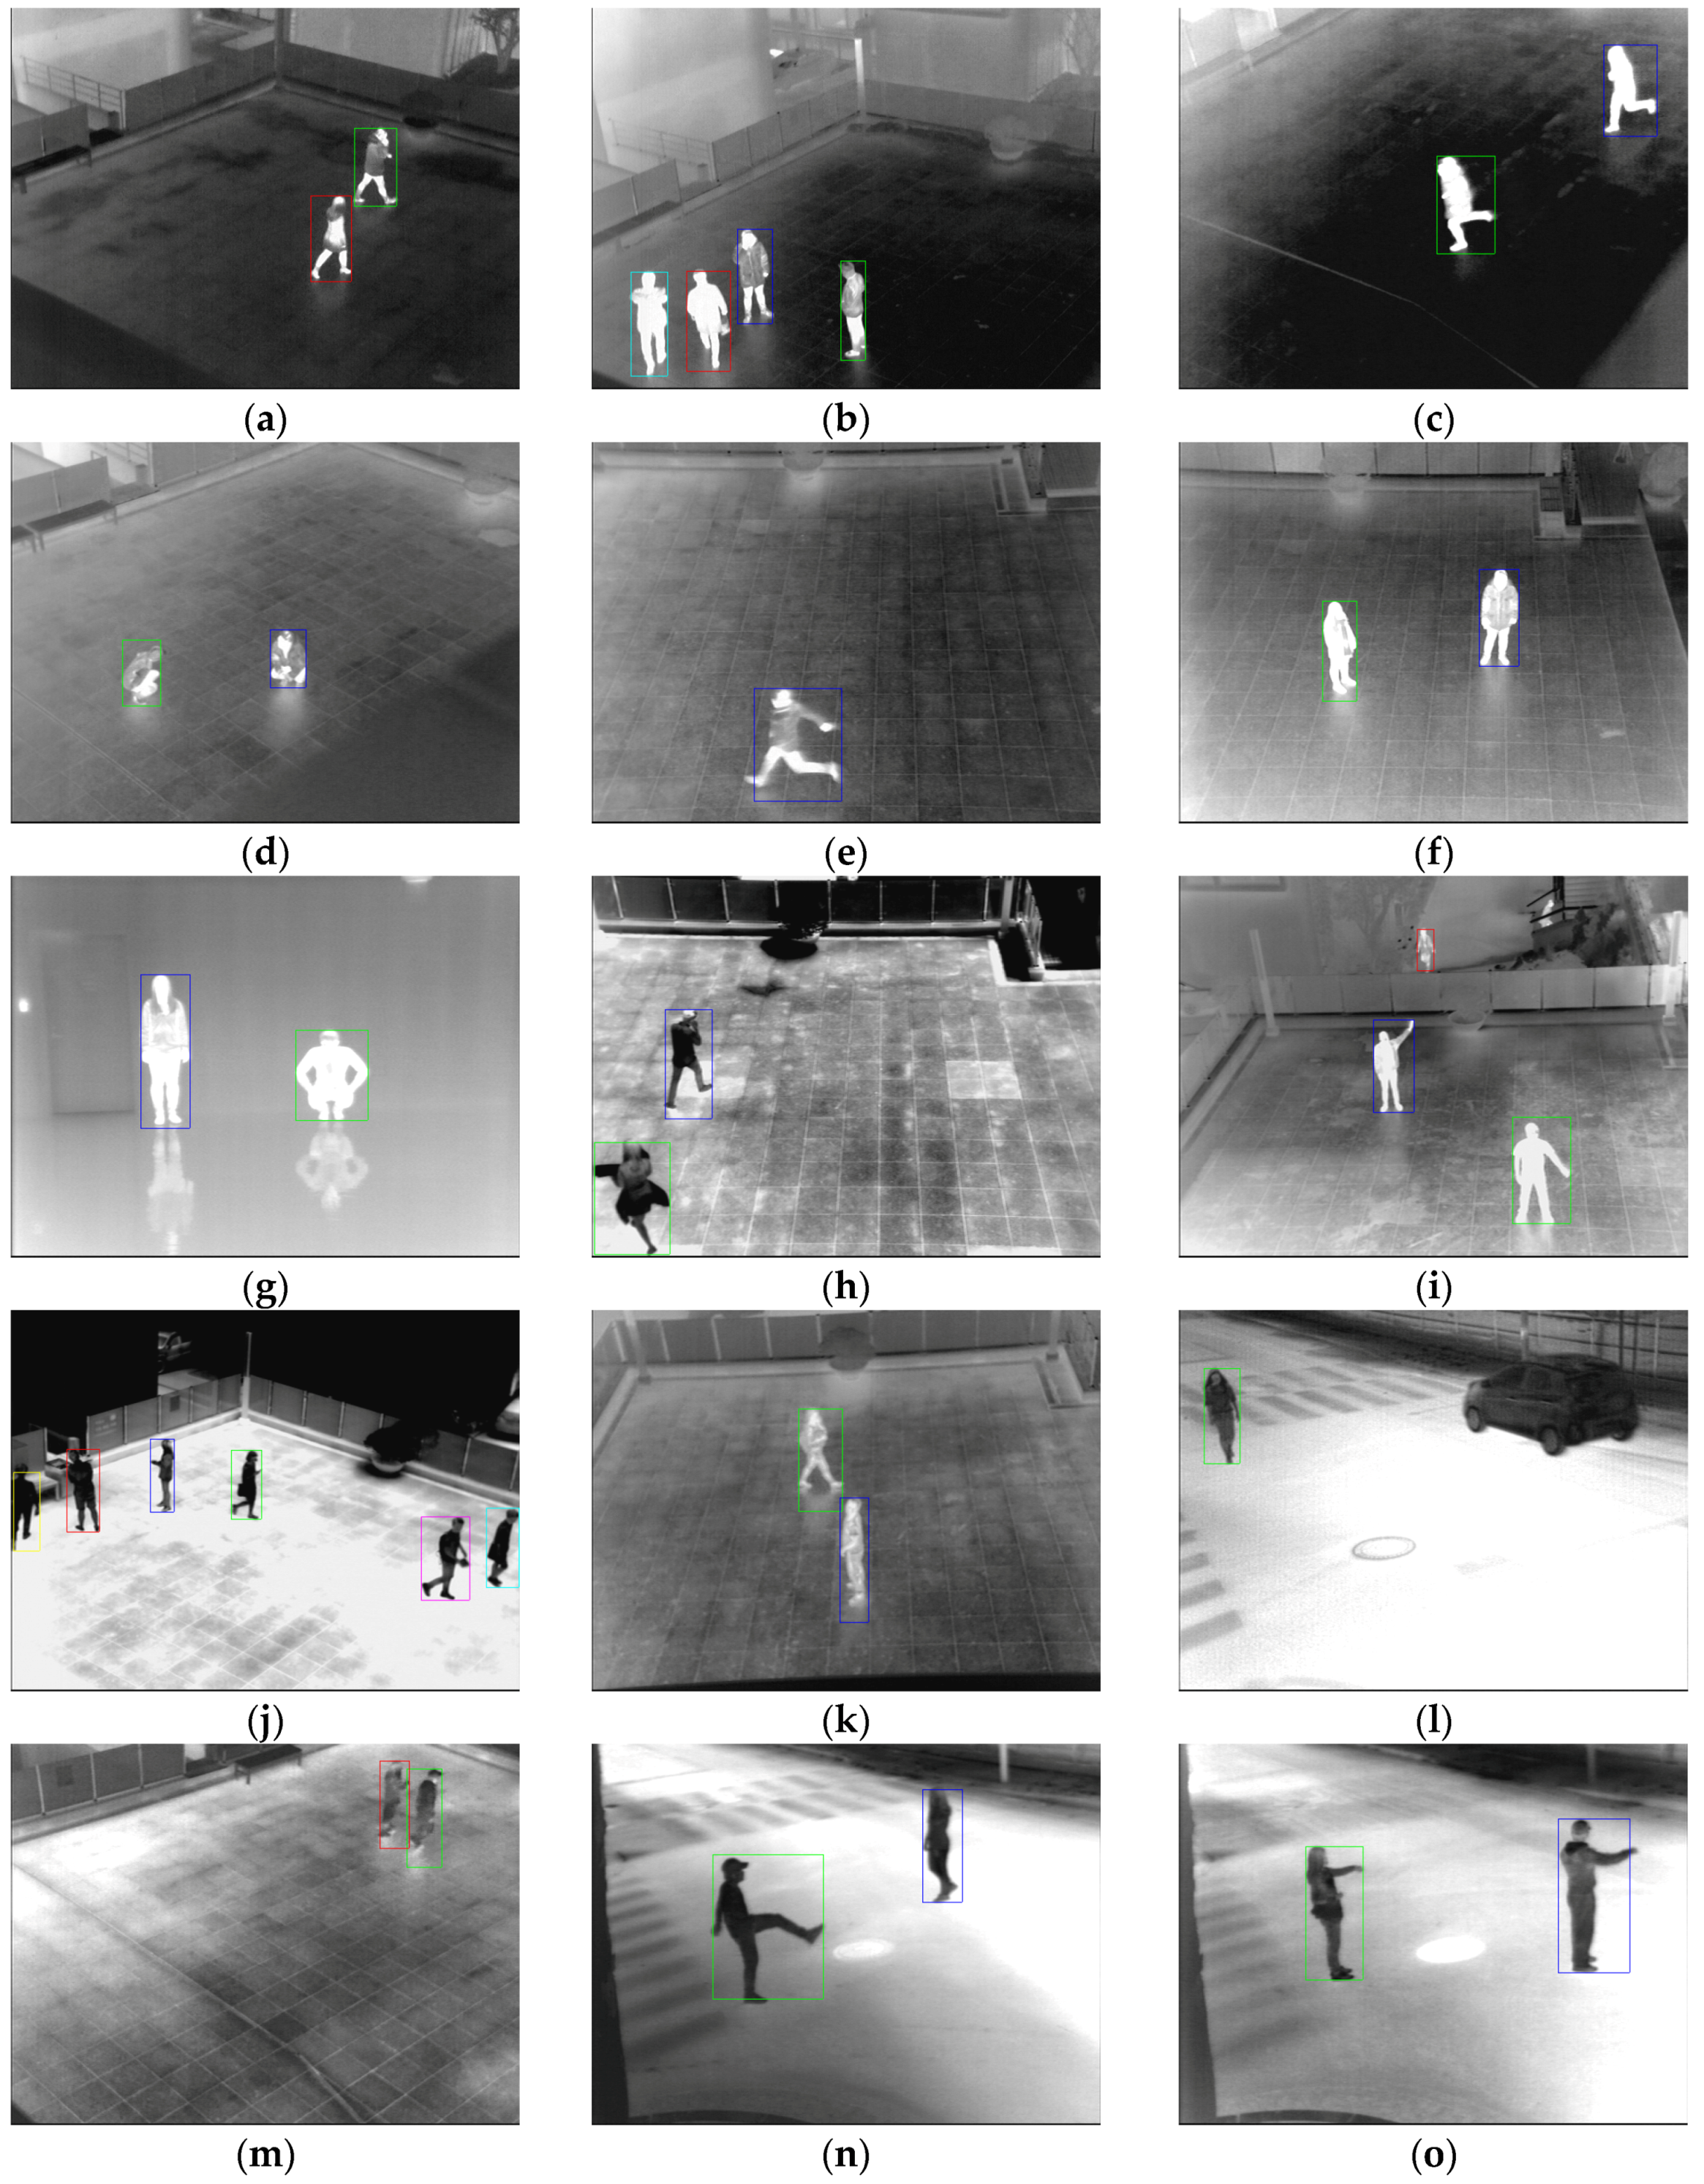
3.3. Detection Results
4. Conclusions
Acknowledgments
Author Contributions
Conflicts of Interest
References
- Ge, J.; Luo, Y.; Tei, G. Real-Time Pedestrian Detection and Tracking at Nighttime for Driver-Assistance Systems. IEEE Trans. Intell. Transp. Syst. 2009, 10, 283–298. [Google Scholar]
- Prioletti, A.; Mogelmose, A.; Grisleri, P.; Trivedi, M.M.; Broggi, A.; Moeslund, T.B. Part-Based Pedestrian Detection and Feature-Based Tracking for Driver Assistance: Real-Time, Robust Algorithms, and Evaluation. IEEE Trans. Intell. Transp. Syst. 2013, 14, 1346–1359. [Google Scholar] [CrossRef]
- Källhammer, J.-E. Night Vision: Requirements and Possible Roadmap for FIR and NIR Systems. In Proceedings of the SPIE—The International Society for Optical Engineering, Strasbourg, France, 6 April 2006; p. 61980F.
- Mehralian, S.; Palhang, M. Pedestrian Detection Using Principal Components Analysis of Gradient Distribution. In Proceedings of the Iranian Conference on Machine Vision and Image Processing, Zanjan, Iran, 10–12 September 2013; pp. 58–63.
- Jiang, Y.; Ma, J. Combination Features and Models for Human Detection. In Proceedings of the IEEE Conference on Computer Vision and Pattern Recognition, Boston, MA, USA, 7–12 June 2015; pp. 240–248.
- Martin, R.; Arandjelović, O. Multiple-Object Tracking in Cluttered and Crowded Public Spaces. Lect. Notes Comput. Sci. 2010, 6455, 89–98. [Google Scholar]
- Khatoon, R.; Saqlain, S.M.; Bibi, S. A Robust and Enhanced Approach for Human Detection in Crowd. In Proceedings of the International Multitopic Conference, Islamabad, Pakistan, 13–15 December 2012; pp. 215–221.
- Fotiadis, E.P.; Garzón, M.; Barrientos, A. Human Detection from a Mobile Robot Using Fusion of Laser and Vision Information. Sensors 2013, 13, 11603–11635. [Google Scholar] [CrossRef] [PubMed]
- Besbes, B.; Rogozan, A.; Rus, A.-M.; Bensrhair, A.; Broggi, A. Pedestrian Detection in Far-Infrared Daytime Images Using a Hierarchical Codebook of SURF. Sensors 2015, 15, 8570–8594. [Google Scholar] [CrossRef] [PubMed]
- Zhu, Q.; Yeh, M.-C.; Cheng, K.-T.; Avidan, S. Fast Human Detection Using a Cascade of Histograms of Oriented Gradients. In Proceedings of the IEEE Computer Society Conference on Computer Vision and Pattern Recognition, New York, NY, USA, 17–22 June 2006; pp. 1491–1498.
- Li, Z.; Zhang, J.; Wu, Q.; Geers, G. Feature Enhancement Using Gradient Salience on Thermal Image. In Proceedings of the International Conference on Digital Image Computing: Techniques and Applications, Sydney, Australia, 1–3 December 2010; pp. 556–562.
- Chang, S.L.; Yang, F.T.; Wu, W.P.; Cho, Y.A.; Chen, S.W. Nighttime Pedestrian Detection Using Thermal Imaging Based on HOG Feature. In Proceedings of the International Conference on System Science and Engineering, Macao, China, 8–10 June 2011; pp. 694–698.
- Rajaei, A.; Shayegh, H.; Charkari, N.M. Human Detection in Semi-Dense Scenes Using HOG descriptor and Mixture of SVMs. In Proceedings of the International Conference on Computer and Knowledge Engineering, Mashhad, Iran, 31 October–1 November 2013; pp. 229–234.
- Bertozzi, M.; Broggi, A.; Rose, M.D.; Felisa, M.; Rakotomamonjy, A.; Suard, F. A Pedestrian De-Tector Using Histograms of Oriented Gradients and a Support Vector Machine Classifier. In Proceedings of the IEEE Conference on Intelligent Transportation Systems, Seattle, WA, USA, 30 September–3 October 2007; pp. 143–148.
- Li, W.; Zheng, D.; Zhao, T.; Yang, M. An Effective Approach to Pedestrian Detection in Thermal Imagery. In Proceedings of the International Conference on Natural Computation, Chongqing, China, 29–31 May 2012; pp. 325–329.
- Wang, W.; Wang, Y.; Chen, F.; Sowmya, A. A Weakly Supervised Approach for Object Detection Based on Soft-Label Boosting. In Proceedings of the IEEE Workshop on Applications of Computer Vision, Tempa, FL, USA, 15–17 January 2013; pp. 331–338.
- Wang, W.; Zhang, J.; Shen, C. Improved Human Detection and Classification in Thermal Images. In Proceedings of the IEEE International Conference on Image Processing, Hong Kong, China, 26–29 September 2010; pp. 2313–2316.
- Takeda, T.; Kuramoto, K.; Kobashi, S.; Haya, Y. A Fuzzy Human Detection for Security System Using Infrared Laser Camera. In Prodeedings of the IEEE International Symposium on Multiple-Valued Logic, Toyama, Japan, 22–24 May 2013; pp. 53–58.
- Sokolova, M.V.; Serrano-Cuerda, J.; Castillo, J.C.; Fernández-Caballero, A. A Fuzzy Model for Human Fall Detection in Infrared Video. J. Intell. Fuzzy Syst. 2013, 24, 215–228. [Google Scholar]
- Nie, F.; Li, J.; Rong, Q.; Pan, M.; Zhang, F. Human Object Extraction Using Nonextensive Fuzzy Entropy and Chaos Differential Evolution. Int. J. Signal Process. Image Process. Pattern Recognit. 2013, 6, 43–54. [Google Scholar]
- Davis, J.W.; Sharma, V. Fusion-Based Background-Subtraction Using Contour Saliency. In Proceedings of the IEEE Computer Society Conference on Computer Vision and Pattern Recognition—Workshops, San Diego, CA, USA, 25 June 2005; pp. 1–9.
- Davis, J.W.; Sharma, V. Background-Subtraction Using Contour-Based Fusion of Thermal and Visible Imagery. Comput. Vis. Image Underst. 2007, 106, 162–182. [Google Scholar] [CrossRef]
- Davis, J.W.; Sharma, V. Robust Detection of People in Thermal Imagery. In Proceedings of the International Conference on Pattern Recognition, Cambridge, UK, 23–26 August 2004; pp. 713–716.
- Dai, C.; Zheng, Y.; Li, X. Layered Representation for Pedestrian Detection and Tracking in Infrared Imagery. In Proceedings of the IEEE Computer Society Conference on Computer Vision and Pattern Recognition—Workshops, San Diego, CA, USA, 25 June 2005; pp. 1–8.
- Dai, C.; Zheng, Y.; Li, X. Pedestrian Detection and Tracking in Infrared Imagery Using Shape and Appearance. Comput. Vis. Image Underst. 2007, 106, 288–299. [Google Scholar] [CrossRef]
- Latecki, L.J.; Miezianko, R.; Pokrajac, D. Tracking Motion Objects in Infrared Videos. In Proceedings of the IEEE International Conference on Advanced Video and Signal Based Surveillance, Como, Italy, 15–16 September 2005; pp. 99–104.
- Mahapatra, A.; Mishra, T.K.; Sa, P.K.; Majhi, B. Background Subtraction and Human Detection in Outdoor Videos Using Fuzzy Logic. In Proceedings of the IEEE International Conference on Fuzzy Systems, Hyderabad, India, 7–10 July 2013; pp. 1–7.
- Cucchiara, R.; Grana, C.; Piccardi, M.; Prati, A. Statistic and Knowledge-Based Moving Object Detection in Traffic Scenes. In Proceedings of the IEEE Conference on Intelligent Transportation Systems, Dearborn, MI, USA, 1–3 October 2000; pp. 27–32.
- Tan, Y.; Guo, Y.; Gao, C. Background Subtraction Based Level Sets for Human Segmentation in Thermal Infrared Surveillance Systems. Infrared Phys. Technol. 2013, 61, 230–240. [Google Scholar] [CrossRef]
- Cucchiara, R.; Grana, X.; Piccardi, M.; Prati, A. Detecting Moving Objects, Ghosts, and Shadows in Video Streams. IEEE Trans. Pattern Anal. Mach. Intell. 2013, 25, 1337–1342. [Google Scholar] [CrossRef]
- Zheng, J.; Wang, Y.; Nihan, N.L.; Hallenbeck, M.E. Extracting Roadway Background Image: A Mode-Based Approach. J. Transp. Res. Rep. 2006, 1944, 82–88. [Google Scholar] [CrossRef]
- Davis, J.W.; Keck, M.A. A Two-Stage Template Approach to Person Detection in Thermal Imagery. In Proceedings of the IEEE Workshop on Applications of Computer Vision, Breckenridge, CO, USA, 5–7 January 2005; pp. 364–369.
- Dagless, E.L.; Ali, A.T.; Cruz, J.B. Visual Road Traffic Monitoring and Data Collection. In Proceedings of the IEEE Vehicle Navigation and Information Systems Conference, Ottawa, ON, Canada, 12–15 October 1993; pp. 146–149.
- Baf, F.E.; Bouwmans, T.; Vachon, B. Fuzzy Foreground Detection for Infrared Videos. In Proceedings of the IEEE Computer Society Conference on Computer Vision and Pattern Recognition Workshops, Anchorage, AK, USA, 23–28 June 2008; pp. 1–6.
- Shakeri, M.; Deldari, H.; Foroughi, H.; Saberi, A.; Naseri, A. A Novel Fuzzy Background Subtraction Method Based on Cellular Automata for Urban Traffic Applications. In Proceedings of the International Conference on Signal Processing, Beijing, China, 26–29 October 2008; pp. 899–902.
- Zheng, Y.; Fan, L. Moving Object Detection Based on Running Average Background and Temporal Difference. In Proceedings of the International Conference on Intelligent Systems and Knowledge Engineering, Hangzhou, China, 15–16 November 2010; pp. 270–272.
- Jeon, E.S.; Choi, J.-S.; Lee, J.H.; Shin, K.Y.; Kim, Y.G.; Le, T.T.; Park, K.R. Human Detection Based on the Generation of a Background Image by Using a Far-Infrared Light Camera. Sensors 2015, 15, 6763–6788. [Google Scholar] [CrossRef] [PubMed]
- Infrared. Available online: https://en.wikipedia.org/wiki/Infrared (accessed on 23 December 2015).
- Niblack, W. An Introduction to Digital Image Processing, 1st ed.; Prentice Hall: Englewood Cliffs, NJ, USA, 1986. [Google Scholar]
- Gonzalez, R.C.; Woods, R.E. Digital Image Processing, 1st ed.; Addison-Wesley: Boston, MA, USA, 1992. [Google Scholar]
- Bayu, B.S.; Miura, J. Fuzzy-based Illumination Normalization for Face Recognition. In Proceedings of the IEEE Workshop on Advanced Robotics and Its Social Impacts, Tokyo, Japan, 7–9 November 2013; pp. 131–136.
- Barua, A.; Mudunuri, L.S.; Kosheleva, O. Why trapezoidal and triangular membership functions work so well: Towards a theoretical explanation. J. Uncertain Syst. 2014, 8, 164–168. [Google Scholar]
- Zhao, J.; Bose, B.K. Evaluation of Membership Functions for Fuzzy Logic Controlled Induction Motor Drive. In Proceedings of the IEEE Annual Conference of the Industrial Electronics Society, Sevilla, Spain, 5–8 November 2002; pp. 229–234.
- Naaz, S.; Alam, A.; Biswas, R. Effect of Different Defuzzification Methods in a Fuzzy Based Load Balancing Application. Int. J. Comput. Sci. Issues 2011, 8, 261–267. [Google Scholar]
- Nam, G.P.; Park, K.R. New Fuzzy-Based Retinex Method for the Illumination Normalization of Face Recognition. Int. J. Adv. Rob. Syst. 2012, 9, 1–9. [Google Scholar]
- Leekwijck, W.V.; Kerre, E.E. Defuzzification: Criteria and Classification. Fuzzy Sets Syst. 1999, 108, 159–178. [Google Scholar] [CrossRef]
- Lee, J.H.; Choi, J.-S.; Jeon, E.S.; Kim, Y.G.; Le, T.T.; Shin, K.Y.; Lee, H.C.; Park, K.R. Robust Pedestrian Detection by Combining Visible and Thermal Infrared Cameras. Sensors 2015, 15, 10580–10615. [Google Scholar] [CrossRef] [PubMed]
- Vezzani, R.; Baltieri, D.; Cucchiara, R. HMM Based Action Recognition with Projection Histogram Features. Lect. Notes Comput. Sci. 2010, 6388, 286–293. [Google Scholar]
- Tau 2 Uncooled Cores. Available online: http://www.flir.com/cores/display/?id=54717 (accessed on 23 December 2015).
- Olmeda, D.; Premebida, C.; Nunes, U.; Armingol, J.M.; Escalera, A.D.L. Pedestrian Detection in Far Infrared Images. Integr. Comput. Aided Eng. 2013, 20, 347–360. [Google Scholar]
- Dollar, P.; Wojek, C.; Schiele, B.; Perona, P. Pedestrian Detection: An Evaluation of the State of the Art. IEEE Trans. Pattern Anal. Mach. Intell. 2012, 34, 743–761. [Google Scholar] [CrossRef] [PubMed]
- Everingham, M.; Gool, L.V.; Williams, C.K.I.; Winn, J.; Zisserman, A. The Pascal Visual Object Classes (VOC) Challenge. Int. J. Comput. Vis. 2010, 88, 303–338. [Google Scholar] [CrossRef]
- Sensitivity and Specificity. Available online: http://en.wikipedia.org/wiki/Sensitivity_and_specificity (accessed on 23 December 2015).
- F1-Score. Available online: https://en.wikipedia.org/wiki/Precision_and_recall (accessed on 23 December 2015).
- OTCBVS Benchmark Dataset Collection. Available online: http://vcipl-okstate.org/pbvs/bench/ (accessed on 28 January 2016).


| Input 1 (F1) | Input 2 (F2) | Output (p) |
|---|---|---|
| L | L | L |
| L | H | VH |
| M | L | M |
| M | H | M |
| H | L | H |
| H | H | VL |
| f1(·) | f2(·) | Value |
|---|---|---|
| 0.2 (L) | 0.136 (L) | 0.136 (L) |
| 0.2 (L) | 0.358 (H) | 0.2 (VH) |
| 0.1 (M) | 0.136 (L) | 0.1 (M) |
| 0.1 (M) | 0.358 (H) | 0.1 (M) |
| f1(·) | f2(·) | Value |
|---|---|---|
| 0.25 (M) | 0.394 (L) | 0.25 (M) |
| 0.25 (M) | 0.104 (H) | 0.104 (M) |
| 0.125 (H) | 0.394 (L) | 0.125 (H) |
| 0.125 (H) | 0.104 (H) | 0.104 (VL) |
| Database | Condition | Detail Description |
|---|---|---|
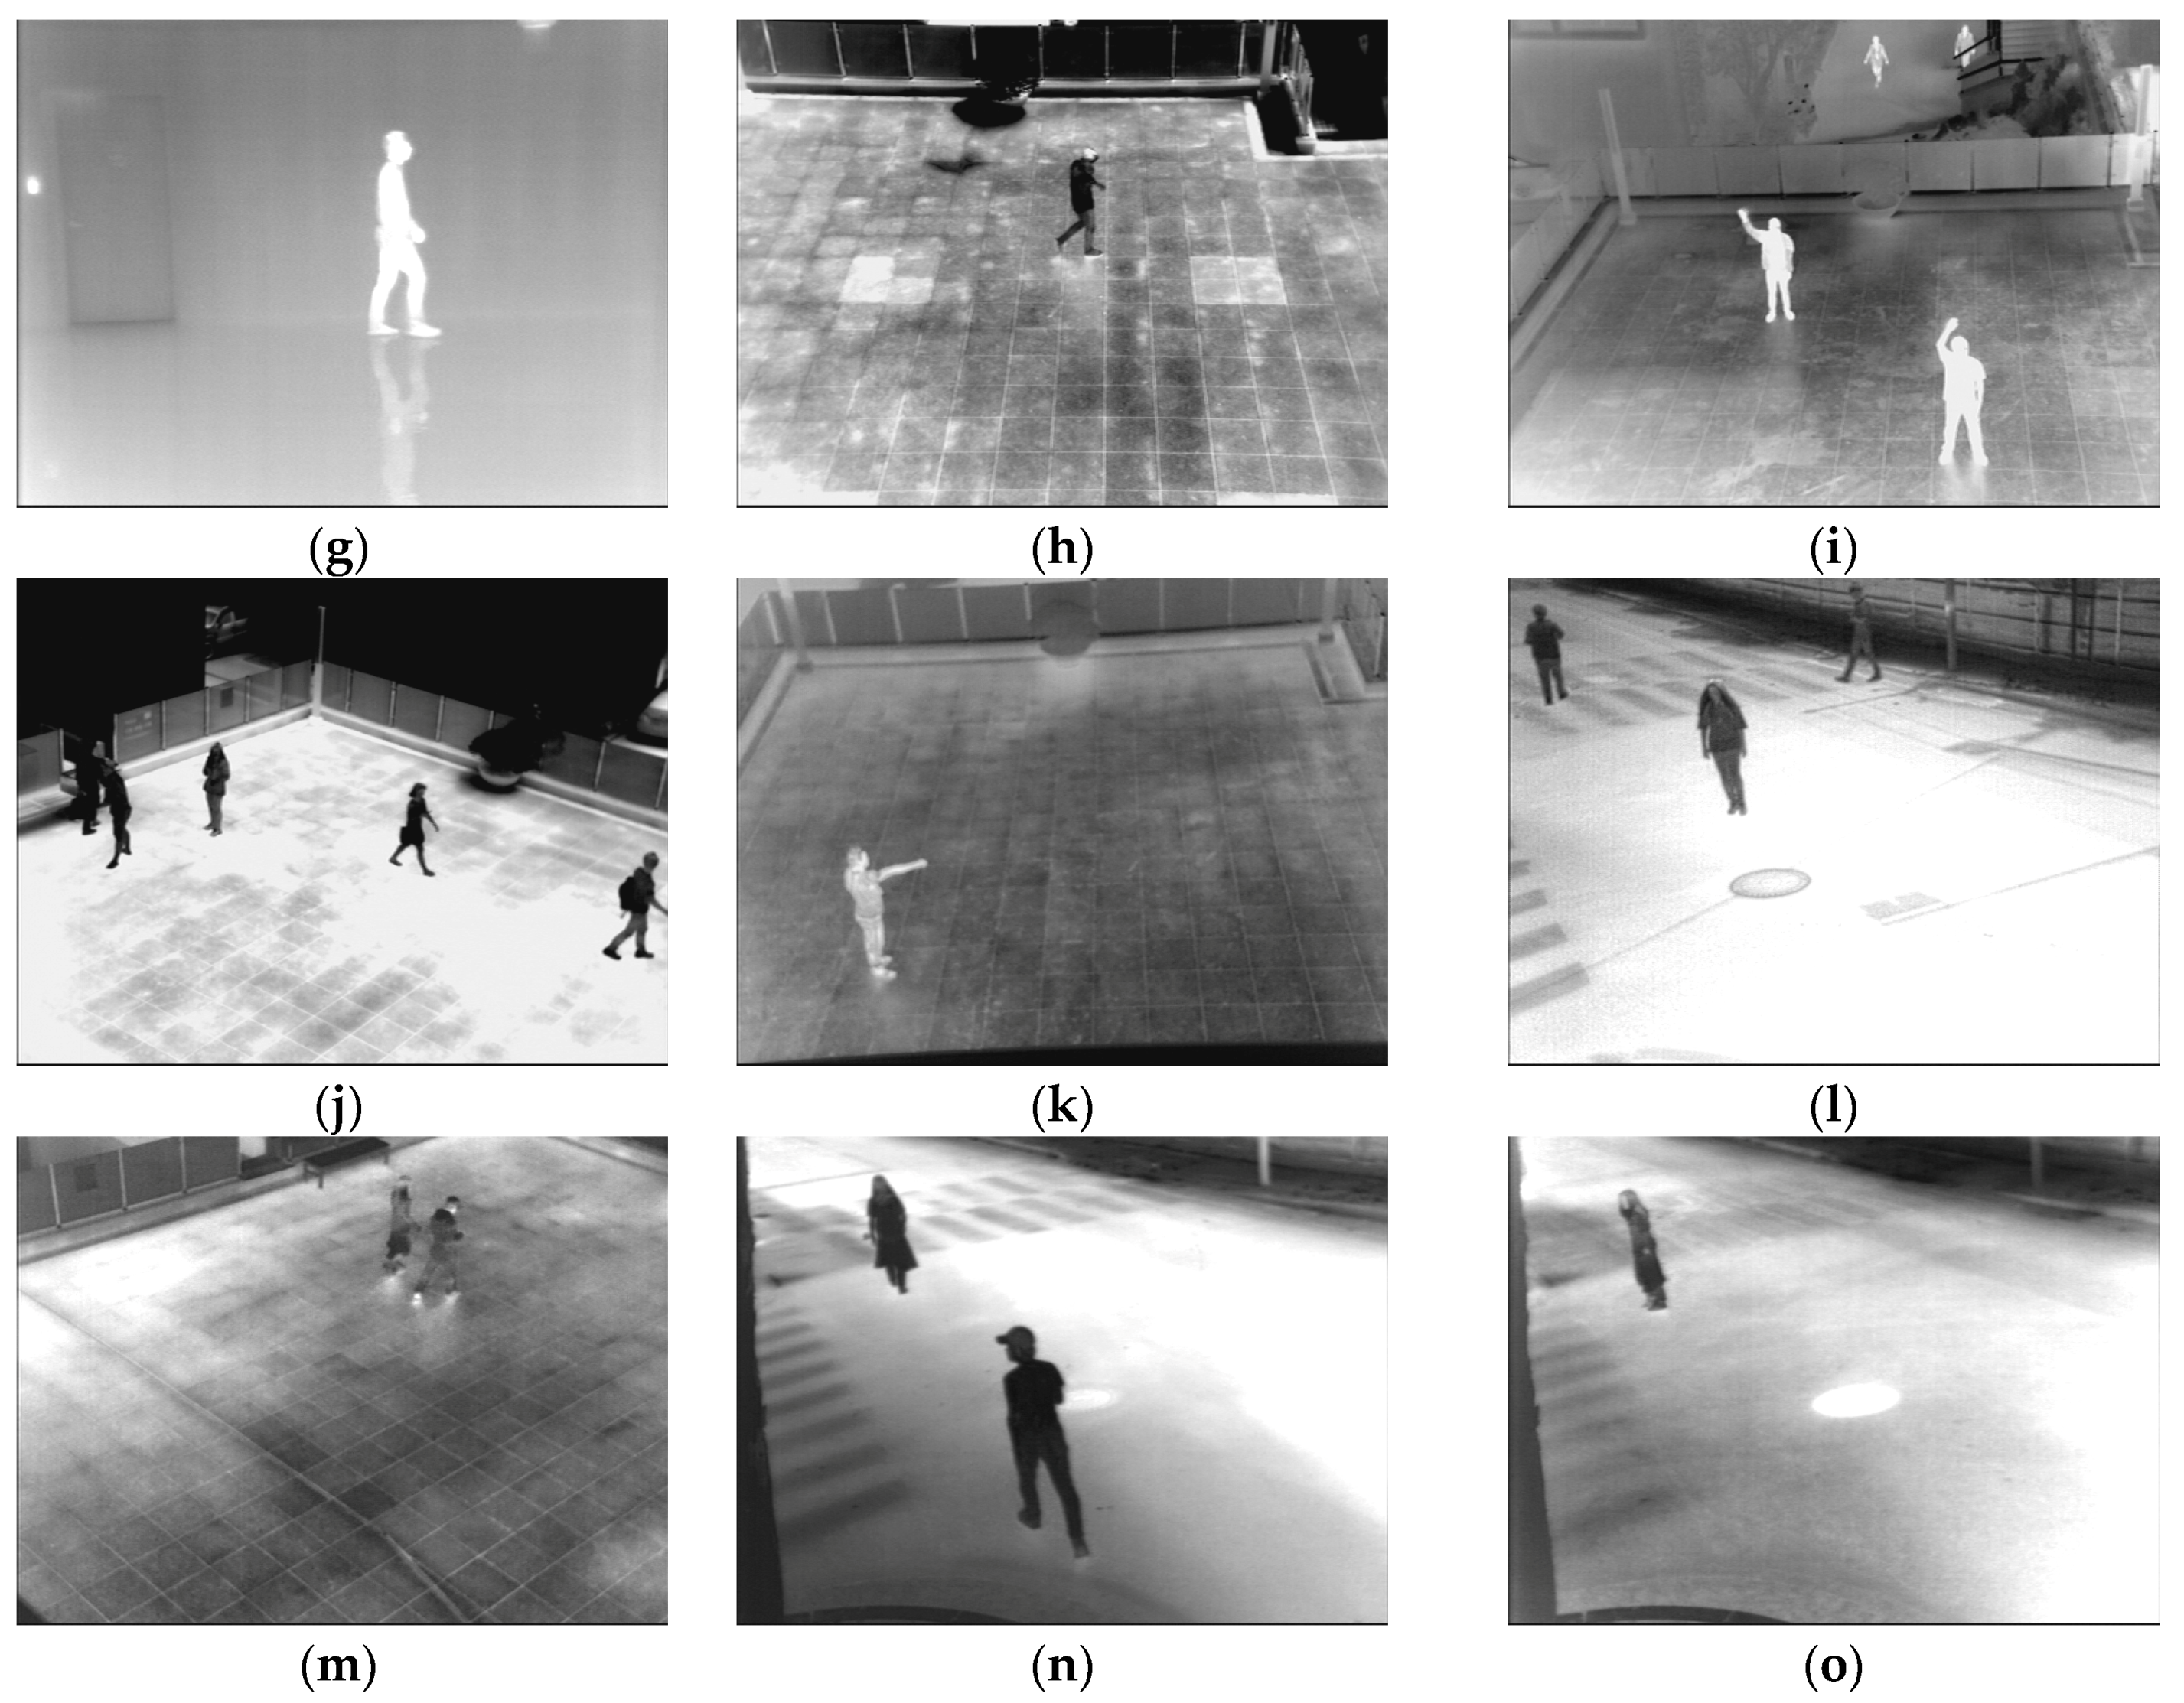
| I (see in Figure 21a) | 2 °C, morning, average −1 °C during the day, snowy, wind 3.6 mph |
|
| II (see in Figure 21b) | −2 °C, night, average −3 °C during the day, wind 2.4 mph |
|
| III (see in Figure 21c) | −1 °C, morning, average 3 °C during the day, sunny after rainy at dawn time, wind 4.0 mph |
|
| IV (see in Figure 21d) | −6 °C, night, average −3 °C during the day, sunny after rainy at dawn time, wind 4.0 mph |
|
| V (see in Figure 21e) | −2 °C, night, average −2 °C during the day, sunny, wind 4.9 mph |
|
| VI (see in Figure 21f) | −1 °C, morning, average 2 °C during the day, sunny, wind 2.5 mph |
|
| VII (see in Figure 21g) | 22 °C, indoor, average −12 °C during the day outside, no wind |
|
| VIII (see in Figure 21h) | 26 °C, afternoon, average 21 °C during the day, sunny, wind 1 mph |
|
| IX (see in Figure 21i) | 14 °C, morning, average −18 °C during the day, sunny, wind 2.4 mph |
|
| X (see in Figure 21j) | 28 °C, afternoon, average −23 °C during the day, sunny, wind 5 mph |
|
| XI (see in Figure 21k) | 18 °C, night, average 19 °C during the day, sunny after rainfall during the daytime, wind 2 mph |
|
| XII (see in Figure 21l) | 27 °C, afternoon, average 23 °C during the day, sunny, wind 4.3 mph |
|
| XIII (see in Figure 21m) | 27 °C, night, average 29 °C during the day, sunny after rainfall during morning, wind 2.4 mph |
|
| XIV (see in Figure 21n) | 33 °C, afternoon, average 29 °C during the day, sunny, wind 3.5 mph |
|
| XV (see in Figure 21o) | 30 °C, night, average 29 °C during the day, sunny, wind 2.5 mph |
|
| Database No. | #Frames | #People | #TP | #FP | Sensitivity | PPV | F1-Score |
|---|---|---|---|---|---|---|---|
| I | 2609 | 3928 | 3905 | 48 | 0.9941 | 0.9879 | 0.9910 |
| II | 2747 | 4543 | 4536 | 135 | 0.9985 | 0.9711 | 0.9846 |
| III | 3151 | 5434 | 5433 | 60 | 0.9998 | 0.9891 | 0.9944 |
| IV | 3099 | 4461 | 4368 | 101 | 0.9792 | 0.9774 | 0.9783 |
| V | 4630 | 5891 | 5705 | 113 | 0.9684 | 0.9806 | 0.9745 |
| VI | 3427 | 3820 | 3820 | 70 | 1 | 0.9820 | 0.9909 |
| VII | 3330 | 3098 | 3046 | 14 | 0.9832 | 0.9954 | 0.9893 |
| VIII | 1316 | 1611 | 1505 | 58 | 0.9342 | 0.9629 | 0.9483 |
| IX | 905 | 2230 | 1818 | 0 | 0.8152 | 1 | 0.8982 |
| X | 1846 | 3400 | 3056 | 112 | 0.8988 | 0.9646 | 0.9306 |
| XI | 5599 | 6046 | 5963 | 162 | 0.9863 | 0.9736 | 0.9799 |
| XII | 2913 | 4399 | 3407 | 676 | 0.7745 | 0.8344 | 0.8033 |
| XIII | 3588 | 4666 | 4047 | 33 | 0.8673 | 0.9919 | 0.9255 |
| XIV | 5104 | 7232 | 7036 | 158 | 0.9729 | 0.9780 | 0.9755 |
| XV | 1283 | 1924 | 1913 | 148 | 0.9942 | 0.9282 | 0.9601 |
| Total | 45,546 | 62,683 | 59,558 | 1888 | 0.9501 | 0.9693 | 0.9596 |
| Behavior | #Frames | #People | #TP | #FP | Sensitivity | PPV | F1-Score |
|---|---|---|---|---|---|---|---|
| Walking | 17,380 | 22,315 | 20,186 | 1340 | 0.9046 | 0.9378 | 0.9209 |
| Running | 6274 | 3864 | 3776 | 153 | 0.9772 | 0.9611 | 0.9536 |
| Standing | 5498 | 10,430 | 10,356 | 67 | 0.9929 | 0.9936 | 0.9932 |
| Sitting | 6179 | 11,417 | 11,364 | 3 | 0.9954 | 0.9997 | 0.9975 |
| Waving | 1975 | 3611 | 3181 | 0 | 0.8809 | 1 | 0.9367 |
| Punching | 3932 | 5434 | 5117 | 96 | 0.9417 | 0.9816 | 0.9612 |
| Kicking | 4308 | 5612 | 5578 | 229 | 0.9939 | 0.9606 | 0.9770 |
| DB No. | Sensitivity | PPV | F1-Score | |||||||||
|---|---|---|---|---|---|---|---|---|---|---|---|---|
| Ours | Previous Method | Ours | Previous Method | Ours | Previous Method | |||||||
| [24] | [32] | [37] | [24] | [32] | [37] | [24] | [32] | [37] | ||||
| I | 0.9941 | 0.9514 | 0.9351 | 0.9832 | 0.9879 | 0.9544 | 0.8713 | 0.9621 | 0.9910 | 0.9529 | 0.9021 | 0.9725 |
| II | 0.9985 | 0.9595 | 0.9406 | 0.9885 | 0.9711 | 0.9462 | 0.8623 | 0.9539 | 0.9846 | 0.9528 | 0.8998 | 0.9709 |
| III | 0.9998 | 0.9522 | 0.9366 | 0.9763 | 0.9891 | 0.9515 | 0.8711 | 0.9597 | 0.9944 | 0.9519 | 0.9027 | 0.9679 |
| IV | 0.9792 | 0.9386 | 0.9219 | 0.9698 | 0.9774 | 0.9497 | 0.8698 | 0.9678 | 0.9783 | 0.9441 | 0.8951 | 0.9688 |
| V | 0.9684 | 0.9257 | 0.9085 | 0.9559 | 0.9806 | 0.9605 | 0.8792 | 0.9681 | 0.9745 | 0.9428 | 0.8936 | 0.9620 |
| VI | 1 | 0.9601 | 0.9441 | 0.9913 | 0.9820 | 0.9525 | 0.8712 | 0.9696 | 0.9909 | 0.9563 | 0.9062 | 0.9803 |
| VII | 0.9832 | 0.9432 | 0.9231 | 0.9714 | 0.9954 | 0.9644 | 0.8823 | 0.9713 | 0.9893 | 0.9537 | 0.9022 | 0.9714 |
| VIII | 0.9342 | 0.9001 | 0.8792 | 0.9278 | 0.9629 | 0.9399 | 0.8581 | 0.9473 | 0.9483 | 0.9196 | 0.8685 | 0.9374 |
| IX | 0.8152 | 0.7653 | 0.7554 | 0.8049 | 1 | 0.9731 | 0.8923 | 0.9815 | 0.8982 | 0.8568 | 0.8182 | 0.8845 |
| X | 0.8988 | 0.8509 | 0.8325 | 0.8811 | 0.9646 | 0.9327 | 0.8498 | 0.9409 | 0.9306 | 0.8899 | 0.8411 | 0.9100 |
| XI | 0.9863 | 0.9414 | 0.9225 | 0.9709 | 0.9736 | 0.9497 | 0.8612 | 0.9573 | 0.9799 | 0.9455 | 0.8908 | 0.9641 |
| XII | 0.7745 | 0.7278 | 0.7105 | 0.7592 | 0.8344 | 0.8121 | 0.7193 | 0.8199 | 0.8033 | 0.7676 | 0.7149 | 0.7884 |
| XIII | 0.8673 | 0.8198 | 0.8019 | 0.8509 | 0.9919 | 0.9623 | 0.8802 | 0.9793 | 0.9255 | 0.8854 | 0.8392 | 0.9106 |
| XIV | 0.9729 | 0.9309 | 0.9113 | 0.9599 | 0.9780 | 0.9431 | 0.8621 | 0.9518 | 0.9755 | 0.9370 | 0.8860 | 0.9558 |
| XV | 0.9942 | 0.9502 | 0.9351 | 0.9825 | 0.9282 | 0.8976 | 0.8064 | 0.9056 | 0.9601 | 0.9232 | 0.8660 | 0.9423 |
| Avg | 0.9501 | 0.9064 | 0.8896 | 0.9376 | 0.9693 | 0.9409 | 0.8573 | 0.9505 | 0.9596 | 0.9234 | 0.8731 | 0.9437 |
| Behav. | Sensitivity | PPV | F1-Score | |||||||||
|---|---|---|---|---|---|---|---|---|---|---|---|---|
| Ours | Previous Method | Ours | Previous Method | Ours | Previous Method | |||||||
| [24] | [32] | [37] | [24] | [32] | [37] | [24] | [32] | [37] | ||||
| W | 0.9046 | 0.8612 | 0.8434 | 0.8923 | 0.9378 | 0.9084 | 0.8269 | 0.9175 | 0.9209 | 0.8842 | 0.8351 | 0.9047 |
| R | 0.9772 | 0.9331 | 0.9193 | 0.9629 | 0.9611 | 0.9034 | 0.8203 | 0.9103 | 0.9536 | 0.9180 | 0.8670 | 0.9359 |
| St | 0.9929 | 0.9474 | 0.9295 | 0.9735 | 0.9936 | 0.9652 | 0.8812 | 0.9713 | 0.9932 | 0.9562 | 0.9047 | 0.9724 |
| Si | 0.9954 | 0.9523 | 0.9378 | 0.9821 | 0.9997 | 0.9703 | 0.8903 | 0.9785 | 0.9975 | 0.9612 | 0.9134 | 0.9803 |
| Wav | 0.8809 | 0.8371 | 0.8198 | 0.8656 | 1 | 0.9702 | 0.8913 | 0.9798 | 0.9367 | 0.8987 | 0.8541 | 0.9192 |
| P | 0.9417 | 0.9005 | 0.8837 | 0.9334 | 0.9816 | 0.9527 | 0.8702 | 0.9605 | 0.9612 | 0.9259 | 0.8769 | 0.9468 |
| K | 0.9939 | 0.9492 | 0.9302 | 0.9793 | 0.9606 | 0.9311 | 0.8525 | 0.9556 | 0.9770 | 0.9401 | 0.8897 | 0.9673 |
| Seq. No. | Sensitivity | PPV | F1-Score | |||||||||
|---|---|---|---|---|---|---|---|---|---|---|---|---|
| Ours | Previous Method | Ours | Previous Method | Ours | Previous Method | |||||||
| [24] | [32] | [37] | [24] | [32] | [37] | [24] | [32] | [37] | ||||
| 1 | 1 | 1 | 0.97 | 1 | 1 | 1 | 1 | 1 | 1 | 1 | 0.9848 | 1 |
| 2 | 1 | 0.99 | 0.94 | 1 | 1 | 1 | 1 | 1 | 1 | 0.9949 | 0.9691 | 1 |
| 3 | 0.99 | 0.99 | 1 | 0.98 | 0.99 | 0.98 | 0.99 | 0.99 | 0.99 | 0.9850 | 0.9950 | 0.9850 |
| 4 | 1 | 1 | 0.98 | 1 | 0.99 | 1 | 0.99 | 0.97 | 0.9950 | 1 | 0.9850 | 0.9848 |
| 5 | 1 | 1 | 0.89 | 1 | 1 | 1 | 1 | 1 | 1 | 1 | 0.9418 | 1 |
| 6 | 0.99 | 1 | 0.96 | 0.98 | 1 | 1 | 1 | 1 | 0.9950 | 1 | 0.9796 | 0.9899 |
| 7 | 1 | 1 | 0.98 | 1 | 1 | 1 | 1 | 1 | 1 | 1 | 0.9899 | 1 |
| 8 | 1 | 1 | 0.76 | 1 | 1 | 0.99 | 0.99 | 1 | 1 | 0.9950 | 0.8599 | 1 |
| 9 | 1 | 1 | 1 | 1 | 1 | 1 | 1 | 1 | 1 | 1 | 1 | 1 |
| 10 | 1 | 0.97 | 0.98 | 1 | 1 | 0.97 | 0.97 | 1 | 1 | 0.97 | 0.9750 | 1 |
| Avg | 0.9980 | 0.9949 | 0.9459 | 0.9959 | 0.9980 | 0.9939 | 0.9936 | 0.9959 | 0.9980 | 0.9945 | 0.9680 | 0.9960 |
© 2016 by the authors; licensee MDPI, Basel, Switzerland. This article is an open access article distributed under the terms and conditions of the Creative Commons by Attribution (CC-BY) license (http://creativecommons.org/licenses/by/4.0/).
Share and Cite
Jeon, E.S.; Kim, J.H.; Hong, H.G.; Batchuluun, G.; Park, K.R. Human Detection Based on the Generation of a Background Image and Fuzzy System by Using a Thermal Camera. Sensors 2016, 16, 453. https://doi.org/10.3390/s16040453
Jeon ES, Kim JH, Hong HG, Batchuluun G, Park KR. Human Detection Based on the Generation of a Background Image and Fuzzy System by Using a Thermal Camera. Sensors. 2016; 16(4):453. https://doi.org/10.3390/s16040453
Chicago/Turabian StyleJeon, Eun Som, Jong Hyun Kim, Hyung Gil Hong, Ganbayar Batchuluun, and Kang Ryoung Park. 2016. "Human Detection Based on the Generation of a Background Image and Fuzzy System by Using a Thermal Camera" Sensors 16, no. 4: 453. https://doi.org/10.3390/s16040453