1. Introduction
Bioprocess control is integral to modern biotechnology because it can improve reproducibility and system stability while reducing operating costs. Real-time process monitoring using sensor techniques facilitates bioprocess control by providing system information during the process, which can be used to regulate the corresponding system output. Over the last two decades, sophisticated sensors have been developed for upstream and downstream bioprocesses to enhance process efficiency and product quality. For example, many electrical, electrochemical and electromagnetic sensors have been commercialized for use in laboratory and industrial settings to measure pressure, temperature, pH and dissolved oxygen.
In addition to conventional sensors, optical sensors are competitive candidates for bioprocess control. Diverse optical principles have been used to measure different physiochemical variables, including the measurement of vitamins, coenzymes [
1] and pyruvate [
2] by fluorescence spectroscopy, the determination of glucose concentrations by near-infrared spectroscopy [
3,
4], and the observation of cell morphology by
in situ microscopy [
5,
6]. Light scattering can also be used to determine the density of many different microorganisms with high sensitivity [
7]. In contrast to conventional offline measurement, online bioprocess monitoring using optical sensors is a noninvasive and nondestructive approach that does not interfere with cell metabolism and does not require periodic sampling, thus reducing the risk of contamination [
8,
9]. However, optical sensors must meet the specific requirements for each process, e.g., target parameters, data frequency, calibration, linearity, measurement range and longevity. Optical sensors must also overcome challenges specific to individual processes, such as the fouling of optical surfaces by the adhesion of microorganisms and/or proteins, and interference caused by medium components or gas bubbles. The appropriate sensor must be selected and characterized according to the process to ensure accurate measurement.
Lactic acid (LA) is a versatile carboxylic acid used in food products, beverages, cosmetics, medicines, and in the production of biodegradable polymers to replace petroleum-derived plastics. LA is commercially produced by the microbial conversion of carbohydrates such as dextrose, lactose and sucrose. Kinetic studies have shown that LA fermentation is a partially growth-associated process, in which both cell density and growth rate determine productivity [
10,
11,
12]. However, LA fermentation is also a product-inhibited process. The accumulation of LA in batch or fed-batch processes inhibits cell growth and substrate conversion [
13,
14]. A membrane filtration device is therefore used in conventional batch or fed-batch processes to continuously remove LA from the reaction system, while the microorganisms remain in the reactor. Productivity is thus enhanced by increasing the biomass concentration and reducing product inhibition [
15,
16,
17]. However, previous studies have shown that high cell densities cause severe membrane fouling, reducing the efficiency of the membrane during fermentation and necessitating regular membrane cleaning, which increases operational costs [
18]. The biomass concentration must therefore be monitored and controlled within an appropriate range to balance the requirements of fermentation and filtration.
In membrane bioreactor (MBR) systems, crossflow filtration using microfiltration and/or ultrafiltration membranes is necessary to achieve cell retention. The membrane efficiency, i.e., the permeate flow, is controlled predominantly by transmembrane pressure (TMP) and crossflow velocity (CFV). TMP is the driving force during filtration, and higher TMPs therefore enhance the permeate flow. However, excessive TMP leads to the formation of a gel layer or compact filtration cake on the membrane, which increases the hydraulic resistance during filtration. In contrast, the CFV helps to remove the cake layer from the membrane surface to maintain a stable permeate flow. Despite these positive effects, increasing the TMP or CFV also increases the mechanical energy input and thus the shear force, which may reduce cell vitality and growth. Therefore, when the boundary conditions for filtration are determined, both the filtration efficiency and the impact on cell growth must be considered.
Ideally, it would be possible to achieve the reliable and convenient measurement of microbial biomass in situ, and many different optical sensors have been developed to address this challenge. Here we describe an innovative scattered light sensor (AFGUARD®) which was used to monitor the biomass in a MBR system for the production of LA. The new sensor was compared to the optical density (OD) and cell dry weight (CDW) reference methods for the measurement of cell growth, allowing the statistical analysis of sensitivity and reproducibility. The impact of filtration parameters (TMP and CFV) on cell growth was characterized by measuring the maximum specific growth rate using the new optical sensor to evaluate its performance in practice. Furthermore, the biomass concentration was monitored and controlled during filtration to allow the characterization of ceramic ultrafiltration membranes.
2. Materials and Methods
2.1. Optical Sensor
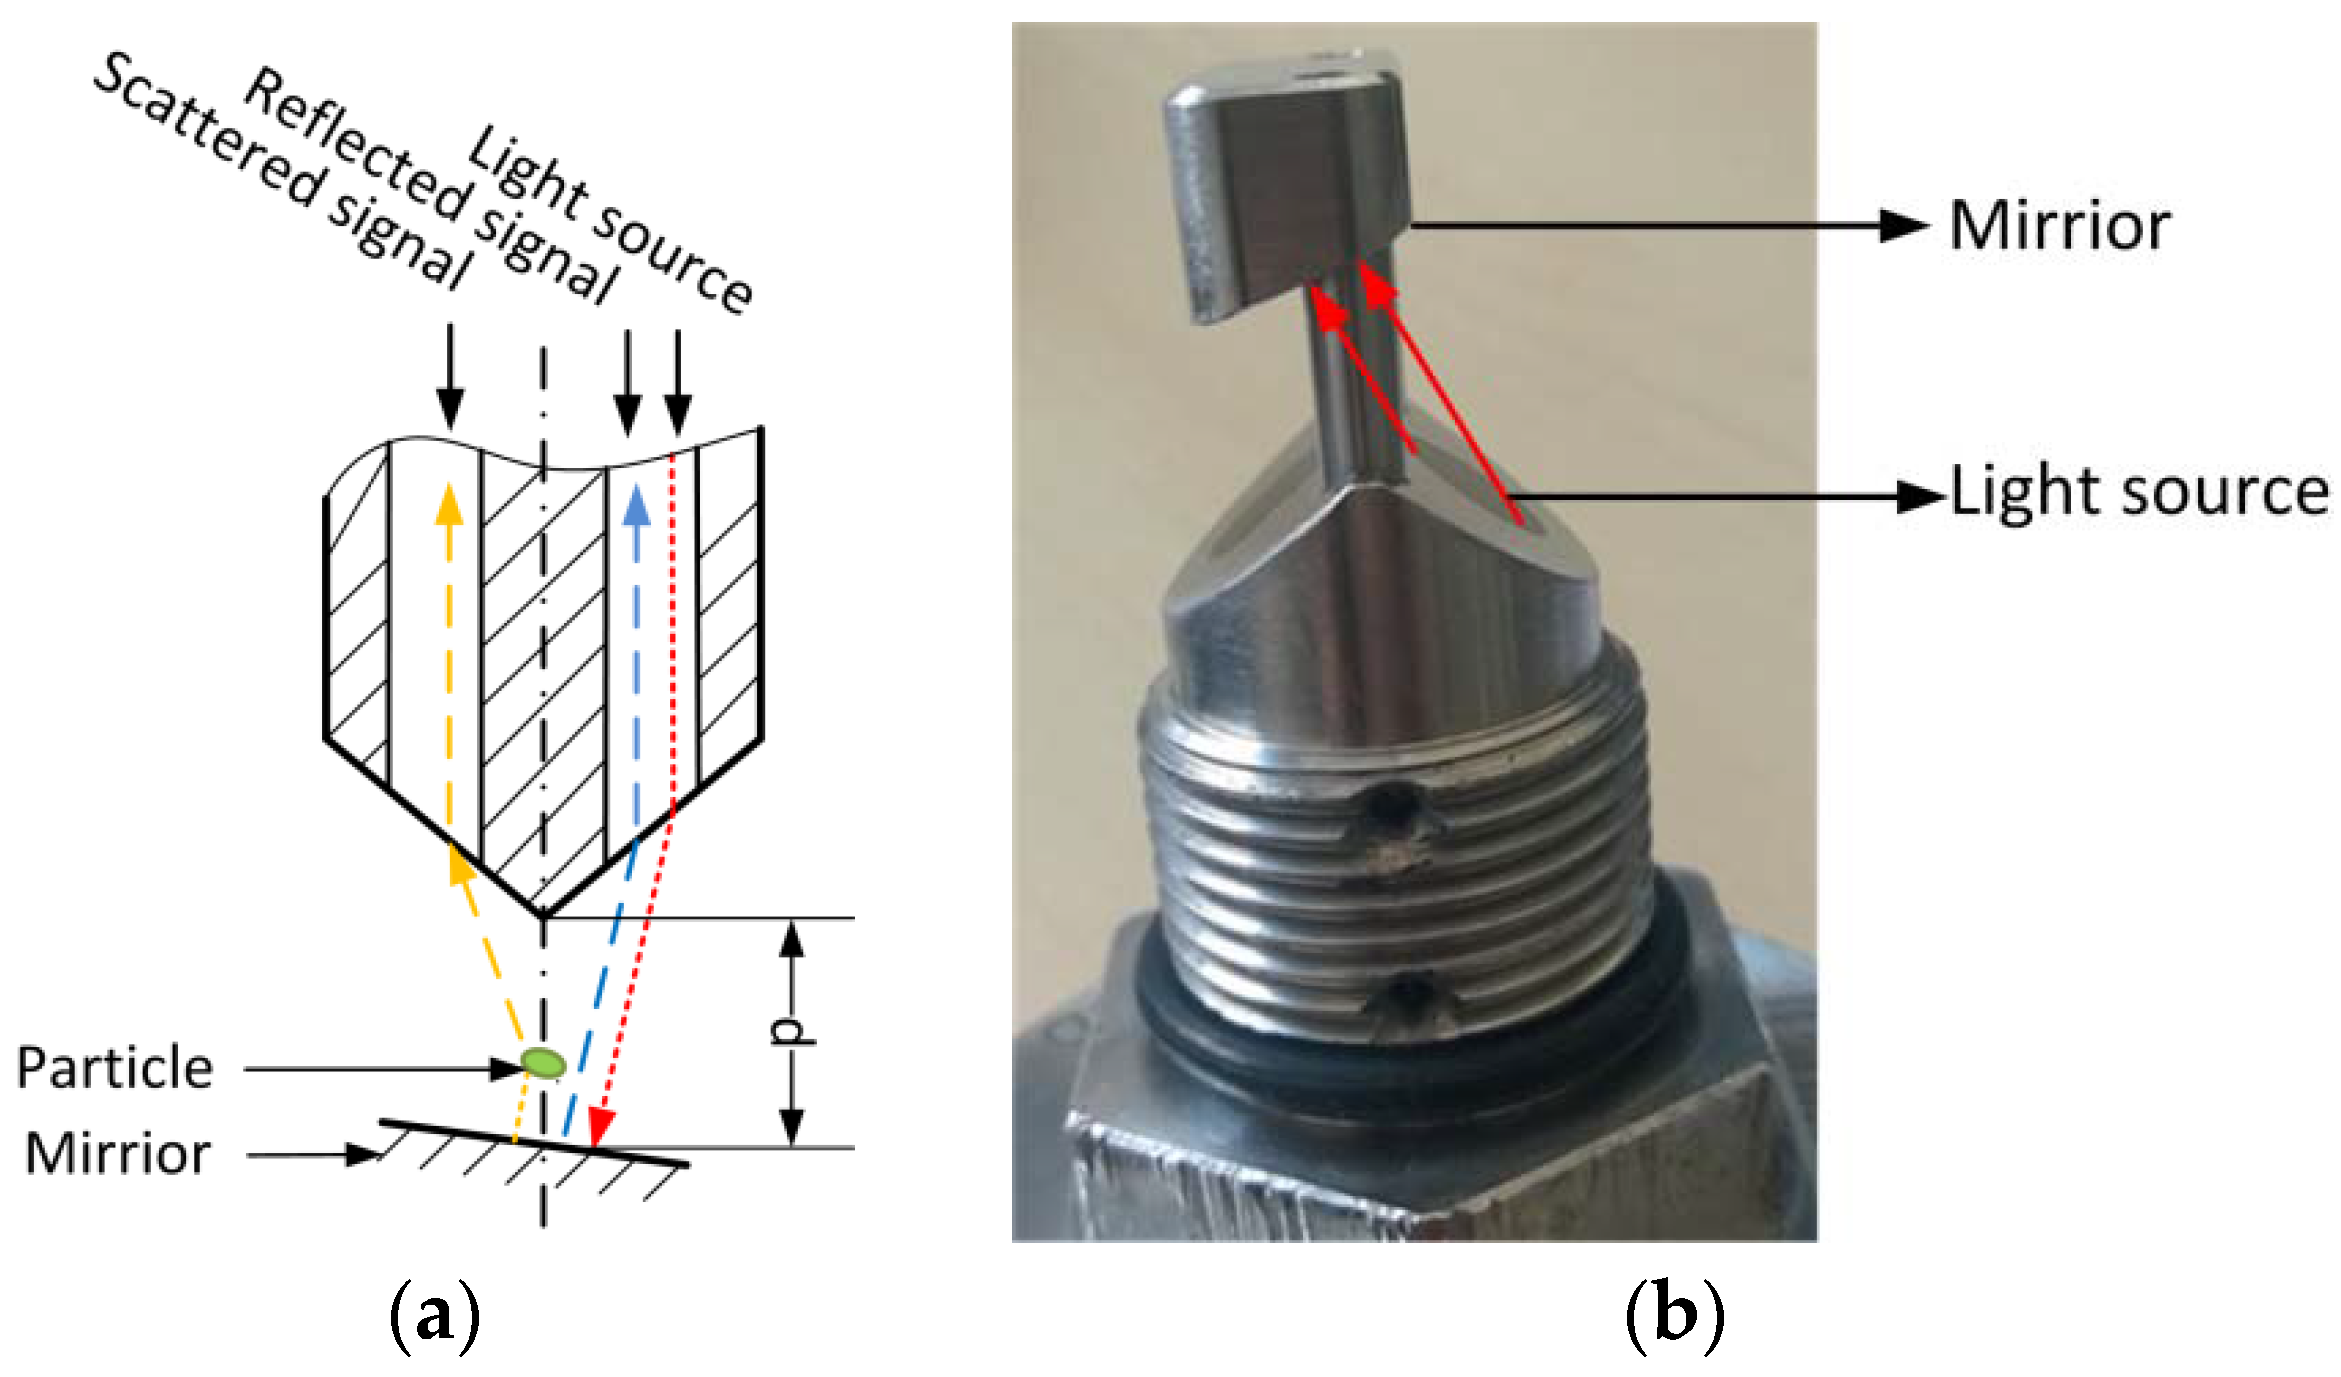
The modified AFGUARD
® optical sensor, which was kindly provided by FAUDI Aviation GmbH (Stadtallendorf, Germany), was used to measure cell biomass during LA fermentation, and to monitor the filtration of the fermentation broth. The AFG sensor is an online monitoring device based on scattered light, which is designed for the
in situ measurement of particulate matter. The measurement principle is shown in
Figure 1a. The infrared light is reflected by a mirror and scattered by particles, whose concentration is determined by comparing the reflected and scattered light intensity. The measurement range can be adjusted by varying the distance between the mirror and the light source (
Figure 1b). In our experiments, the mirror was removed to achieve the broadest measurement range. In this case, the sensor output only represents the intensity of scattered light detected by the receive channel.
2.2. Microorganisms and Fermentation Broth
Bacillus coagulans PS5, a facultative anaerobic homofermentative L(+) lactic acid-producing bacterium, was kindly supplied by Thyssenkrupp Industrial Solutions AG, Process Technologies, Leuna, Germany. The culture medium was modified MRS (de Man, Rogosa and Sharpe) medium, which contained 4.0 g·L−1 yeast extract, 8.0 g·L−1 meat extract, 10.0 g·L−1 peptone from casein, 2 g·L−1 K2HPO4, 0.1 g·L−1 MgSO4, 0.03 g·L−1 MnSO4, 1.0 g·L−1 Tween-80, and 20 g·L−1 glucose. The inoculum was grown in the same medium. All components were sterilized at 121 °C for 20 min except for glucose, which was sterilized separately.
2.3. Ceramic Membranes
Different ceramic membranes were used for cell retention and LA recovery. The tubular ceramic α-Al2O3 membranes (19 channels) (Atech Innovations GmbH, Gladbeck, Germany) had a nominal pore size of 50 nm, an inner channel of 3.3 mm and an outer diameter of 25.4 mm. The effective membrane surface was ~0.09 m2. The ceramic hollow fiber membrane (31 fibers) (Mann + Hummel GmbH, Ludwigsburg, Germany) had a nominal pore size of 40 nm, an inner channel of 1.5 mm and an outer diameter of 25.4 mm. The effective membrane surface was ~0.031 m2.
2.4. Experimental Equipment
The configuration of the experimental equipment is shown in
Figure 2. This system was used to test the ability of the AFG sensor and determine the membrane efficiency. The fermentations were carried out in a 1.5-L Biostat
® B stirred bioreactor (Sartorius Stedim Biotech GmbH, Göttingen, Germany) at 53 °C with neutralization achieved by adding 5 M NaOH. The fermentation broth was pumped through the membrane module and the measuring cell of the optical sensor using a rotary vane pump. The biomass concentrations were therefore detected by the AFG sensor in real time. The system was set to one of two operational configurations: first, when the permeate was closed, the correlation between the biomass concentration and the sensor readout was determined in batch fermentation mode with a bypass; second, when the permeate was open, the crossflow filtrations of the fermentation broth were carried out at different TMPs and CFVs in total recycle mode to determine the influences of mechanical energy input on the cell growth and the impacts of biomass concentration on the membrane efficiency. Here, the permeate and retentate were returned to the fermenter in order to maintain the concentration and temperature of the feed solution. The TMP and CFV were controlled by the rotary vane pump and a stainless steel valve, mounted on the retentate outlet. Permeate flow was monitored online with a miniature oval gear flow meter (B.I.O-Tech e.K., Vilshofen, Germany), and was then recycled back to the reactor. The membrane flux was calculated according to Equation (1) once the experiment was completed:
where
refers to the volumetric flow rate of the permeate, and A is the membrane effective area.
The TMP was varied between 0.2 and 1.2 bar, and the CFV was varied between 0.3 and 1.2 m·s
−1. Because the permeate side was open during the experiments, the pressure on the permeate side was equal to atmospheric pressure. Therefore, the TMP was measured and monitored using two manometers located on the inlet (
P1) and outlet (
P2) of the membrane module, and was calculated using Equation (2):
The CFVs (m·s−1) were calculated using the quotient of the retentate volumetric flow rate per inner cross-sectional area of the membrane tube. After each run, the system was rinsed with alkaline 1% Asiral® (Asiral Industrie-Reiniger GmbH, Neustadt, Germany) at 53 °C for 1 h.
2.5. Analytical Methods
Glucose and lactate concentrations were measured using Biosen C_line GP (EKF-diagnostic GmbH, Barleben, Germany). The OD was measured using a UV/Vis spectrophotometer (Eppendorf AG, Hamburg, Germany). An aliquot was diluted with reverse osmosis (RO) water to ensure the absorbance was <0.5. The optical density (OD) of the dilution was then measured three times at 600 nm (OD600). To determine the CDW, 10-mL aliquots of cells were collected by centrifugation (10,000 rcf, 10 min, 4 °C) and transferred to a dried, pre-weighed 2-mL centrifuge tube. The cells were then resuspended in RO water and centrifuged at 16,100 rcf for 2 min at 4 °C (Eppendorf AG). The pellets were washed, centrifuged twice as above and dried at 55 °C until a constant mass was obtained.
2.6. Calculation
The specific growth rate (µ) was measured using the AFG sensor, OD
600 values and CDW, and was used to characterize the kinetics of the LA fermentation. The data obtained from the AFG sensor were fitted to Equation (3) to calculate the maximum specific growth rate (µ
max), where
N refers to data captured during the exponential phase.
e and
t refer to the mathematical constant and the duration of the exponential phase.
N0 is a calculating constant to represent the sensor readout at the beginning of exponential phase, which is estimated by fitting the correlation between
N and
t.
For offline measurement, µ was defined as the increase in biomass per unit time (Equation (4)), where
M is the OD
600 value or CDW, as appropriate.
t1 and
t2 refer to the start and end of exponential phase.
The mechanical energy input supplied by the rotary vane pump was characterized according to the pressure differential, shear stress (
τ) and shear rate (
). The shear stress and the shear rate of fluid in the pipe were calculated using Equations (5) and (6).
η,
v and
d are the dynamic viscosity, tangential flow velocity and inner diameter of membrane tubes channels.
2.7. Statistical Analysis to Estimate the Influence of Energy Input on Cell Growth and LA Production
A two-level two-factorial experimental design was used to determine the influences of CFV and TMP on cell growth and LA production. CFV and TMP were separately set as high-level and low-level factors (
Table 1). The experiments were carried out with the orthogonal combination of CFV and TMP. Each set point was tested in triplicate. The influences of each factor were determined by analysis of variance (ANOVA) using Design Expert v8.0.6 (Stat-Ease Inc., Minneapolis, MN, USA).
3. Results
3.1. Calibration of the AFG Sensor in LA Fermentation Broth
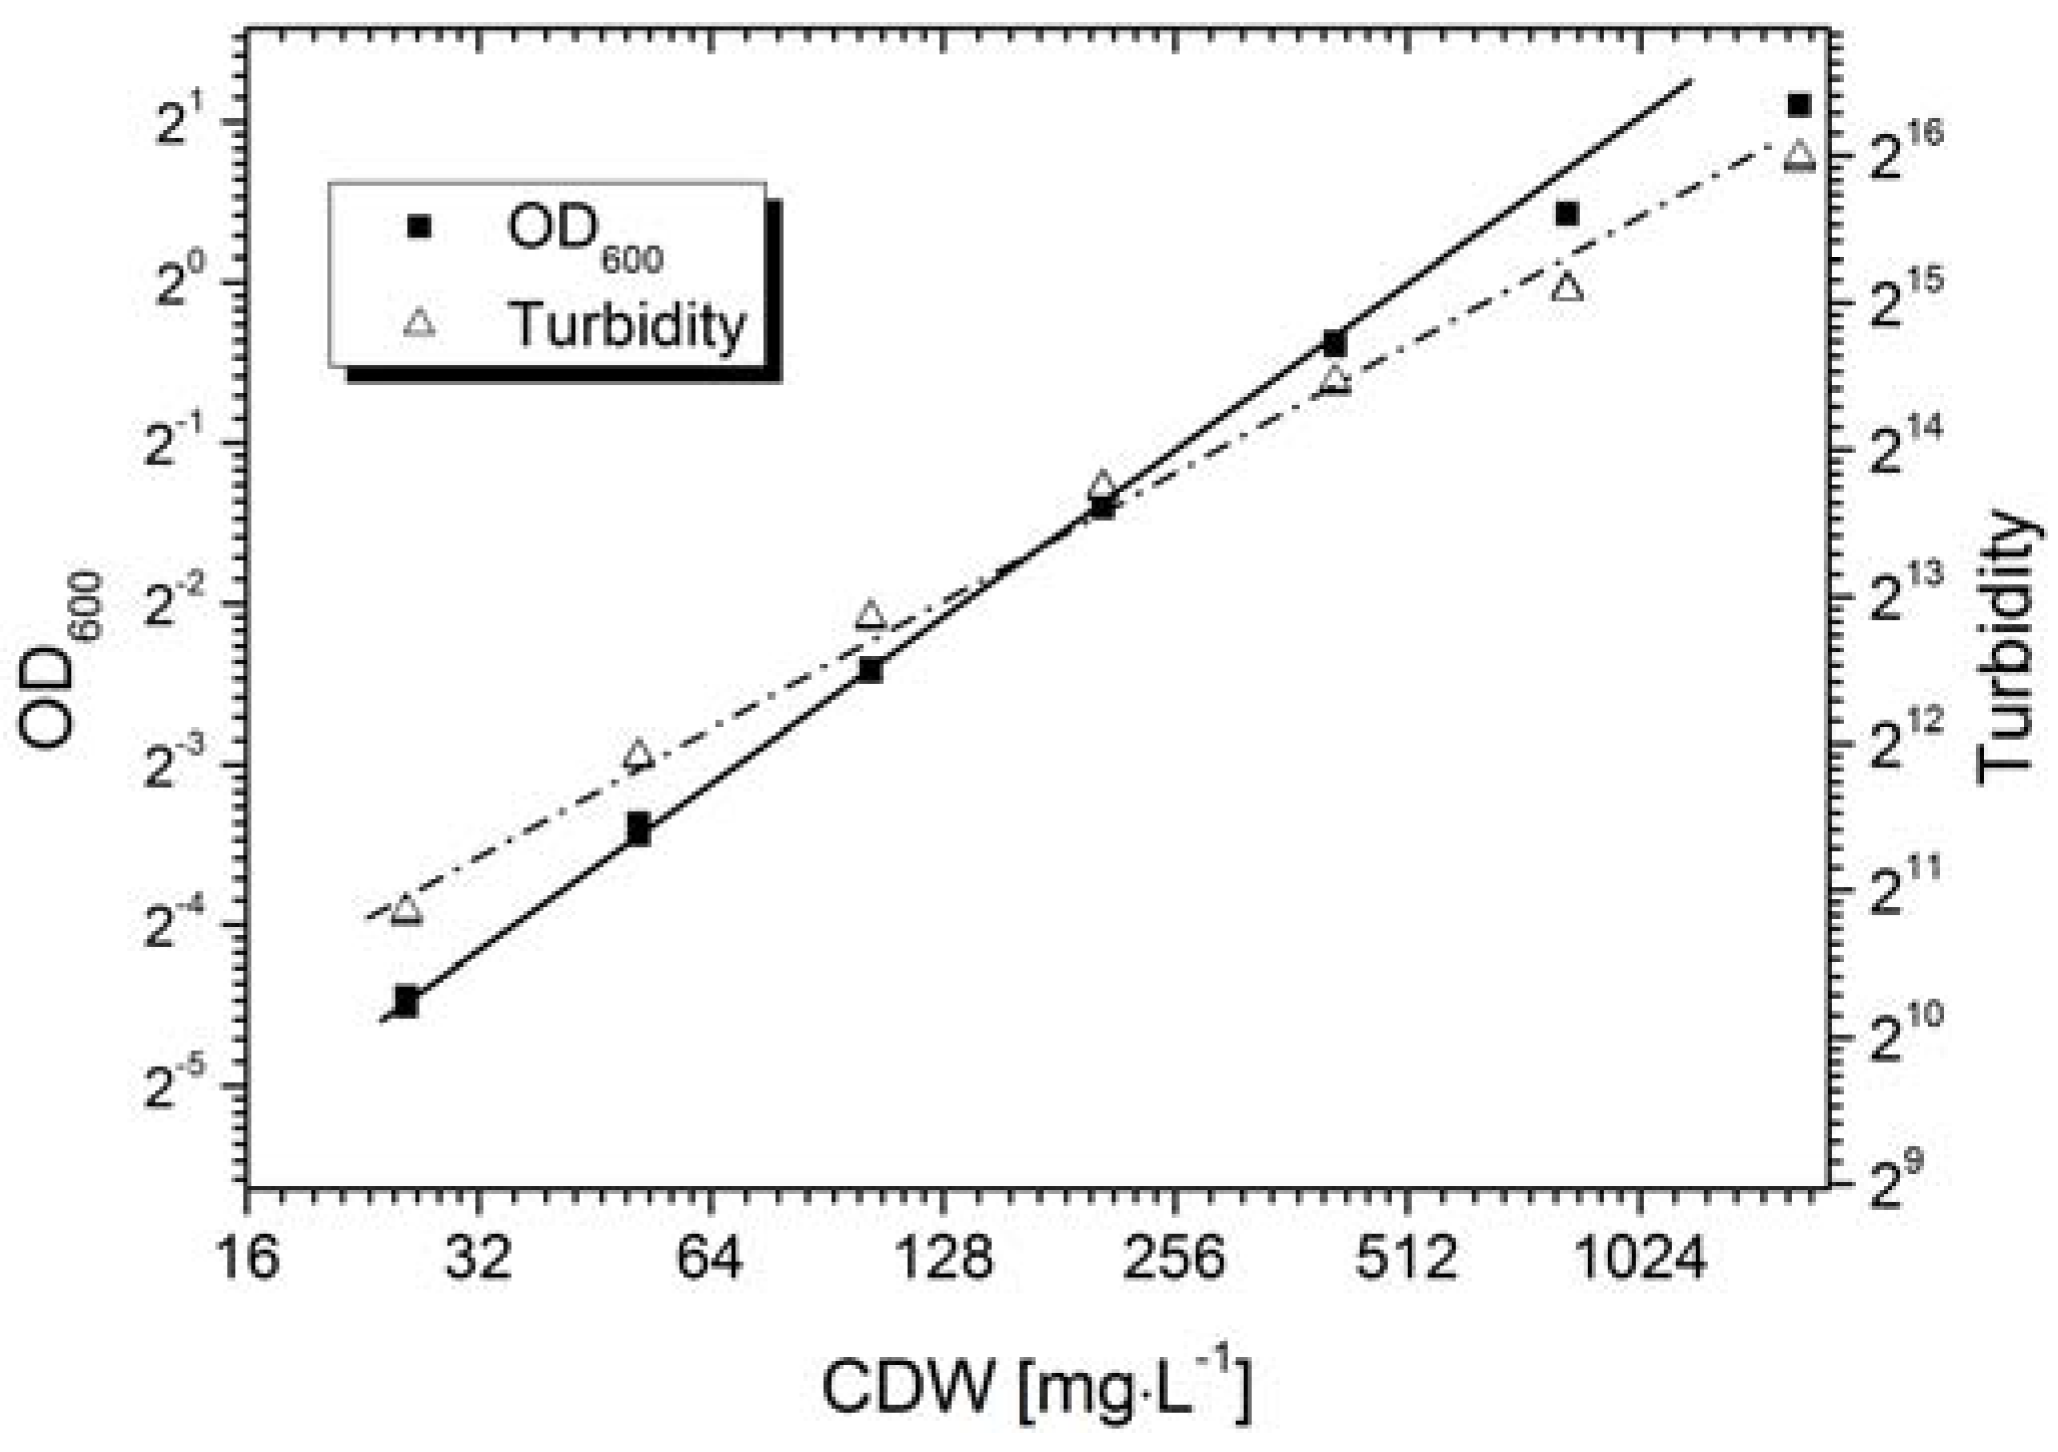
Calibration is generally required for the quantitative measurement of an objective using an optical sensor. The AFG sensor mechanism is based on the correlation of the scattering intensity and the suspended particle concentration, where the primary signal output is shown as the dimensionless “turbidity”. However, the sensor signal varies in different particle systems due to differences in particle morphology, e.g., size or shape.
Figure 3 shows the calibration of the AFG sensor, and the standard off-line measurement,
i.e., the OD
600 value, with fermentation broth containing
Bacillus coagulans. The AFG sensor displayed a linear correlation (Equation (7)) with cell density up to ~0.4 g·L
−1. A positive correlation was observed with the CDW up to ~2.0 g·L
−1, whereas the linearity declined at a concentration higher than 0.4 g·L
−1.
OD measurements usually show a linear correlation with cell density when OD ≤ 0.5. We found that the OD
600 value of the fermentation broth was proportional to the cell density up to ~0.3 g·L
−1 (Equation (8)):
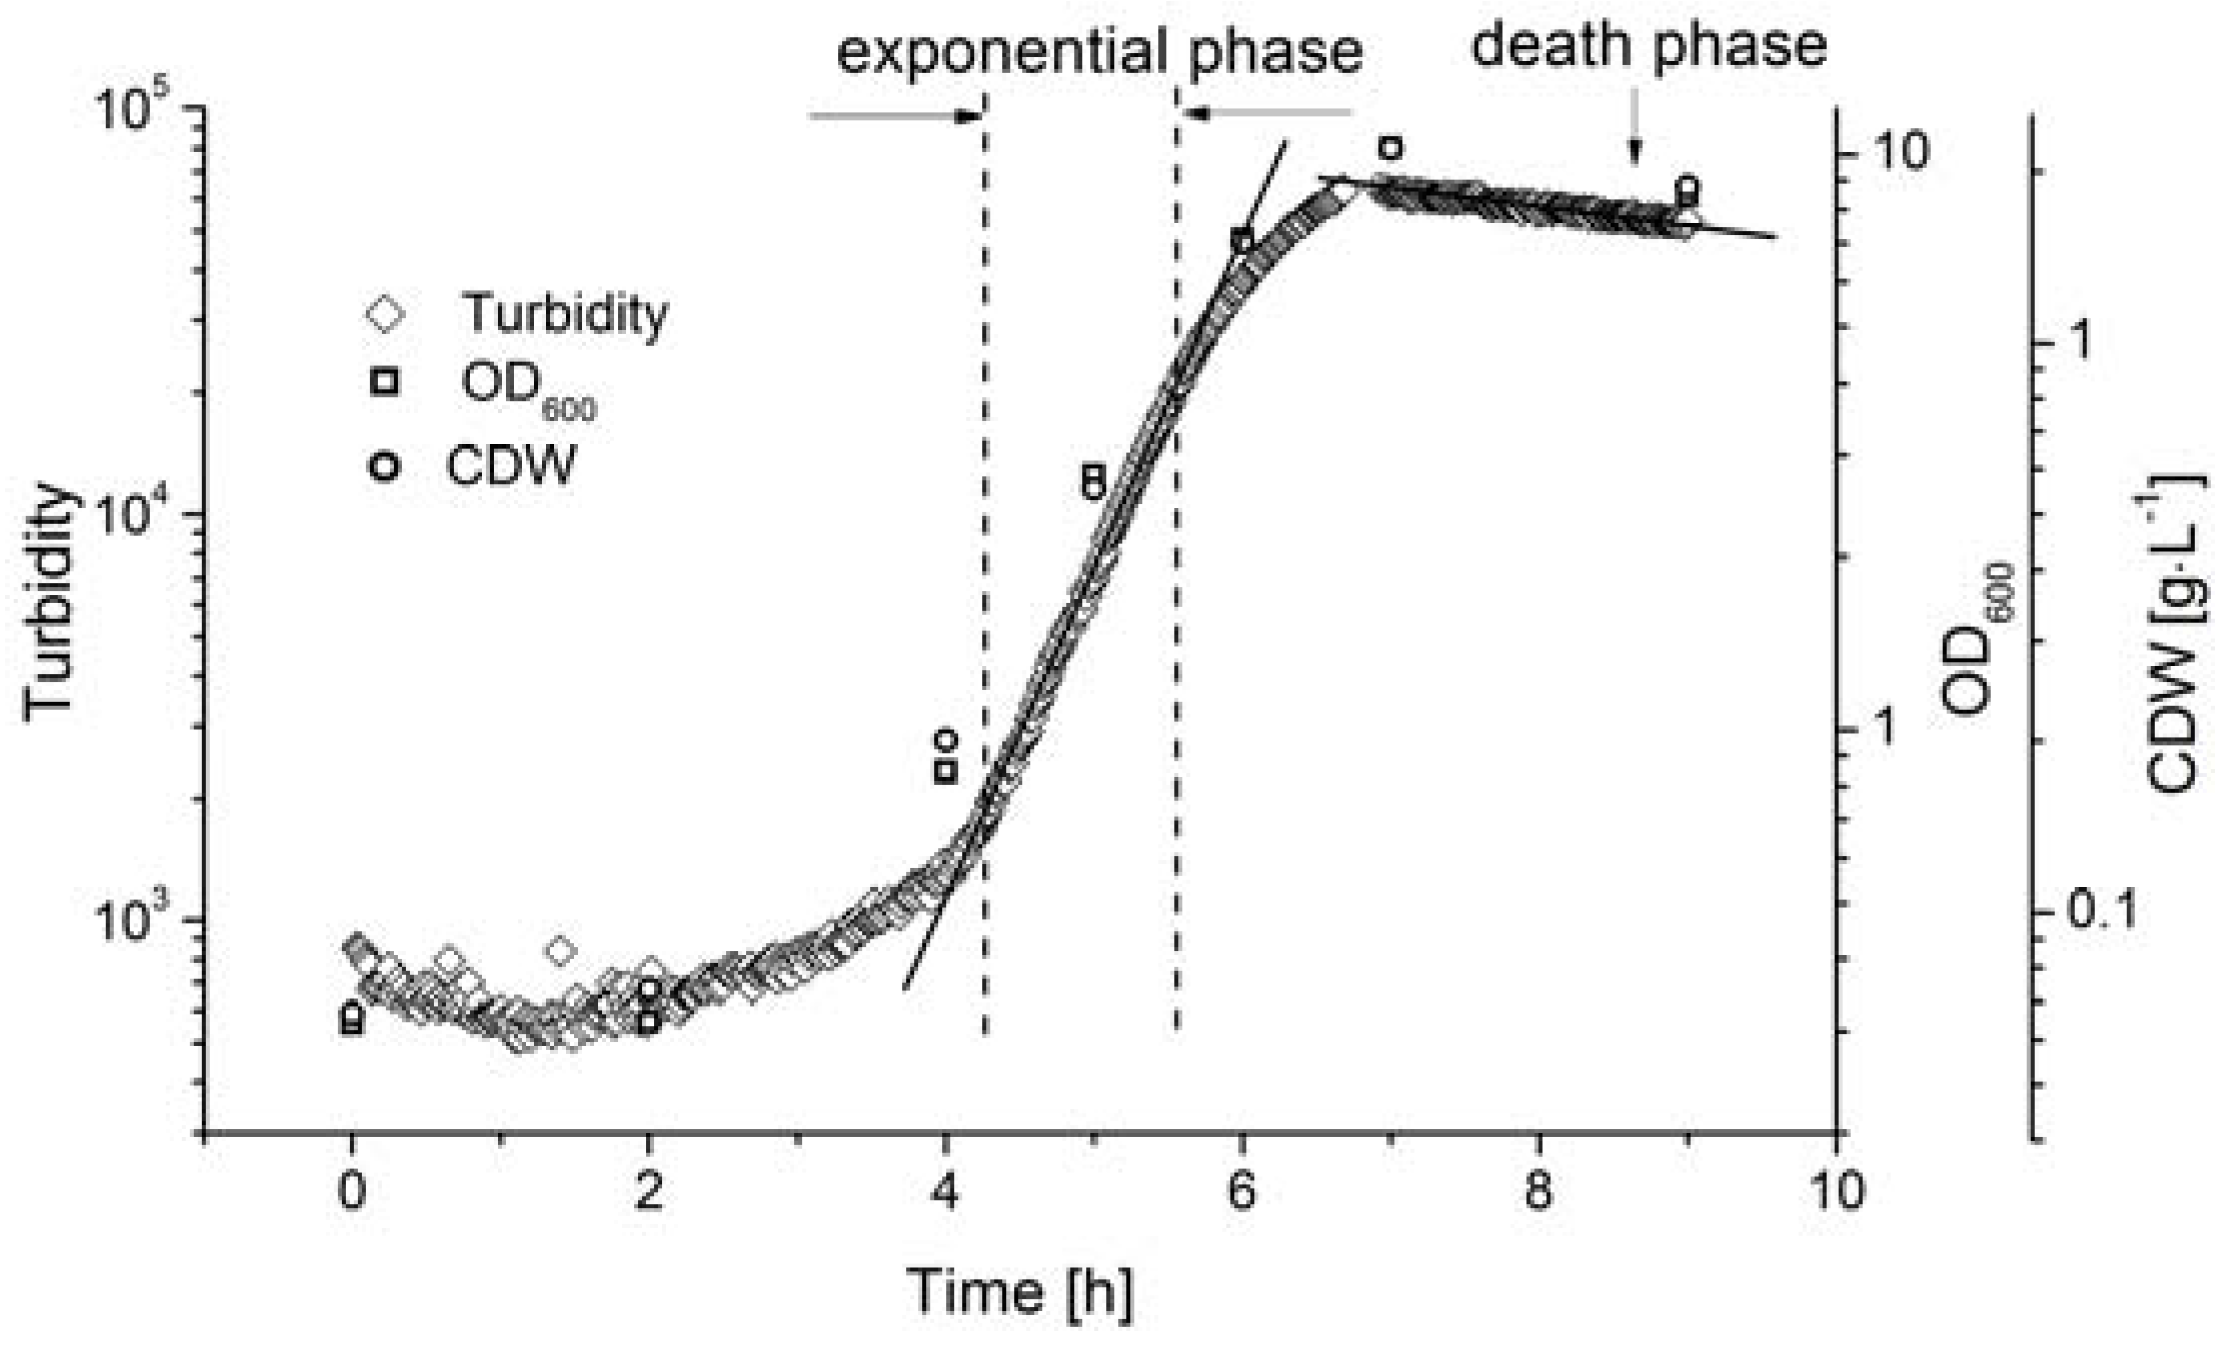
3.2. Online Monitoring of Biomass During Batch Fermentation
For the dynamic measurement of biomass during the fermentation process, the AFG sensor was integrated into a stirred tank reactor in bypass mode, where fermentation was carried out under standard conditions (c
glu = 20 g·L
−1, T = 53 °C, pH = 6.4, agitation = 150 rpm). The biomass was determined by measuring OD
600 and by direct weighing, and was compared to the AFG sensor readout (
Figure 4).
The lag-phase of Bacillus coagulans lasted ~3 h after inoculation. The sensor signal indicated that the biomass exponentially increased from 4.5 to 5.5 h, and the reference methods showed a similar tendency. The cell density at the end of the exponential phase did not exceed the linear range of the sensor signal, so the AFG sensor measurements could be used to calculate the maximum specific cell growth rate, as discussed below.
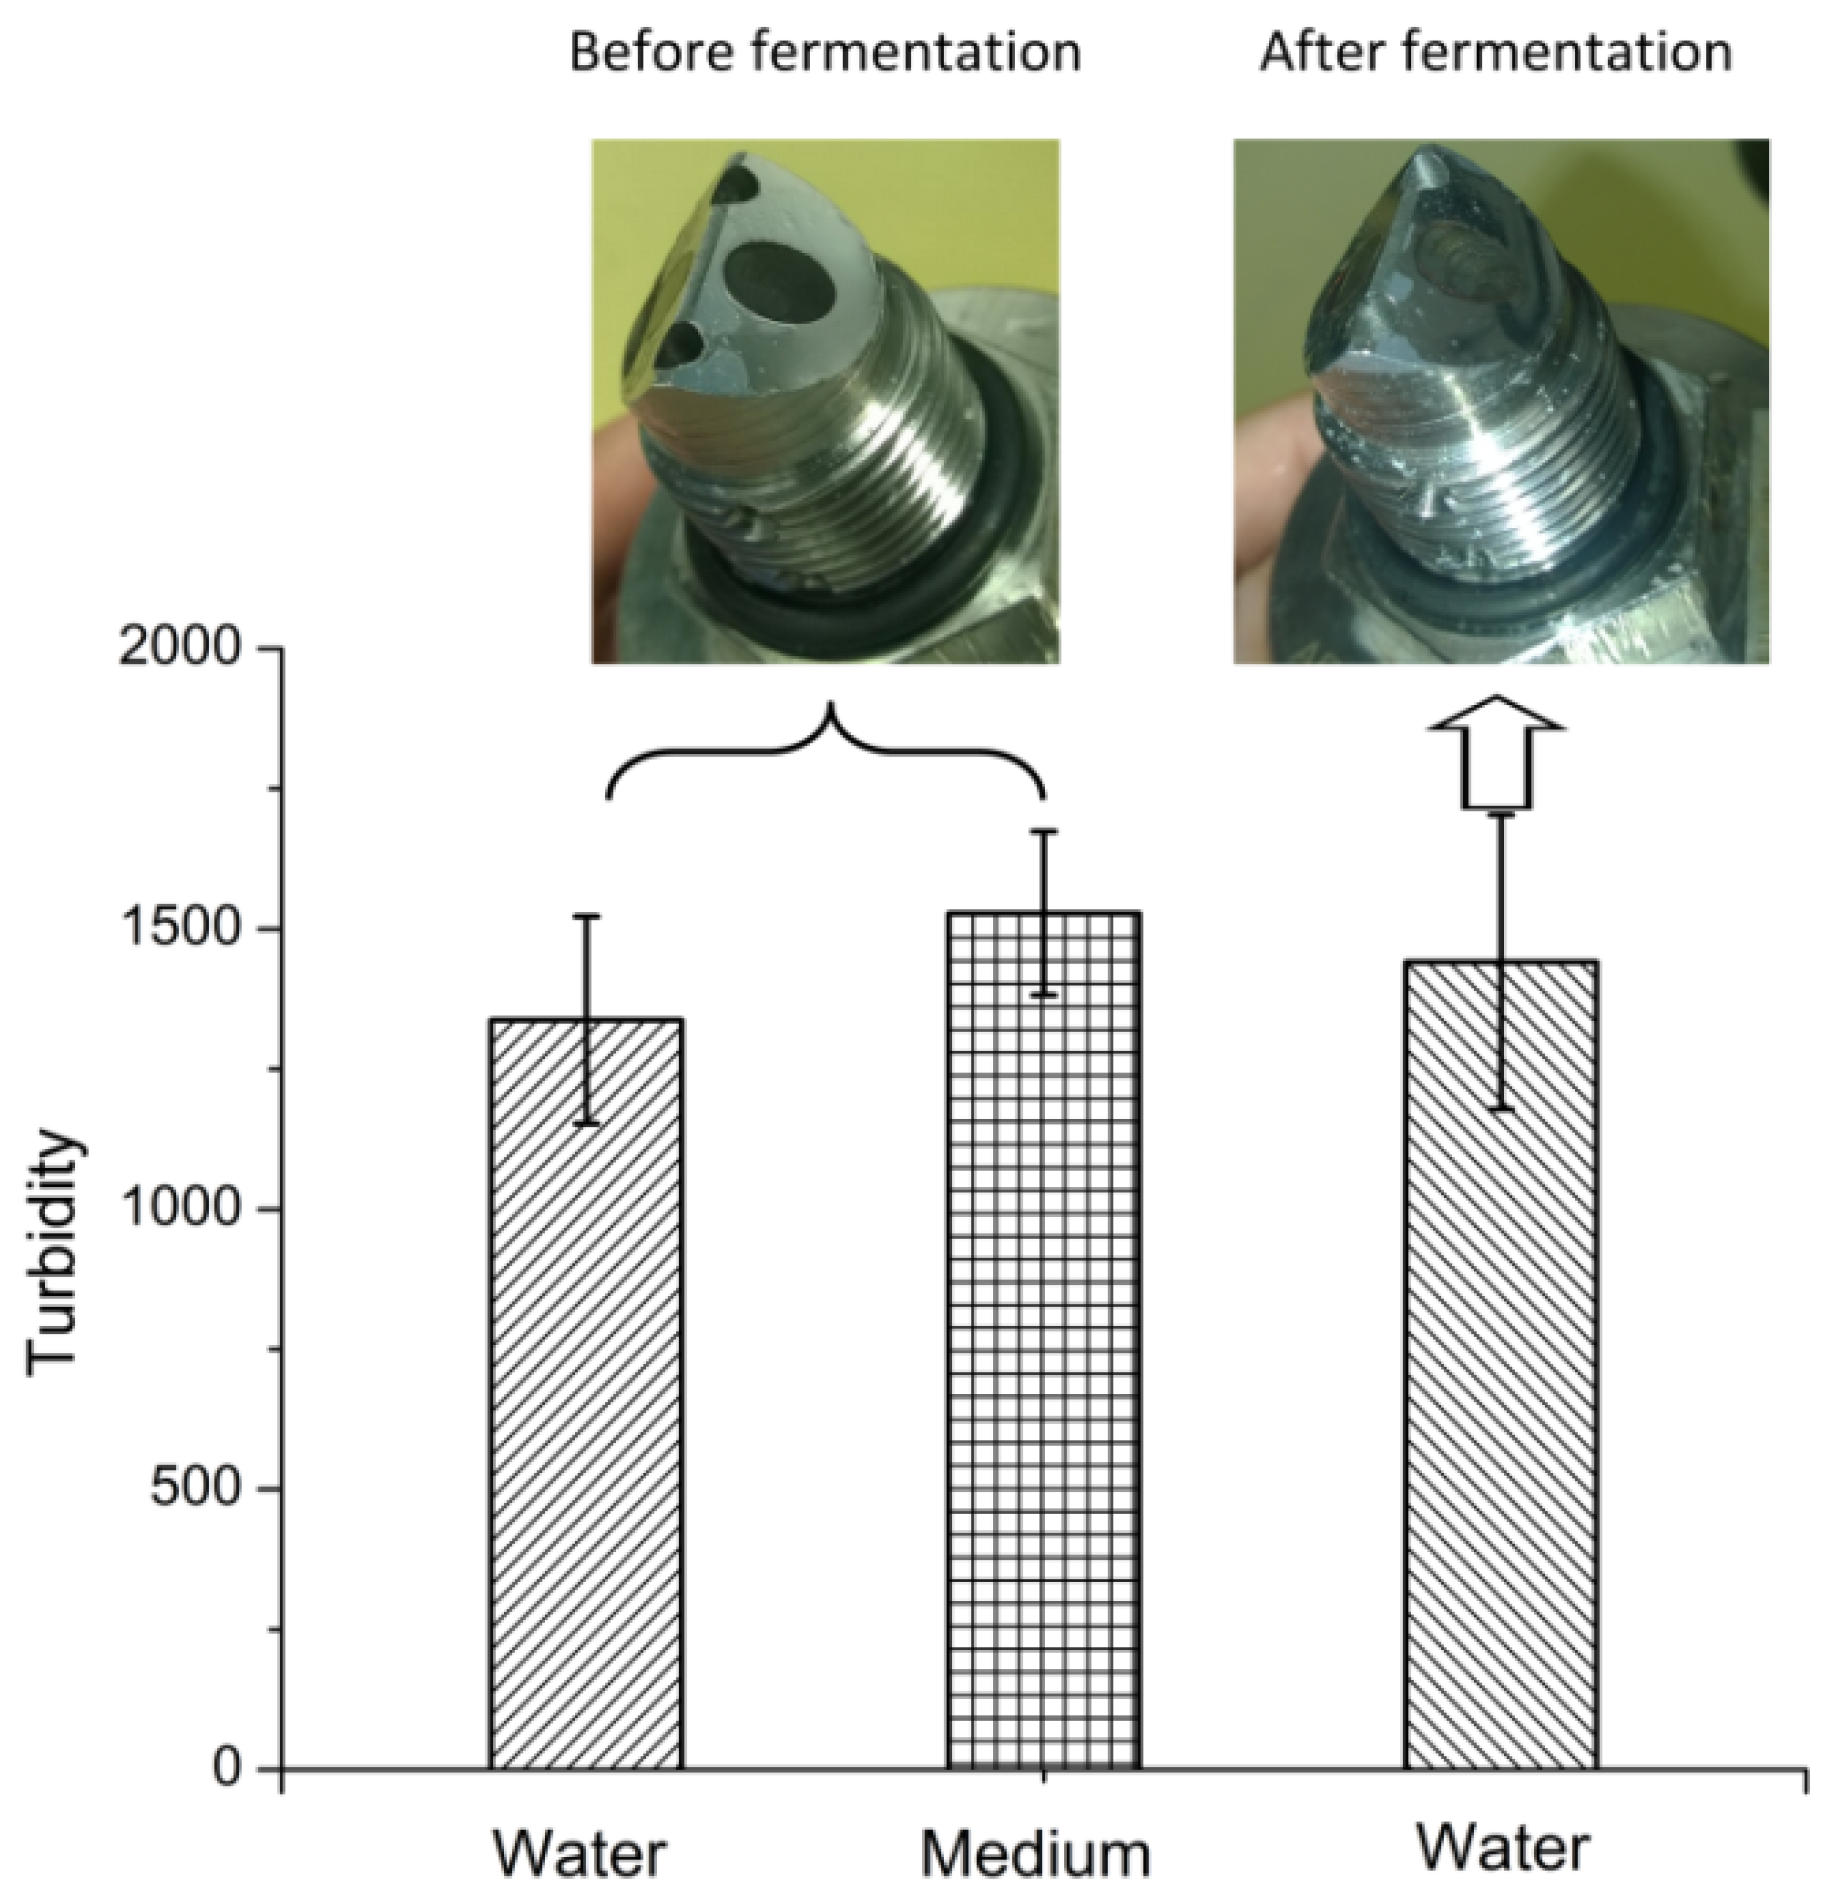
3.3. Fouling of the AFG Sensor During Batch Fermentation
The baseline of the AFG sensor was recorded in RO water and MRS medium before fermentation (
Figure 5). Despite the brownish color of the medium, no significant change in the baseline was observed. After a 9 h fermentation, the sensor was first rinsed with RO water to remove free cells, and the baseline in water increased very slightly compared to the value before fermentation. These results imply that fouling of the optical surface is negligible.
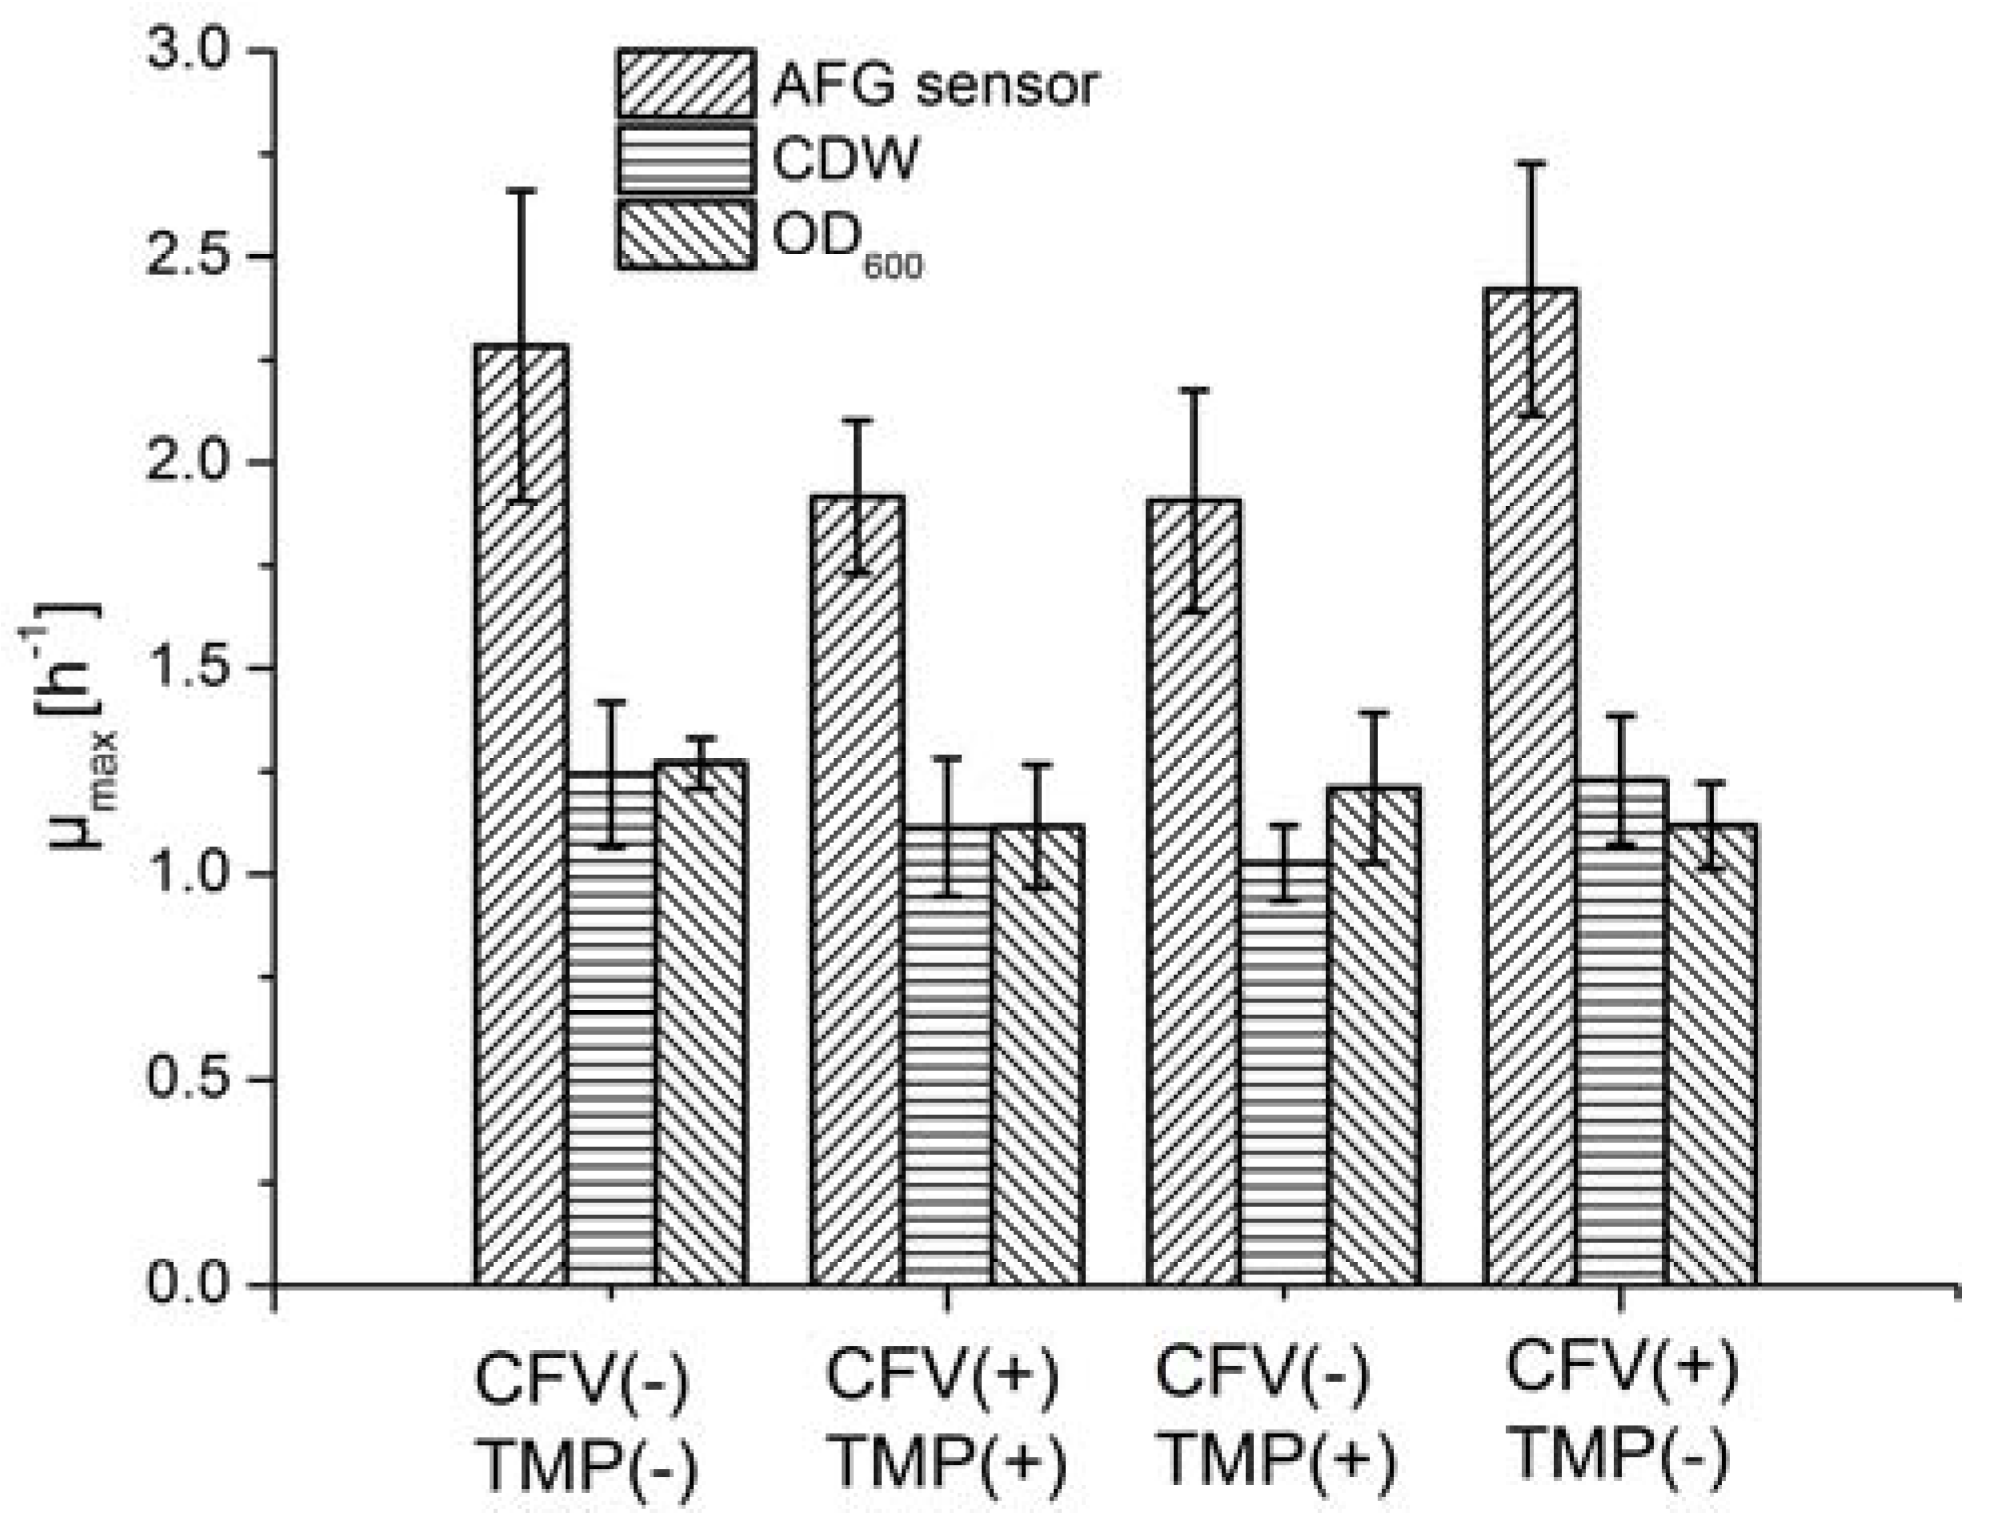
3.4. Cell Growth and LA Production with Mechanical Energy Input
In an MBR system, the pump, supplying mechanical energy, causes the fermentation broth to flow tangentially through membrane tubes, and generates a pressure differential across the membrane. Membrane fouling and permeate flow during crossflow filtration can therefore be controlled by the interaction between the tangential flow and pressure differential. However, mechanical energy may also have negative effects on the vitality and growth of cells, because cells are fragile and sensitive to shear stress. High-velocity flow regimes can damage the cell membrane due to the increase in mechanical energy, causing cell death. We therefore investigated the influence of the mechanical energy input on cell growth and LA productivity.
Fermentation was carried out by applying four conditions featuring different combinations of TMP and CFV, and the µ
max was determined using different methods (
Figure 6). Although the average µ
max varied from 1.9 to 2.4 h
−1 among the four groups when using the AFG sensor, ANOVA results suggested that neither the pressure differential nor the shear stress had a significant impact on cell growth (
Table 2). The µ
max values estimated using offline methods fell within a narrower range than those determined with the AFG sensor. The mechanical energy input therefore did not appear to have a significant effect on the fermentation process.
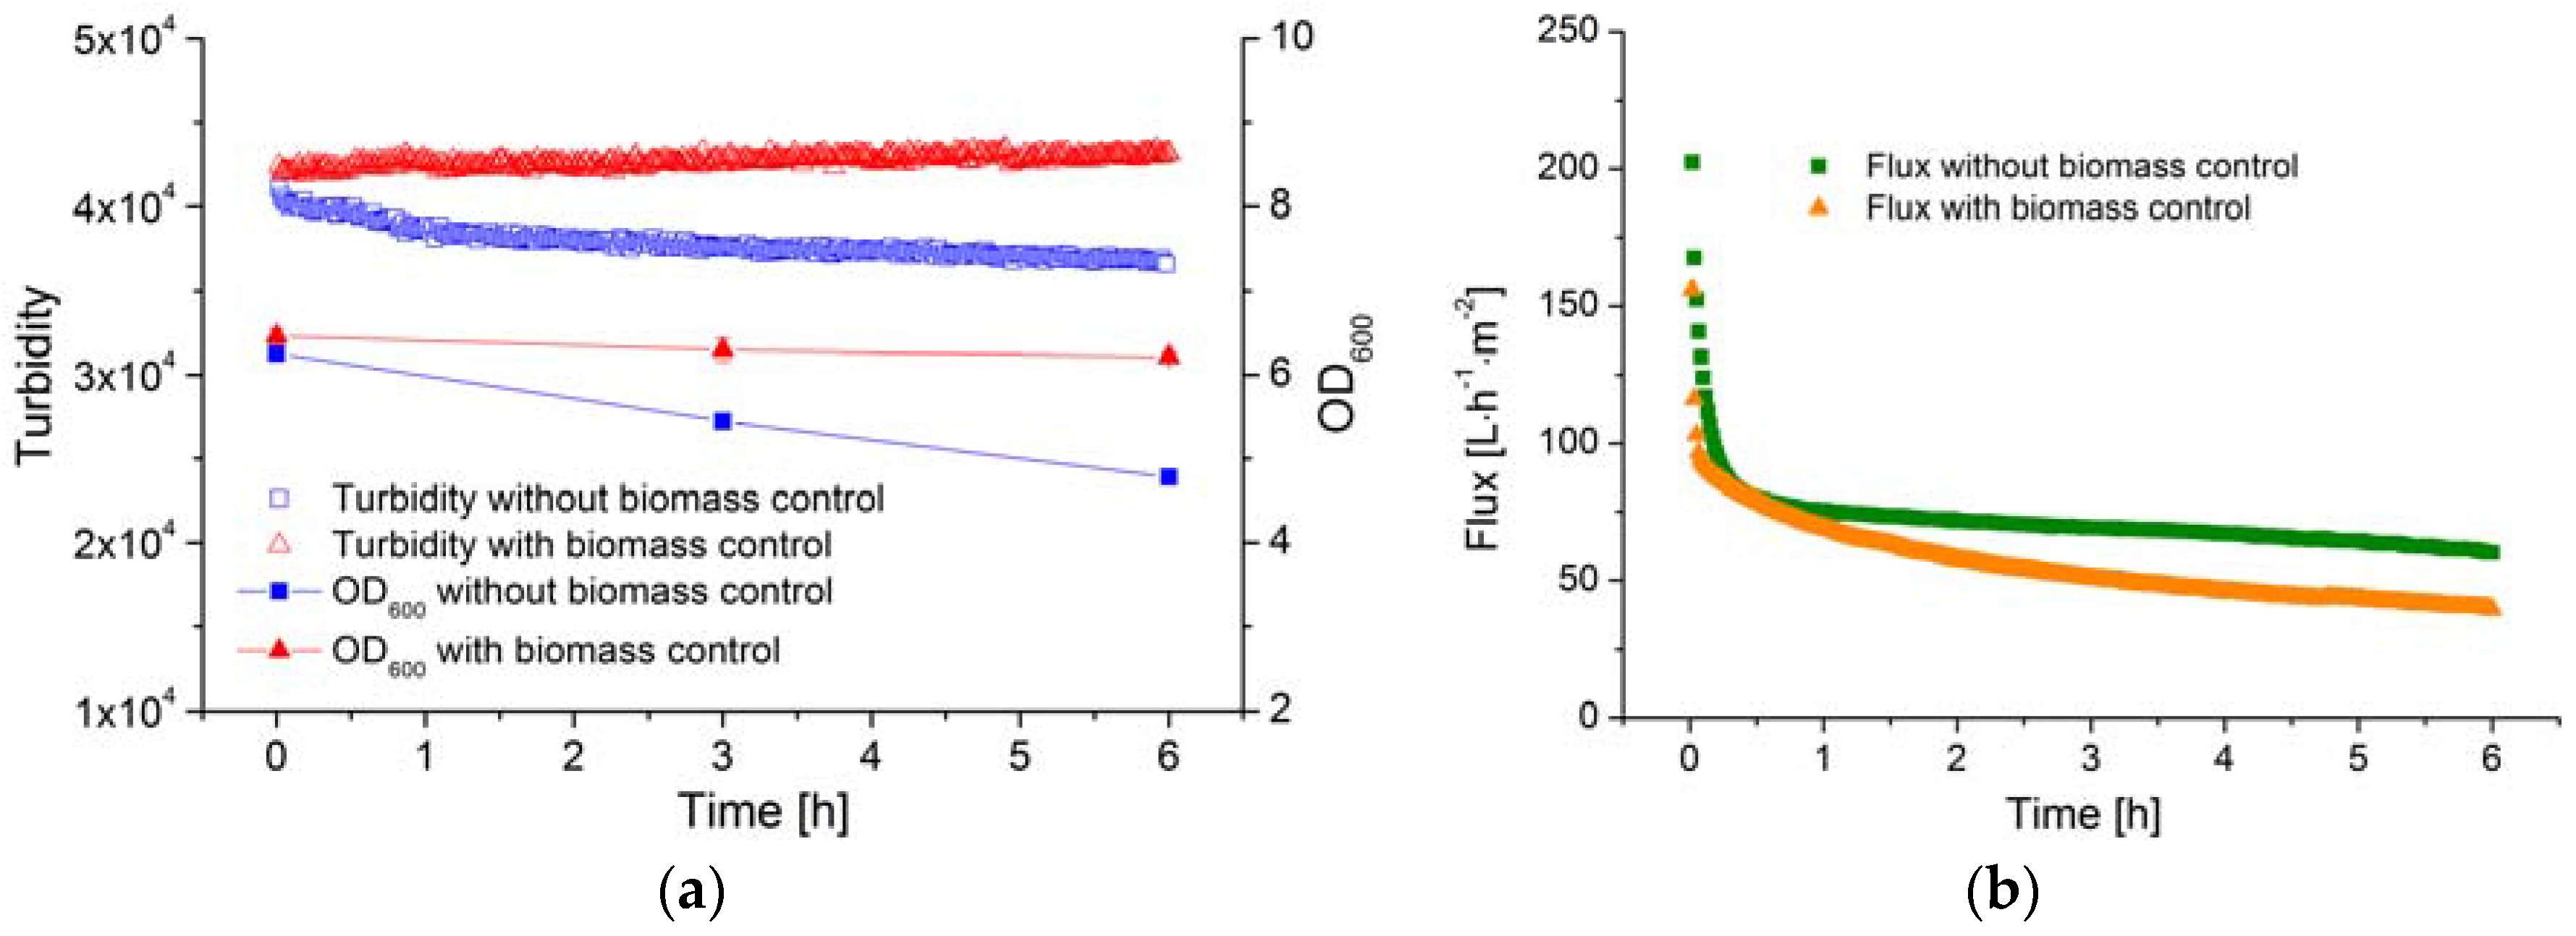
3.5. Online Monitoring and Control of Cell Density During Filtration
The membrane efficiency (filtration flux) in a MBR system is influenced not only by the TMP and CFV but also by the biomass concentration. In order to determine the correlation between membrane efficiency and the biomass concentration, the latter must remain constant. However, the concentration of B. coagulans decreases rapidly once the substrate is consumed, as shown above. Therefore, glucose solution was fed to ensure equilibrium was maintained between cell growth and cell death, and the AFG sensor was used to determine whether or not the biomass concentration remained stable over time.
The OD
600 value and the AFG sensor signal during the filtration processes are shown in
Figure 7a. Without glucose feeding, the OD
600 of the fermentation broth declined from 6.3 to 4.8 over a period of 6 h. Over the same period, the AFG sensor signal fell from 4.1 × 10
4 to 3.6 × 10
4, reflecting the decline in biomass concentration, and the average specific death rate was ~0.1 h
−1. Based on the observed biomass yield coefficient, 100 g·L
−1 glucose solution was fed into the fermenter at a flow rate of 5 mL·h
−1. Because the volume of the fed solution is much smaller than the total volume of fermentation broth, the latter was considered to remain constant during the 6 h filtration. The OD
600 value and the AFG sensor signal both remained stable under these conditions, indicating that the biomass concentration had been successfully controlled and was maintained at a constant level during filtration.
The filtration flux under both conditions (with and without biomass control) is shown in
Figure 7b. After filtration for 6 h, the flux in the process with biomass control was ~30% lower than in the process without biomass control. Because the filtration parameters (TMP, CFV and temperature) were identical in both experiments, the decline flux must therefore be caused by the stable biomass concentration.


