
Effects of Sampling Conditions and Environmental Factors on Fecal Volatile Organic Compound Analysis by an Electronic Nose Device

 , , ,
, , ,
Abstract
:1. Introduction
2. Materials and Method
2.1. Sample Collection and Preparation
2.2. Variables of Interest
2.3. VOC Analysis
2.4. Cyranose320®
2.5. Data Analysis
3. Results
4. Discussion
Supplementary Materials
Supplementary File 1Acknowledgments
Author Contributions
Conflicts of Interest
Abbreviations
| AMC | Academic medical center |
| eNose | electronic nose |
| GC-MS | gas chromatography- mass spectrometry |
| MMC | Maxima Medical Center |
| PC | principle component |
| VOC | volatile organic compound |
| VUmc | Vrije Universiteit medical center |
References
- Persaud, K.; Dodd, G. Analysis of discrimination mechanisms in the mammalian olfactory system using a model nose. Nature 1982, 299, 352–355. [Google Scholar] [CrossRef] [PubMed]
- Wilson, A.D.; Baietto, M. Applications and advances in electronic-nose technologies. Sensors 2009, 9, 5099–5148. [Google Scholar] [CrossRef] [PubMed]
- Buijck, M.; Berkhout, D.J.; de Groot, E.F.; Benninga, M.A.; van der Schee, M.P.; Kneepkens, C.M.; de Boer, N.K.; de Meij, T.G. Sniffing Out Paediatric Gastro-intestinal Diseases: The Potential of Volatile Organic Compounds as Biomarkers for Disease. J. Pediatr. Gastroenterol. Nutr. 2016. Available online: http://europepmc.org/abstract/med/27111348 (accessed on 21 November 2016).
- Deng, T. Listening and Smelling. Practical Diagnosis in Traditional Chinese Medicine; Churchill Livingstone: London, UK, 1999; pp. 55–62. [Google Scholar]
- Ahmed, I.; Greenwood, R.; Costello, B.; Ratcliffe, N.; Probert, C.S. Investigation of faecal volatile organic metabolites as novel diagnostic biomarkers in inflammatory bowel disease. Aliment. Pharmacol. Ther. 2016, 43, 596–611. [Google Scholar] [CrossRef] [PubMed]
- Cho, Y.S.; Jung, S.C.; Oh, S. Diagnosis of bovine tuberculosis using a metal oxide-based electronic nose. Lett. Appl. Microbiol. 2015, 60, 513–516. [Google Scholar] [CrossRef] [PubMed]
- De Meij, T.G.; Larbi, I.B.; van der Schee, M.P.; Lentferink, Y.E.; Paff, T.; Terhaar Sive Droste, J.S.; Mulder, C.J.; Bodegraven, A.A.; Boer, N.K. Electronic nose can discriminate colorectal carcinoma and advanced adenomas by fecal volatile biomarker analysis: Proof of principle study. Int. J. Cancer 2014, 134, 1132–1138. [Google Scholar] [CrossRef] [PubMed]
- De Meij, T.G.; de Boer, N.K.; Benninga, M.A.; Lentferink, Y.E.; de Groot, E.F.; van de Velde, M.E.; van Bodegraven, A.A.; van der Schee, M.P. Faecal gas analysis by electronic nose as novel, non-invasive method for assessment of active and quiescent paediatric inflammatory bowel disease: Proof of principle study. J. Crohn’s Colitis 2014. [Google Scholar] [CrossRef] [PubMed]
- De Meij, T.G.; van der Schee, M.P.; Berkhout, D.J.; van de Velde, M.E.; Jansen, A.E.; Kramer, B.W.; van Weissenbruch, M.M.; van Kaam, A.H.; Andriessen, P.; van Goudoever, J.B.; et al. Early Detection of Necrotizing Enterocolitis by Fecal Volatile Organic Compounds Analysis. J. Pediatr. 2015, 167, 562–567. [Google Scholar] [CrossRef] [PubMed]
- Fu, X.A.; Li, M.; Knipp, R.J.; Nantz, M.H.; Bousamra, M. Noninvasive detection of lung cancer using exhaled breath. Cancer Med. 2014, 3, 174–181. [Google Scholar] [CrossRef] [PubMed]
- Phillips, M.; Cataneo, R.N.; Cheema, T.; Greenberg, J. Increased breath biomarkers of oxidative stress in diabetes mellitus. Clin. Chim. Acta 2004, 344, 189–194. [Google Scholar] [CrossRef] [PubMed]
- Van den Velde, S.; Nevens, F.; van Steenberghe, D.; Quirynen, M. GC-MS analysis of breath odor compounds in liver patients. J. Chromatogr. B Anal. Technol. Biomed. Life Sci. 2008, 875, 344–348. [Google Scholar] [CrossRef] [PubMed]
- Smolinska, A.; Hauschild, A.C.; Fijten, R.R.; Dallinga, J.W.; Baumbach, J.; van Schooten, F.J. Current breathomics—A review on data pre-processing techniques and machine learning in metabolomics breath analysis. J. Breath Res. 2014, 8. [Google Scholar] [CrossRef] [PubMed]
- Van der Schee, M.P.; Paff, T.; Brinkman, P.; van Aalderen, W.M.; Haarman, E.G.; Sterk, P.J. Breathomics in lung disease. Chest 2015, 147, 224–231. [Google Scholar] [CrossRef] [PubMed]
- Amal, H.; Leja, M.; Funka, K.; Skapars, R.; Sivins, A.; Ancans, G.; Liepniece-Karele, I.; Kikuste, I.; Lasina, I.; Haick, H. Detection of precancerous gastric lesions and gastric cancer through exhaled breath. Gut 2016, 65, 400–407. [Google Scholar] [CrossRef] [PubMed]
- Boots, A.W.; Bos, L.D.; van der Schee, M.P.; van Schooten, F.J.; Sterk, P.J. Exhaled Molecular Fingerprinting in Diagnosis and Monitoring: Validating Volatile Promises. Trends Mol. Med. 2015, 21, 633–644. [Google Scholar] [CrossRef] [PubMed]
- Kang, S.; Paul Thomas, C.L. How long may a breath sample be stored for at −80 °C? A study of the stability of volatile organic compounds trapped onto a mixed Tenax: Carbograph trap adsorbent bed from exhaled breath. J. Breath Res. 2016, 10. [Google Scholar] [CrossRef] [PubMed]
- Van der Schee, M.P.; Fens, N.; Brinkman, P.; Bos, L.D.; Angelo, M.D.; Nijsen, T.M.; Raabe, R.; Knobel, H.H.; Vink, T.J.; Sterk, P.J. Effect of transportation and storage using sorbent tubes of exhaled breath samples on diagnostic accuracy of electronic nose analysis. J. Breath Res. 2013, 7. [Google Scholar] [CrossRef] [PubMed]
- Krilaviciute, A.; Heiss, J.A.; Leja, M.; Kupcinskas, J.; Haick, H.; Brenner, H. Detection of cancer through exhaled breath: A systematic review. Oncotarget 2015, 6, 38643–38657. [Google Scholar] [PubMed]
- Chan, D.K.; Leggett, C.L.; Wang, K.K. Diagnosing gastrointestinal illnesses using fecal headspace volatile organic compounds. World J. Gastroenterol. 2016, 22, 1639–1649. [Google Scholar] [CrossRef] [PubMed]
- Berkhout, D.J.; Niemarkt, H.J.; Buijck, M.; van Weissenbruch, M.M.; Brinkman, P.; Benninga, M.A.; van Kaam, A.H.; Kramer, B.W.; Andriessen, P.; de Boer, N.K.; et al. Detection of Sepsis in Preterm Infants by Fecal Volatile Organic Compounds Analysis: A Proof of Principle Study. J. Pediatr. Gastroenterol. Nutr. 2016. [Google Scholar] [CrossRef] [PubMed]
- Li, J. The cyranose chemical vapor analyzer. Sensors 2000, 17, 56–61. [Google Scholar]
- Mayor, A.; Reade, S.; Aggio, R.; Khalid, T.; Probert, C. PTH-023 Paediatric Faecal Voc Analysis: Method Optimisation. Gut 2014, 63. [Google Scholar] [CrossRef]
- Reade, S.; Mayor, A.; Aggio, R.; Khalid, T.; Pritchard, D.M.; Ewer, A.K.; Probert, C.S. Optimisation of sample preparation for direct SPME-GC-MS analysis of murine and human faecal volatile organic compounds for metabolomic Studies. J. Anal. Bioanal. Tech. 2014. [Google Scholar] [CrossRef]
- Gao, X.; Pujos-Guillot, E.; Martin, J.F.; Galan, P.; Juste, C.; Jia, W.; Sebedio, J.L. Metabolite analysis of human fecal water by gas chromatography/mass spectrometry with ethyl chloroformate derivatization. Anal. Biochem. 2009, 393, 163–175. [Google Scholar] [CrossRef] [PubMed]
- Ng, J.S.; Ryan, U.; Trengove, R.D.; Maker, G.L. Development of an untargeted metabolomics method for the analysis of human faecal samples using Cryptosporidium-infected samples. Mol. Biochem. Parasitol. 2012, 185, 145–150. [Google Scholar] [CrossRef] [PubMed]
- Saric, J.; Wang, Y.; Li, J.; Coen, M.; Utzinger, J.; Marchesi, J.R.; Keiser, J.; Veselkov, K.; Lindon, J.C.; Nicholson, J.K.; et al. Species variation in the fecal metabolome gives insight into differential gastrointestinal function. J. Proteome Res. 2008, 7, 352–360. [Google Scholar] [CrossRef] [PubMed]
- Rock, F.; Barsan, N.; Weimar, U. Electronic nose: Current status and future trends. Chem. Rev. 2008, 108, 705–725. [Google Scholar] [CrossRef] [PubMed]
- Dryahina, K.; Španěl, P.; Pospíšilová, V.; Sovová, K.; Hrdlička, L.; Machková, N.; Lukáš, M.; Smith, D. Quantification of pentane in exhaled breath, a potential biomarker of bowel disease, using selected ion flow tube mass spectrometry. Rapid Commun. Mass Spectrom. 2013, 27, 1983–1992. [Google Scholar] [CrossRef] [PubMed]
- Kushch, I.; Arendacká, B.; Štolc, S.; Mochalski, P.; Filipiak, W.; Schwarz, K.; Schwentner, L.; Schmid, A.; Dzien, A.; Lechleitner, M.; et al. Breath isoprene—Aspects of normal physiology related to age, gender and cholesterol profile as determined in a proton transfer reaction mass spectrometry study. Clin. Chem. Lab. Med. 2008, 46, 1011–1018. [Google Scholar] [CrossRef] [PubMed]
- Raman, M.; Ahmed, I.; Gillevet, P.M.; Probert, C.S.; Ratcliffe, N.M.; Smith, S.; Greenwood, R.; Sikaroodi, M.; Lam, V.; Crotty, P.; et al. Fecal microbiome and volatile organic compound metabolome in obese humans with nonalcoholic fatty liver disease. Clin. Gastroenterol. Hepatol. 2013, 11, 868–875. [Google Scholar] [CrossRef] [PubMed]
- Lozupone, C.A.; Stombaugh, J.; Gonzalez, A.; Ackermann, G.; Wendel, D.; Vazquez-Baeza, Y.; Jansson, J.K.; Gordon, J.I.; Knight, R. Meta-analyses of studies of the human microbiota. Genome Res. 2013, 23, 1704–1714. [Google Scholar] [CrossRef] [PubMed]
- Leja, M.; Amal, H.; Lasina, I.; Skapars, R.; Sivins, A.; Ancans, G.; Tolmanis, I.; Vanags, A.; Kupcinskas, J.; Ramonaite, R. Analysis of the effects of microbiome-related confounding factors on the reproducibility of the volatolomic test. J. Breath Res. 2016, 10. [Google Scholar] [CrossRef] [PubMed]
- Bomers, M.K.; van Agtmael, M.A.; Luik, H.; van Veen, M.C.; Vandenbroucke-Grauls, C.M.; Smulders, Y.M. Using a dog’s superior olfactory sensitivity to identify Clostridium difficile in stools and patients: Proof of principle study. BMJ 2012, 345. [Google Scholar] [CrossRef] [PubMed]
- Bomers, M.K.; Menke, F.P.; Savage, R.S.; Vandenbroucke-Grauls, C.M.; van Agtmael, M.A.; Covington, J.A.; Smulders, Y.M. Rapid, accurate, and on-site detection of C. difficile in stool samples. Am. J. Gastroenterol. 2015, 110, 588–594. [Google Scholar] [CrossRef] [PubMed]
- Tait, E.; Hill, K.A.; Perry, J.D.; Stanforth, S.P.; Dean, J.R. Development of a novel method for detection of Clostridium difficile using HS-SPME-GC-MS. J. Appl. Microbiol. 2014, 116, 1010–1019. [Google Scholar] [CrossRef] [PubMed]
- Chan, D.K.; Anderson, M.; Lynch, D.T.; Leggett, C.L.; Lutzke, L.S.; Clemens, M.A.; Clemens, M.A.; Wang, K.K. Su1352 Detection of Clostridium difficile-Infected Stool by Electronic-Nose Analysis of Fecal Headspace Volatile Organic Compounds. Gastroenterology 2015, 148. [Google Scholar] [CrossRef]
- Fouhy, F.; Deane, J.; Rea, M.C.; O’Sullivan, O.; Ross, R.P.; O’Callaghan, G.; Plant, B.J.; Stanton, C. The effects of freezing on faecal microbiota as determined using MiSeq sequencing and culture-based investigations. PLoS ONE 2015, 10, e0119355. [Google Scholar] [CrossRef] [PubMed] [Green Version]
- Gratton, J.; Phetcharaburanin, J.; Mullish, B.H.; Williams, H.R.; Thursz, M.; Nicholson, J.K.; Holmes, E.; Marchesi, J.R.; Li, J.V. Optimized Sample Handling Strategy for Metabolic Profiling of Human Feces. Anal. Chem. 2016, 88, 4661–4668. [Google Scholar] [CrossRef] [PubMed]
- Garner, C.E.; Smith, S.; de Lacy, C.B.; White, P.; Spencer, R.; Probert, C.S.; Ratcliffe, N.M. Volatile organic compounds from feces and their potential for diagnosis of gastrointestinal disease. FASEB J. 2007, 21, 1675–1688. [Google Scholar] [CrossRef] [PubMed]
- Esfahani, S.; Sagar, N.M.; Kyrou, I.; Mozdiak, E.; O’Connell, N.; Nwokolo, C.; Bardhan, K.D.; Arasaradnam, R.P.; Covington, J.A. Variation in Gas and Volatile Compound Emissions from Human Urine as It Ages, Measured by an Electronic Nose. Biosensors 2016, 6, 4. [Google Scholar] [CrossRef] [PubMed]
- Maleknia, S.D.; Vail, T.M.; Cody, R.B.; Sparkman, D.O.; Bell, T.L.; Adams, M.A. Temperature-dependent release of volatile organic compounds of eucalypts by direct analysis in real time (DART) mass spectrometry. Rapid Commun. Mass Spectrom. 2009, 23, 2241–2246. [Google Scholar] [CrossRef] [PubMed]
- Deda, O.; Gika, H.G.; Wilson, I.D.; Theodoridis, G.A. An overview of fecal sample preparation for global metabolic profiling. J. Pharm. Biomed. Anal. 2015, 113, 137–150. [Google Scholar] [CrossRef] [PubMed]
- Forbes, S.L.; Rust, L.; Trebilcock, K.; Perrault, K.A.; McGrath, L.T. Effect of age and storage conditions on the volatile organic compound profile of blood. Forensic. Sci. Med. Pathol. 2014, 10, 570–582. [Google Scholar] [CrossRef] [PubMed]
- Mochalski, P.; Wzorek, B.; Sliwka, I.; Amann, A. Suitability of different polymer bags for storage of volatile sulphur compounds relevant to breath analysis. J. Chromatogr. B Anal. Technol. Biomed. Life Sci. 2009, 877, 189–196. [Google Scholar] [CrossRef] [PubMed]
- Budding, A.E.; Grasman, M.E.; Eck, A.; Bogaards, J.A.; Vandenbroucke-Grauls, C.M.; van Bodegraven, A.A.; Savelkoul, P.H. Rectal swabs for analysis of the intestinal microbiota. PLoS ONE 2014, 9, e101344. [Google Scholar] [CrossRef] [PubMed]
- Birkemeyer, C.S.; Thomsen, R.; Jänig, S.; Kücklich, M.; Slama, A.; Weiß, B.M.; Widdig, A. Sampling the Body Odor of Primates: Cotton Swabs Sample Semivolatiles Rather Than Volatiles. Chem. Senses 2016, 41, 525–535. [Google Scholar] [CrossRef] [PubMed]
- Consedine, N.S.; Ladwig, I.; Reddig, M.K.; Broadbent, E.A. The many faeces of colorectal cancer screening embarrassment: Preliminary psychometric development and links to screening outcome. Br. J. Health Psychol. 2011, 16, 559–579. [Google Scholar] [CrossRef] [PubMed]
- Amal, H.; Leja, M.; Broza, Y.Y.; Tisch, U.; Funka, K.; Liepniece-Karele, I.; Skapars, R.; Xu, Z.Q.; Liu, H.; Haick, H. Geographical variation in the exhaled volatile organic compounds. J. Breath Res. 2013, 7. [Google Scholar] [CrossRef] [PubMed]
- Gaida, A.; Holz, O.; Nell, C.; Schuchardt, S.; Lavae-Mokhtari, B.; Kruse, L.; Boas, U.; Langejuergen, J.; Allers, M.; Zimmermann, S.; et al. A dual center study to compare breath volatile organic compounds from smokers and non-smokers with and without COPD. J. Breath Res. 2016, 10. [Google Scholar] [CrossRef] [PubMed]
- Taft, D.H.; Ambalavanan, N.; Schibler, K.R.; Yu, Z.; Newburg, D.S.; Ward, D.V.; Morrow, A.L. Intestinal microbiota of preterm infants differ over time and between hospitals. Microbiome 2014, 2, 36. [Google Scholar] [CrossRef] [PubMed]
- Taft, D.H.; Ambalavanan, N.; Schibler, K.R.; Yu, Z.; Newburg, D.S.; Deshmukh, H.; Ward, D.V.; Morrow, A.L. Center Variation in Intestinal Microbiota Prior to Late-Onset Sepsis in Preterm Infants. PLoS ONE 2015, 10, e0130604. [Google Scholar] [CrossRef] [PubMed]
- Torrazza, R.M.; Ukhanova, M.; Wang, X.; Sharma, R.; Hudak, M.L.; Neu, J.; Mai, V. Intestinal microbial ecology and environmental factors affecting necrotizing enterocolitis. PLoS ONE 2013, 8, e83304. [Google Scholar] [CrossRef] [PubMed]
- Brooks, B.; Firek, B.A.; Miller, C.S.; Sharon, I.; Thomas, B.C.; Baker, R.; Morowitz, M.J.; Banfield, J.F. Microbes in the neonatal intensive care unit resemble those found in the gut of premature infants. Microbiome 2014, 2, 1. [Google Scholar] [CrossRef] [PubMed]


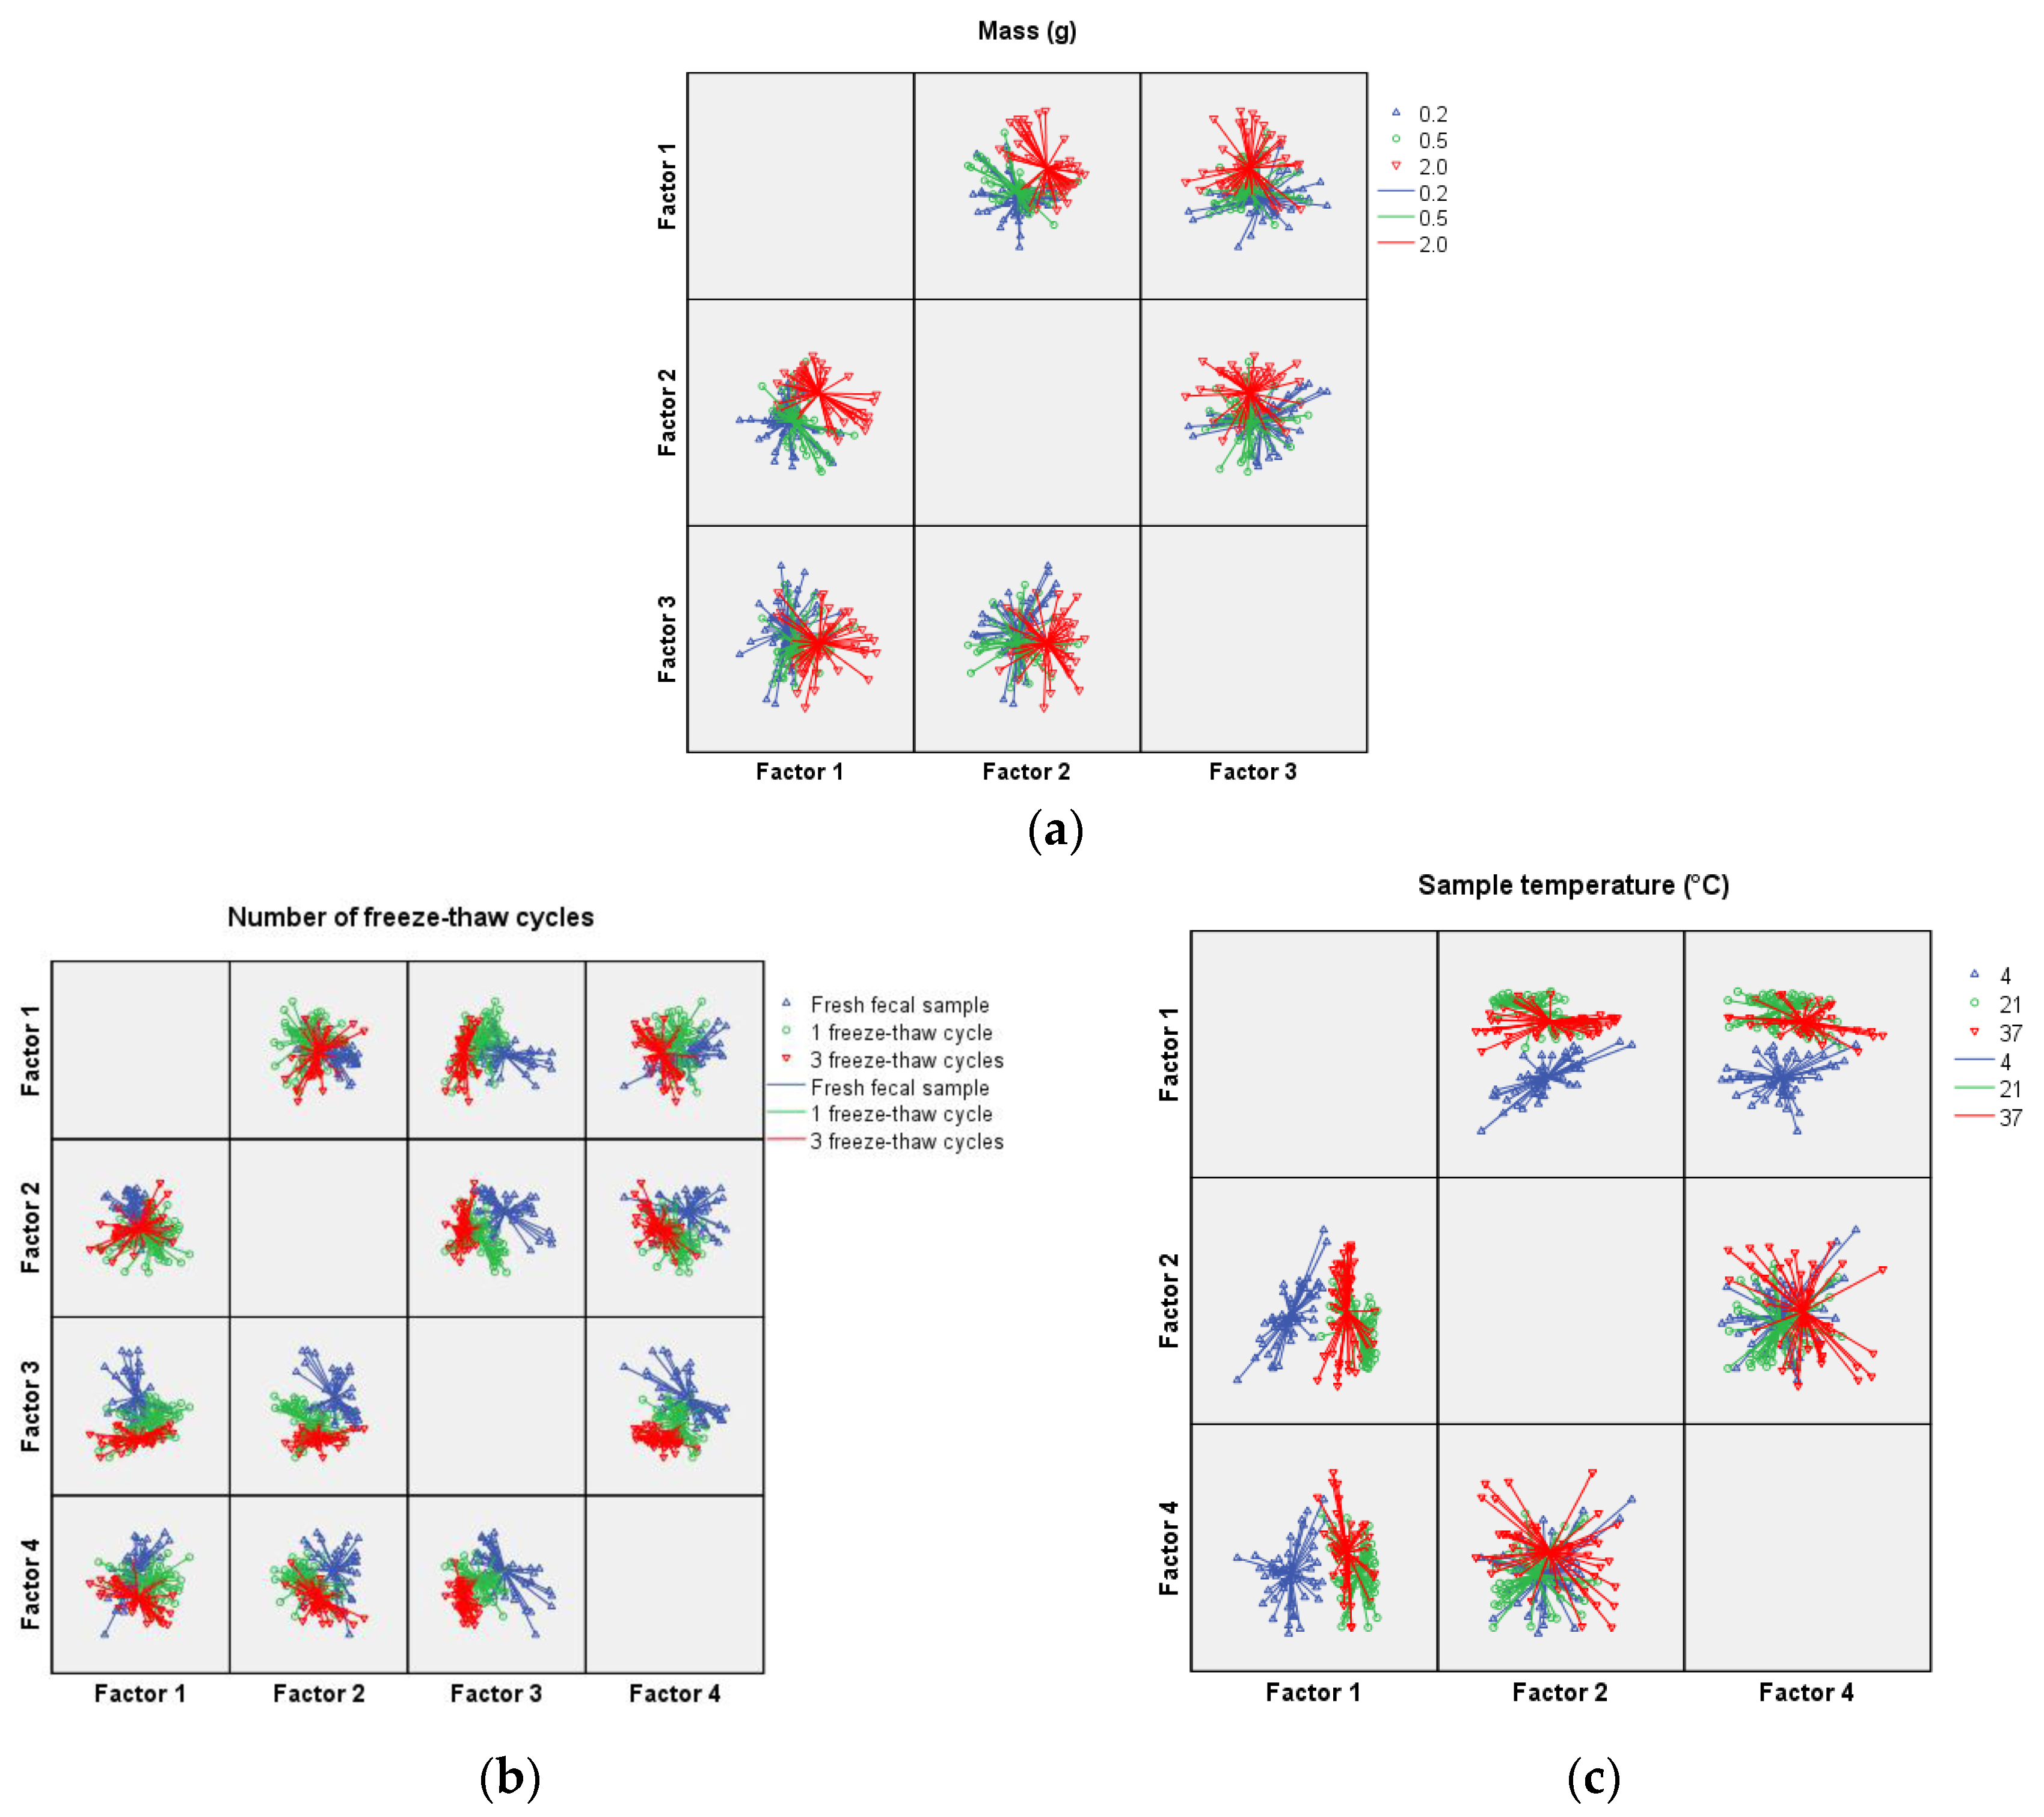
| PC 1 (p-Value) | PC 2 (p-Value) | PC 3 (p-Value) | PC 4 (p-Value) | |
|---|---|---|---|---|
| Sample mass (g) | ||||
| 0.2 vs. 0.5 | 0.036 | 0.841 | 0.016 | 0.581 |
| 0.2 vs. 2.0 | <0.001 | <0.001 | 0.020 | 0.220 |
| 0.5 vs. 2.0 | <0.001 | <0.001 | 0.937 | 0.077 |
| Number of freeze–thaw cycles (−20 °C—room temperature) | ||||
| Fresh feces vs. 1 cycle | <0.001 | <0.001 | <0.001 | 0.018 |
| Fresh feces vs. 3 cycles | 0.641 | 0.001 | <0.001 | <0.001 |
| 1 cycle vs. 3 cycle | 0.001 | 0.003 | <0.001 | <0.001 |
| Sample temperature (°C) | ||||
| 4 vs. 21 | <0.001 | 0.141 | 0.824 | 0.916 |
| 4 vs. 37 | <0.001 | 0.521 | 0.054 | 0.001 |
| 21 vs. 37 | 0.001 | 0.035 | 0.085 | 0.001 |
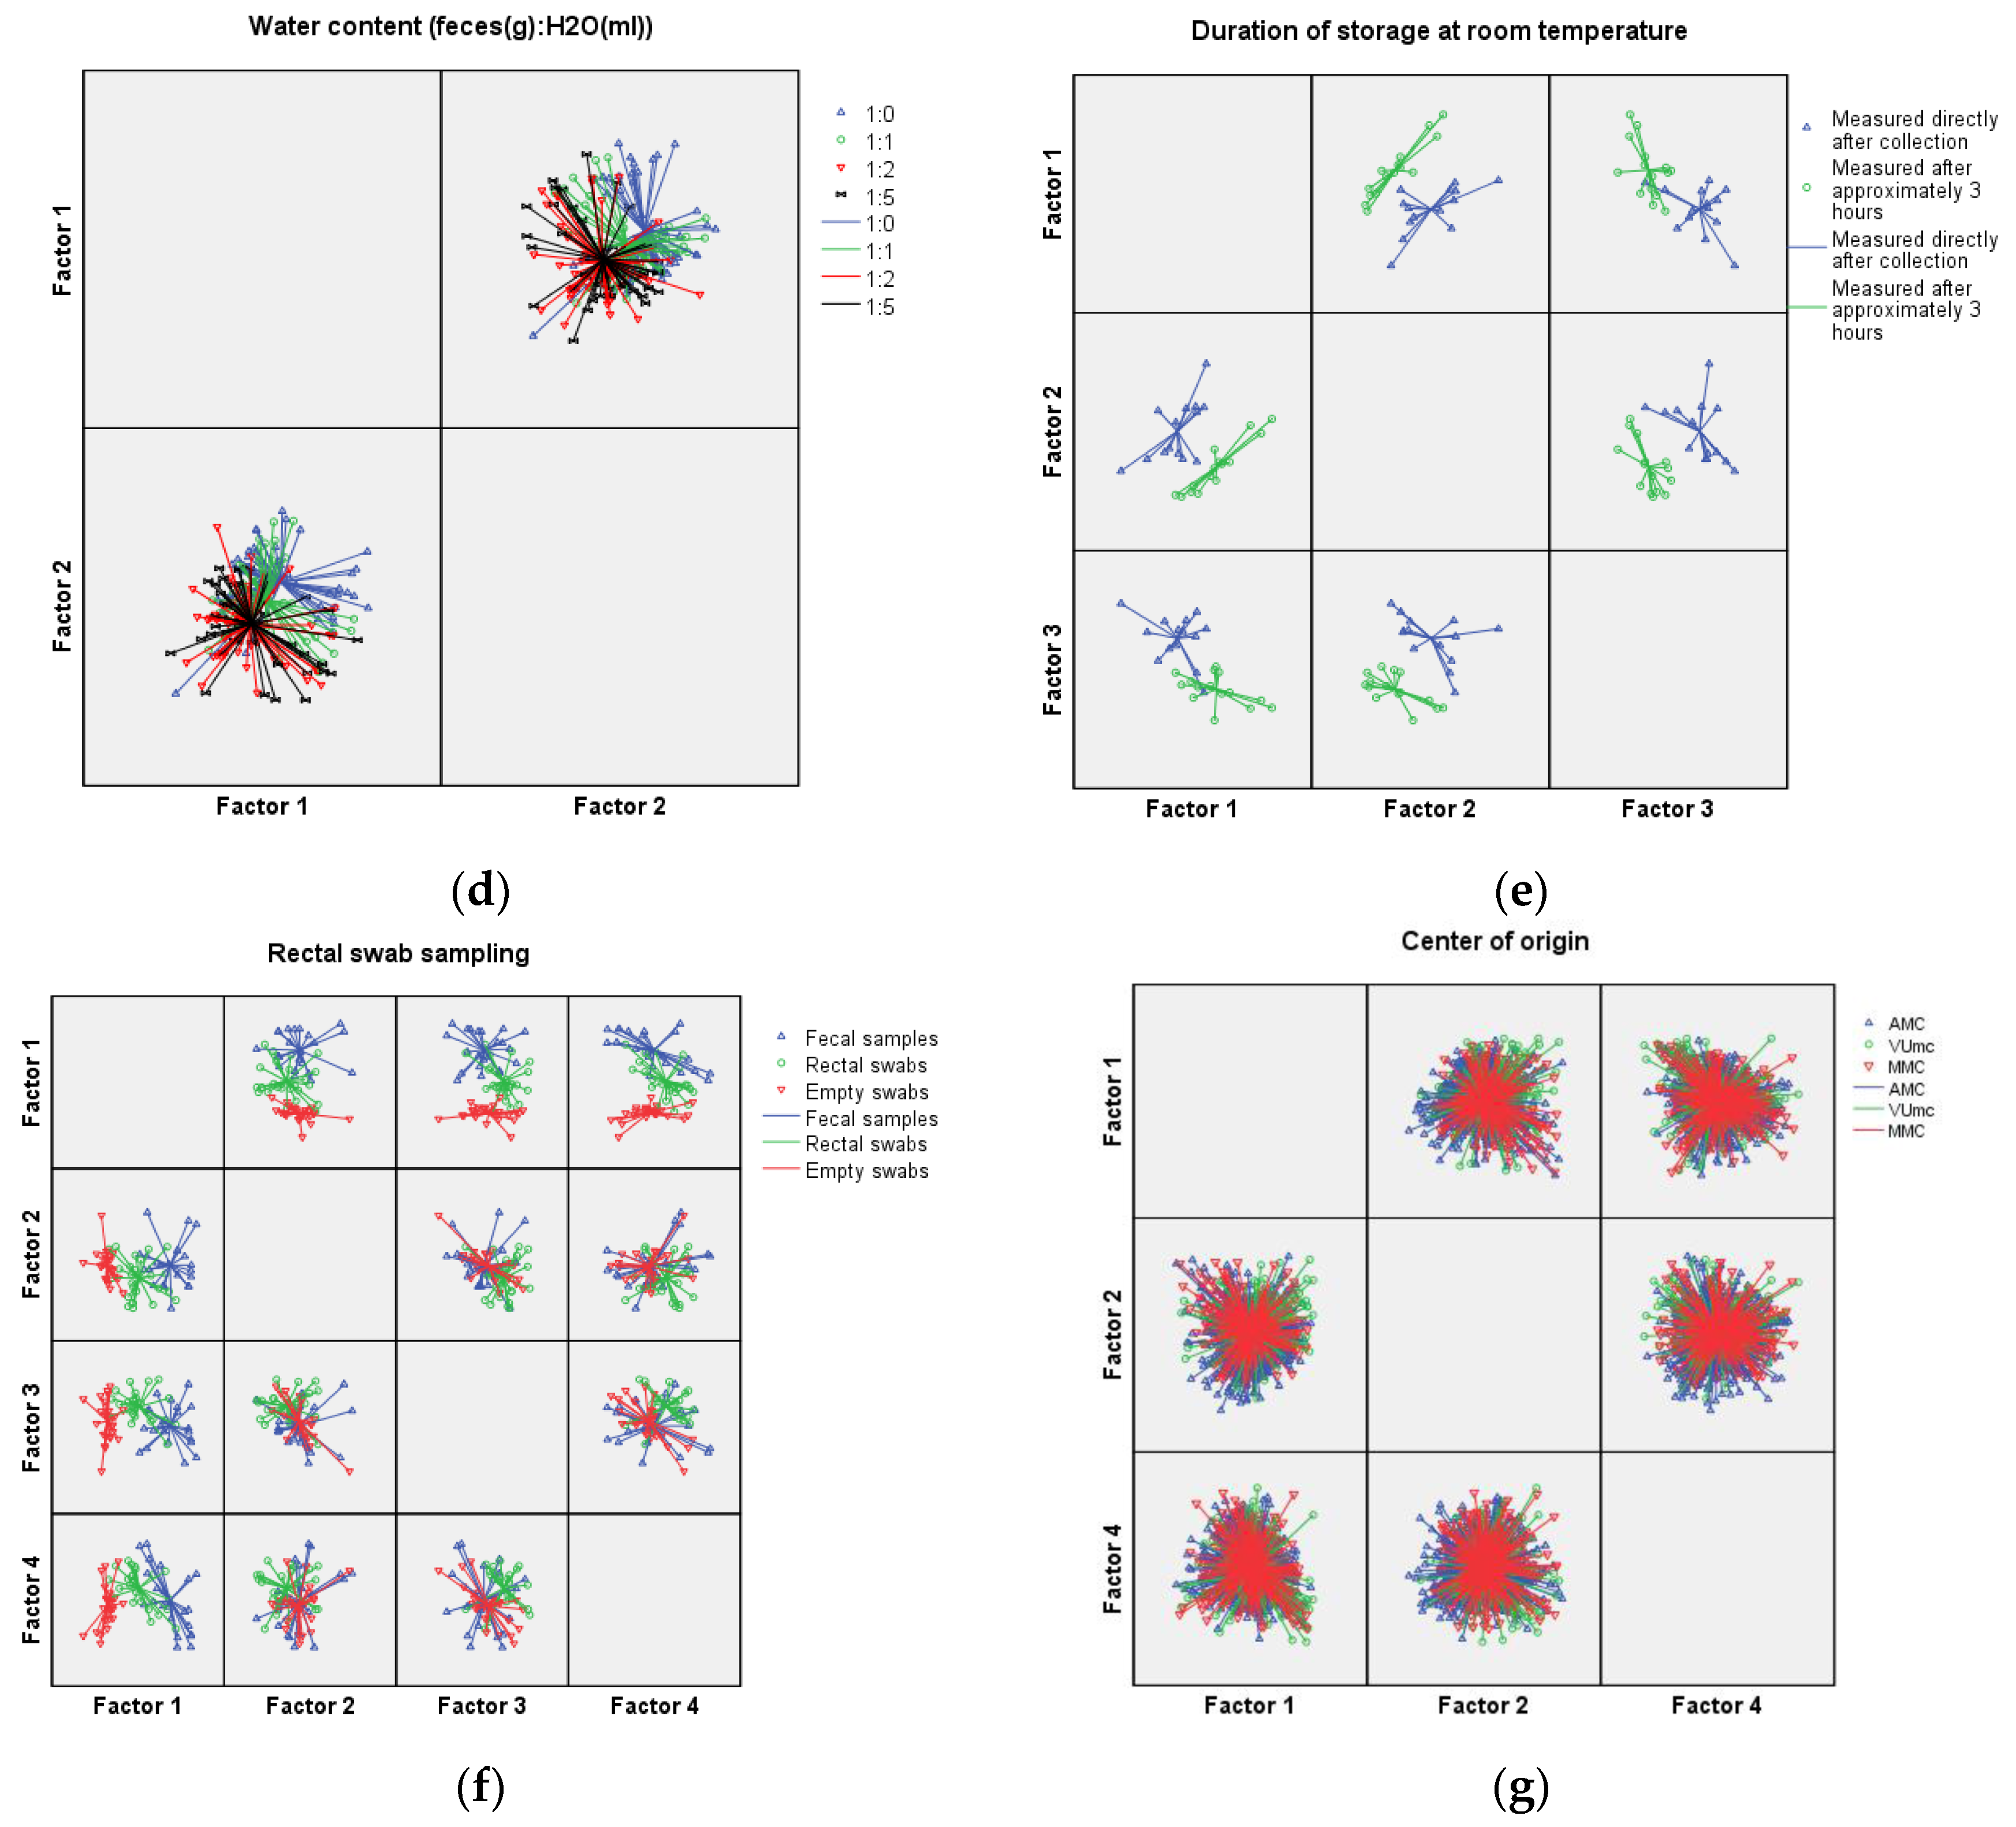
| Water content (Feces (g):H2O (mL)) | ||||
| 1:0 vs. 1:1 | 0.089 | 0.017 | 0.167 | 0.106 |
| 1:0 vs. 1:2 | <0.001 | <0.001 | 0.072 | 0.408 |
| 1:0 vs. 1:5 | 0.001 | <0.001 | 0.093 | 0.198 |
| 1:1 vs. 1:2 | 0.028 | 0.001 | 0.673 | 0.429 |
| 1:1 vs. 1:5 | 0.069 | 0.002 | 0.764 | 0.742 |
| 1:2 vs. 1:5 | 0.702 | 0.825 | 0.903 | 0.643 |
| Duration of storage at room temperature | ||||
| Fresh feces vs. 3 h storage | <0.001 | 0.001 | <0.001 | 0.718 |
| Comparison rectal swab and fecal sample | ||||
| Fecal sample vs. Rectal swab | <0.001 | 0.018 | 0.002 | 0.103 |
| Fecal sample vs. Empty swab | <0.001 | 0.406 | 0.458 | 0.362 |
| Rectal swab vs. Empty swab | <0.001 | 0.112 | 0.015 | 0.013 |
| Center of origin | ||||
| AMC vs. VUmc | 0.079 | 0.003 | 0.109 | 0.598 |
| AMC vs. MMC | 0.480 | <0.001 | 0.135 | 0.050 |
| VUmc vs. MMC | 0.031 | 0.881 | 0.774 | 0.043 |
| Sensitivity (%) | Specificity (%) | Overall Accuracy (%) | |
|---|---|---|---|
| Sample mass (g) | |||
| 0.2 | 60.0 | 55.1 | |
| 0.5 | 52.7 | 58.0 | |
| 2.0 | 81.6 | 80.0 | 64.4 |
| Number of freeze–thaw cycles (−20 °C—room temperature) | |||
| Fresh feces | 100.0 | 95.7 | |
| 1 cycle | 87.2 | 82.0 | |
| 3 cycles | 83.6 | 92.0 | 89.7 |
| Sample temperature (°C) | |||
| 4 | 100.0 | 93.9 | |
| 21 | 71.4 | 70.0 | |
| 37 | 66.0 | 71.4 | 78.4 |
| Water content (Feces (g):H2O (mL)) | |||
| 1:0 | 51.5 | 68.0 | |
| 1:1 | 29.7 | 22.4 | |
| 1:2 | 36.6 | 52.0 | |
| 1:5 | 20.0 | 10.0 | 38.1 |
| Duration of storage at room temperature | |||
| Fresh feces | 100.0 | 100.0 | |
| 3 h storage | 100.0 | 100.0 | 100.0 |
| Comparison rectal swab and fecal sample | |||
| Fecal sample | 78.9 | 68.2 | |
| Rectal swab | 66.7 | 75.0 | |
| Empty swab | 92.0 | 92.0 | 78.9 |
| Center of origin | |||
| AMC | 56.4 | 41.3 | |
| VUmc | 23.0 | 32.5 | |
| MMC | 34.8 | 41.3 | 39.6 |
© 2016 by the authors; licensee MDPI, Basel, Switzerland. This article is an open access article distributed under the terms and conditions of the Creative Commons Attribution (CC-BY) license (http://creativecommons.org/licenses/by/4.0/).
Share and Cite
Berkhout, D.J.C.; Benninga, M.A.; Van Stein, R.M.; Brinkman, P.; Niemarkt, H.J.; De Boer, N.K.H.; De Meij, T.G.J. Effects of Sampling Conditions and Environmental Factors on Fecal Volatile Organic Compound Analysis by an Electronic Nose Device. Sensors 2016, 16, 1967. https://doi.org/10.3390/s16111967
Berkhout DJC, Benninga MA, Van Stein RM, Brinkman P, Niemarkt HJ, De Boer NKH, De Meij TGJ. Effects of Sampling Conditions and Environmental Factors on Fecal Volatile Organic Compound Analysis by an Electronic Nose Device. Sensors. 2016; 16(11):1967. https://doi.org/10.3390/s16111967
Chicago/Turabian StyleBerkhout, Daniel J. C., Marc A. Benninga, Ruby M. Van Stein, Paul Brinkman, Hendrik J. Niemarkt, Nanne K. H. De Boer, and Tim G. J. De Meij. 2016. "Effects of Sampling Conditions and Environmental Factors on Fecal Volatile Organic Compound Analysis by an Electronic Nose Device" Sensors 16, no. 11: 1967. https://doi.org/10.3390/s16111967
APA StyleBerkhout, D. J. C., Benninga, M. A., Van Stein, R. M., Brinkman, P., Niemarkt, H. J., De Boer, N. K. H., & De Meij, T. G. J. (2016). Effects of Sampling Conditions and Environmental Factors on Fecal Volatile Organic Compound Analysis by an Electronic Nose Device. Sensors, 16(11), 1967. https://doi.org/10.3390/s16111967