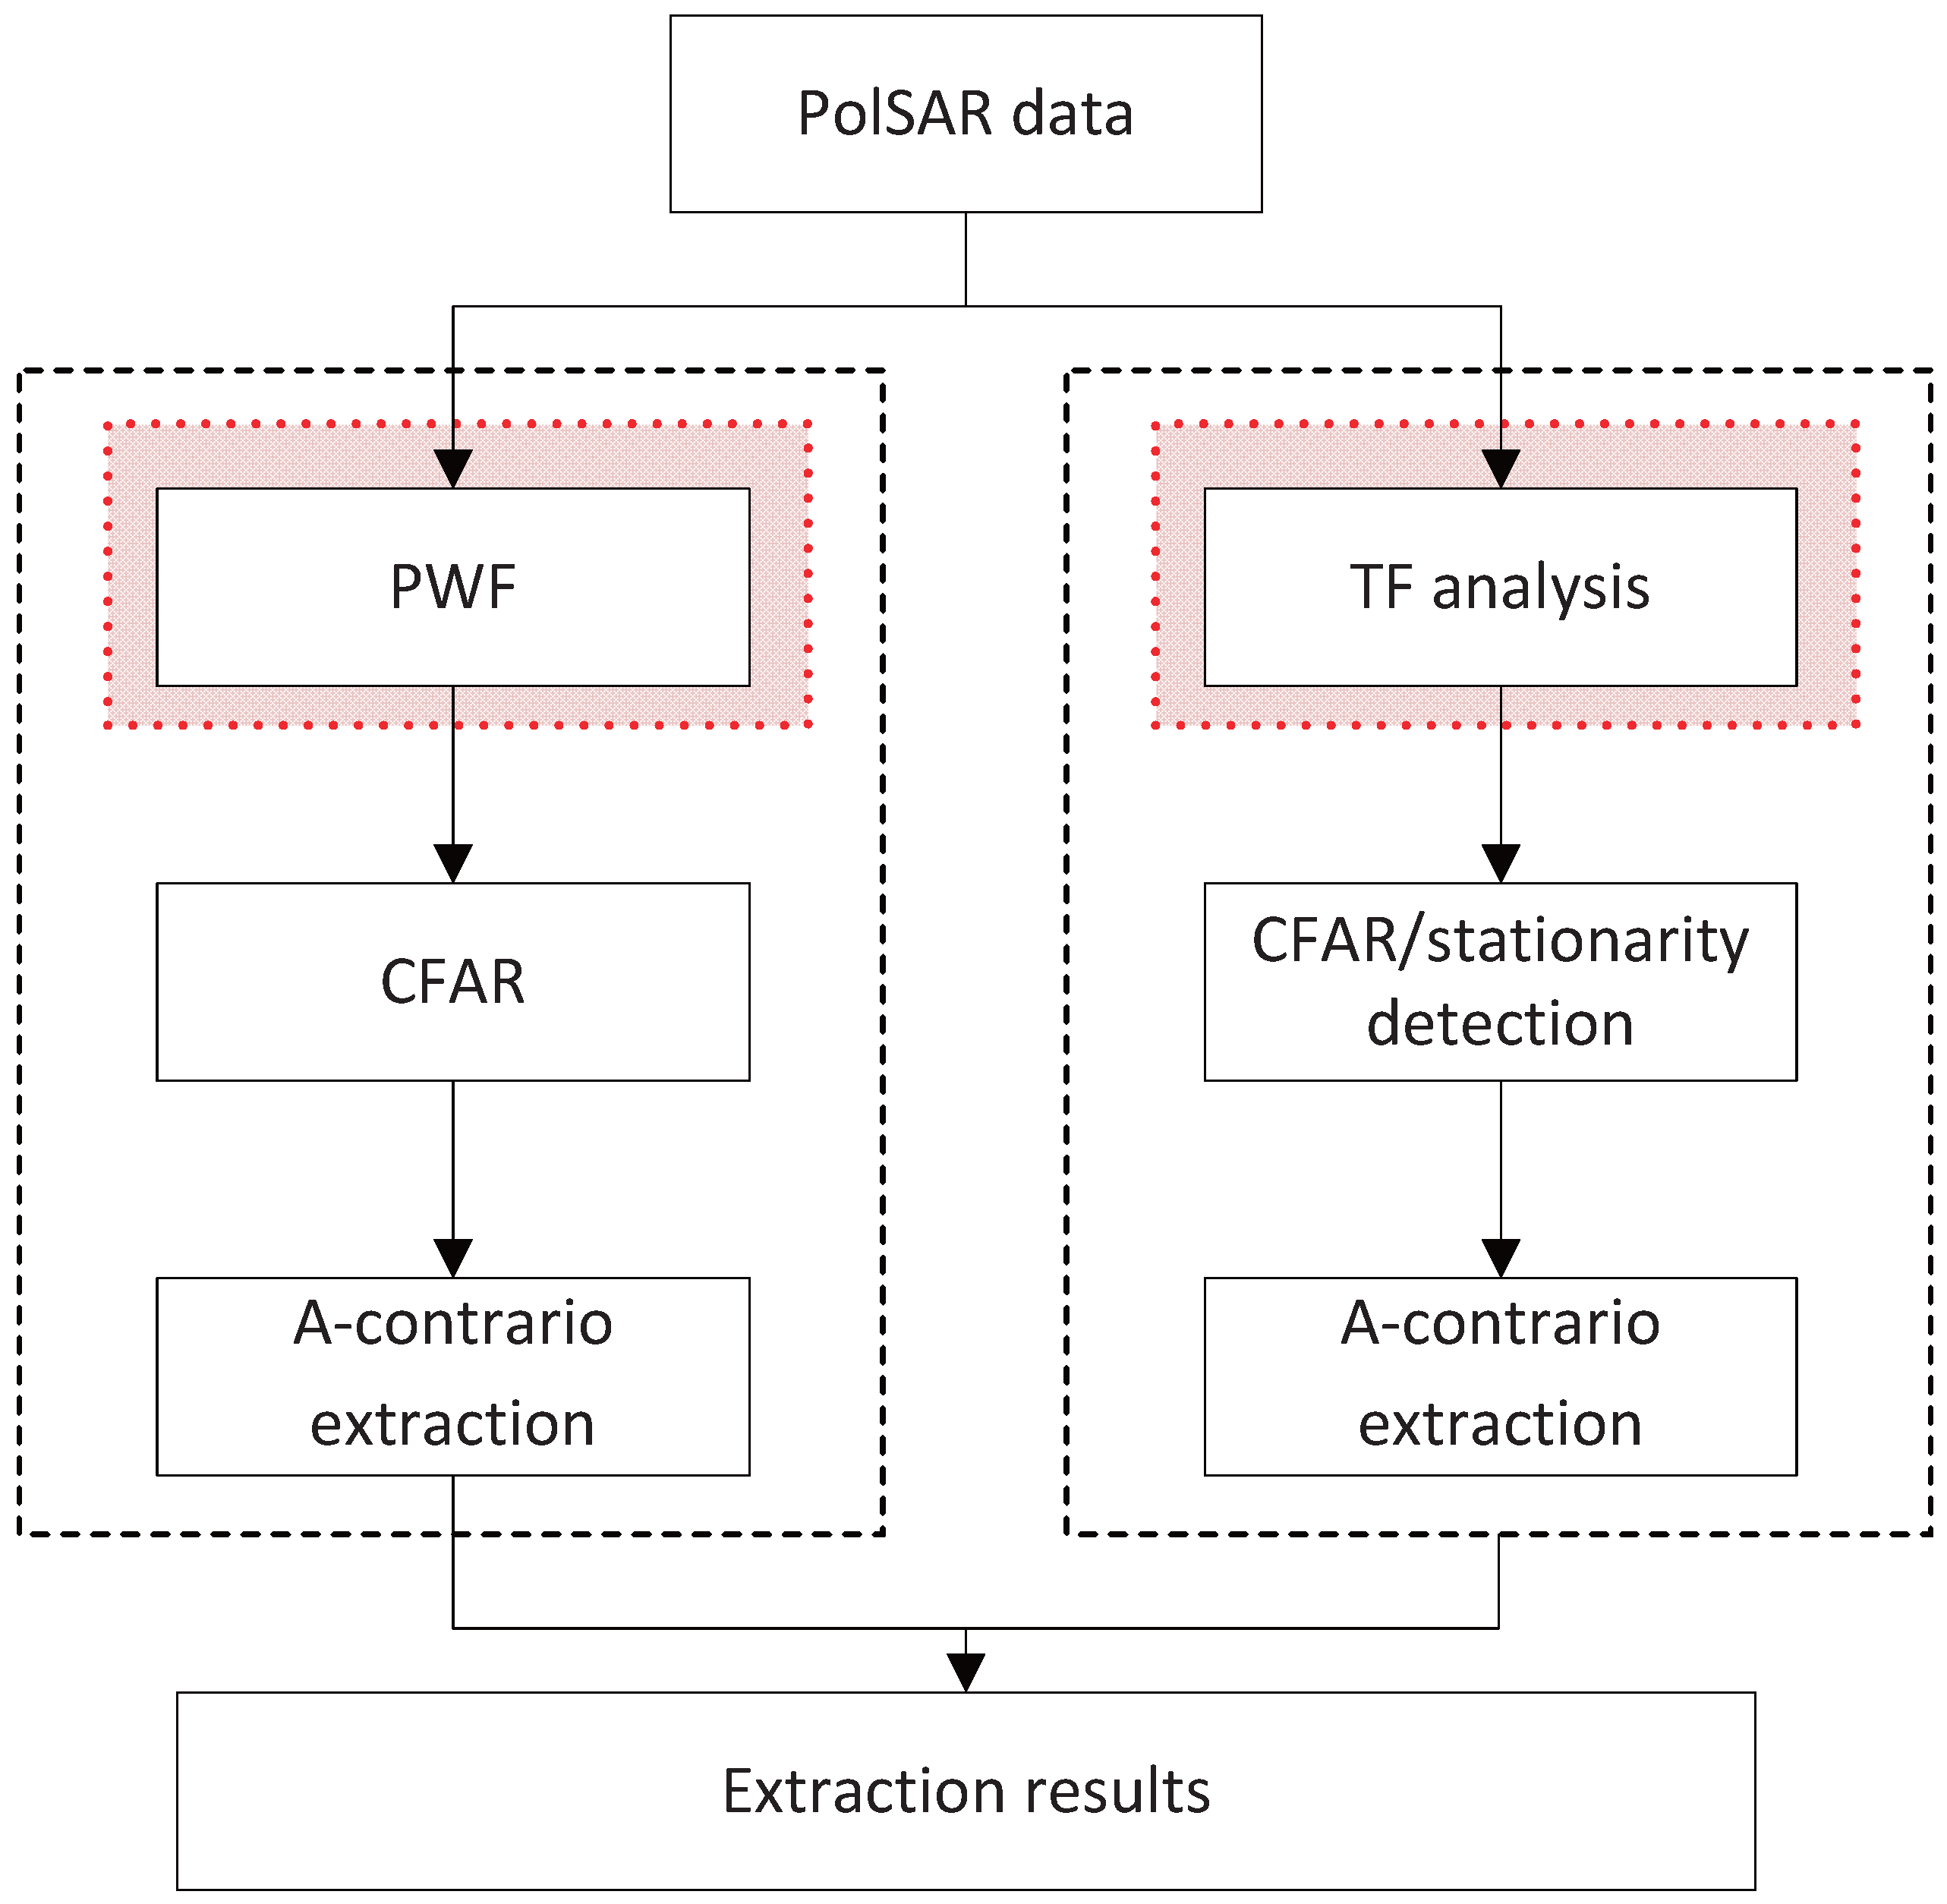
To verify the effectiveness of the proposed approach, three groups of experiments are performed in this section. The three sets of data are Niigata Site Area of Japan, Inner Mongolia Area of China and Linshui City in Hainan Province of China data, respectively. When detecting point targets, PWF is used for a comparison. The specific flowchart of a PWF based approach and TF based approach is shown in
Figure 6.
4.1. Experiment I
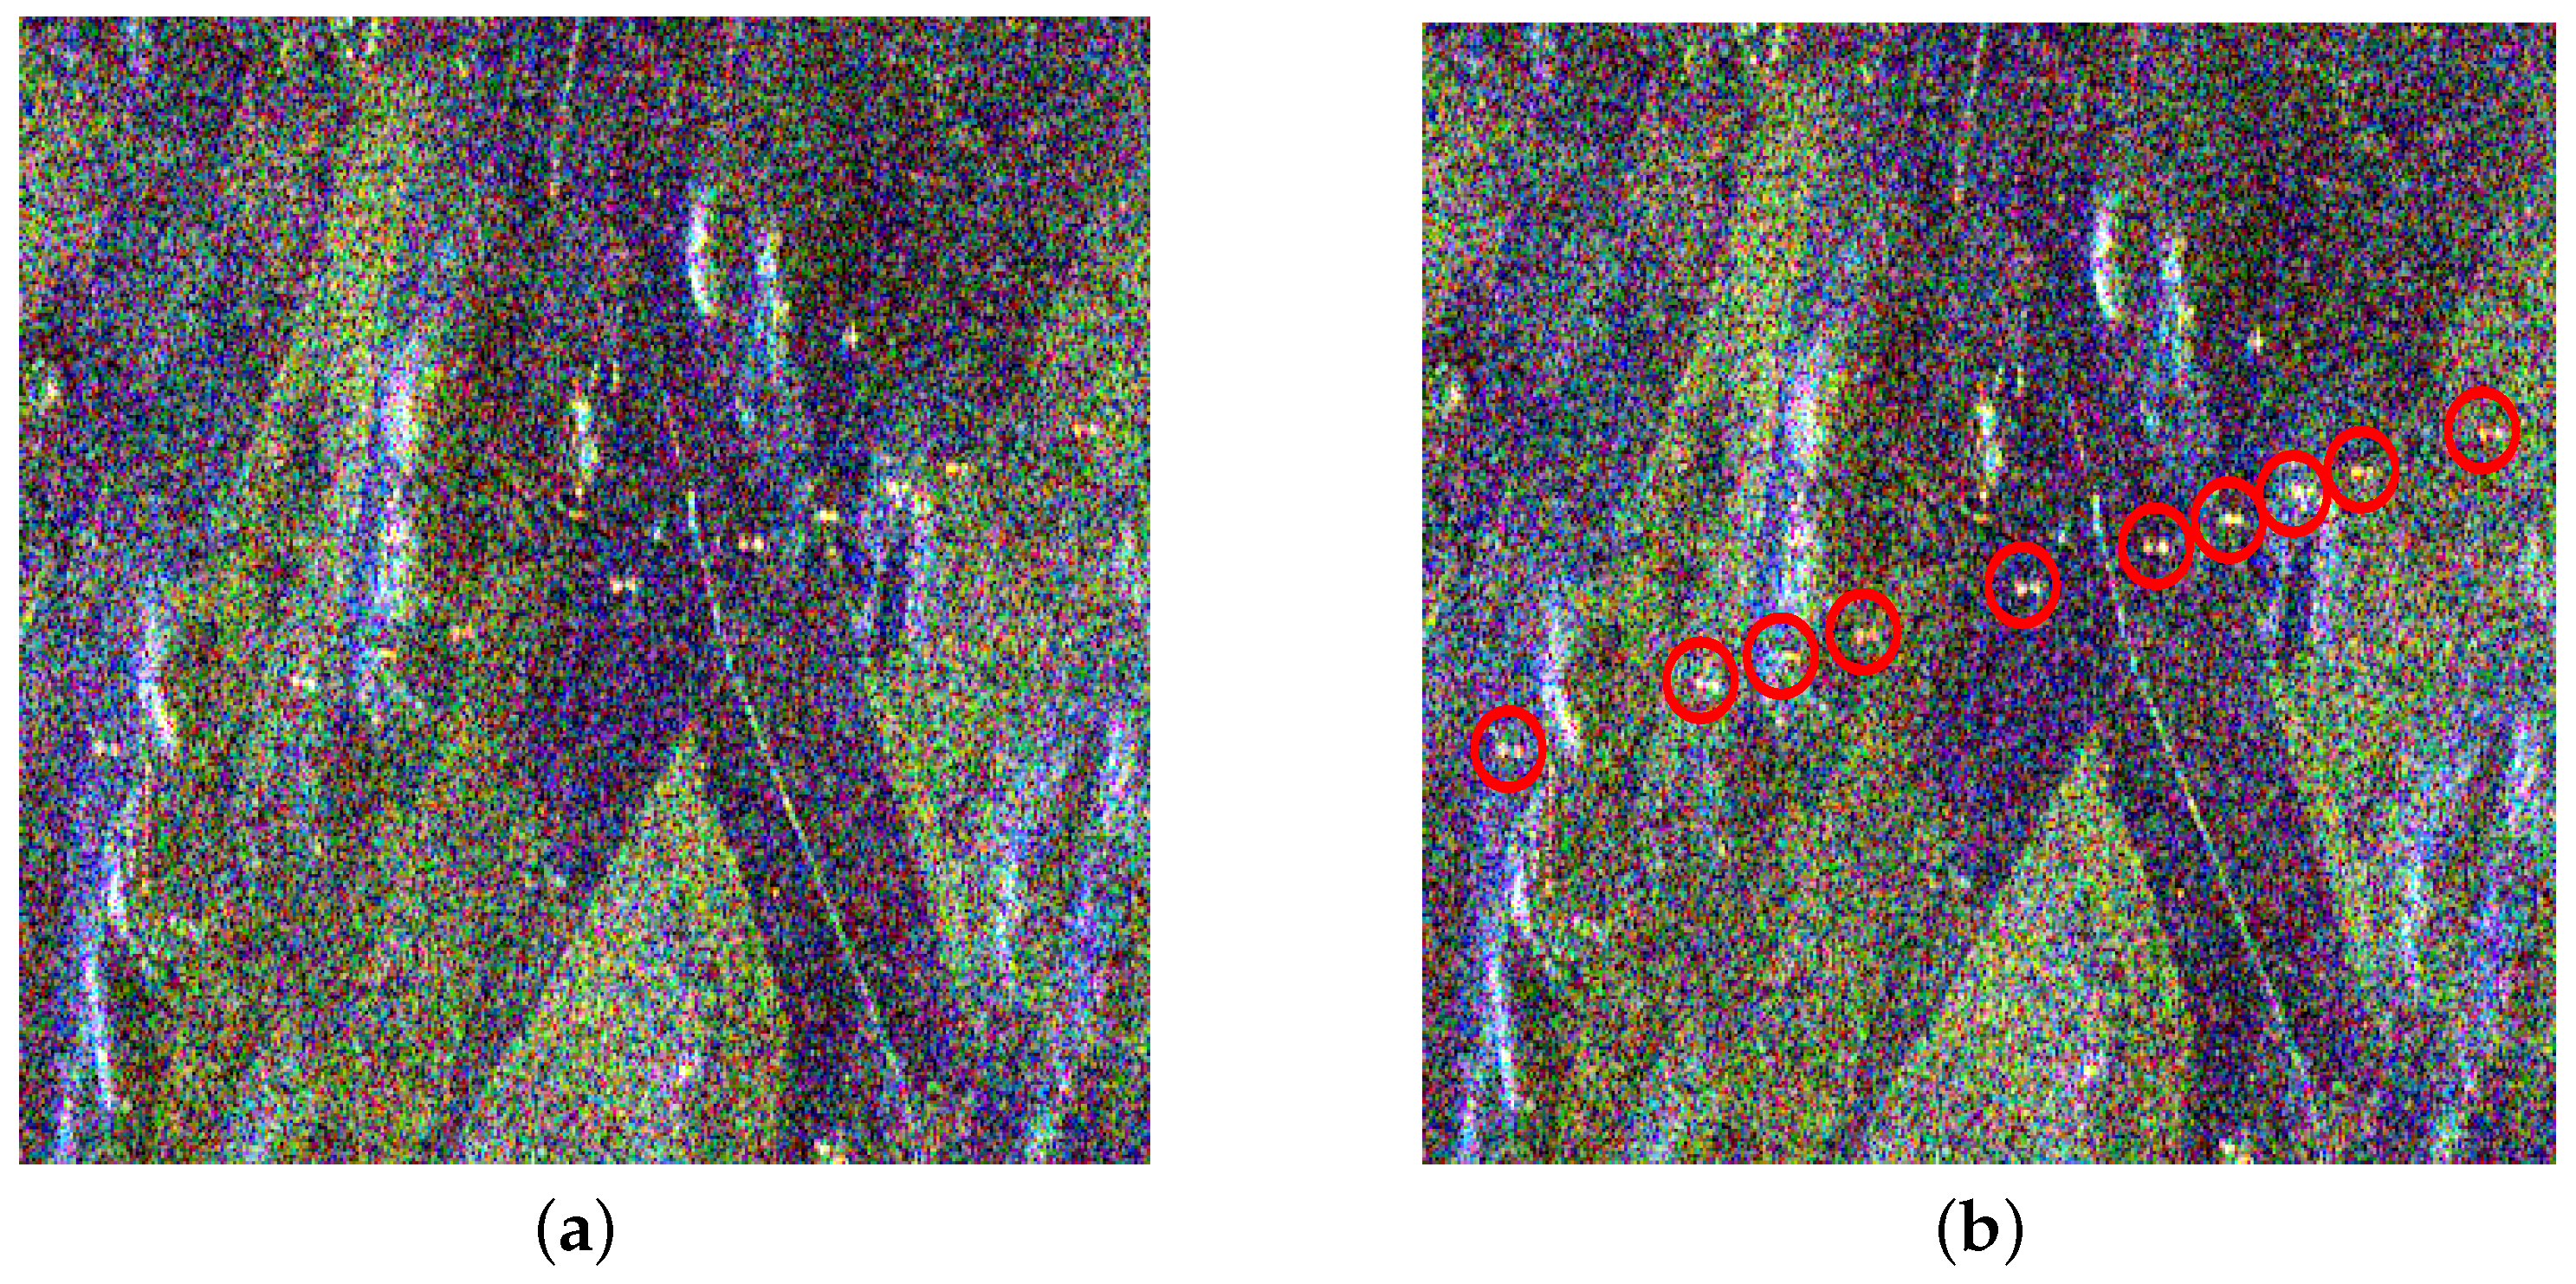
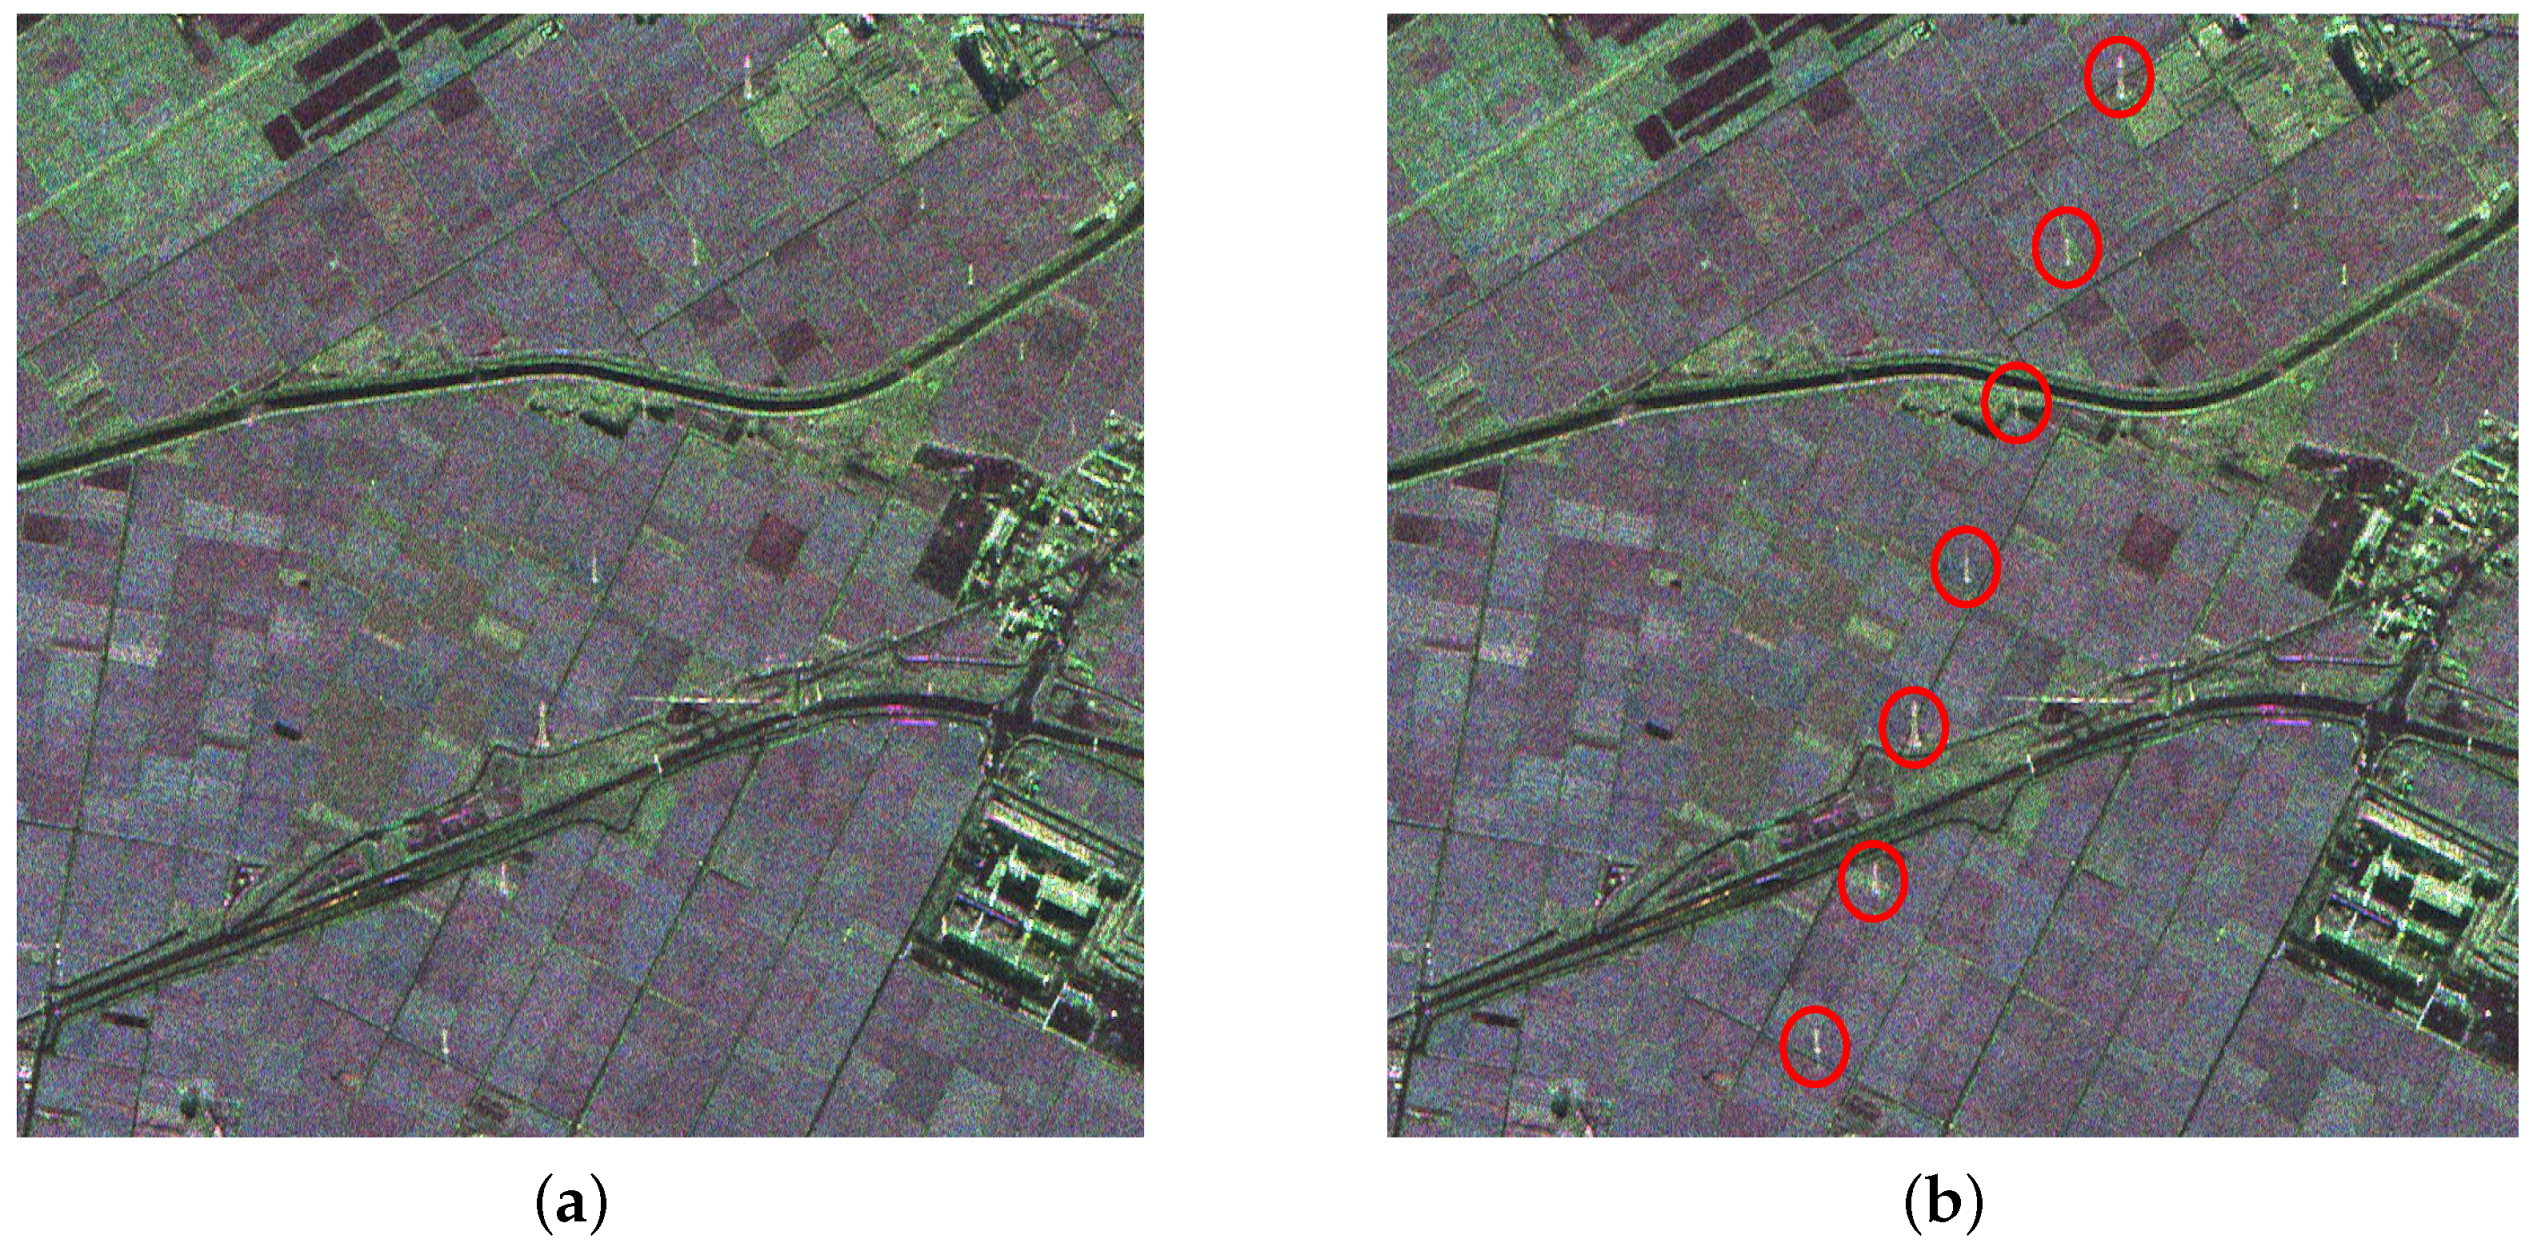
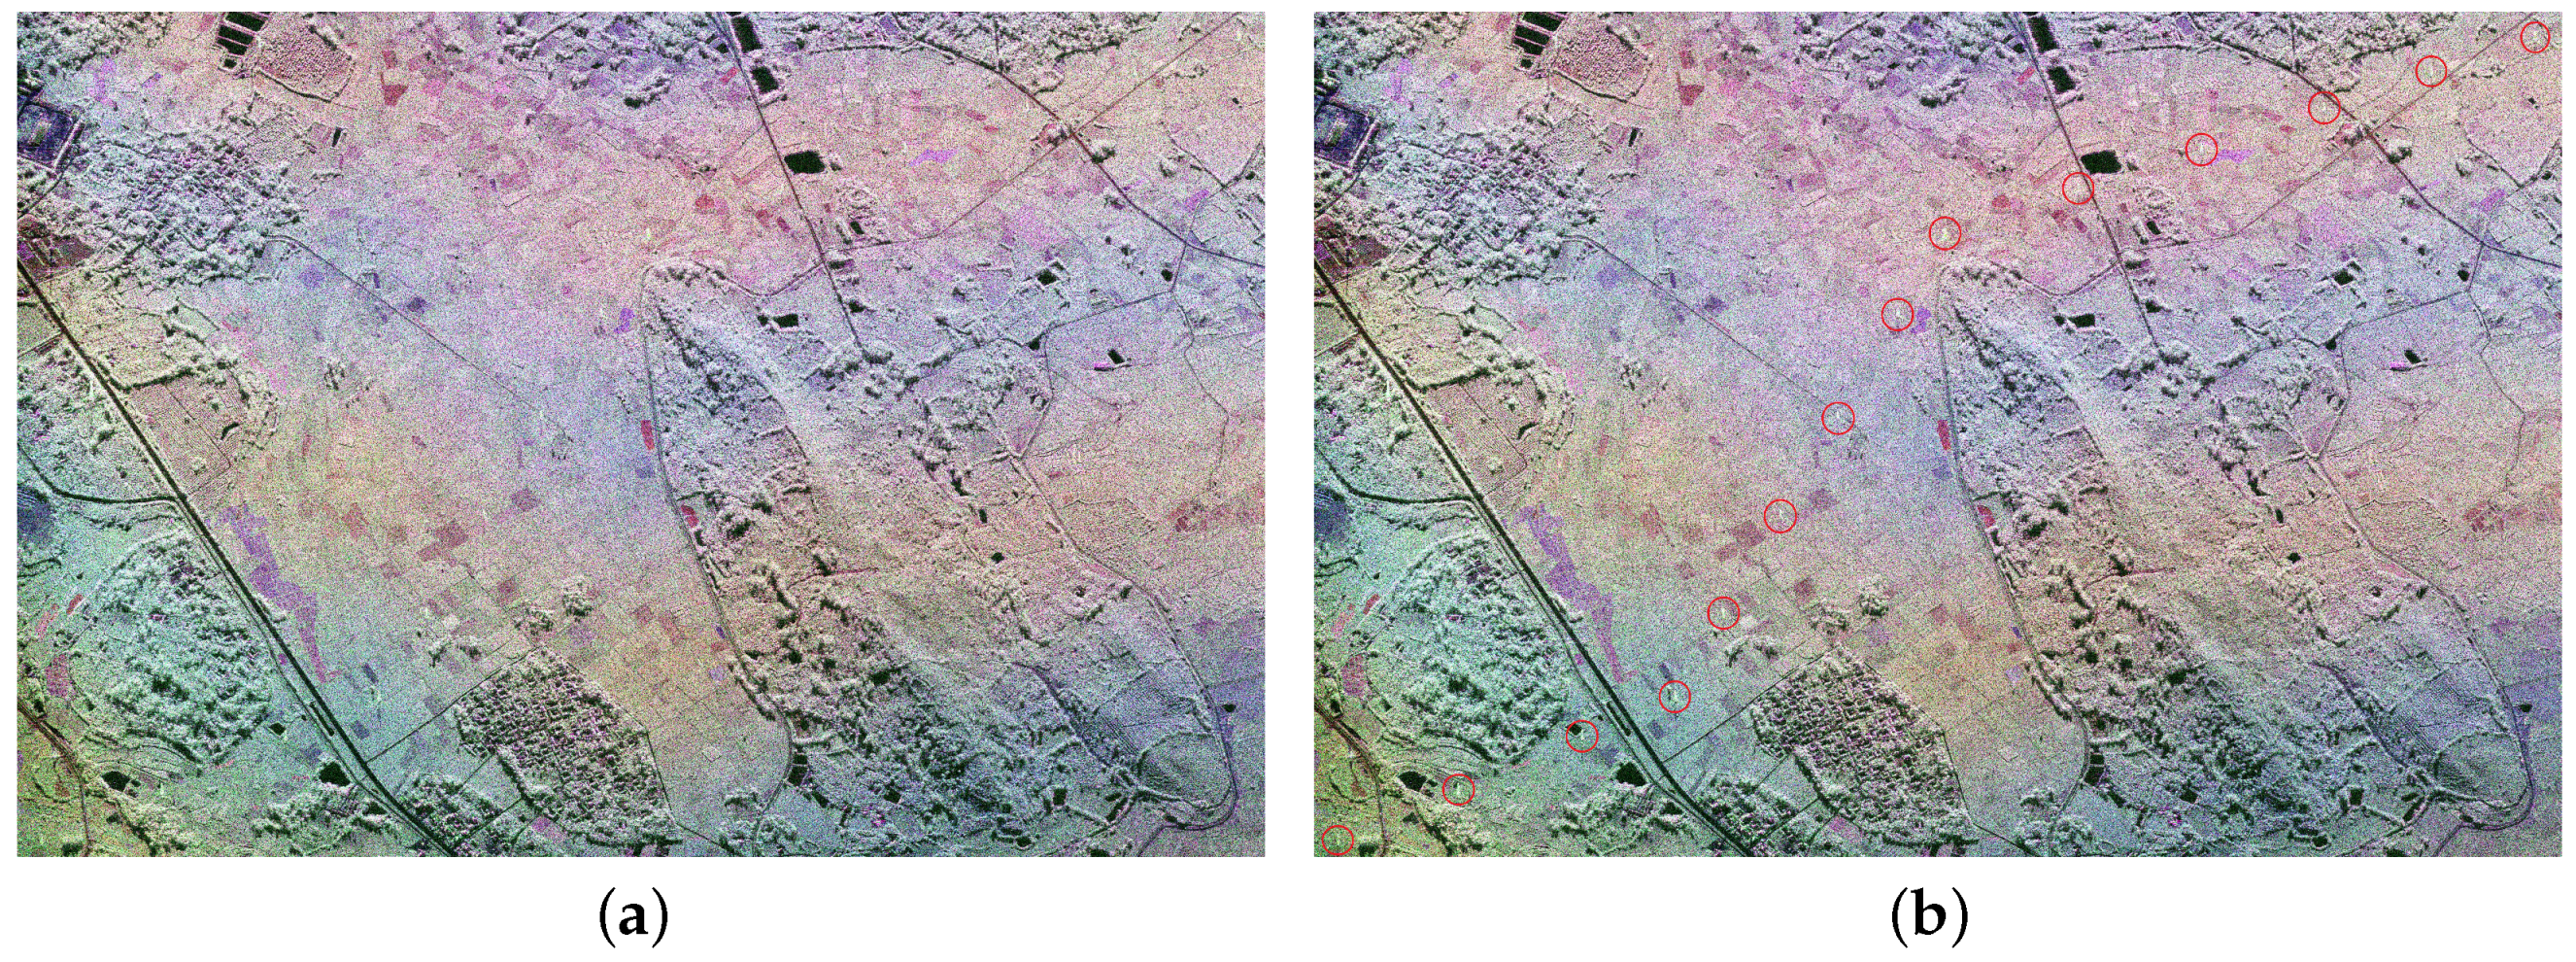
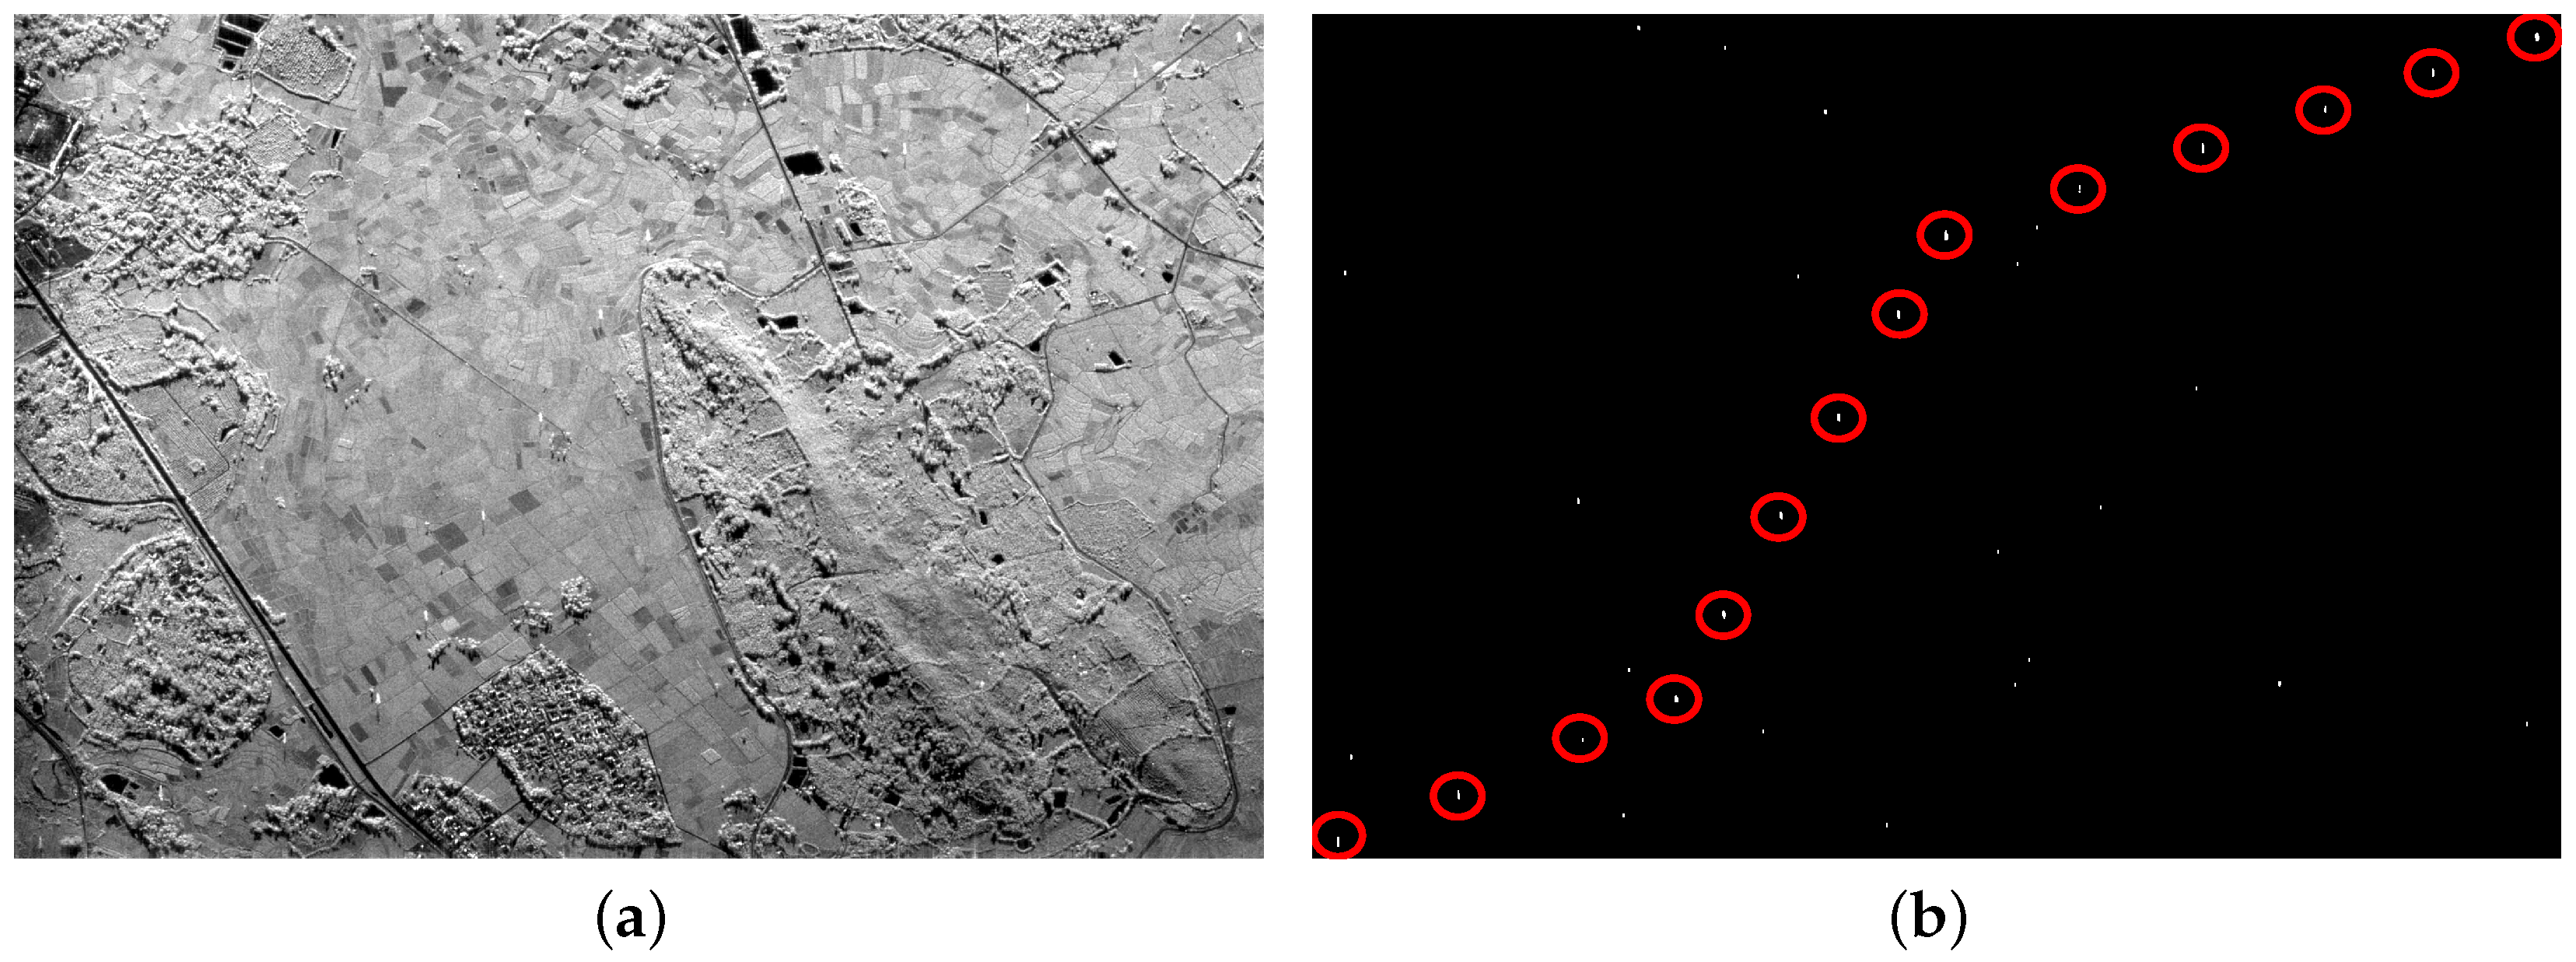
C-land PolSAR images acquired by RADARSAT-2 with 56 mm wavelength and 5.4 GHz frequency over Inner Mongolia, China, as shown in
Figure 7a, are used in this experiment. The original data has 6296 × 2492 pixels and the spatial resolution is 8 m × 8 m. We select a sub-image with 400 × 400 pixels to perform the experiment, in which PTT targets are marked by red circles, as shown in
Figure 7b.
The sub-spectrum number
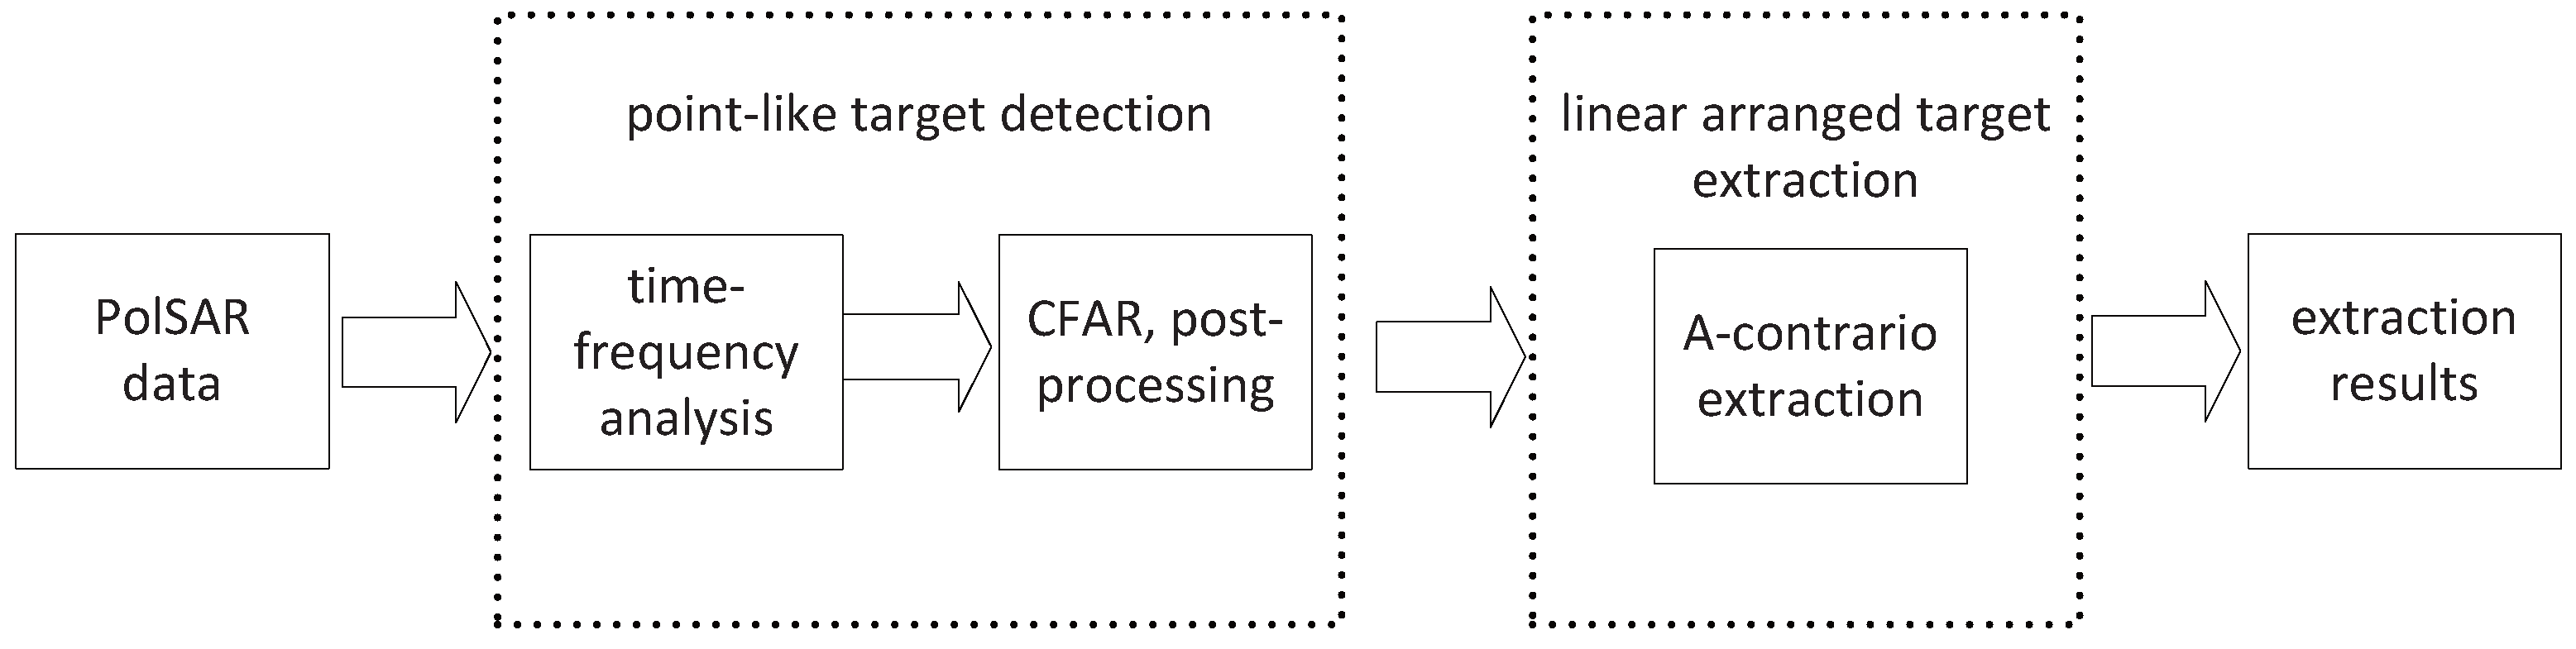
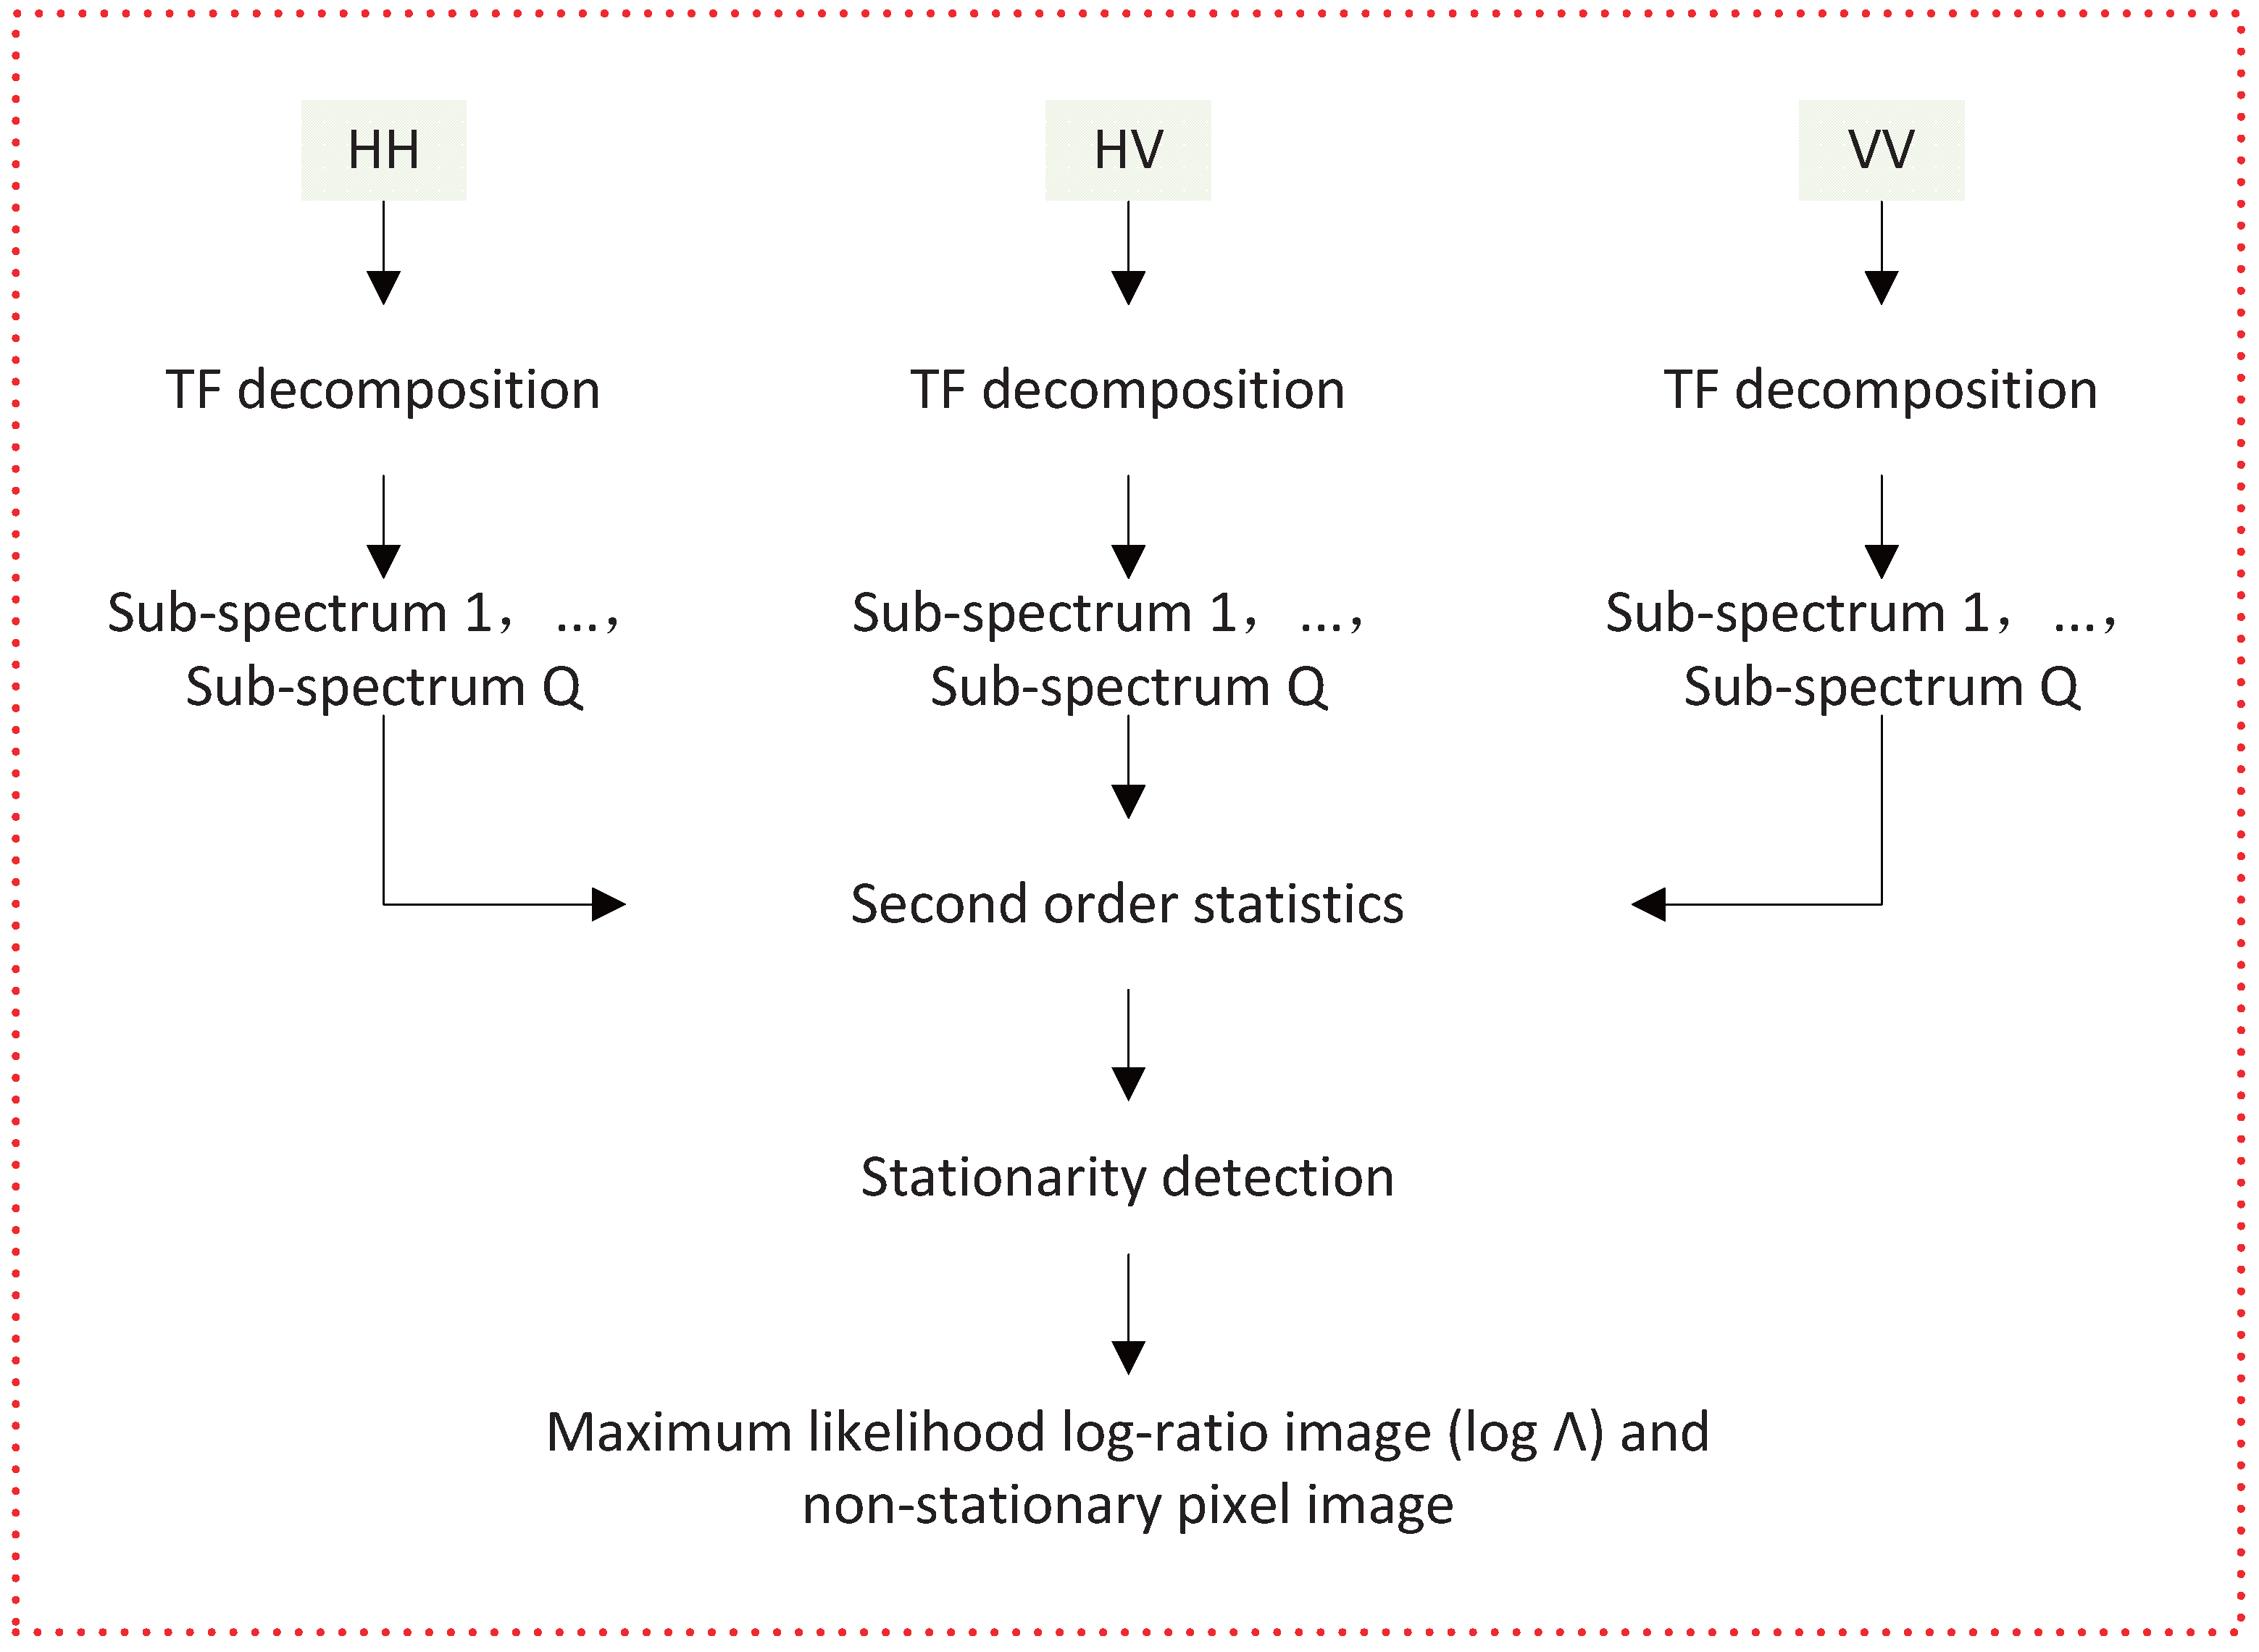
Q of TF decomposition is set as four, and then four sub-images are obtained after TF decomposition. To test the stationarity of each pixel, the maximum likelihood ratio is calculated according to the coherency matrix of sub-images. Then, point-like targets are detected through a CFAR detector. If there are too many candidate targets, not only the extraction speed but also the extraction results will be affected. Thus, a post-processing operator is applied to further reduce the candidate targets. Finally, linear arranged PTT targets are extracted using a-contrario method. The detailed parameter setting is shown in
Table 1.
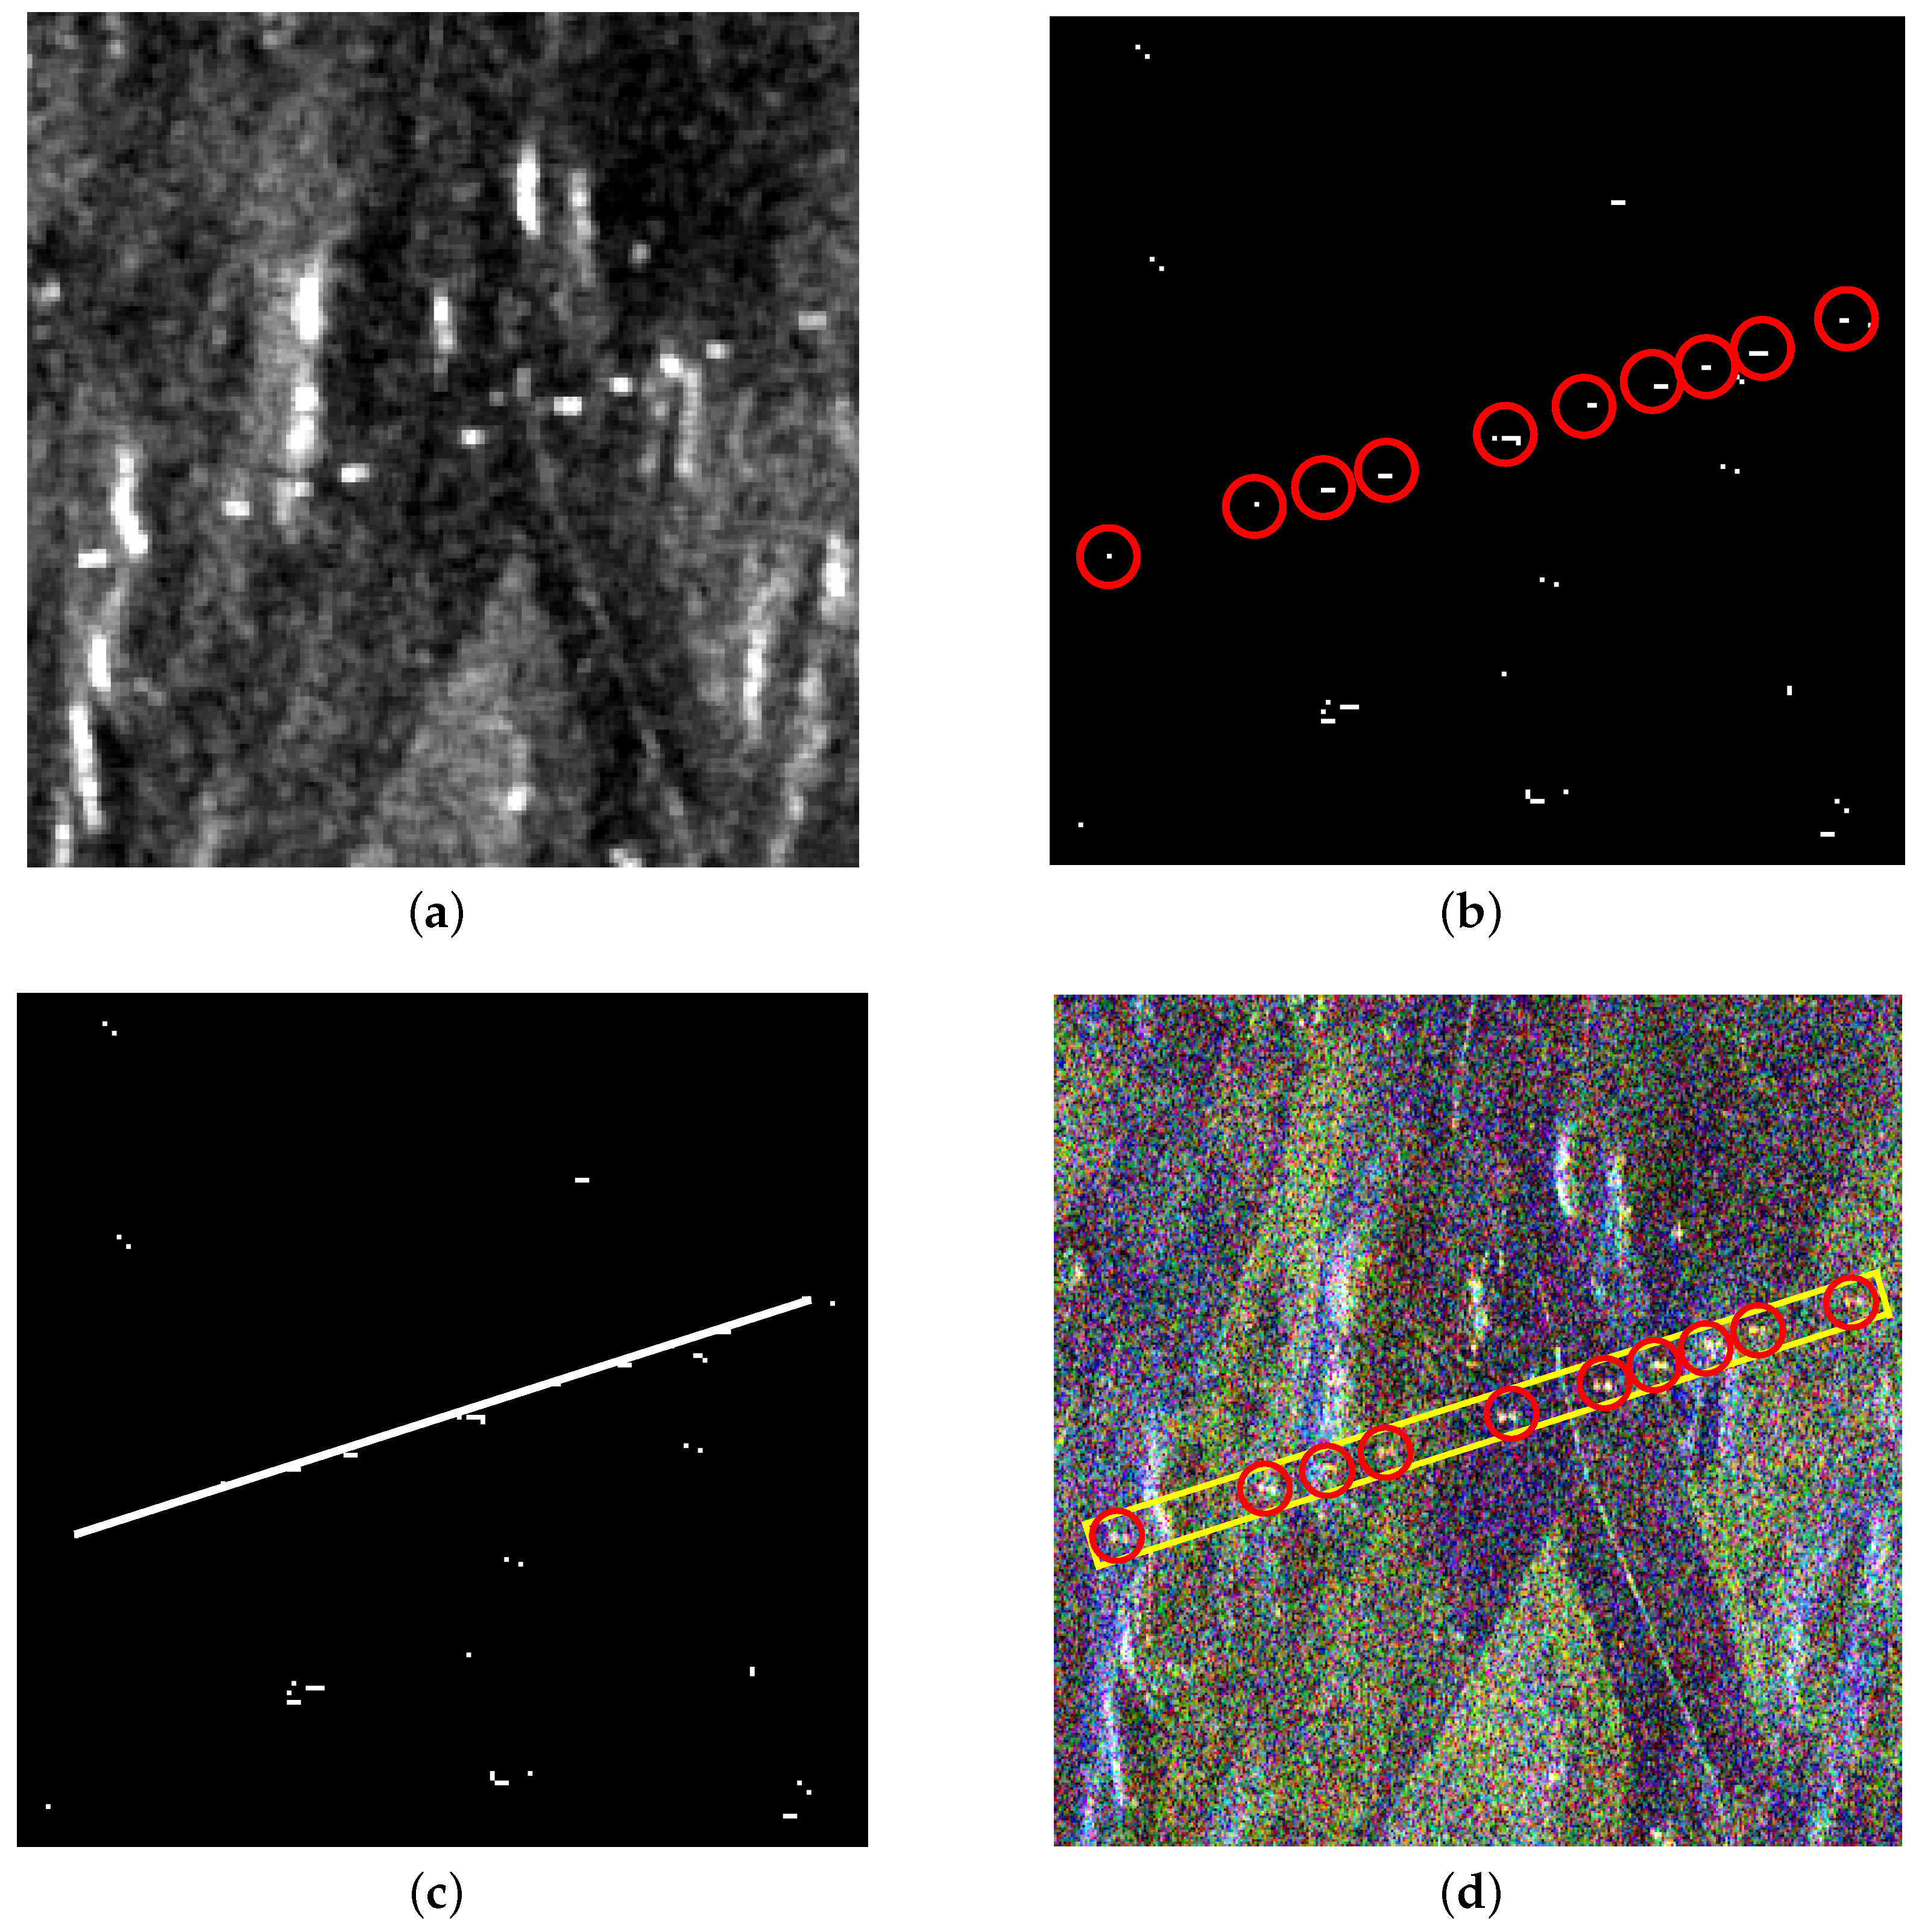
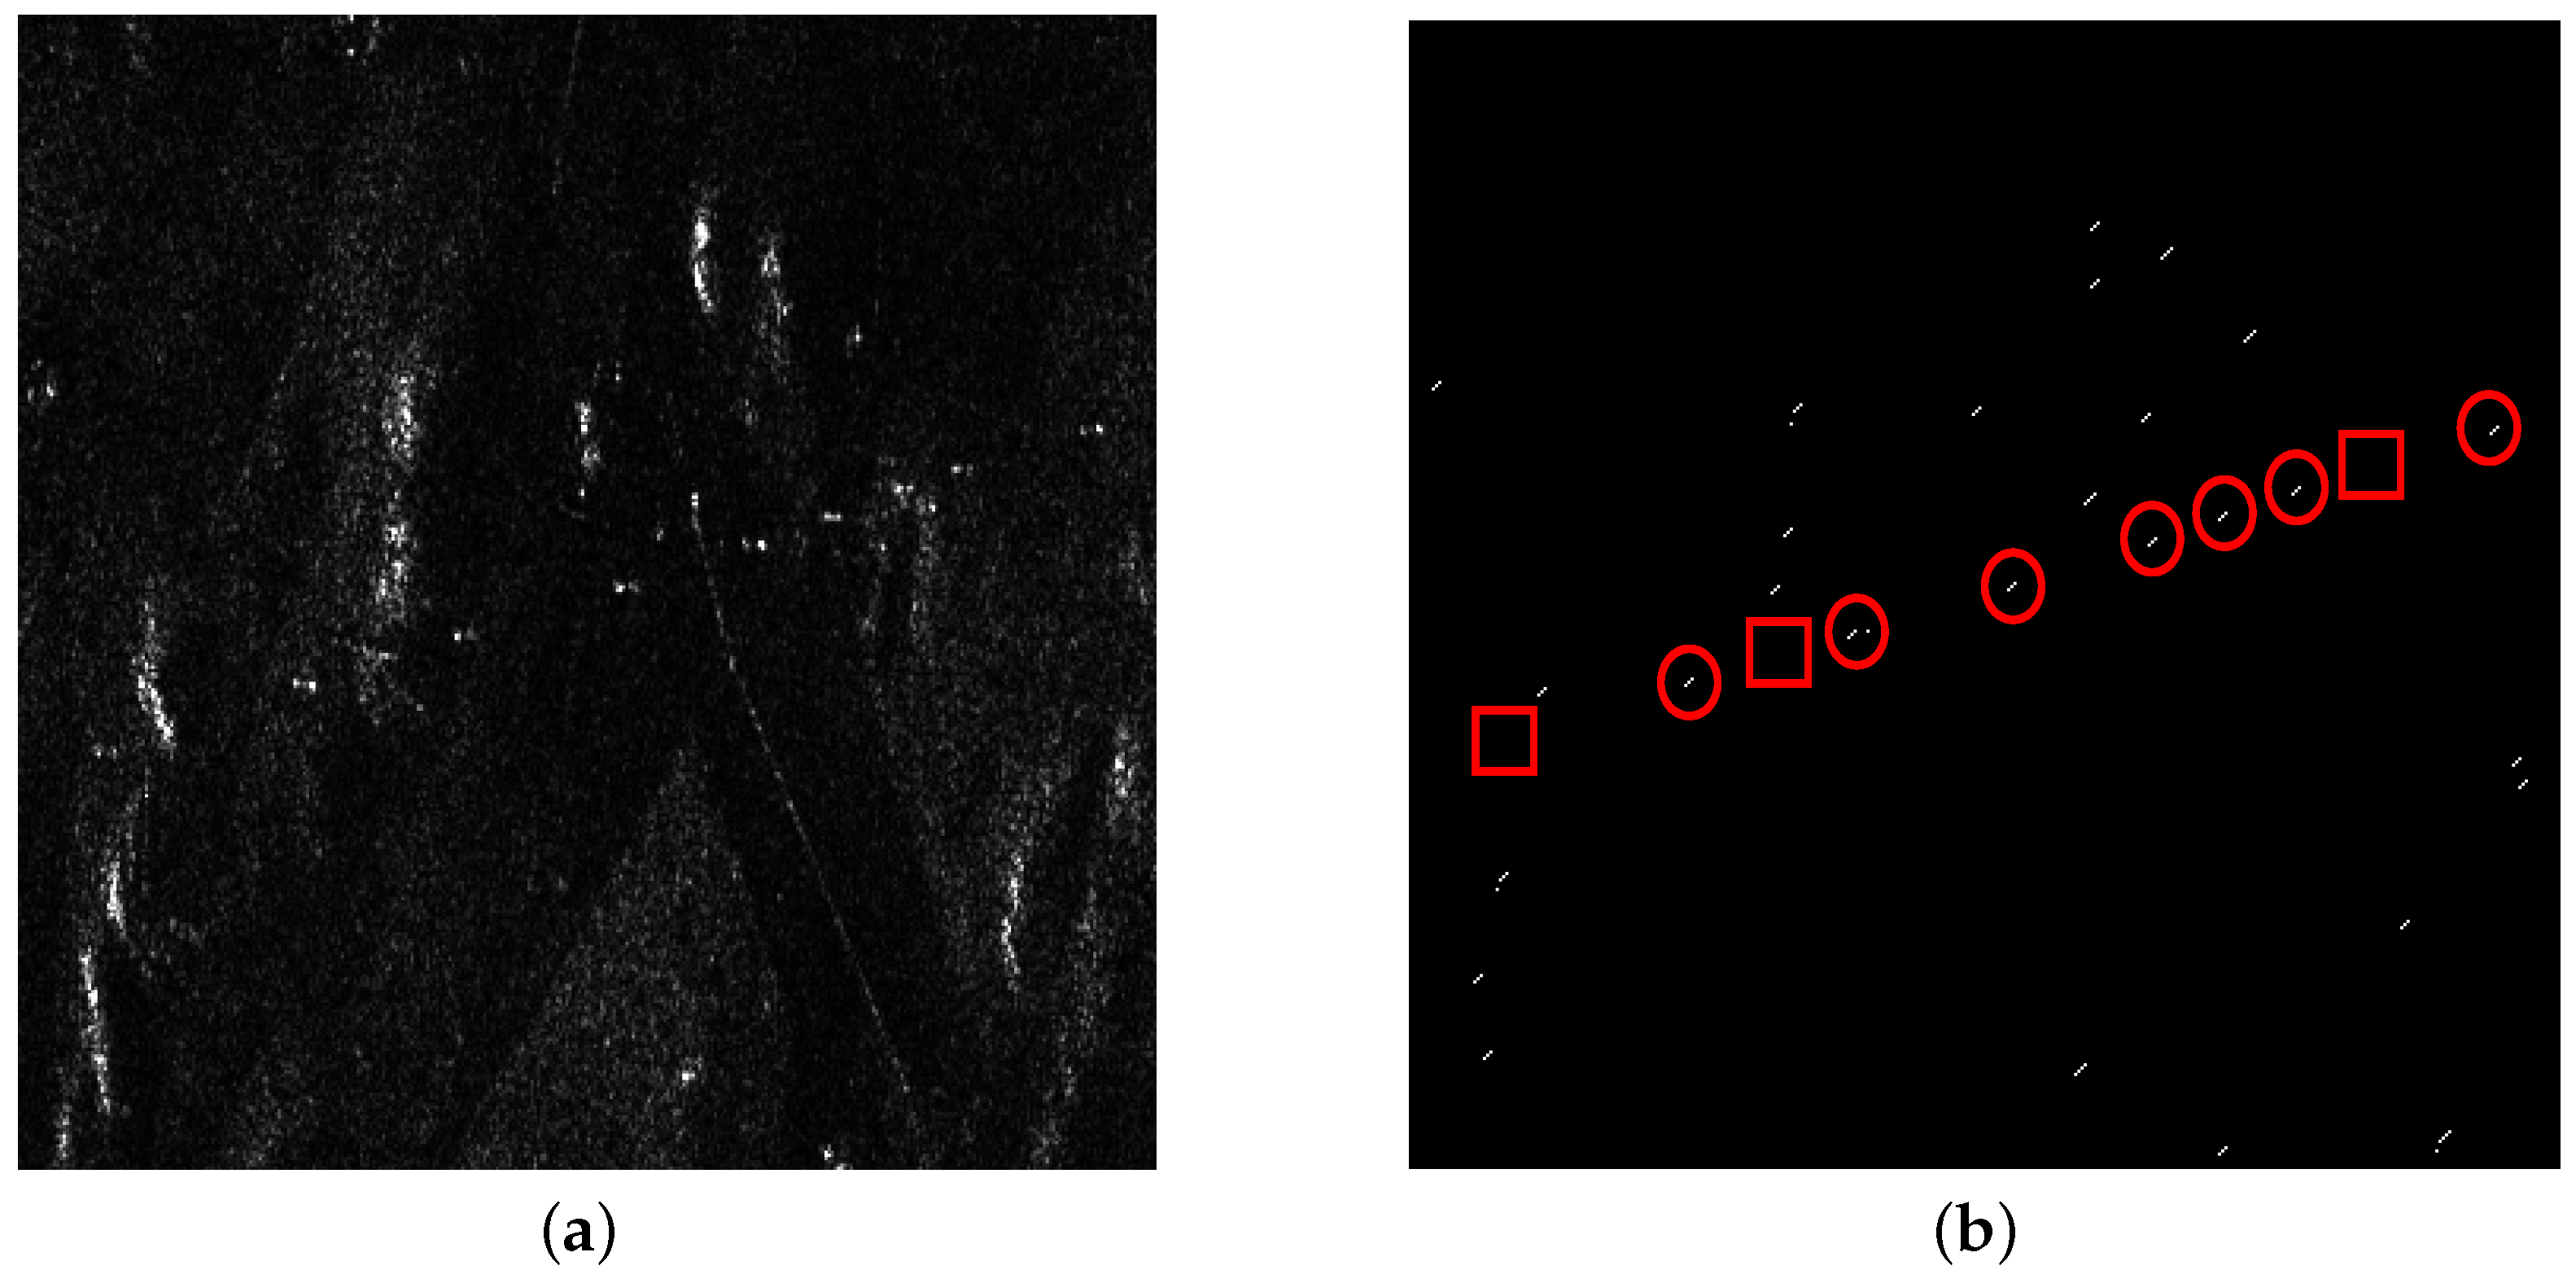
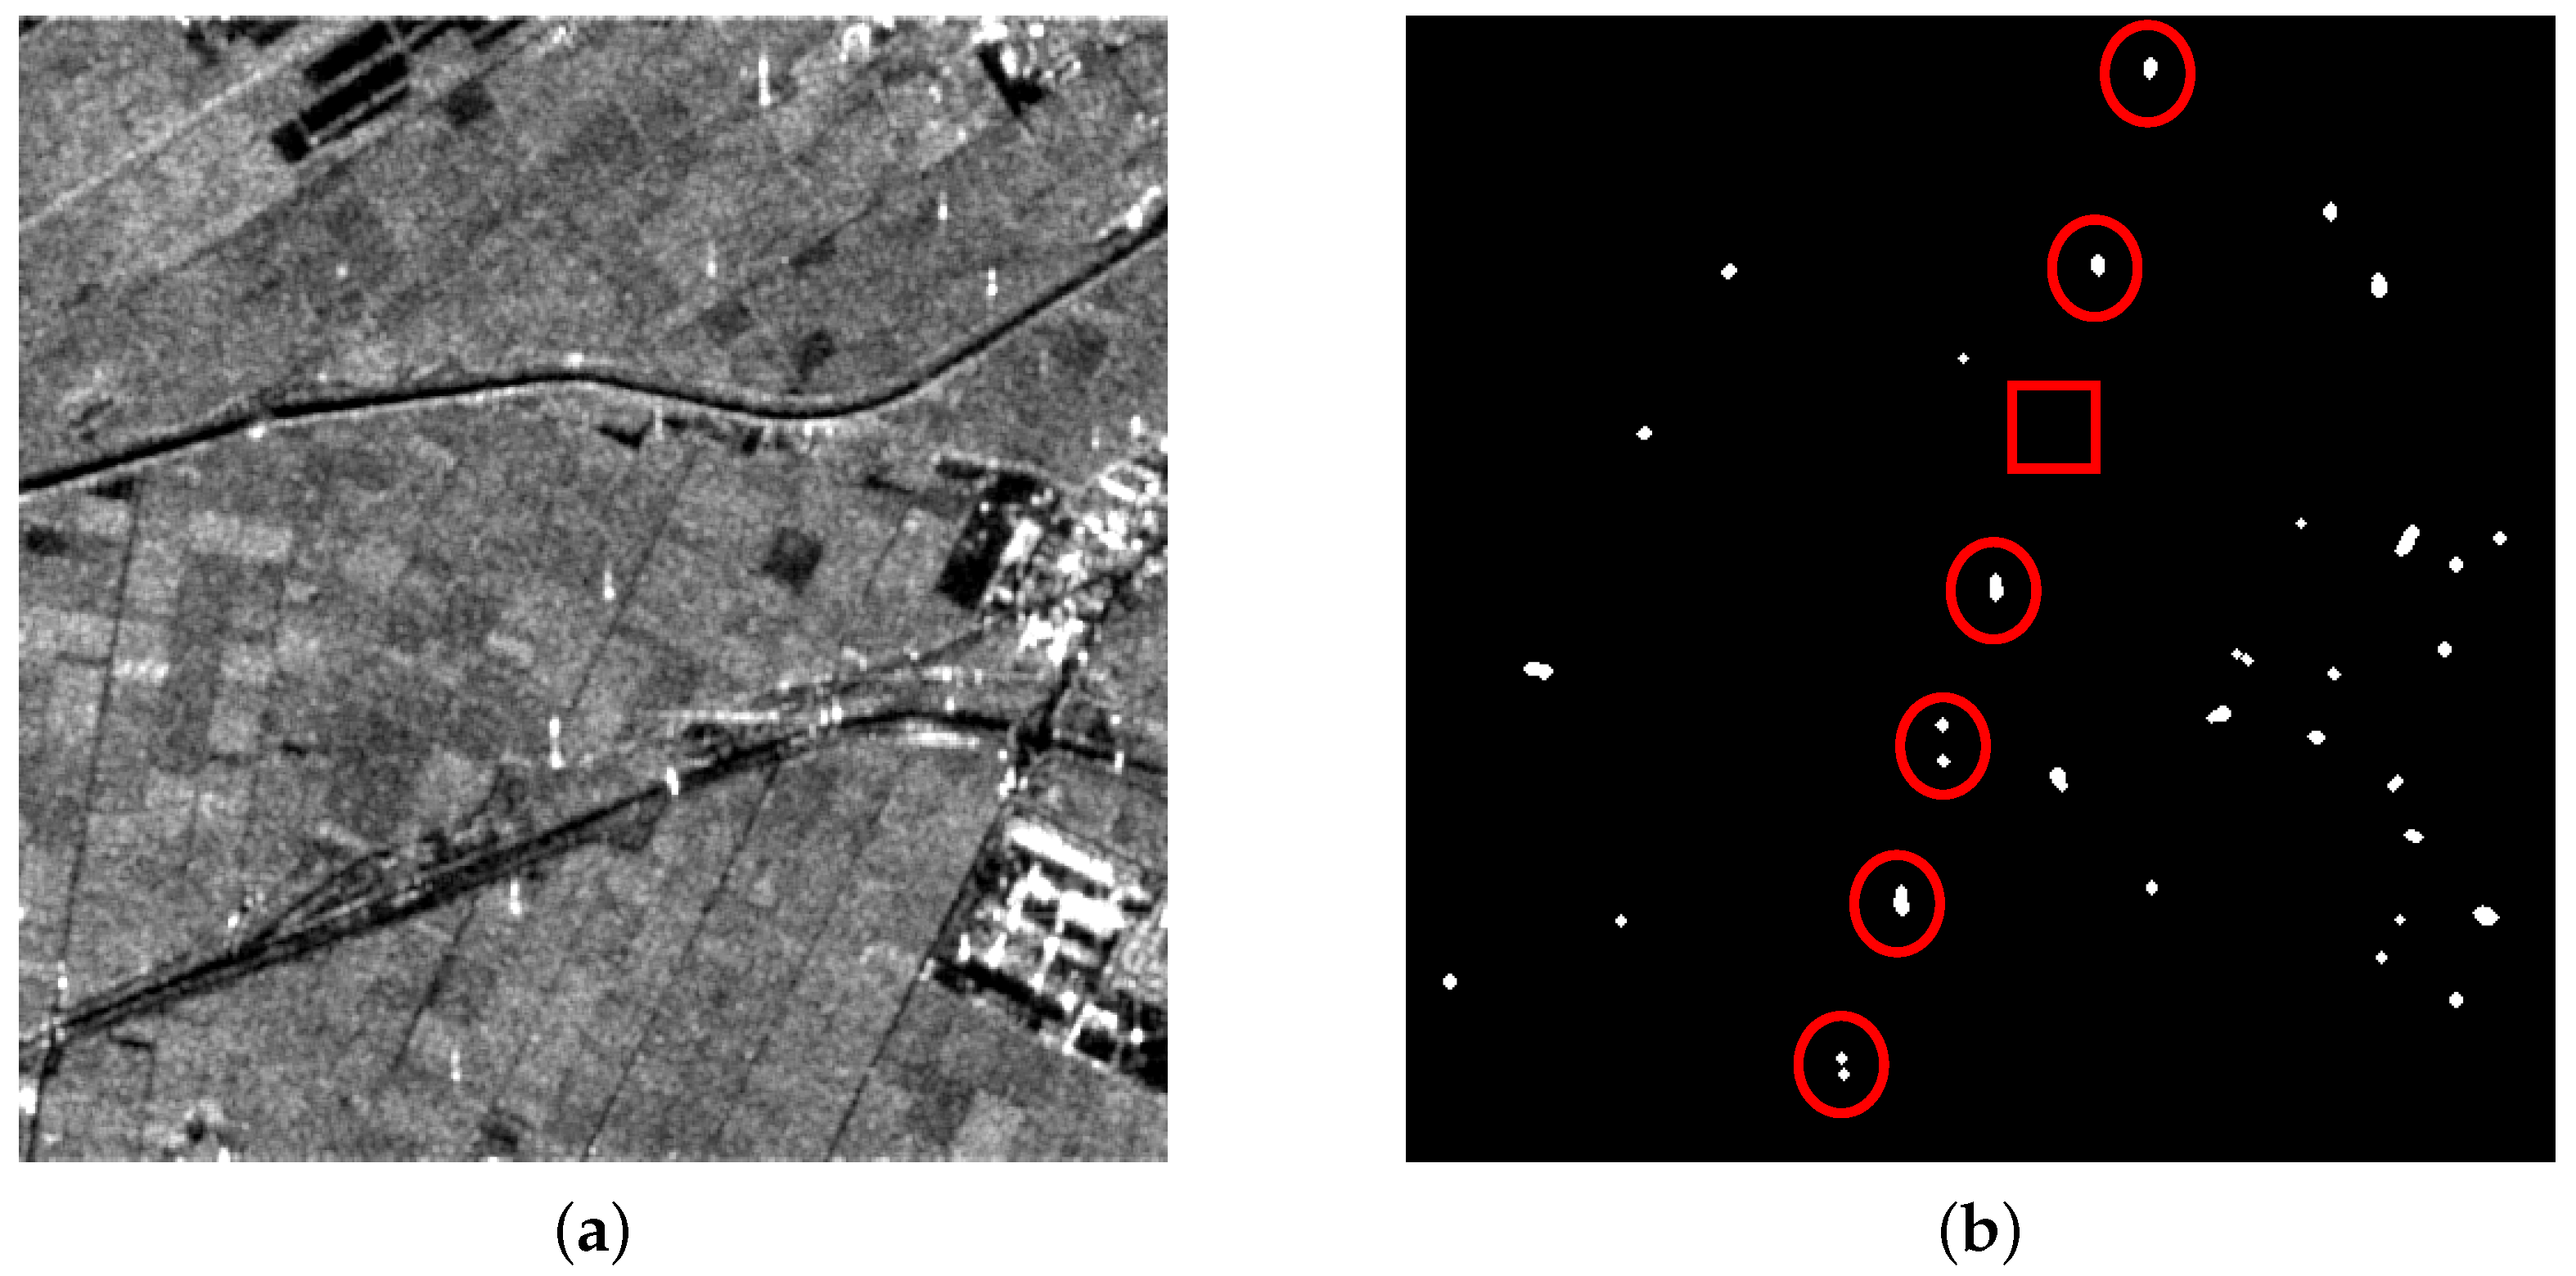
From
Figure 8a and
Figure 9a, it can be seen that there are also some highlighted areas besides PTT targets, which are mostly ridges. Here, candidate targets are made up of PTT targets, ridges and other highlighted areas. Affected by noise and ground scenes, detection after PWF loses three PTT targets, as shown in
Figure 8b, marked by red rectangles. Replacing the PWF with TF analysis, all PTT targets are detected, as shown in
Figure 9b.
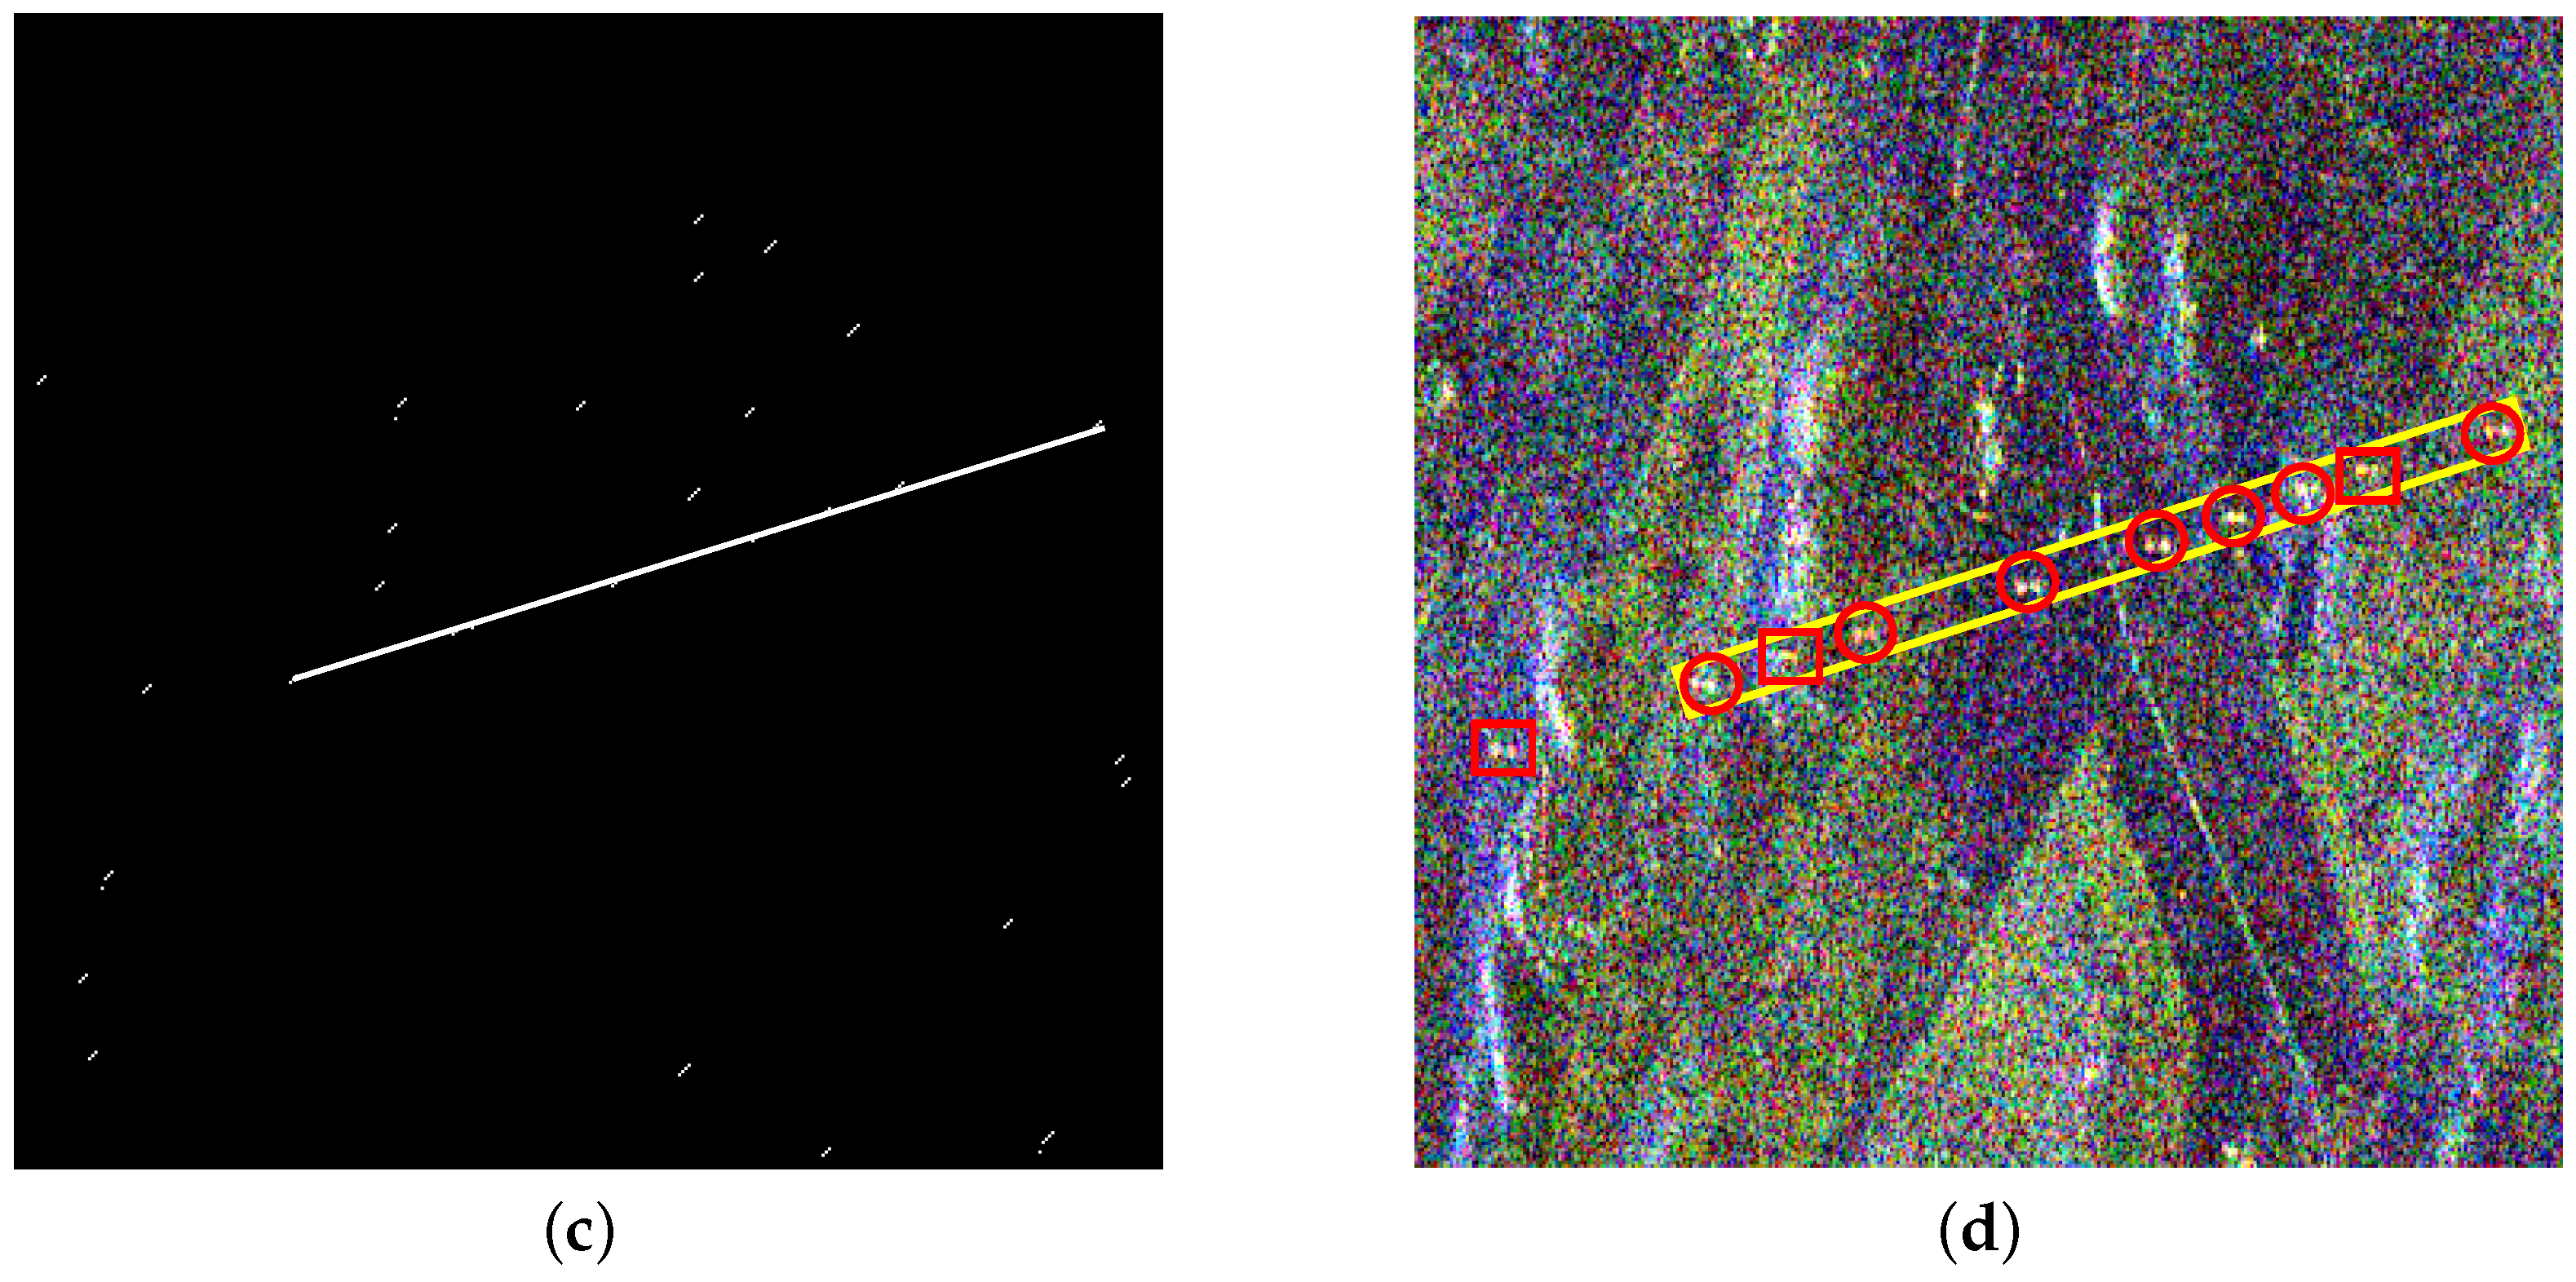
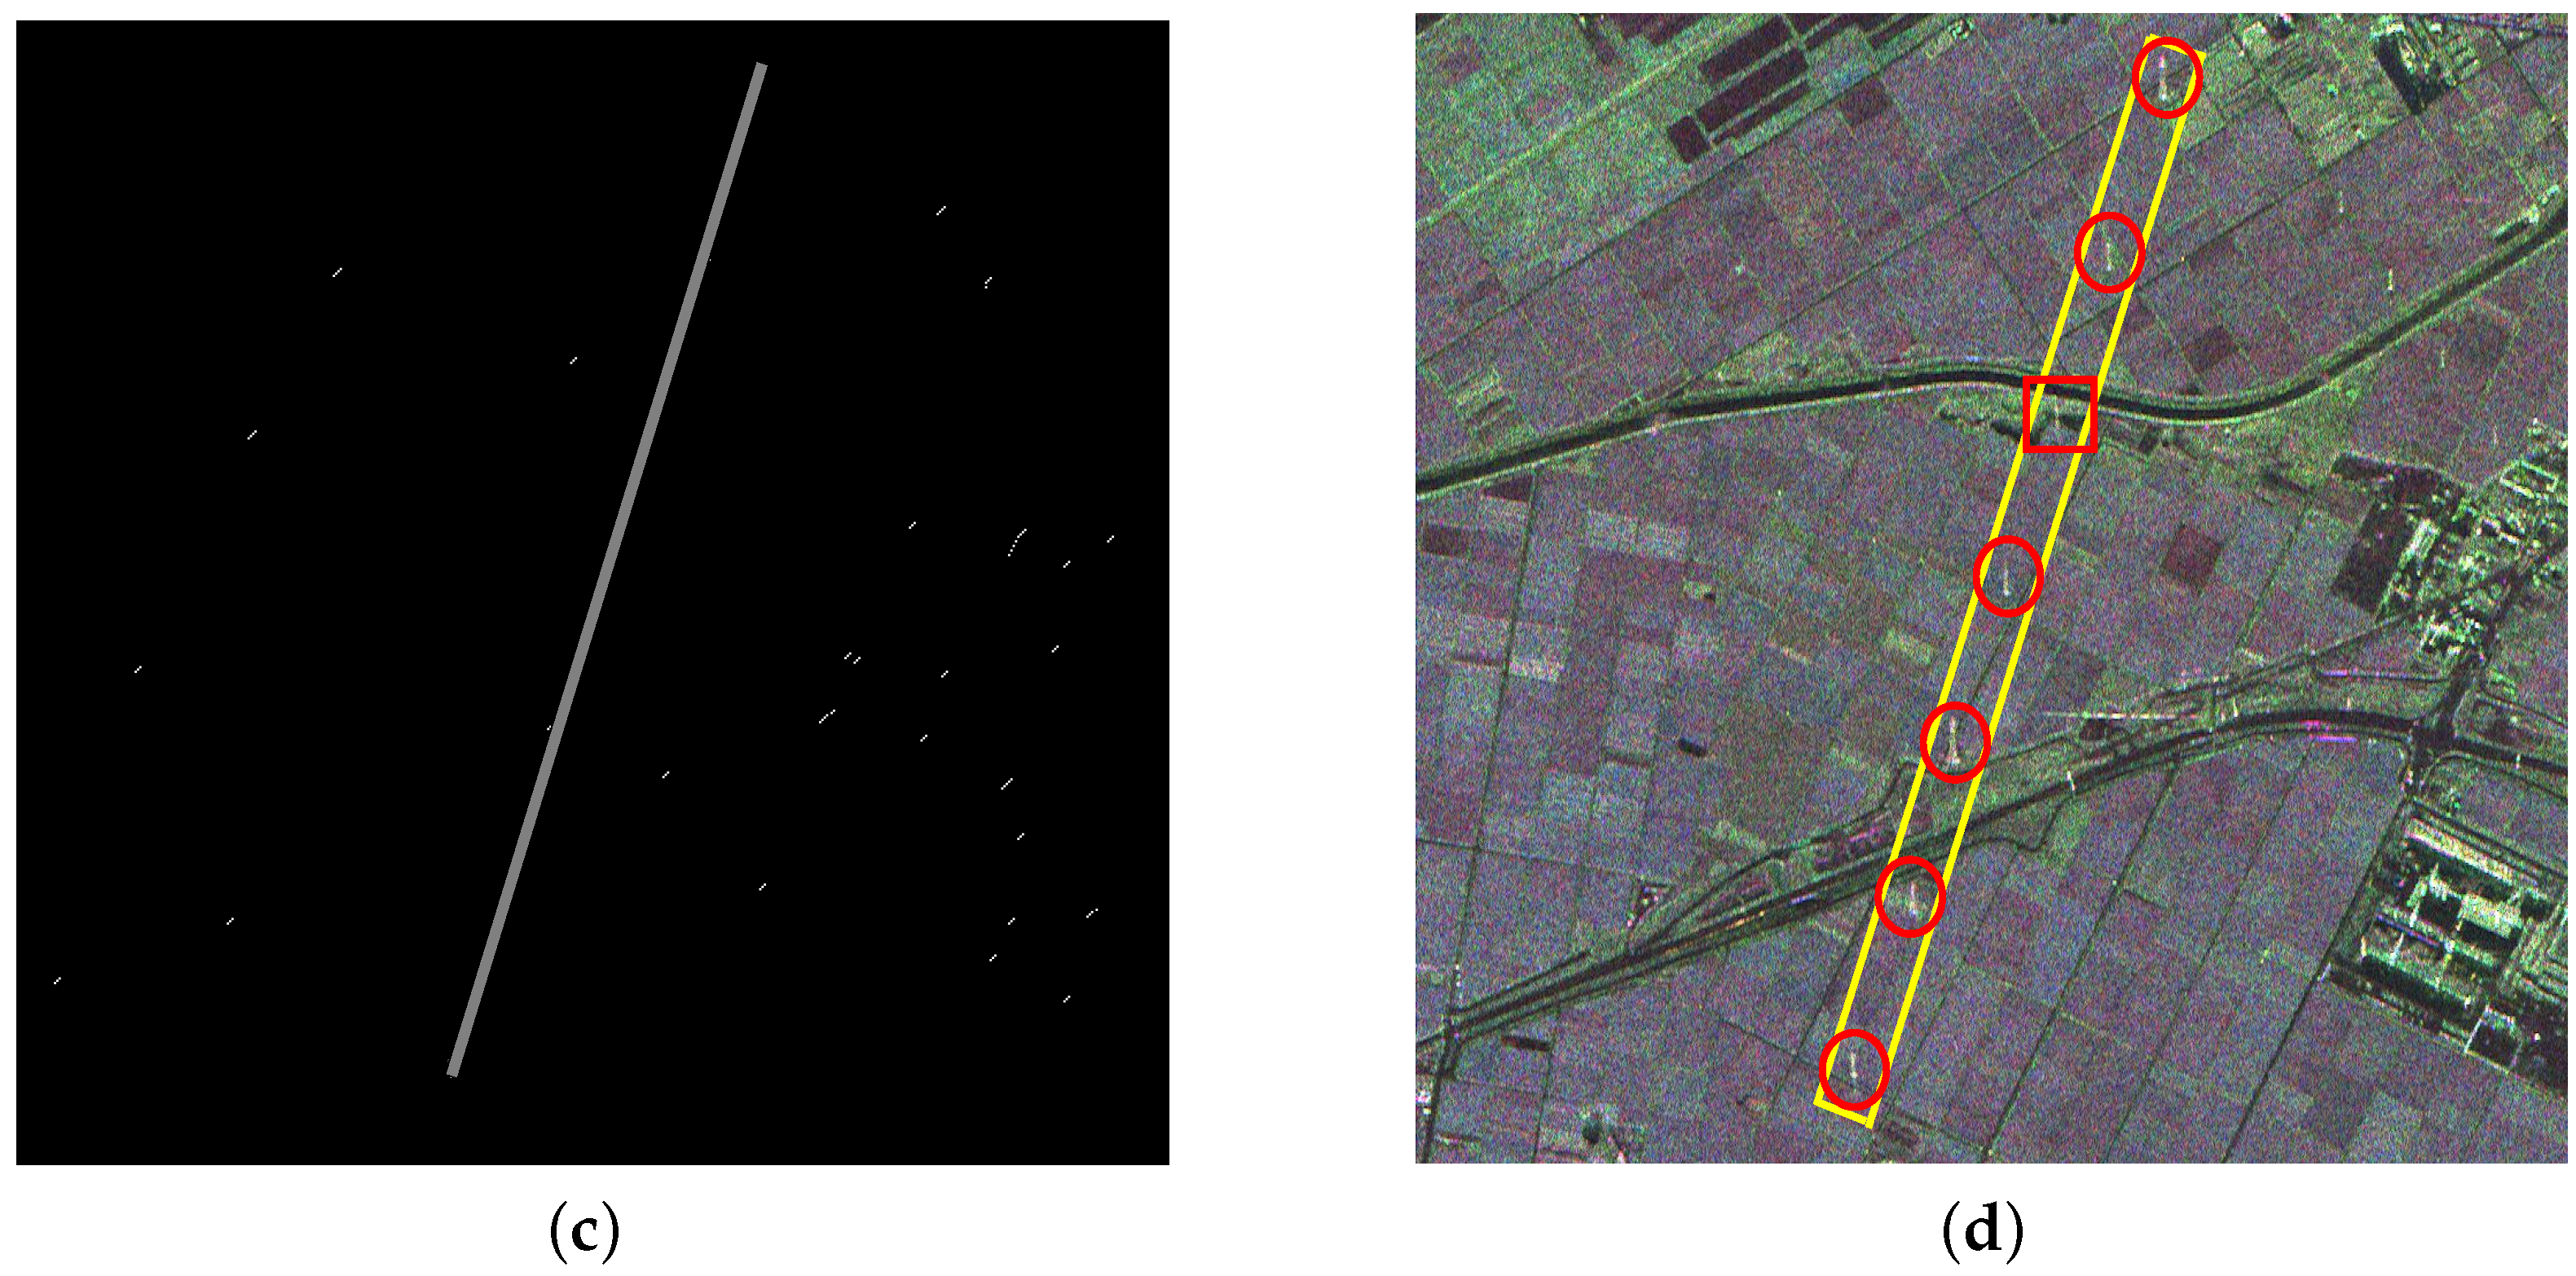
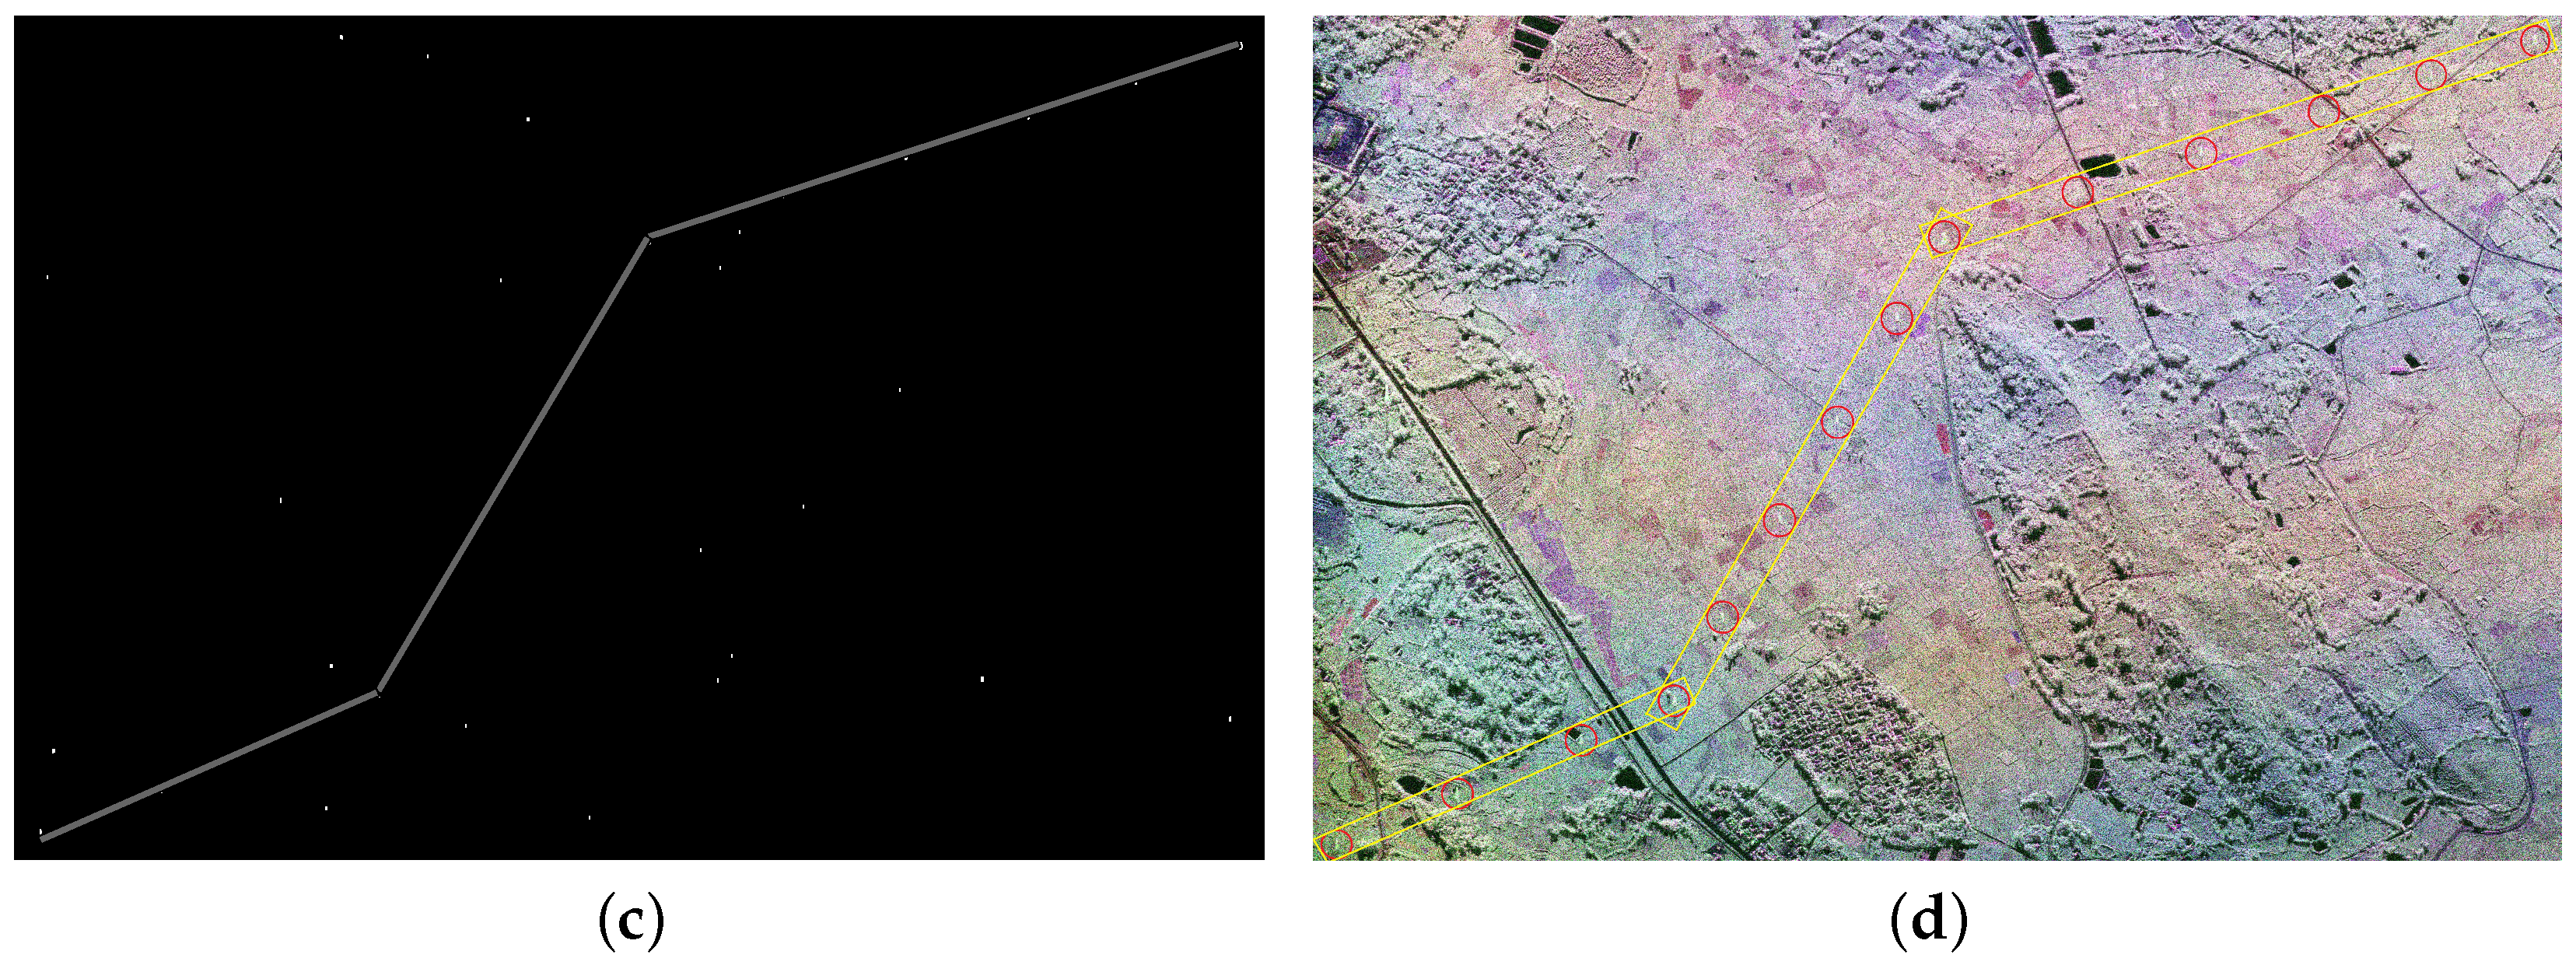
Table 2 shows that the TF analysis involved method has a higher detection rate of PTT targets than the PWF involved method. Through a-contrario extraction, linear arranged PTT targets are successfully extracted by both methods, as shown in
Figure 8c and
Figure 9c. However, linear arranged PTT targets extracted by method one are incomplete owing to a loss of PTT targets in point-like targets detection, while method two shows a better result, as shown in
Figure 8d and
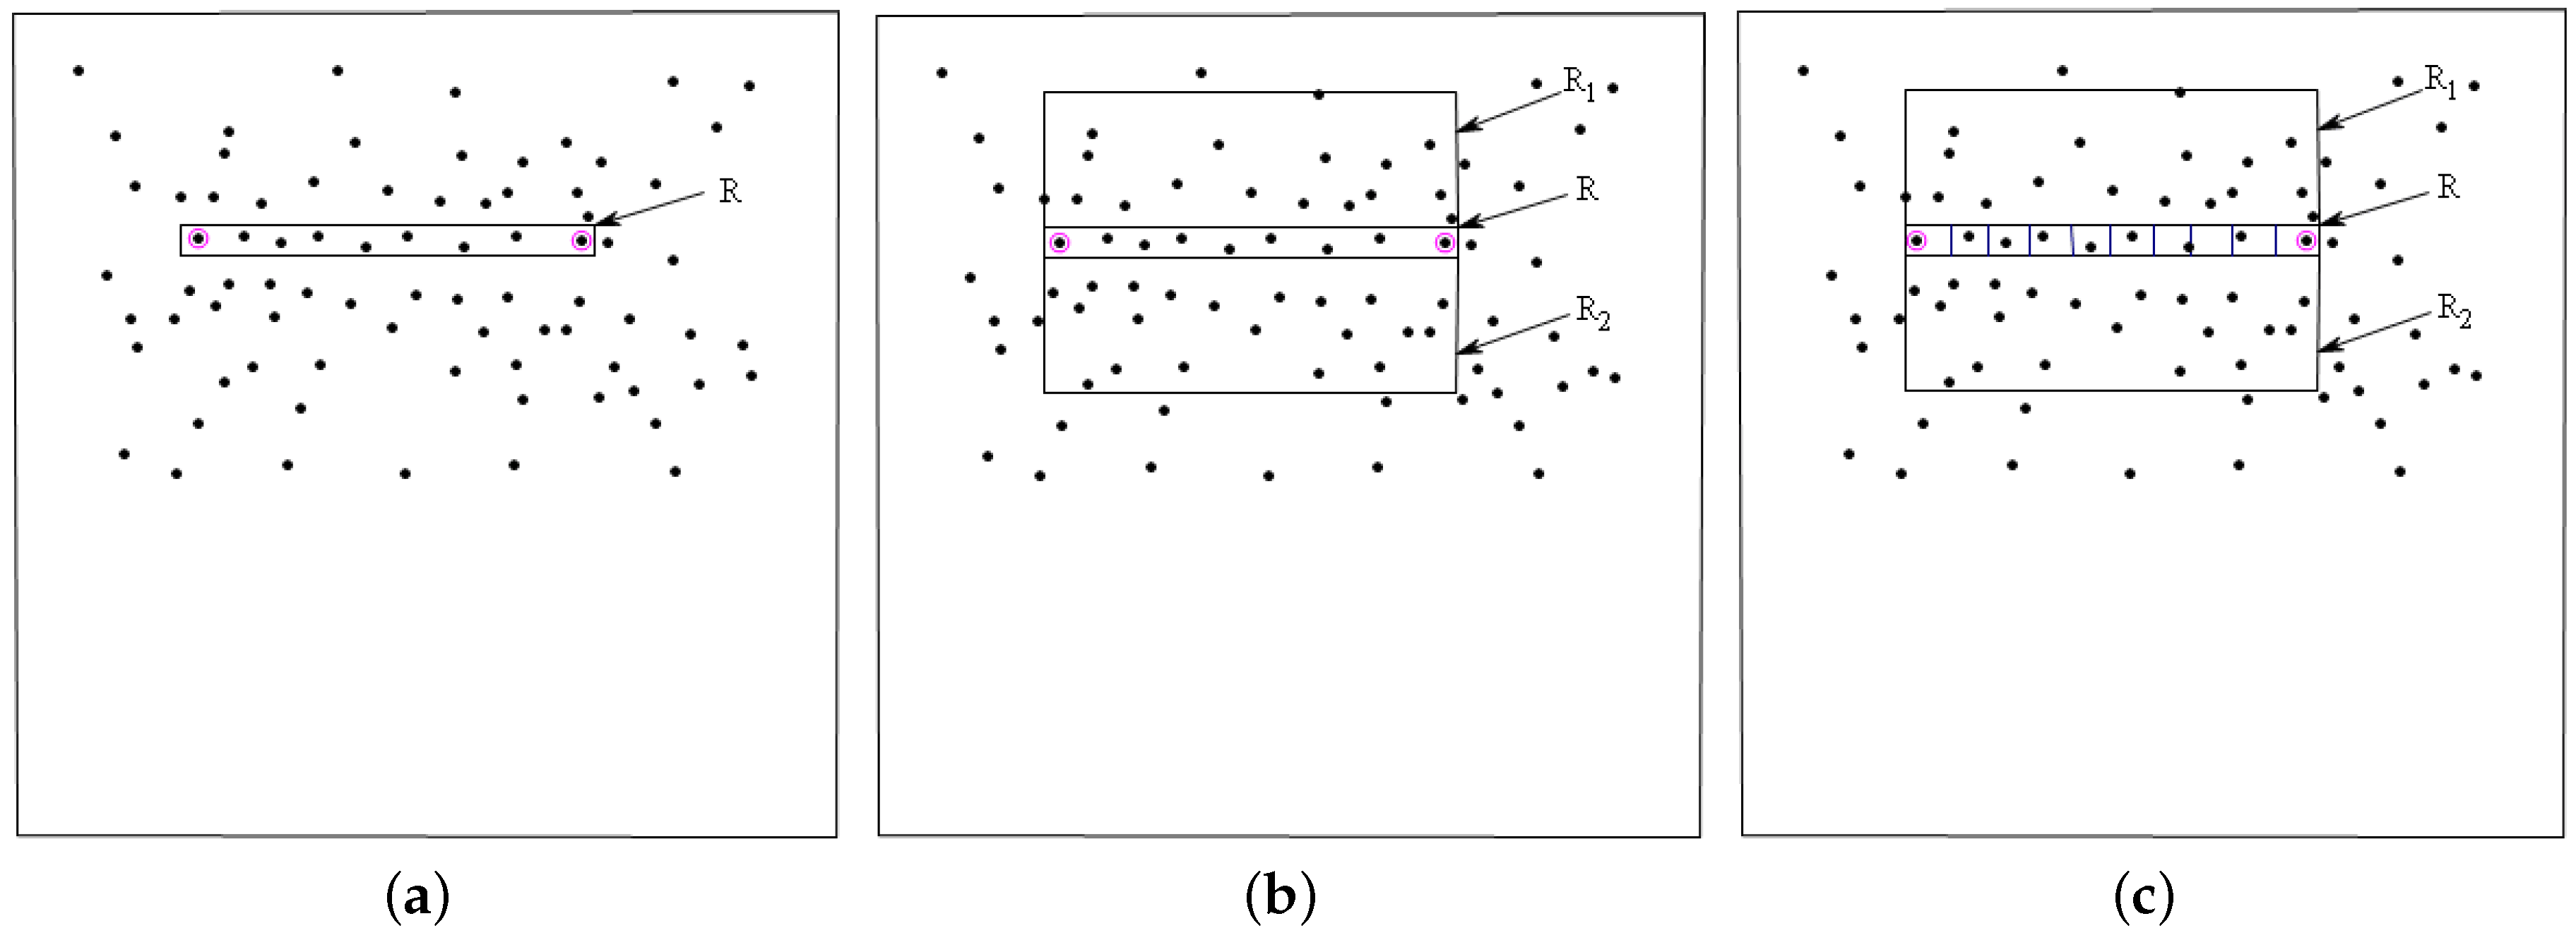
Figure 9d. Detected PTT targets, lost PTT targets and
R in geometric structure
E are marked by red circles, red rectangles and yellow rectangles, respectively.
4.2. Experiment II
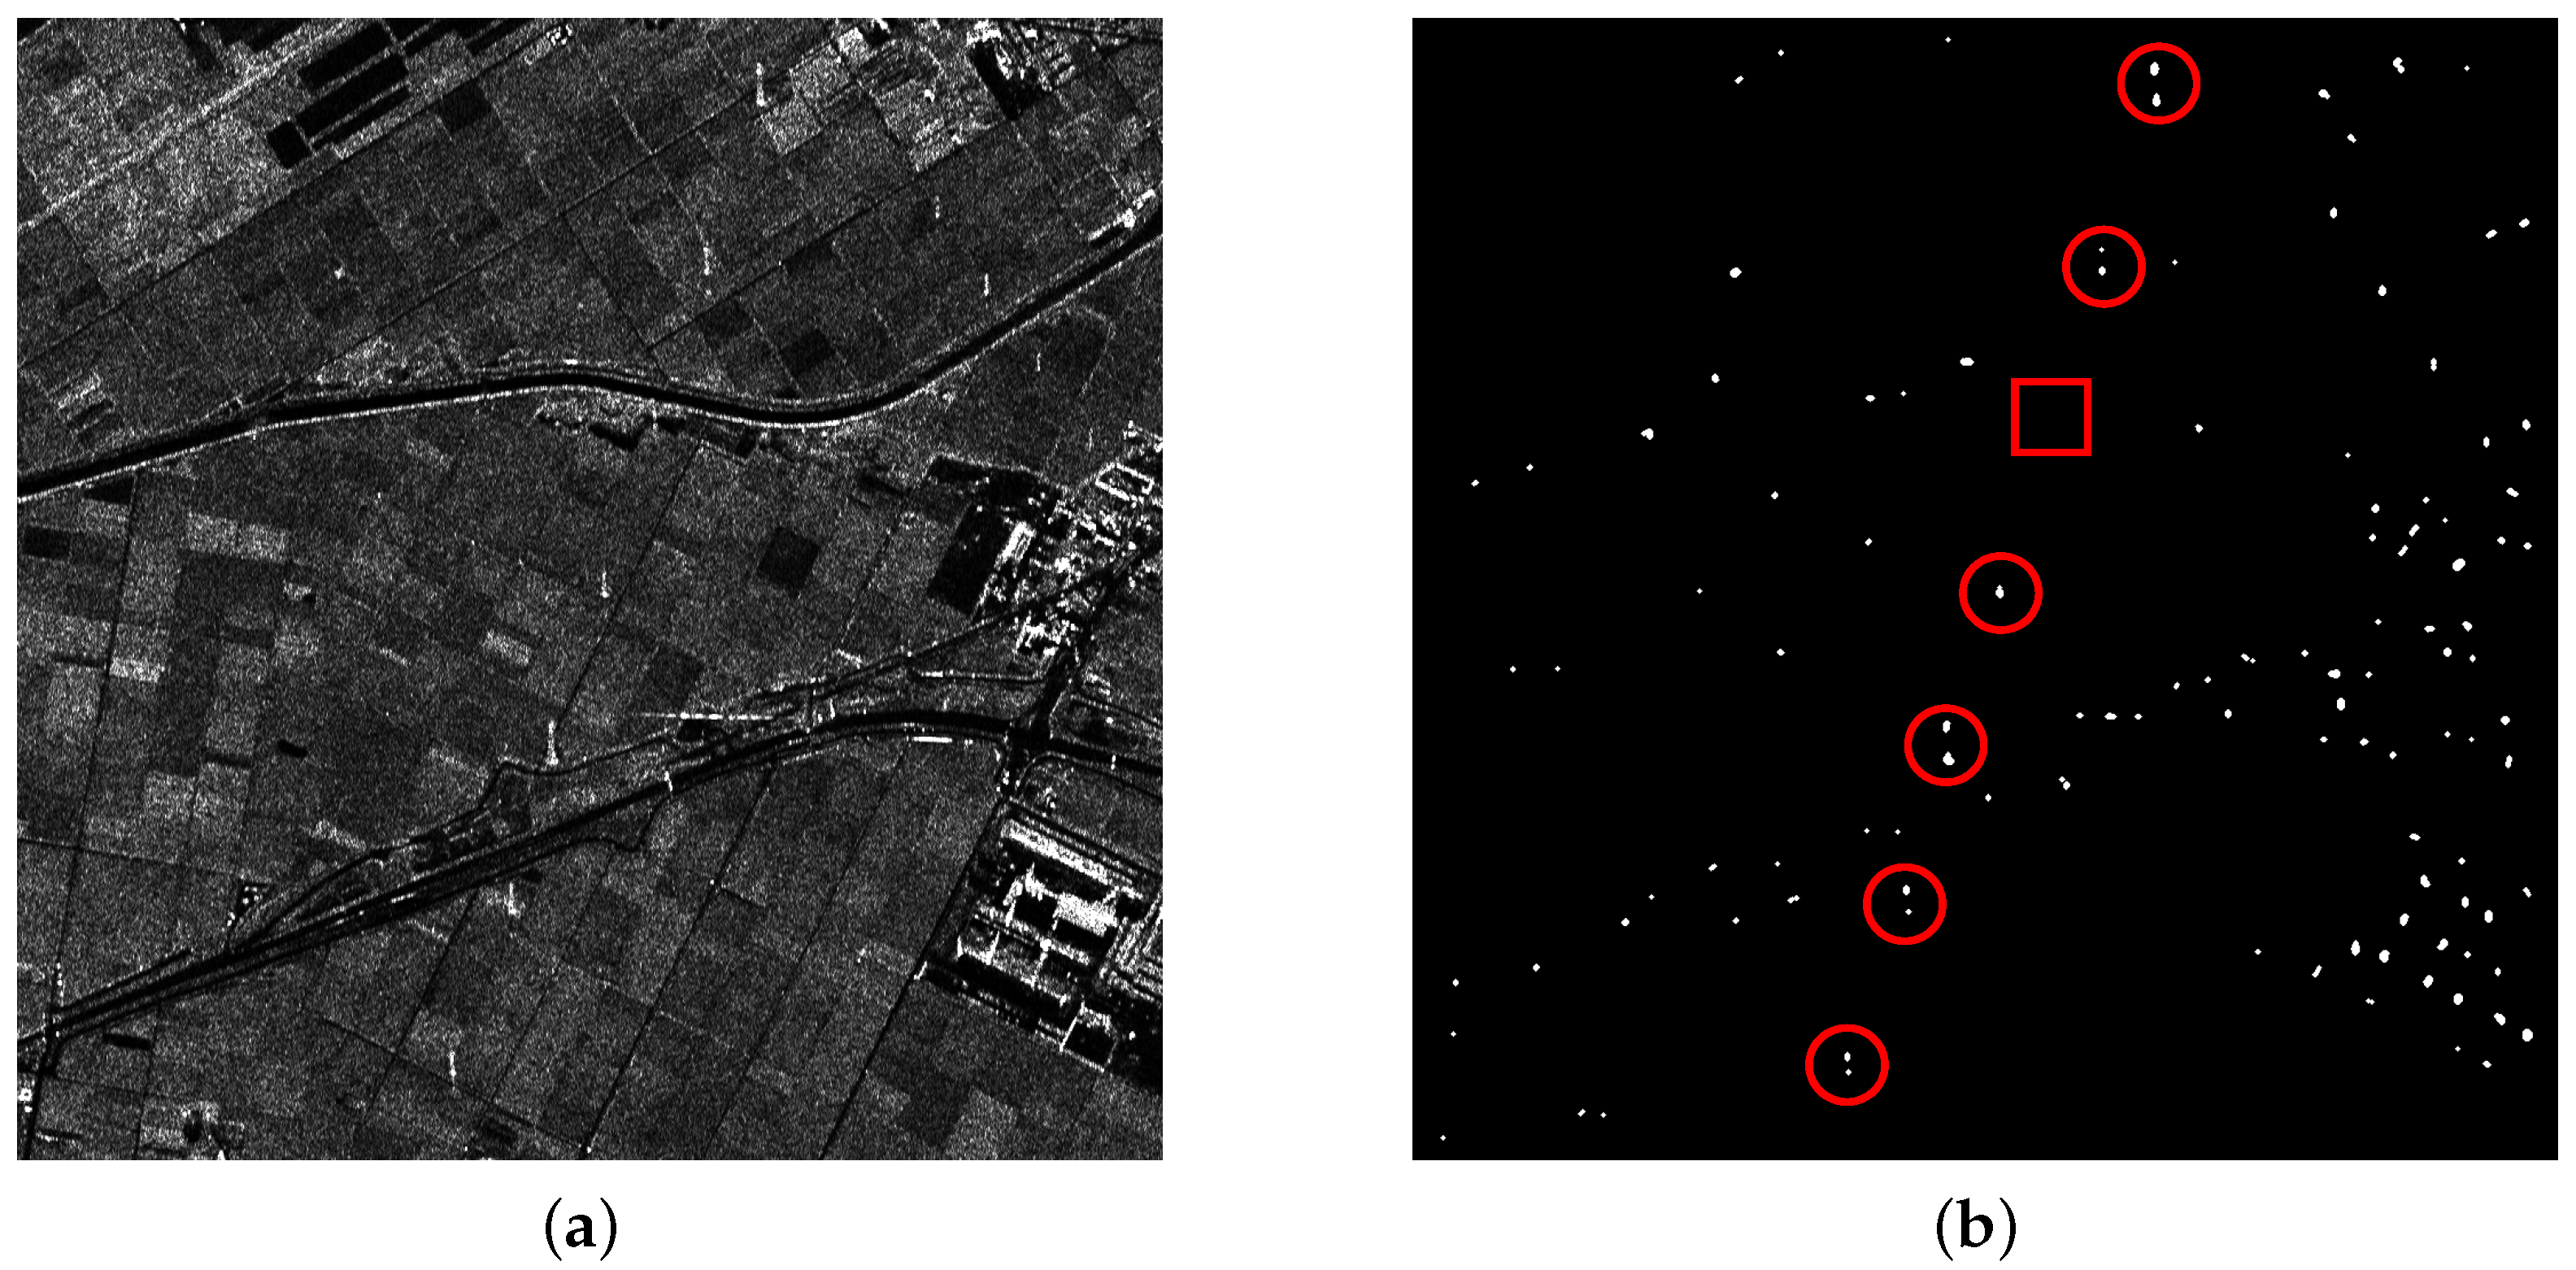
The data of experiment II is a part of L-band Pi-SAR images in the Niigata Site Area, as shown in
Figure 10a. The original image size is
, and the spatial resolution is 3 m × 3 m. With a lot of ground objects included, roads, urban construction and other non-natural targets will bring great difficulty to the detection. An area with
pixels is cut out for the experiment, containing PTT targets marked by red circles, as shown in
Figure 10b.
Considering the complexity of ground scene in this data, a CA-CFAR detector is applied to the maximum likelihood log-ratio image derived from TF analysis (
), and then the detection result is used for the same further processing as in experiment I. Related parameter settings are shown in
Table 3.
With many non-natural scenes (like roads and buildings) in the data, there are a lot of candidate targets that resulted from point-like target detection. Targets marked by red circles and rectangles in
Figure 10b are PTT targets and weak PTT targets, respectively. In a complicated background, the weak target is missing in both methods, as shown in
Figure 11b and
Figure 12b marked by red rectangles. Along the road, there exist many candidate targets. The greater the number of candidate targets, the greater the interference on extraction. Hence, candidate targets should be as few as possible on the premise that all PTT targets are detected. Stationarity detection based on TF analysis can effectively remove some candidate targets because PTT targets are non-stationary while some candidate targets are stationary. Since candidate targets in
Figure 12b are much less than in
Figure 11b, it can be inferred that the effect of PWF is limited for complex ground scenes. In
Table 4, two methods show the same detection rate of PTT targets. However, the PWF involved method failed to extract the linear arranged PTT targets due to the great interference coming from a high false alarm rate of CFAR. The false alarm probability of point-like targets is a constant. In a ground scene, there are many kinds of point-like targets, including PTT. The high false alarm rate of CFAR resulted from other point-like targets. Linear arranged PTT targets are successfully extracted by a TF involved method despite losing one weak PTT target, as shown in
Figure 12c,d. The experimental results verify the feasibility and effectiveness of the detection approach based on TF analysis and a-contrario theory.
4.3. Experiment III
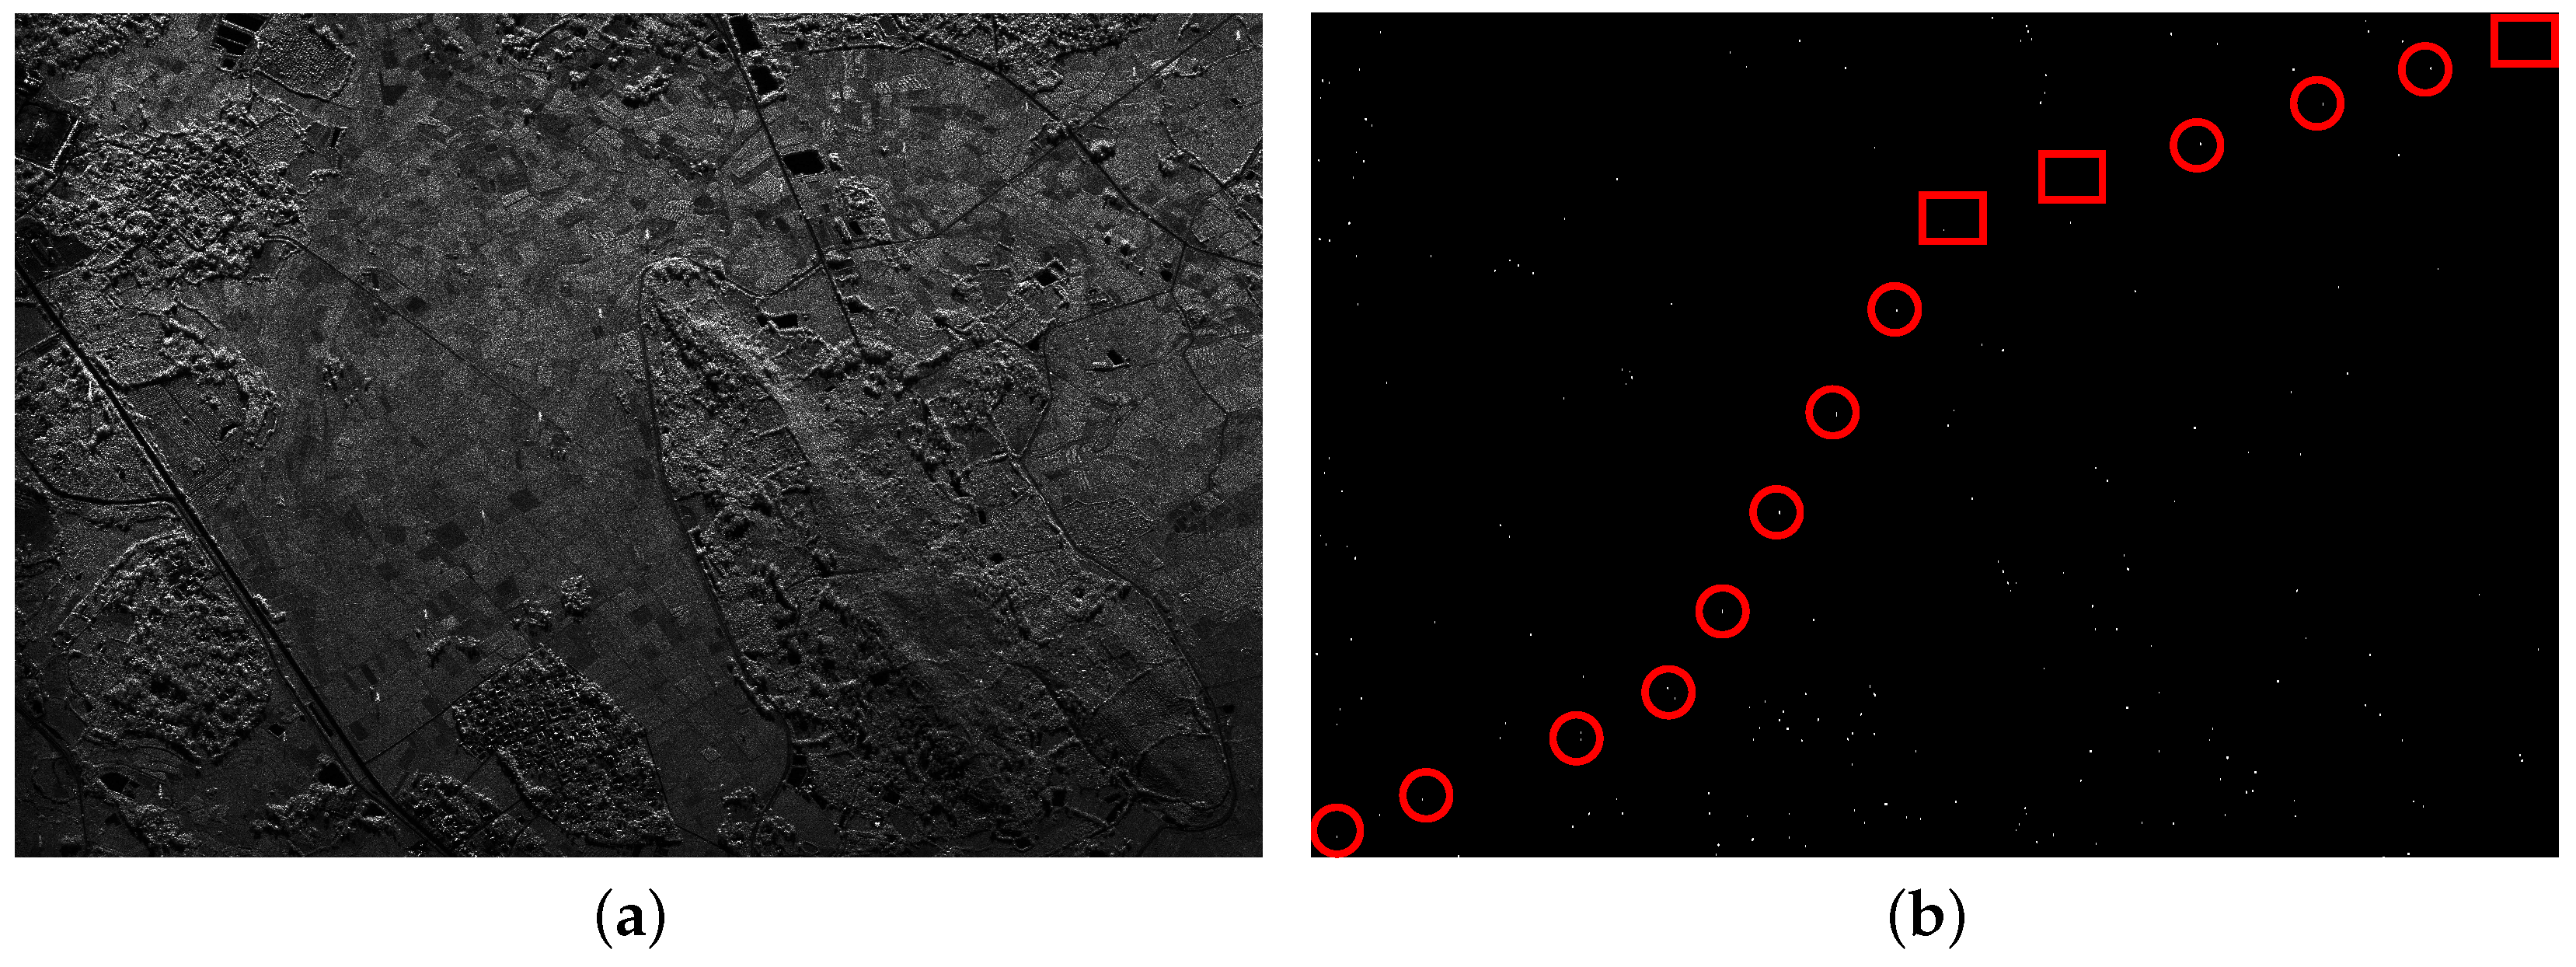
PolSAR data used in this section is acquired in X-band by the 38th Research Institute of China Electronics Technology Group Corporation (CETC38) single-baseline PolInSAR system over Linshui City in Hainan Province of China, with a spatial resolution of approximately 0.5 m × 0.5 m and
pixels, as shown in
Figure 13a. PTT targets in the image are piecewise linear arranged, as shown in
Figure 13b, marked by red circle.
After pre-processing (TF with
and PWF), CA-CFAR is applied to detect point-like targets. Considering that PTT targets in the image are piecewise linear arranged, segment detection based on a-contrario theory is carried out, roughly divided into three sections. Related parameters are shown in
Table 5.
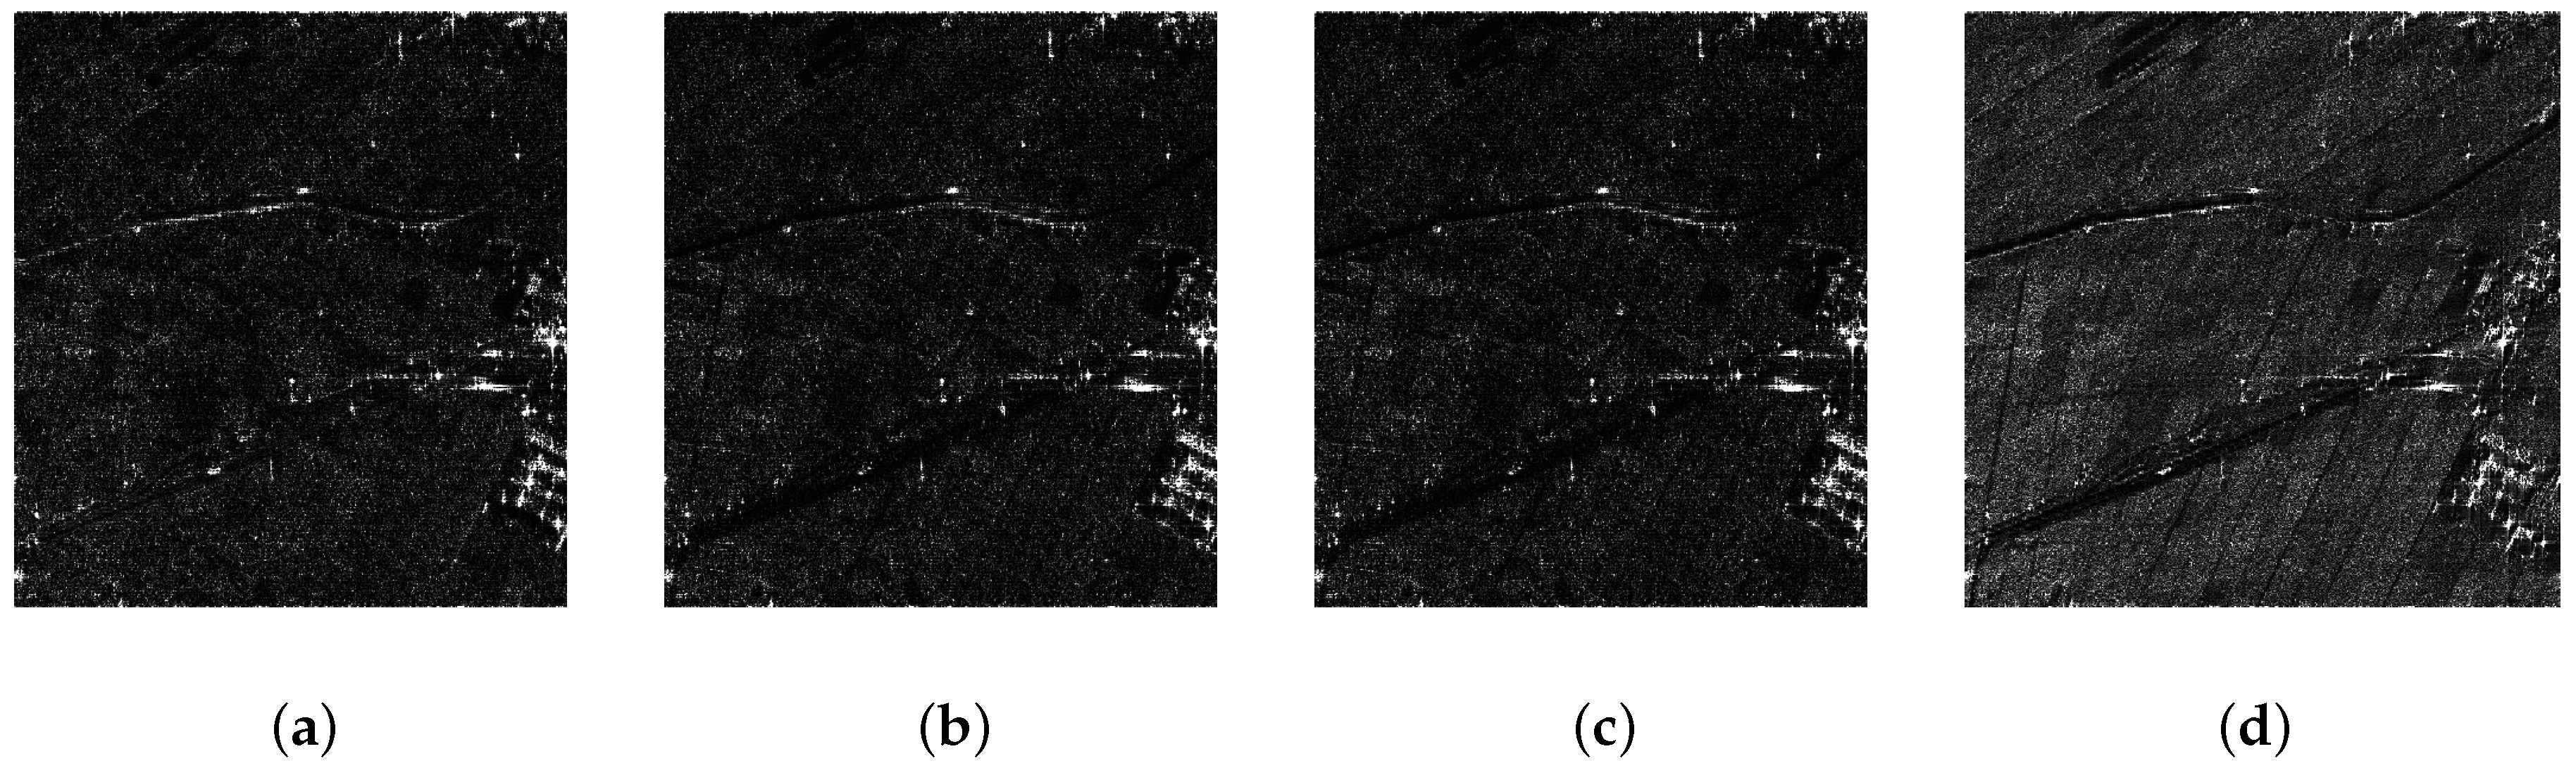
In this image, there exist 14 PTT targets. Under the condition that CA-CFAR parameters are the same, PWF based CA-CFAR detection loses three PTT targets, with many false alarm point-like targets, as shown in
Figure 14a,b, while TF analysis based CA-CFAR detection get all PTT targets detected, with much less false alarm point-like targets, as shown in
Figure 15a,b. With a high false alarm rate (targets wrongly detected as PTT), as shown in
Table 6, further measures are necessary, thus using a-contrario extraction, which is state-of-the-art in point alignment detection [
28]. The PWF based method failed to extract the PTT series, resulting from a high false alarm rate (over 90%). Through TF analysis, the false alarm rate is relatively low. The TF based method finished the extraction, as shown in
Figure 15c,d.
In three experiments, a CA-CFAR detector can only detect point-like targets rather than distinguish PTT targets from other point-like targets. This is the reason why a-contrario extraction is applied. A parameter (false alarm rate), closely related to the first step (PWF or TF), has a great influence on a-contrario extraction. From experimental results, TF analysis is superior to PWF in reducing false alarm rate, and it can be inferred that a-contrario extraction is effective when the false alarm rate is below a value that needs to be estimated from numerous experiments.
With many false alarm targets, other lines in addition to the PTT line may be extracted. For this problem, the adoption of TF analysis got a relatively low false alarm rate, reducing the probability of lines formed by false alarm targets. In addition, isometric features can be considered in a-contrario extraction, avoiding this situation to a large extent. In our three experiments, this phenomenon does not appear.
Table 7 records the time cost of two methods in experiment III. The computation time is recorded by implementing the Matlab code on a PC with a 3.20 GHz Intel Core i5 Processor. In the first step, TF analysis takes more time than PWF, but the TF decomposition reduced the number of pixels to be processed, decreasing the computation cost of CA-CFAR, which is time-consuming. Hence, TF based CA-CFAR is much faster than PWF based CA-CFAR.


