
Chemically Roughened Solid Silver: A Simple, Robust and Broadband SERS Substrate

Abstract
:
1. Introduction
- the high sensitivity and selectivity, including the possibility of single molecule detection;
- the possibility of multiplexed analysis;
- the availability of cheaper and better hand held Raman spectrometers; and
- electrochemically roughened metal electrodes;
- metal colloids; and
- engineered metallic nano-patterns on planar surfaces [2].
- they are simpler, faster, and cheaper to produce than electrochemical roughening, metal colloids or nano-structure arrays;
- avoiding salts in the chemical etching solution, unlike the electrochemical roughening process, produces clean Ag surfaces;
- there is no need for costly instrumentation for their production;
- Ag surfaces may suppress the undesired interference from florescence; and
- Ag, being an excellent conductor of heat, provides good thermal stability to the chemically roughened solid SERS substrate, and hence, would minimize the sample decomposition due to the heat generated by the laser irradiation, especially, by the high power lasers required for longer wavelength Raman spectroscopy.
2. Materials and Methods
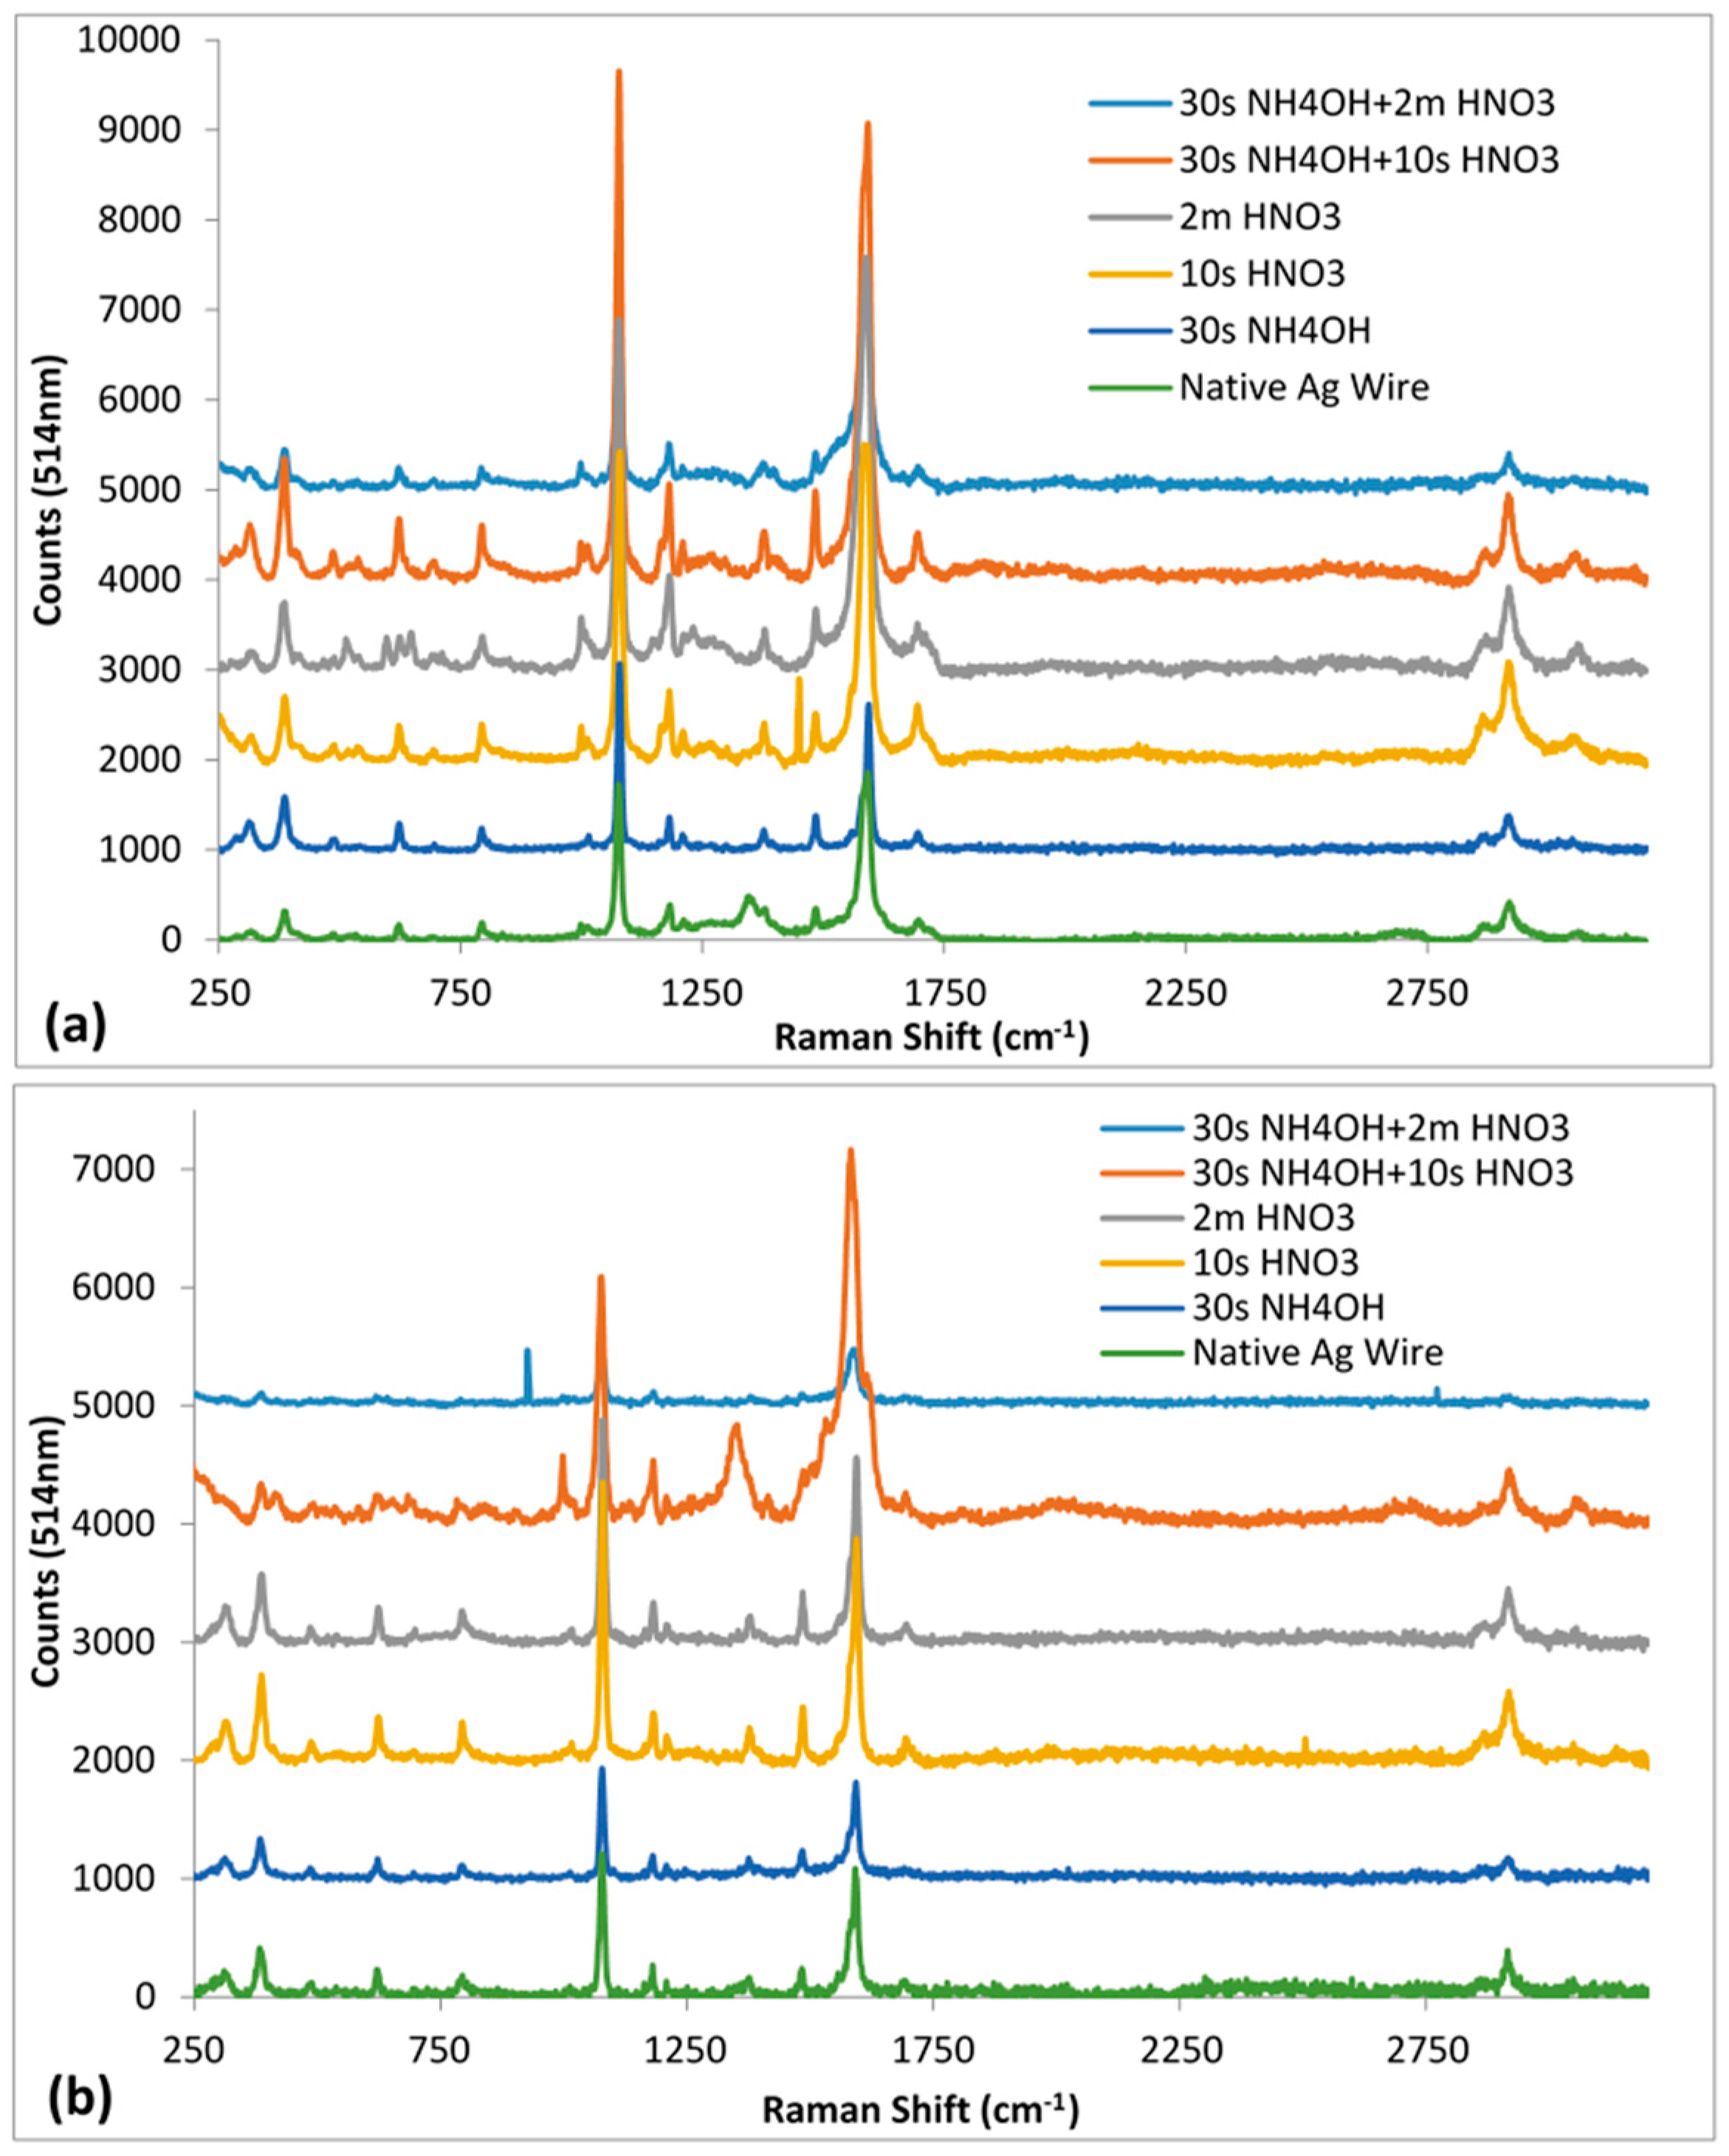
- 35% NH4OH for 30 s;
- 6 M HNO3 for 10 s;
- 6 M HNO3 for 2 min;
- 35% NH4OH for 30 s followed by 6 M HNO3 for 10 s; and
- 35% NH4OH for 30 s followed by 6 M HNO3 for 10 s.
3. Results and Discussion
- fabricated using equipment and reagents commonly found in chemistry laboratories;
- minimal training or experience required for fabrication;
- easily transported to or fabricated at the point of sampling; and
- easily integrated into analytical systems.
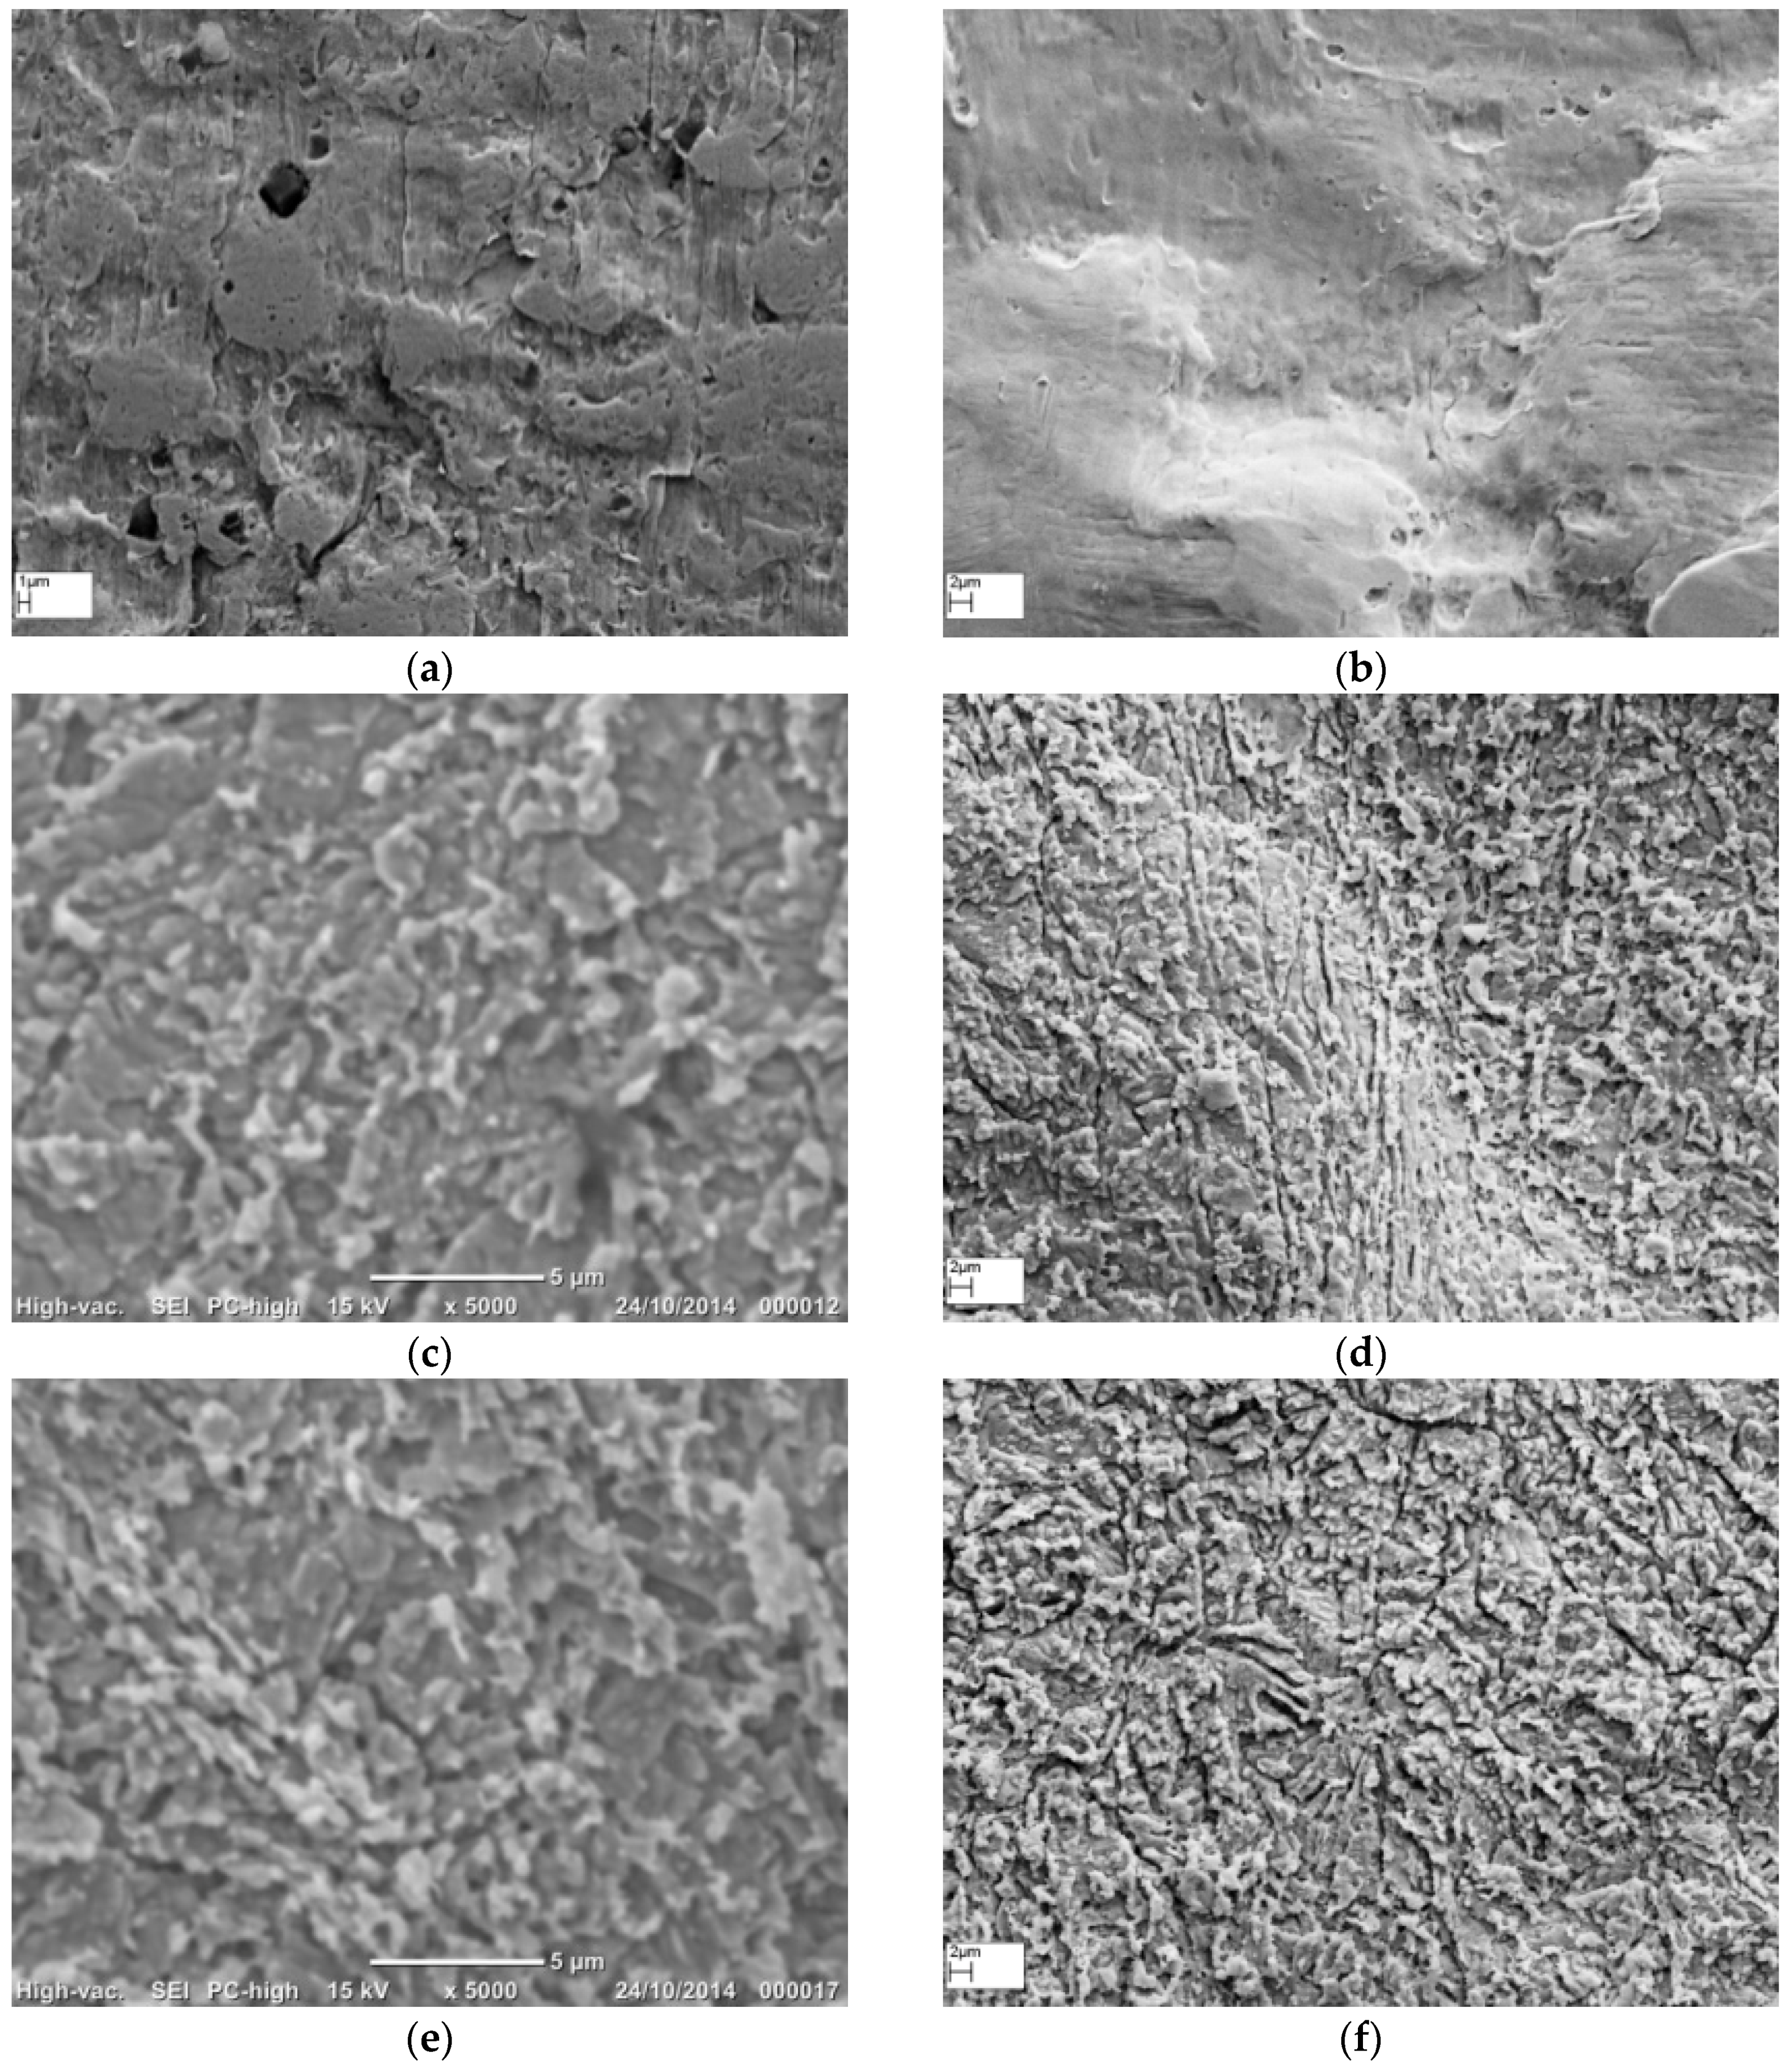
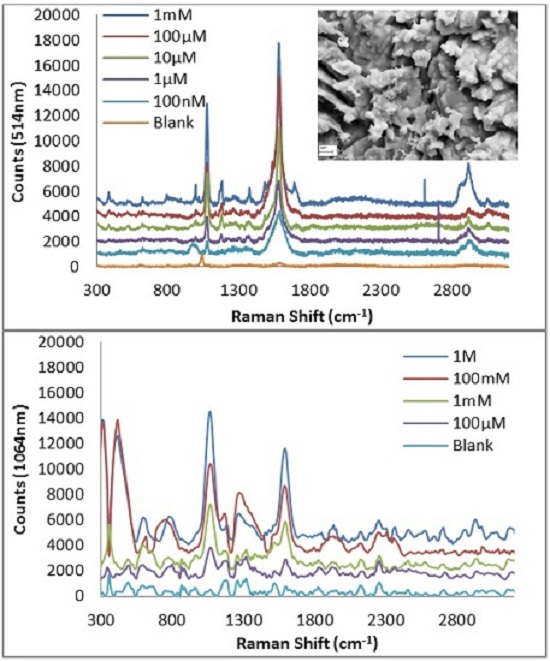
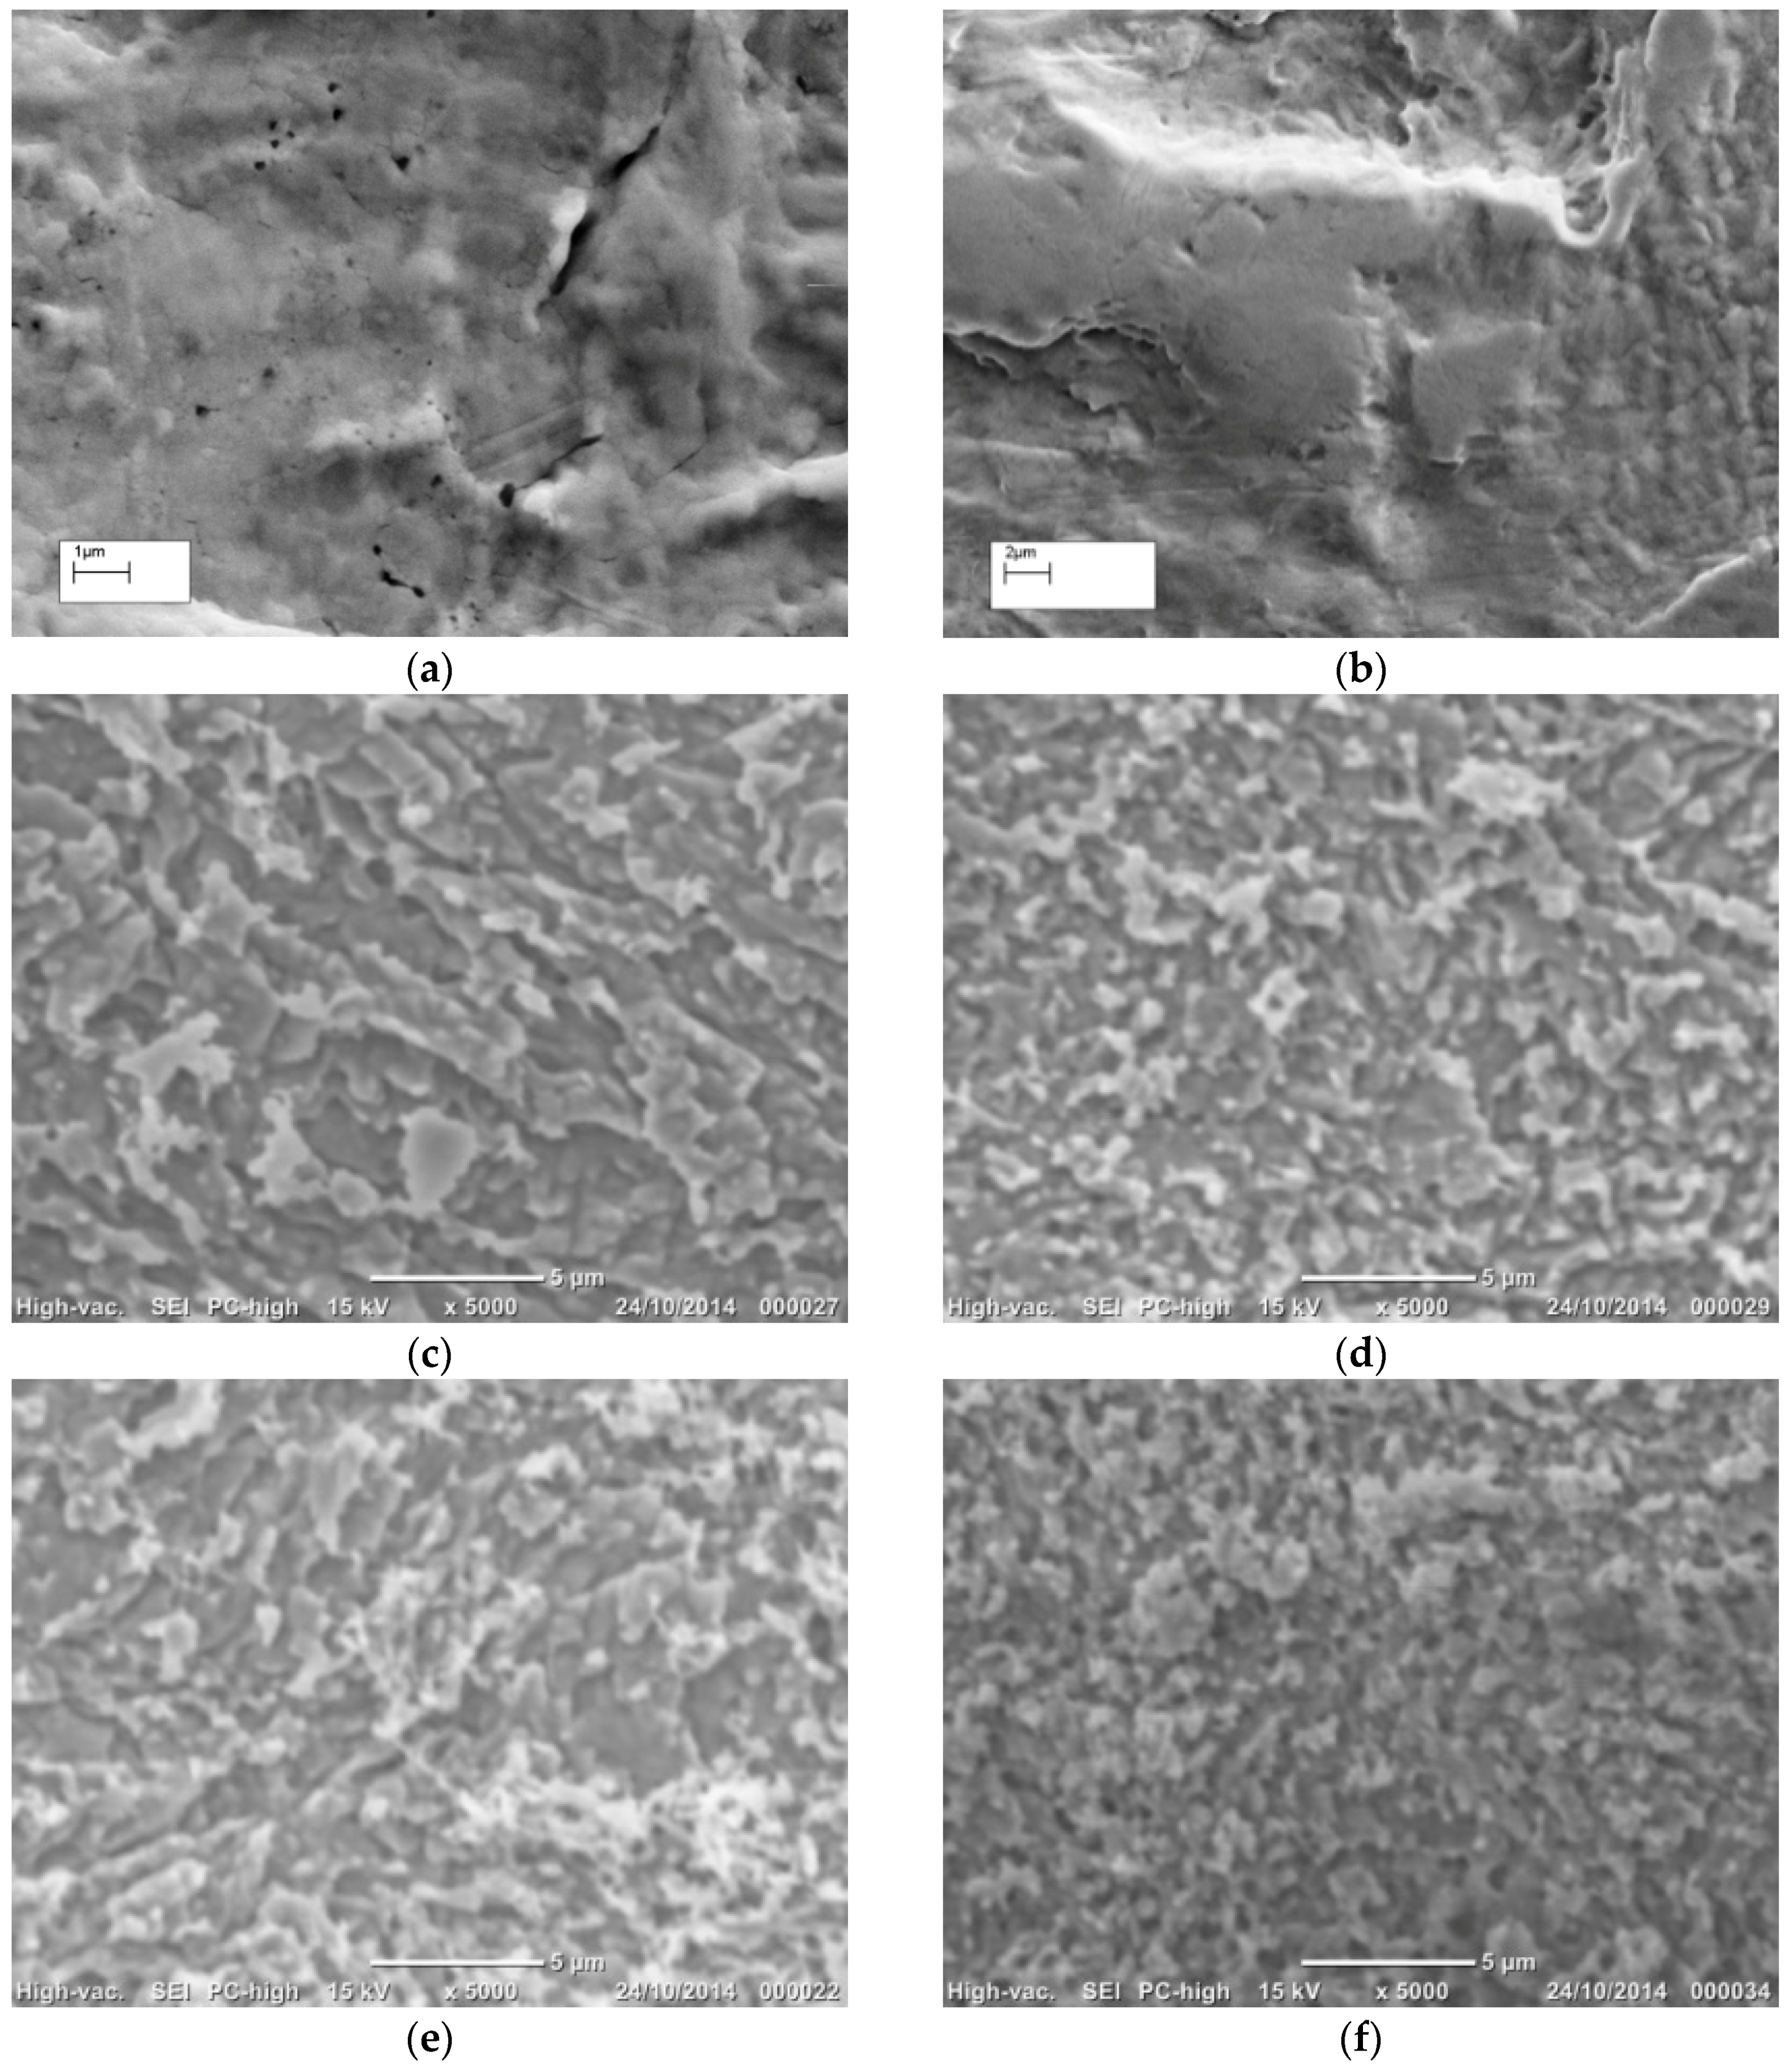
3.1. Morphology of Roughened Ag Substrates as Visualised Under SEM
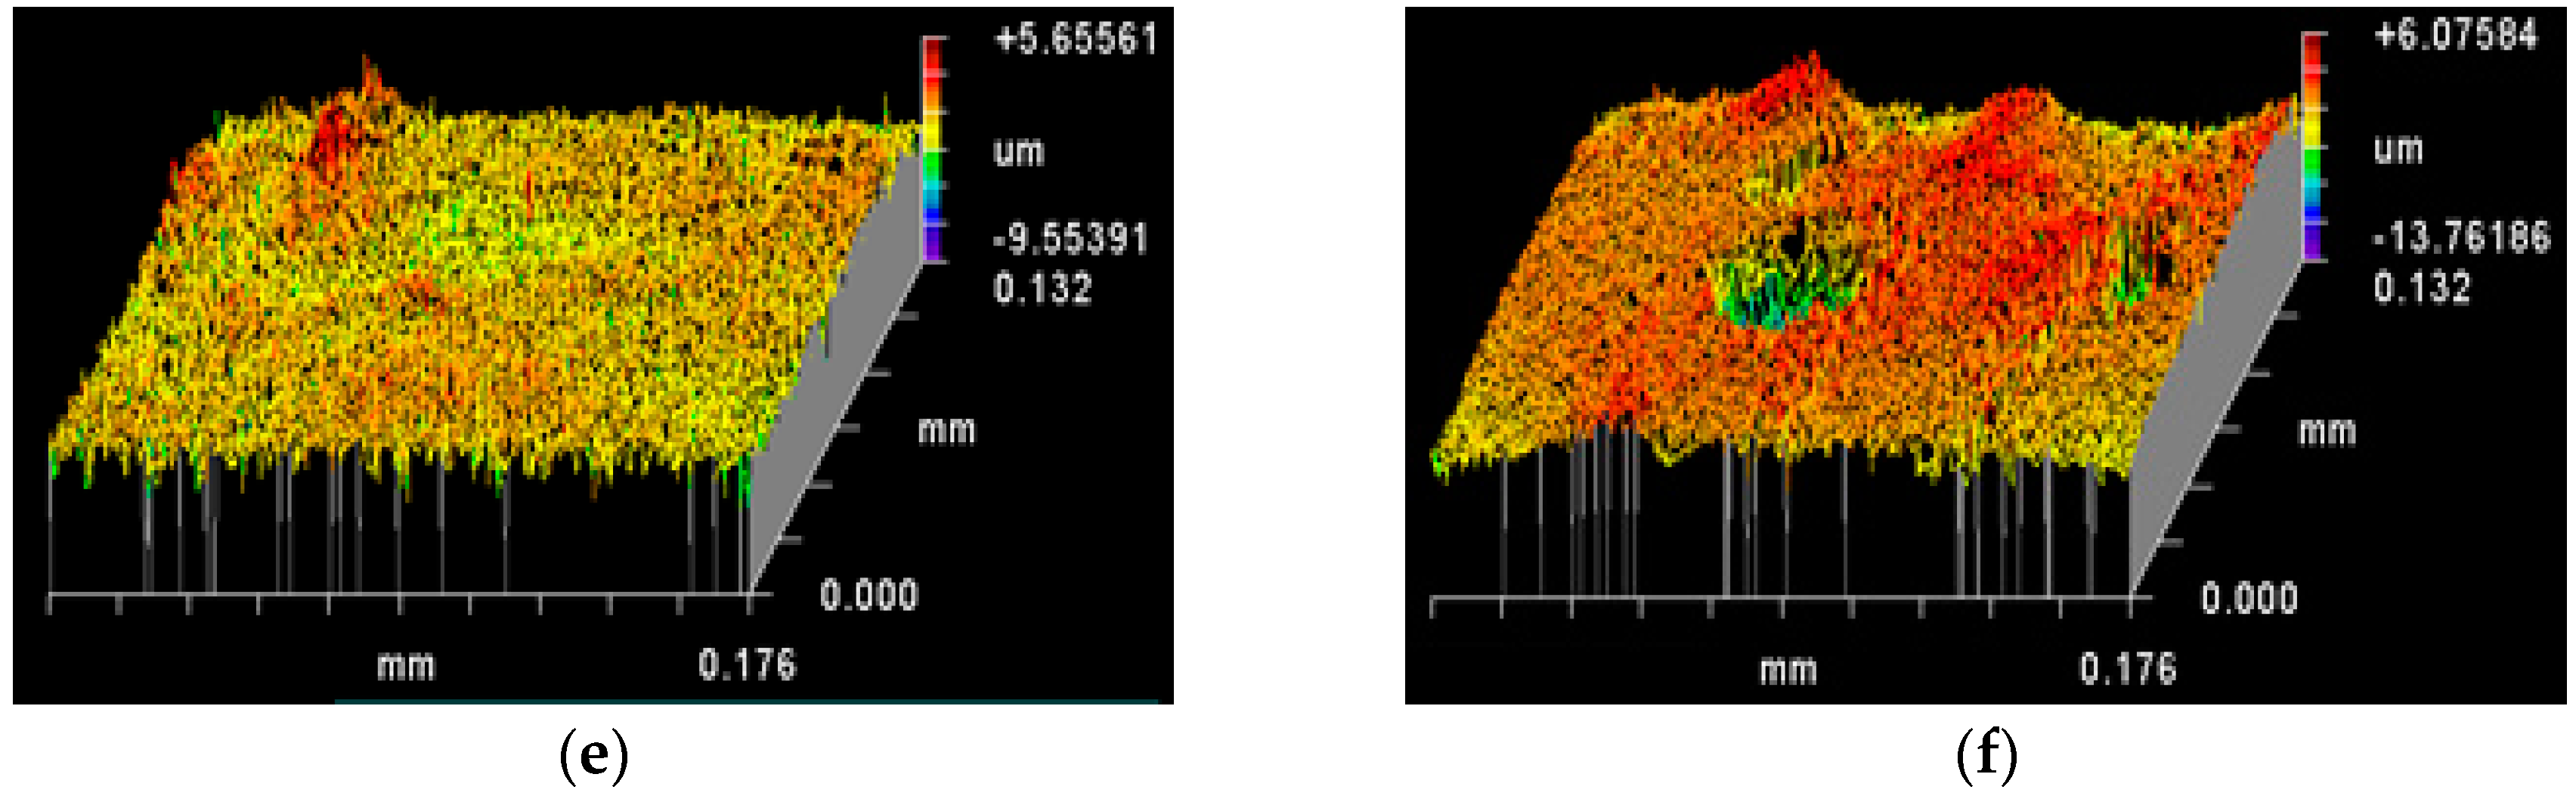
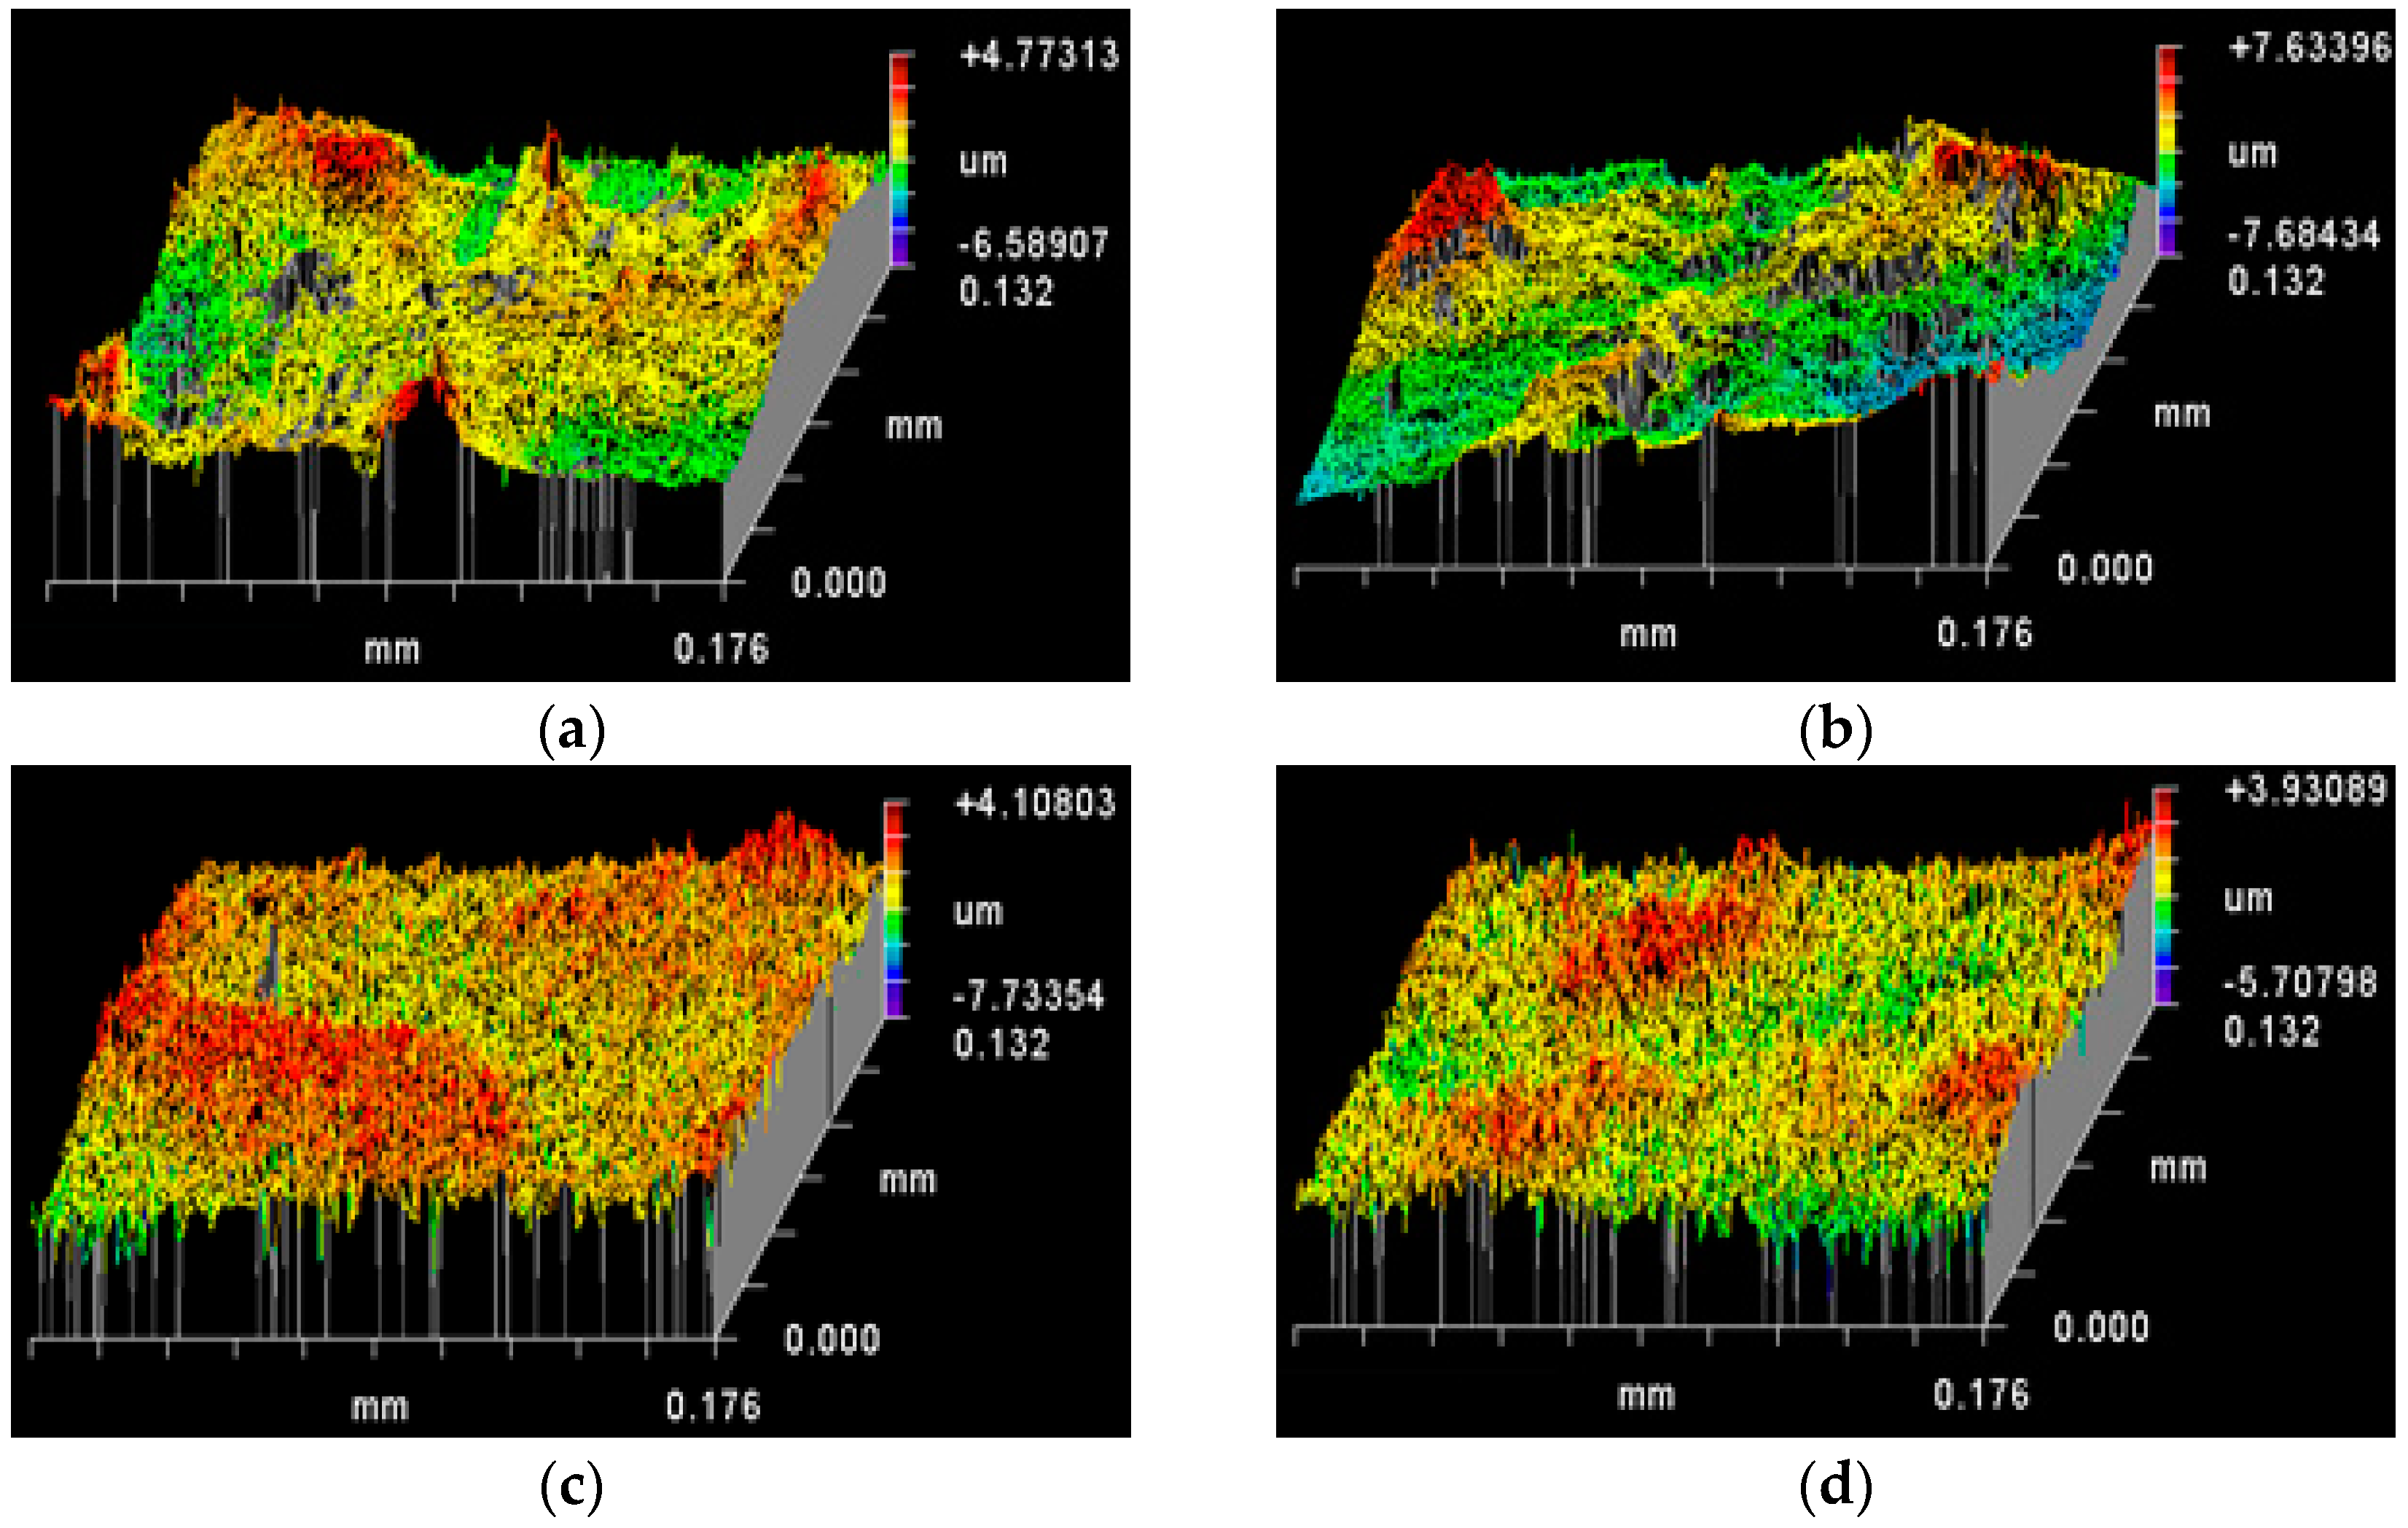
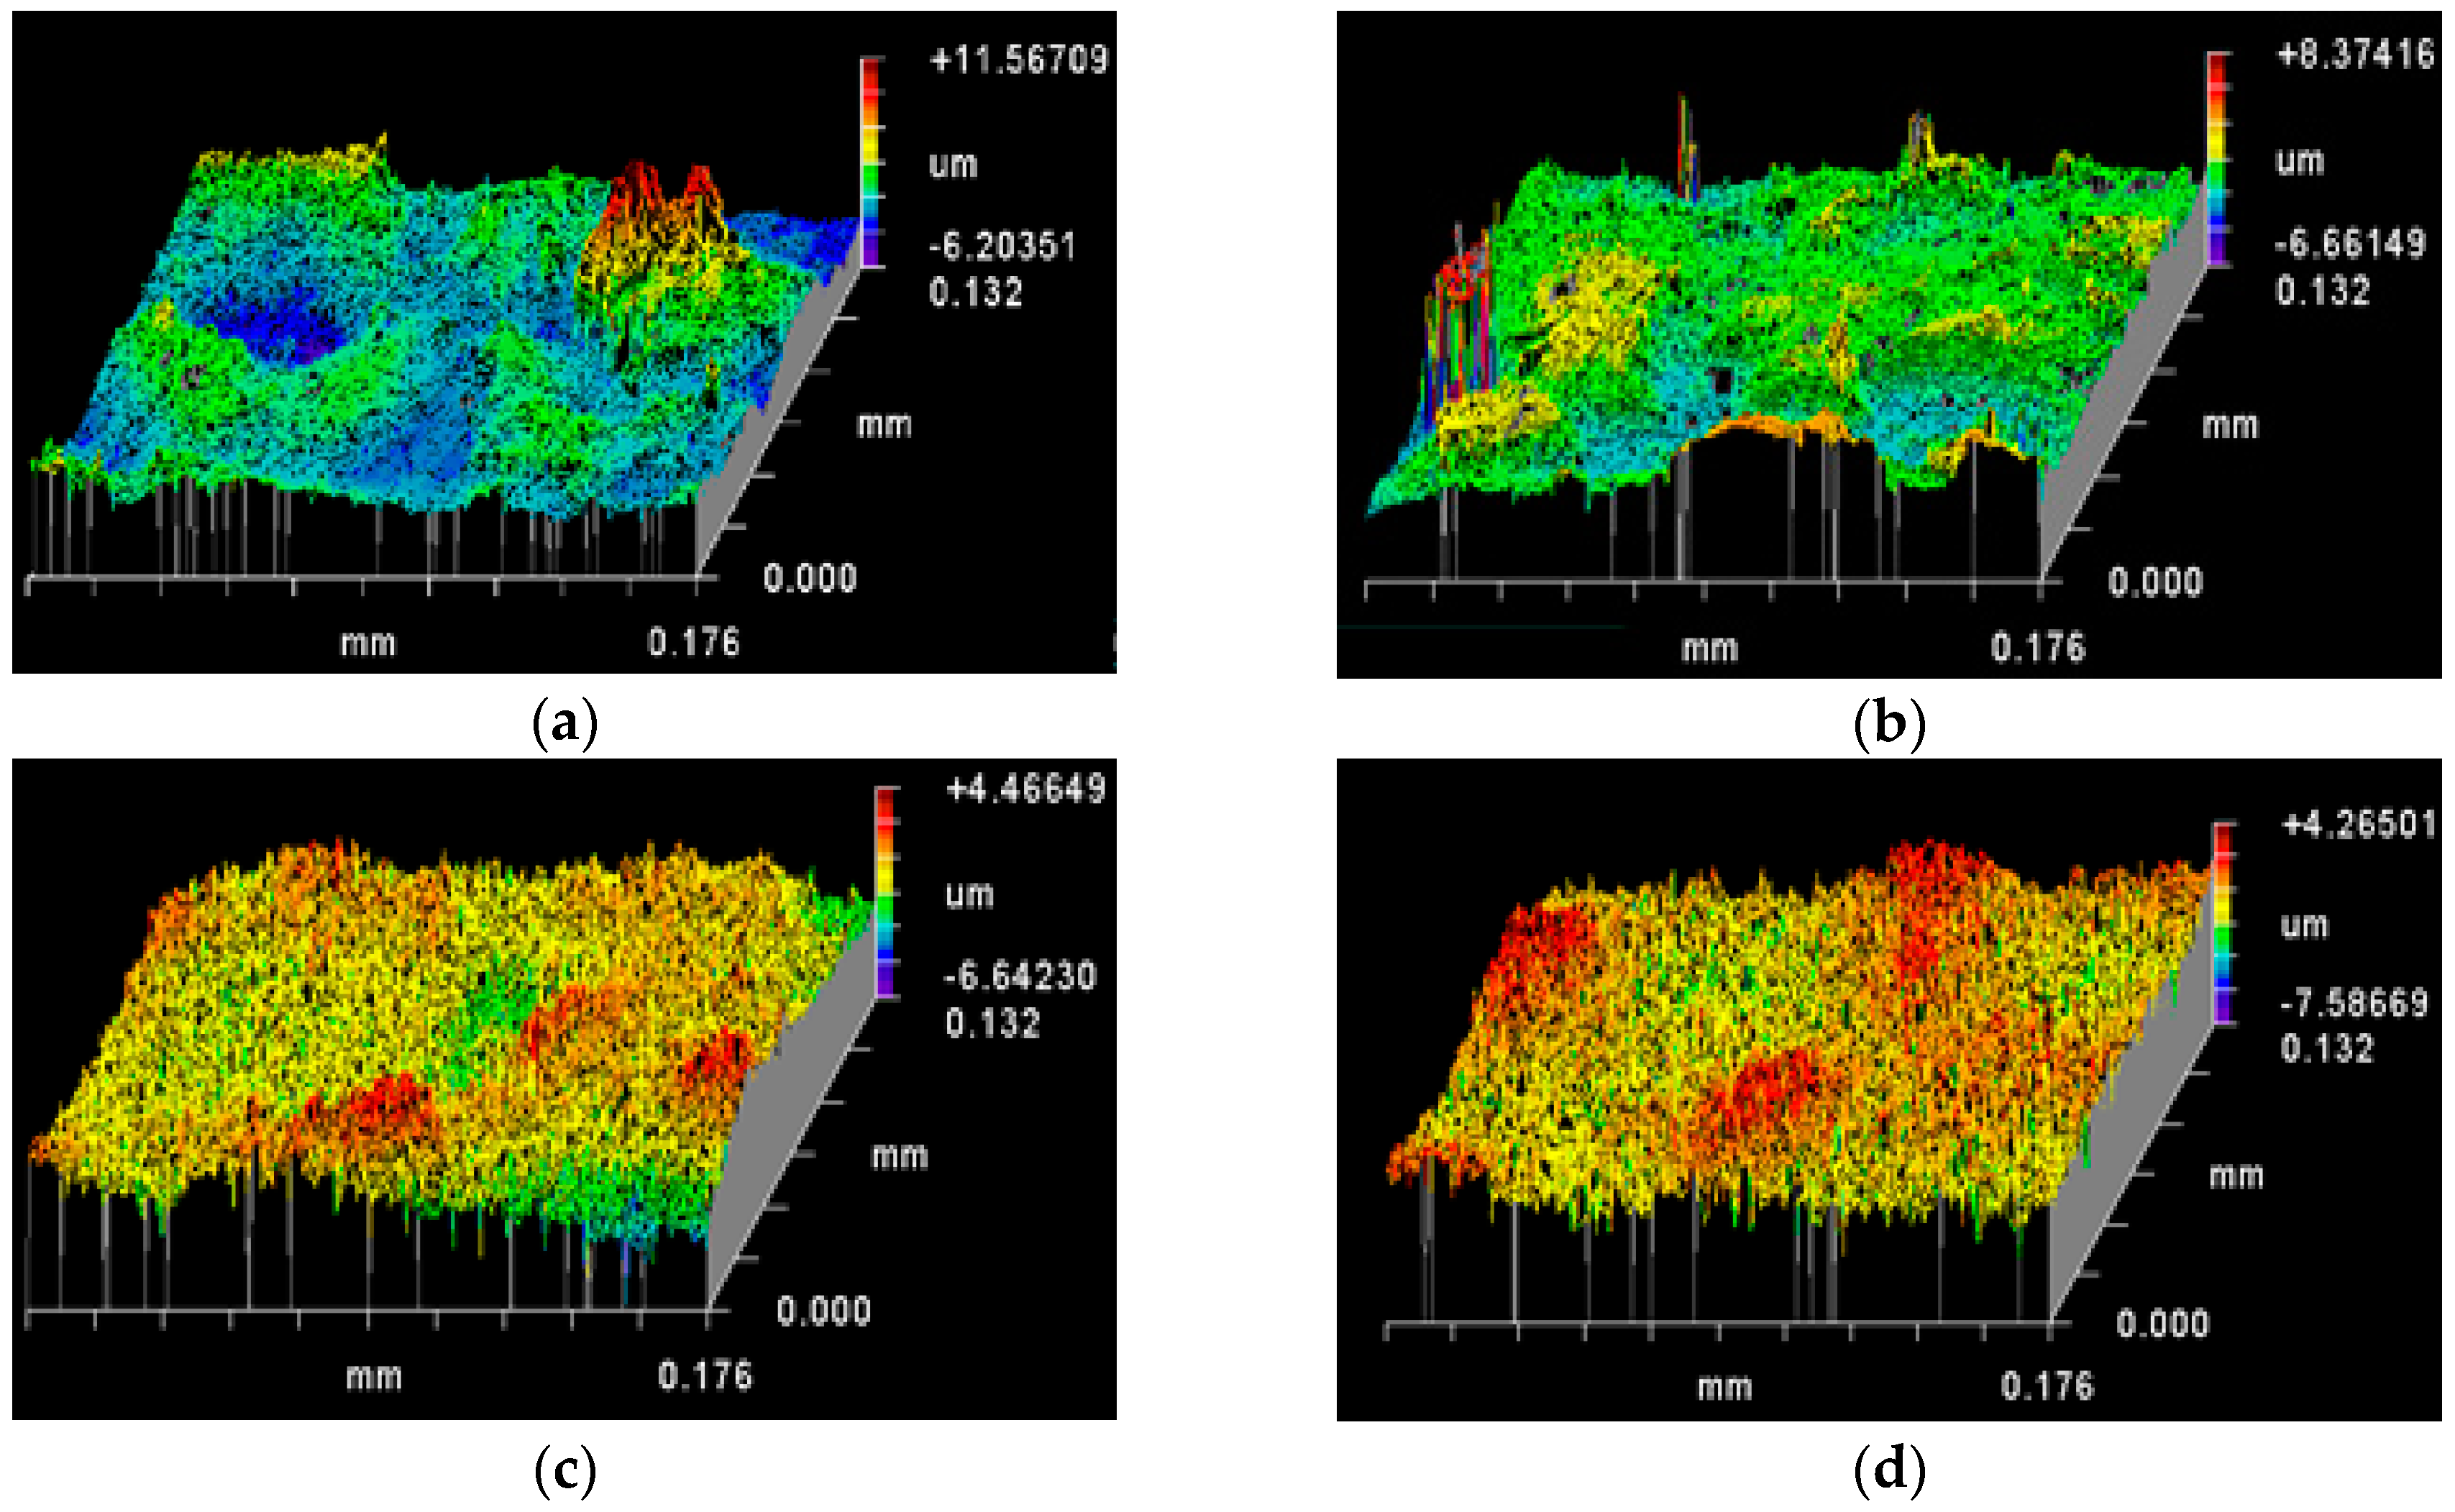
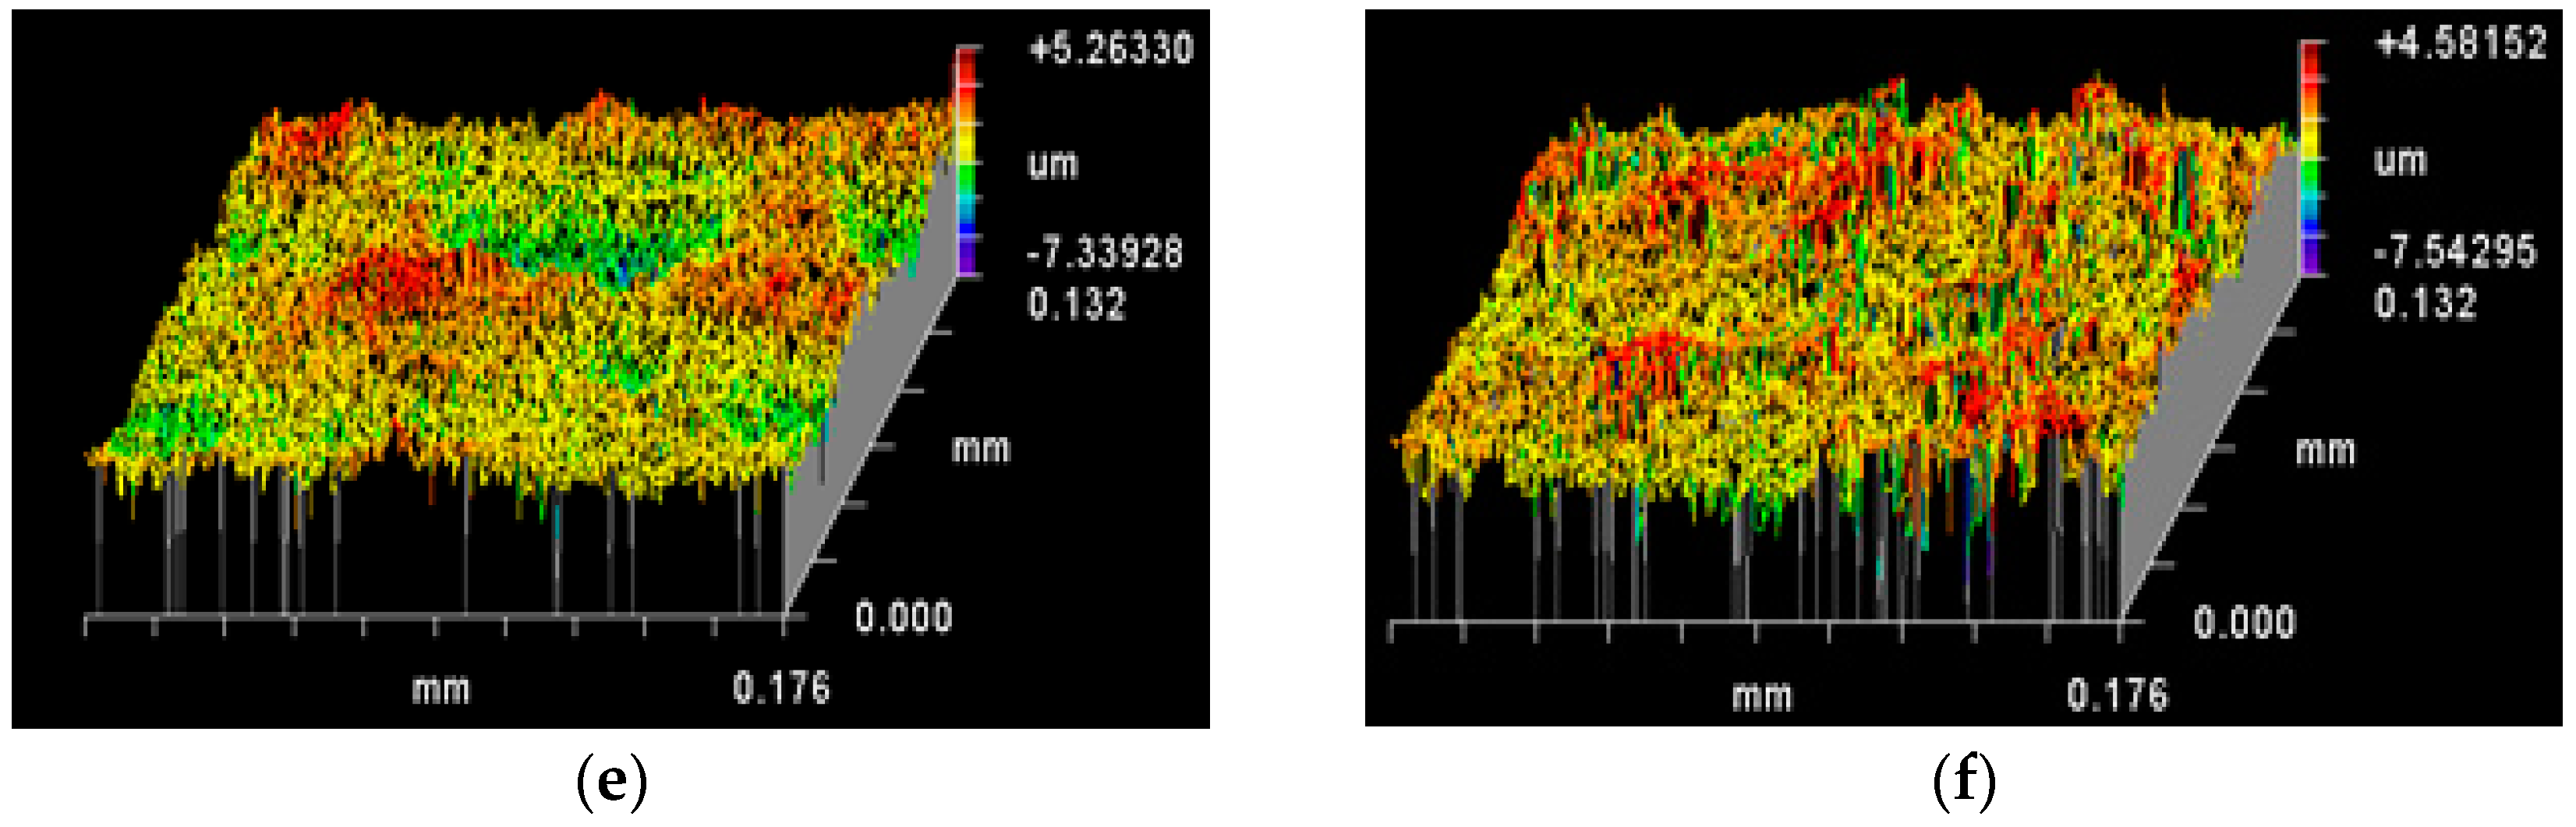
3.2. Topography of Roughened Ag Substrates as Mapped Using Zygo Interferometer
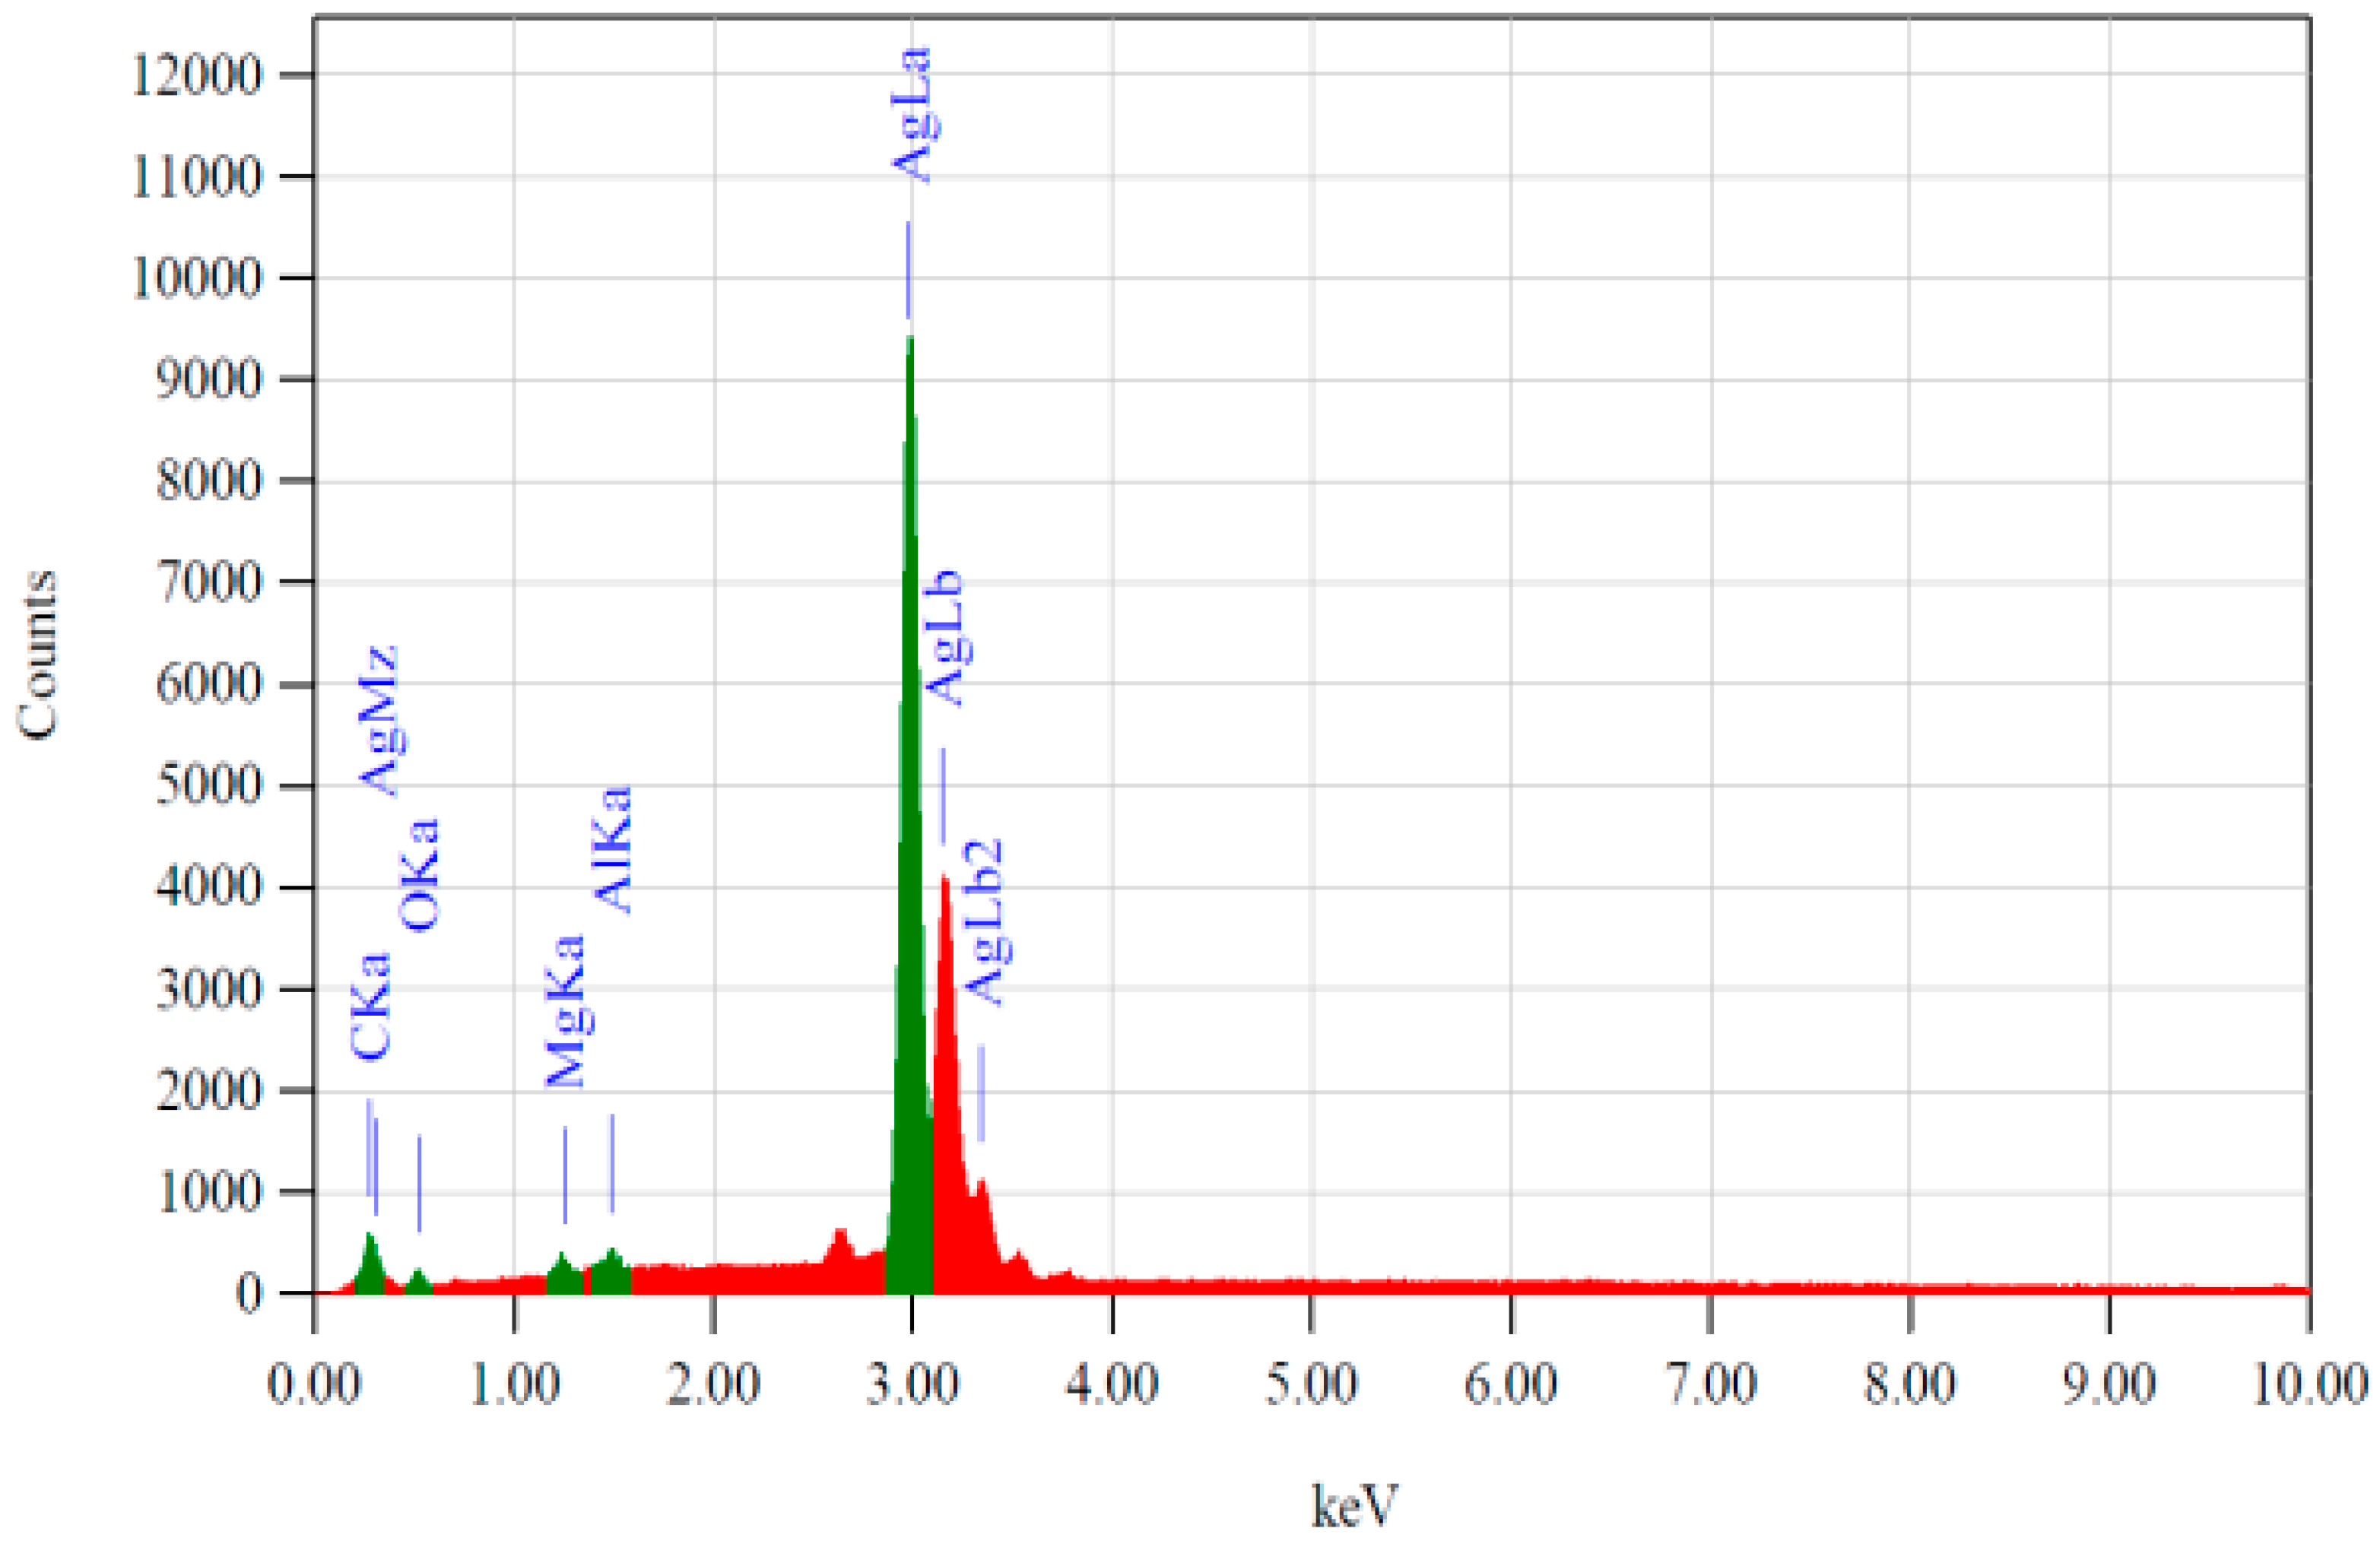
3.3. Surface Chemical Composition as a Function of Etching Treatments
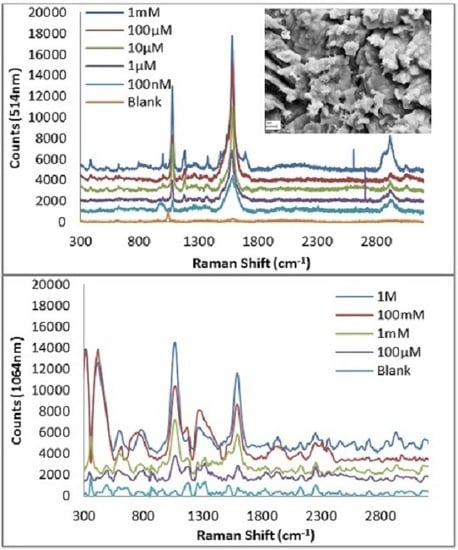
3.4. Efficacy of the Roughened Ag Wires in Enhancing SERS Signal
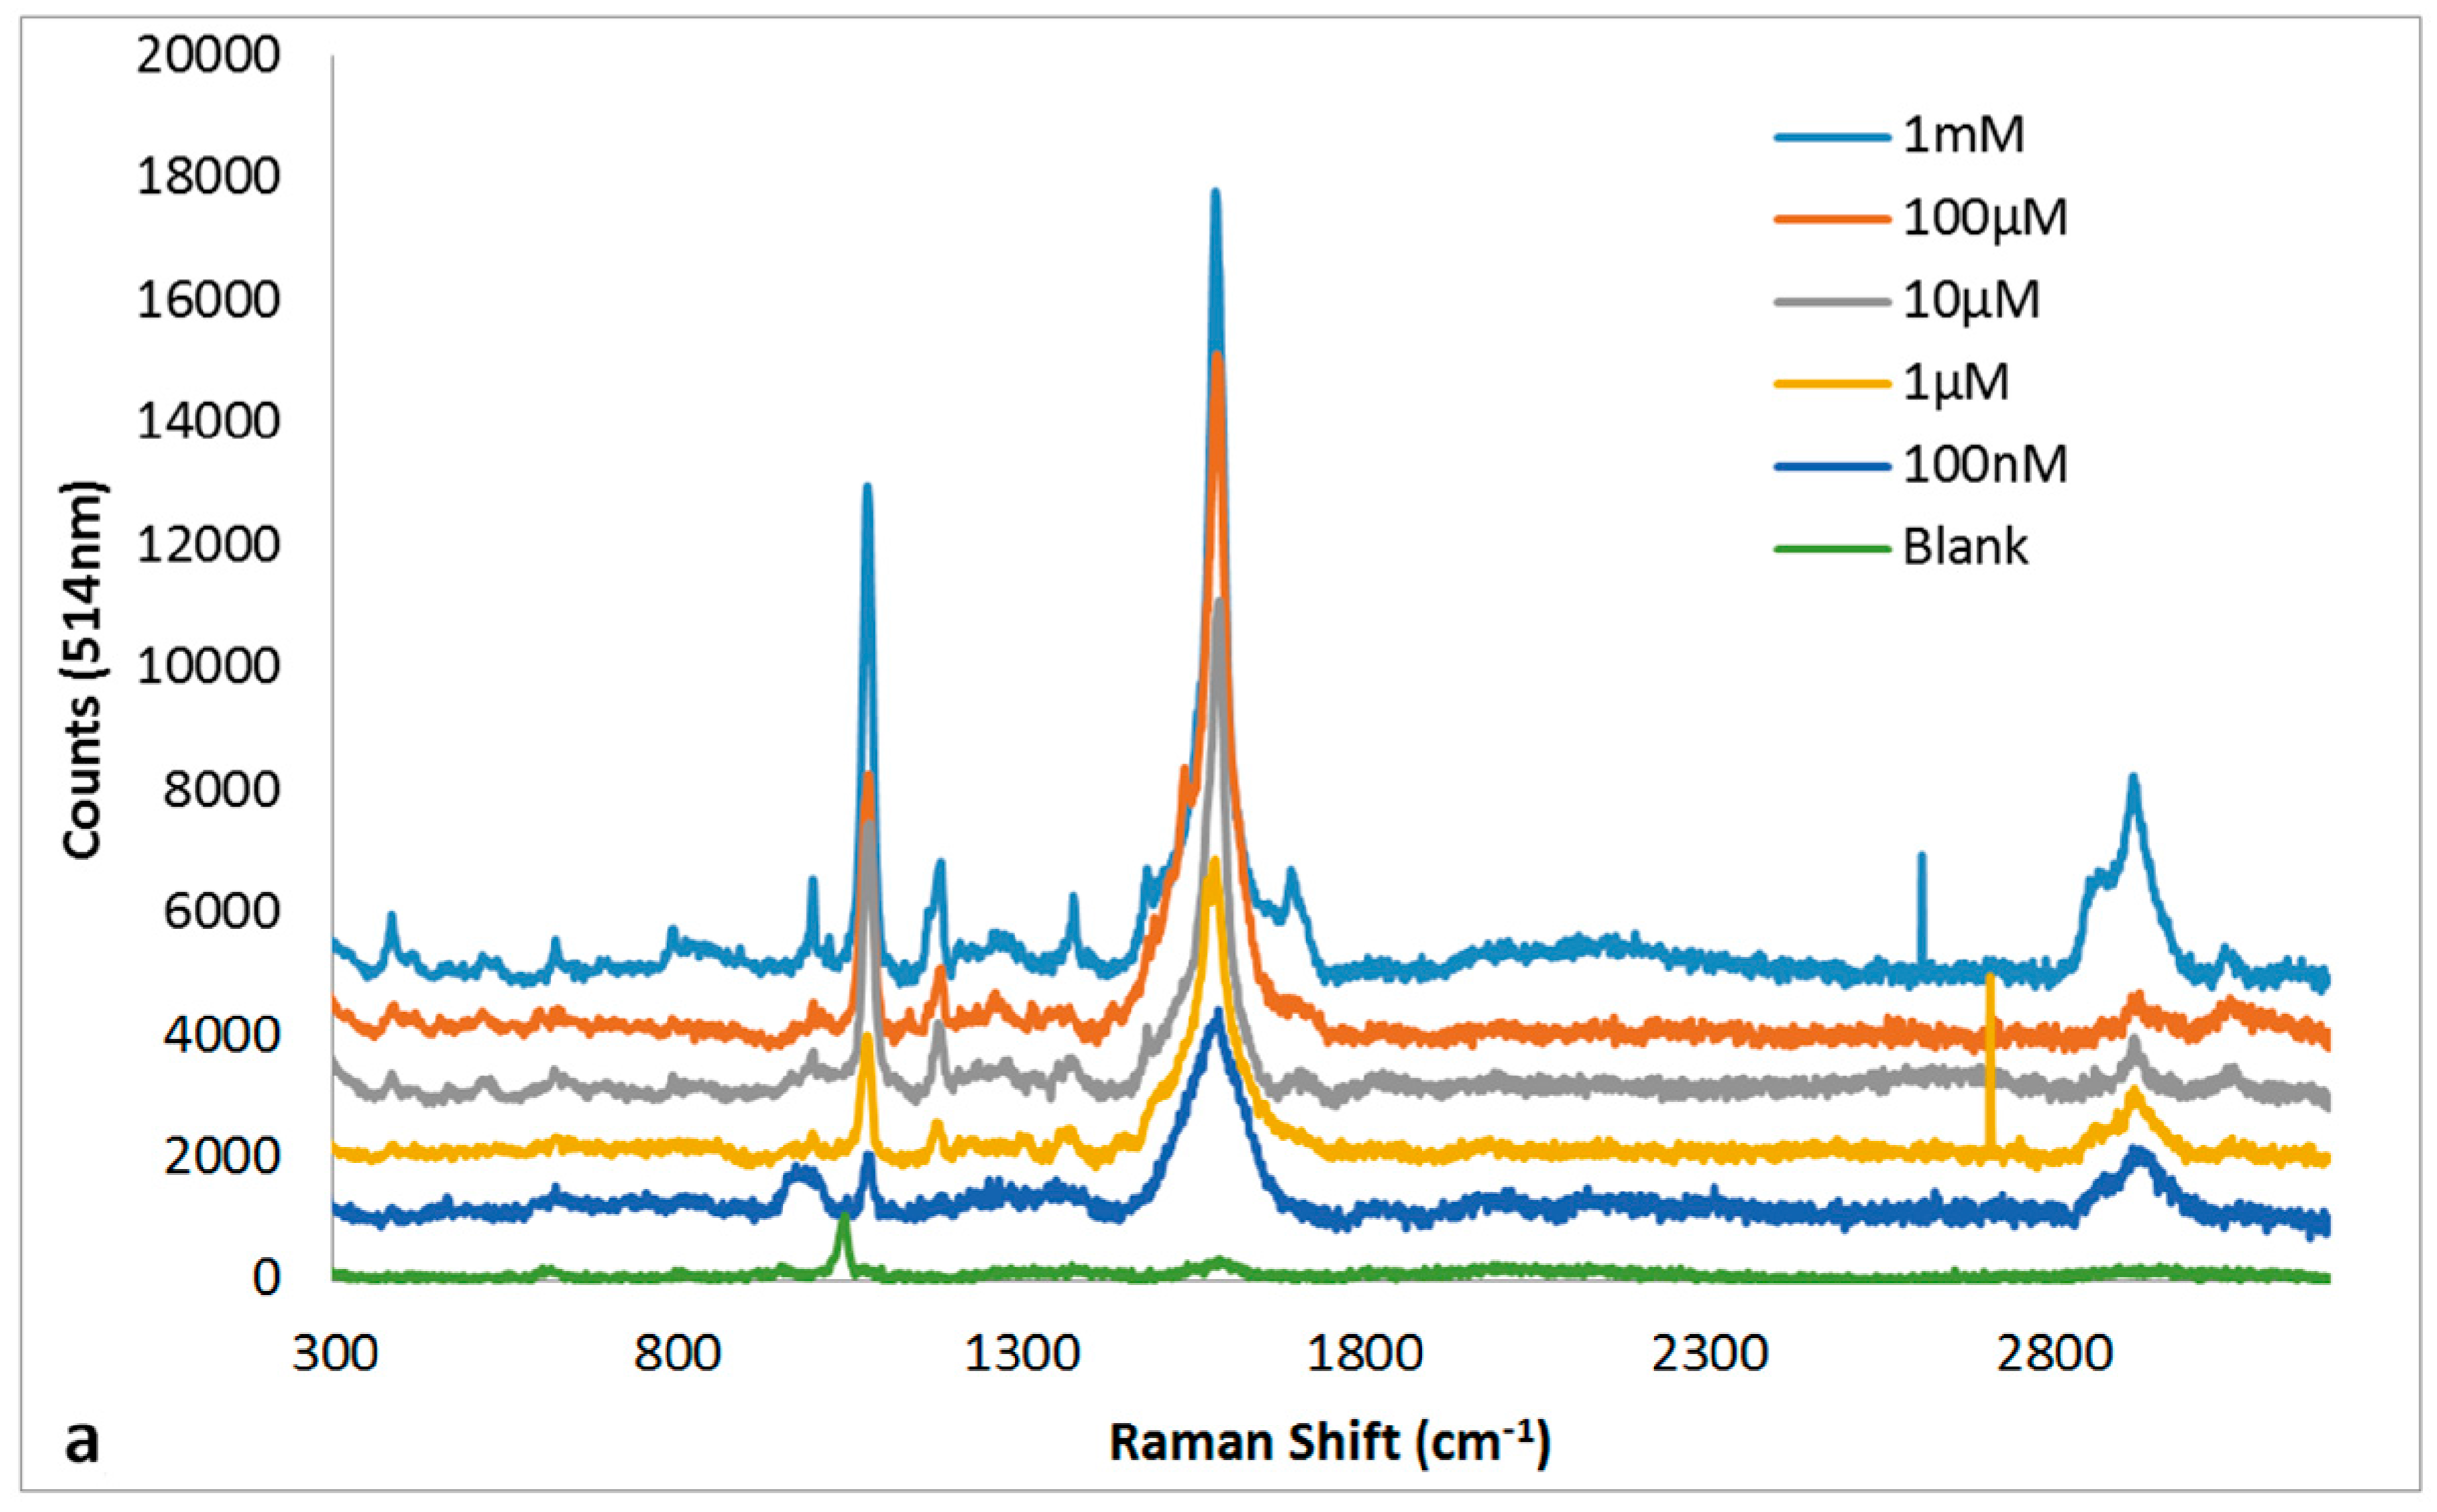
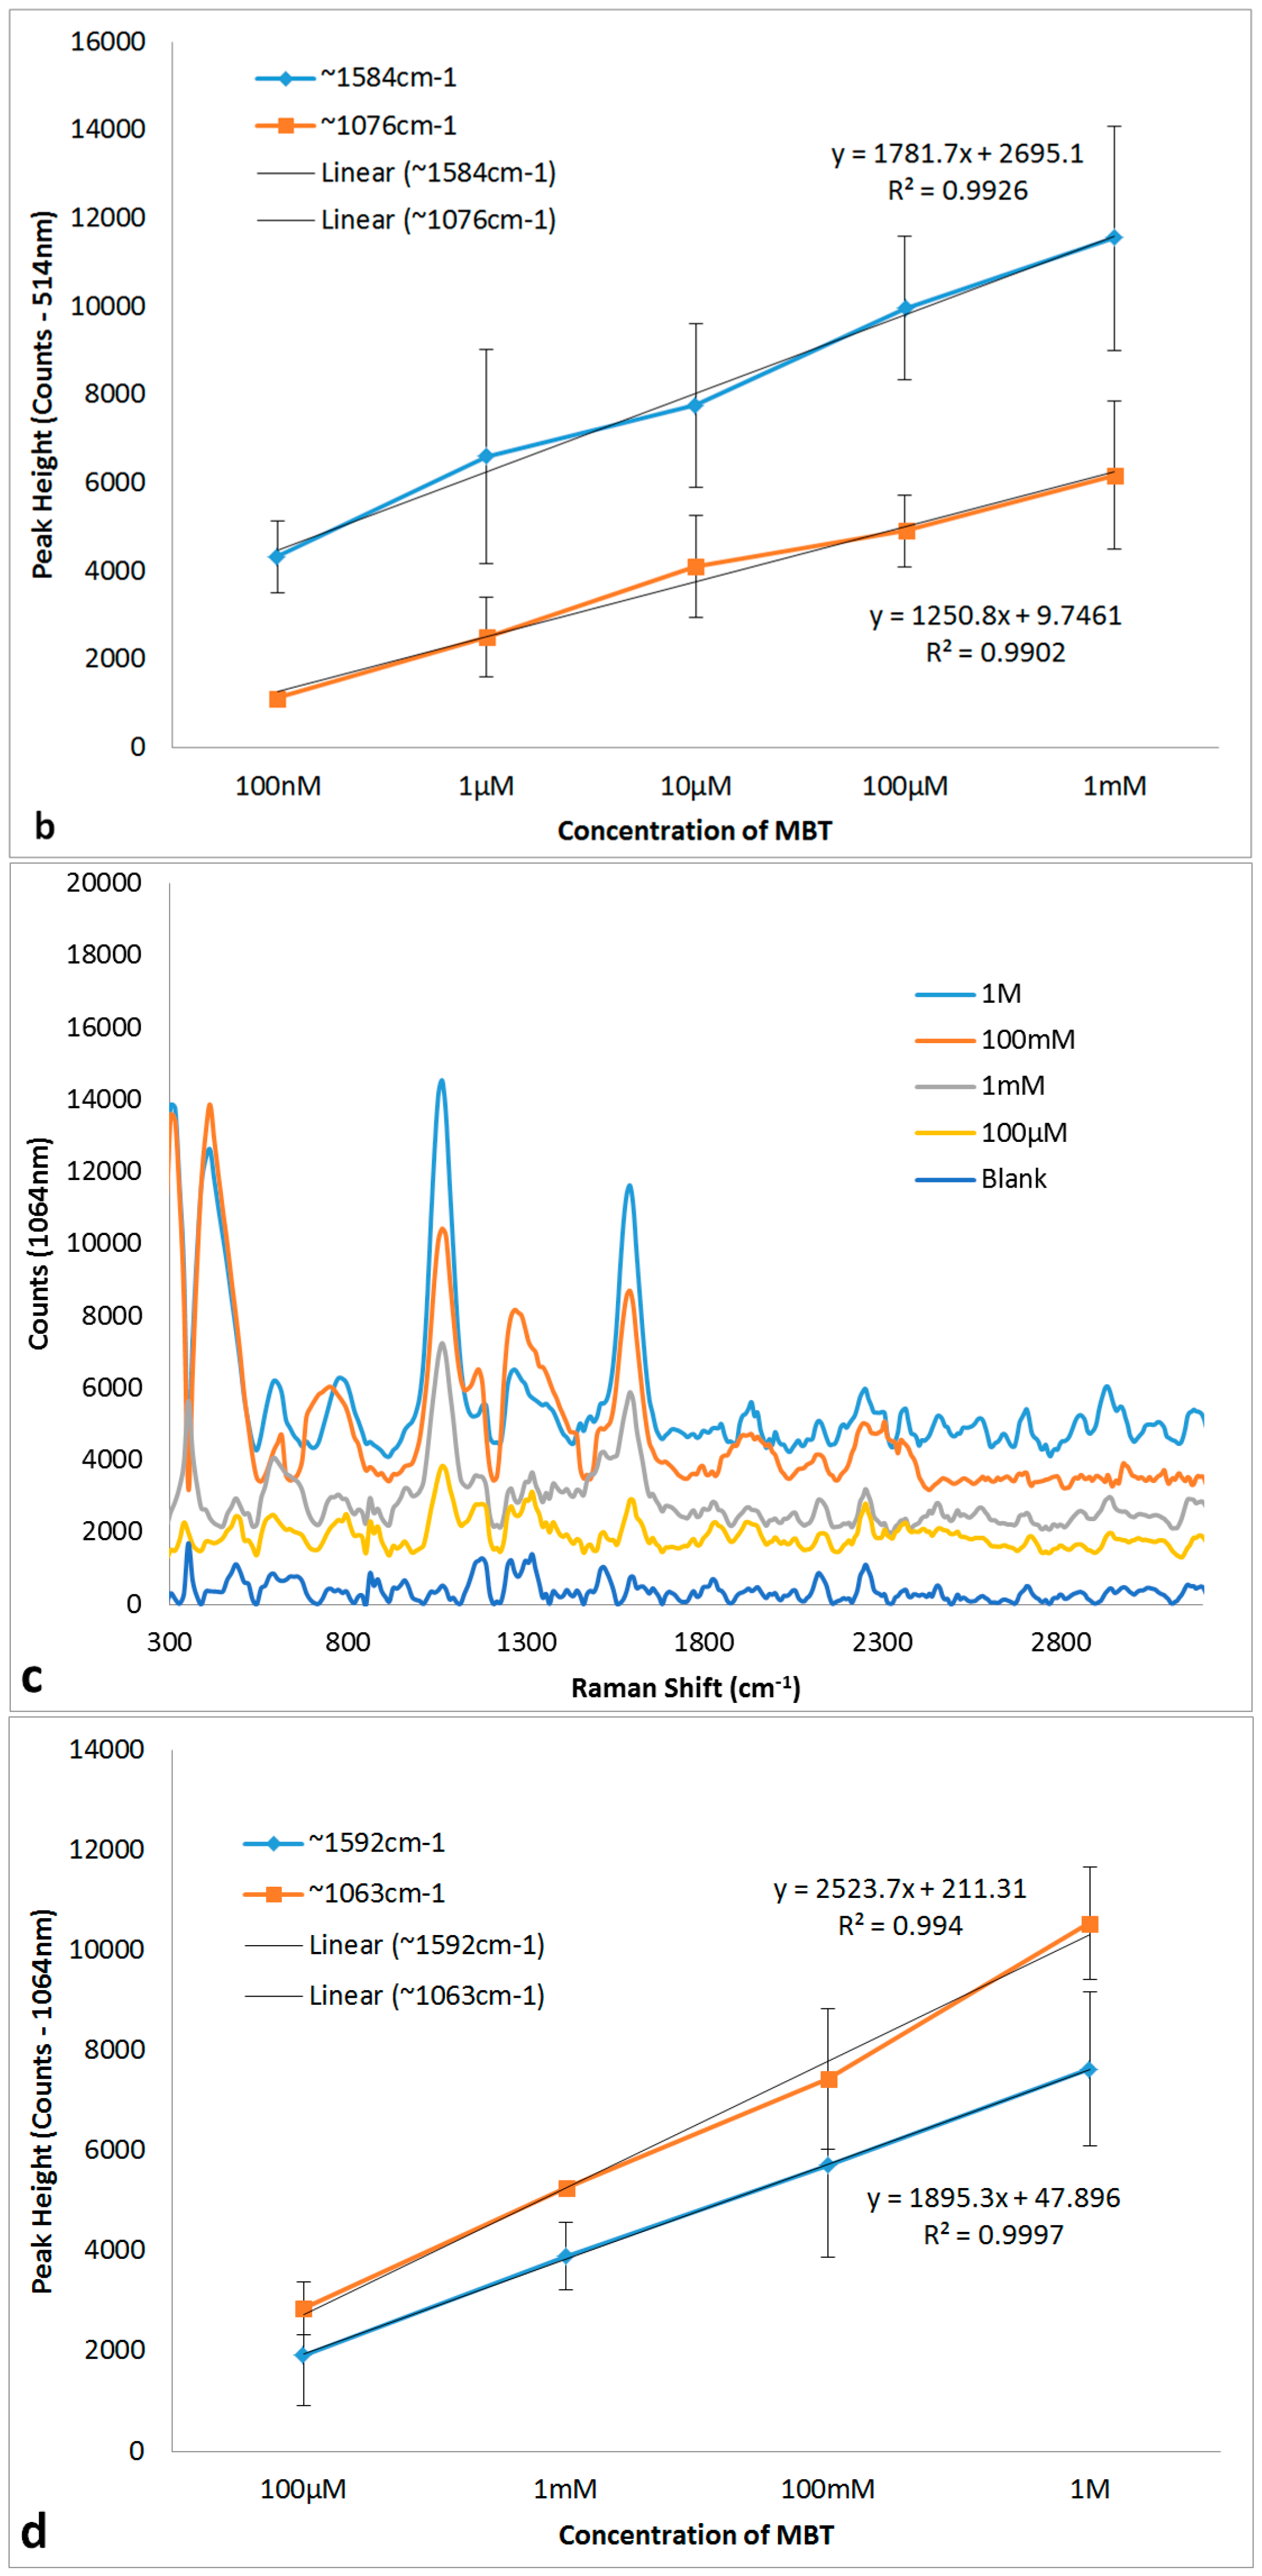
3.5. Quantitation of MBT Using SERs on 30 s NH4OH + 10 s HNO3 Ag Substrate
4. Conclusions
Acknowledgments
Author Contributions
Conflicts of Interest
References
- Betz, J.F.; Yu, W.W.; Cheng, Y.; White, I.M.; Rubloff, G.W. Simple SERS substrates: Powerful, portable, and full of potential. Phys. Chem. Chem. Phys. 2014, 16, 2224–2239. [Google Scholar] [CrossRef] [PubMed]
- Nuntawong, N.; Eiamchai, P.; Wong-ek, B.; Horprathum, M.; Limwichean, K.; Patthanasettakul, V.; Chindaudom, P. Shelf time effect on SERS effectiveness of silver nanorod prepared by OAD technique. Vacuum 2013, 88, 23–27. [Google Scholar] [CrossRef]
- Lin, X.-M.; Cui, Y.; Xu, Y.-H.; Ren, B.; Tian, Z.-Q. Surface-enhanced Raman spectroscopy: Substrate-related issues. Anal. Bioanal. Chem. 2009, 394, 1729–1745. [Google Scholar] [CrossRef] [PubMed]
- Song, C.; Abell, J.L.; He, Y.; Hunyadi Murph, S.; Cui, Y.; Zhao, Y. Gold-modified silver nanorod arrays: Growth dynamics and improved SERS properties. J. Mater. Chem. 2012, 22, 1150–1159. [Google Scholar] [CrossRef]
- Wu, W.; Liu, L.; Dai, Z.; Liu, J.; Yang, S.; Zhou, L.; Xiao, X.; Jiang, C.; Roy, V.A. Low-Cost, Disposable, Flexible and Highly Reproducible Screen Printed SERS Substrates for the Detection of Various Chemicals. Sci. Rep. 2015, 5, 10208. [Google Scholar] [CrossRef] [PubMed]
- Le Ru, E.C.; Etchegoin, P.G. Chapter 1—A quick overview of surface-enhanced Raman spectroscopy. In Principles of Surface-Enhanced Raman Spectroscopy; Elsevier: Amsterdam, The Netherlands, 2009; pp. 1–27. [Google Scholar]
- Kneipp, K.; Wang, Y.; Kneipp, H.; Perelman, L.T.; Itzkan, I.; Dasari, R.R.; Feld, M.S. Single Molecule Detection Using Surface-Enhanced Raman Scattering (SERS). Physical Rev. Lett. 1997, 78, 1667–1670. [Google Scholar] [CrossRef]
- Nie, S.; Emory, S.R. Probing Single Molecules and Single Nanoparticles by Surface-Enhanced Raman Scattering. Science 1997, 275, 1102–1106. [Google Scholar] [CrossRef] [PubMed]
- Alvarez-Puebla, R.A.; Liz-Marzán, L.M. SERS-Based Diagnosis and Biodetection. Small 2010, 6, 604–610. [Google Scholar] [CrossRef] [PubMed]
- Chen, L.; Choo, J. Recent advances in surface-enhanced Raman scattering detection technology for microfluidic chips. Electrophoresis 2008, 29, 1815–1828. [Google Scholar] [CrossRef] [PubMed]
- Fleischmann, M.; Hendra, P.J.; McQuillan, A.J. Raman spectra of pyridine adsorbed at a silver electrode. Chem. Phys. Lett. 1974, 26, 163. [Google Scholar] [CrossRef]
- Wet Chemical Etching. 2013. Available online: http://www.microchemicals.com/technical_information/wet_etching.pdf (accessed on 2 June 2016).
- Tarn, W.H.; Walker, P. CRC Handbook of Metal. Etchants; CRC Press: London, UK, 1990. [Google Scholar]
- Miller, S.K.; Baiker, A.; Meier, M.; Wokaun, A. Surface-enhanced Raman scattering and the preparation of copper substrates for catalytic studies. J. Chem. Soc. Faraday Trans. 1 1984, 80, 1305–1312. [Google Scholar] [CrossRef]
- Xue, G.; Dong, J.; Zhang, M. Surface-Enhanced Raman Scattering (SERS) and Surface-Enhanced Resonance Raman Scattering (SERRS) on HNO3-Roughened Copper Foil. Appl. Spectrosc. 1991, 45, 756–759. [Google Scholar] [CrossRef]
- Xue, G.; Dong, J. Stable silver substrate prepared by the nitric acid etching method for a surface-enhanced Raman scattering study. Anal. Chem. 1991, 63, 2393–2397. [Google Scholar] [CrossRef]
- Ruperez, A.; Laserna, J.J. Surface-enhanced Raman sensor. Analusis 1995, 23, 91–93. [Google Scholar]
- Ruperez, A.; Laserna, J.J. Surface-enhanced Raman spectrometry of triamterene on a silver substrate prepared by the nitric acid etching method. Talanta 1997, 44, 213–220. [Google Scholar] [CrossRef]
- Pérez, R.; Rupérez, A.; Rodriguez-Castellón, E.; Laserna, J.J. Study of experimental parameters for improved adsorbate detectability in SERS using etched silver substrates. Surf. Interface Anal. 2000, 30, 592–596. [Google Scholar] [CrossRef]
- Sharma, B.; Frontiera, R.R.; Henry, A.-I.; Ringe, E.; Van Duyne, R.P. SERS: Materials, applications, and the future. Mater. Today 2012, 15, 16–25. [Google Scholar] [CrossRef]
- Stiles, P.L.; Dieringer, J.A.; Shah, N.C.; Van Duyne, R.P. Surface-Enhanced Raman Spectroscopy. Annu. Rev. Anal. Chem. 2008, 1, 601–626. [Google Scholar] [CrossRef] [PubMed]
- Moskovits, M. Surface-enhanced Raman spectroscopy: A brief retrospective. J. Raman Spectrosc. 2005, 36, 485. [Google Scholar] [CrossRef]
- Otto, A.; Mrozek, I.; Grabhorn, H.; Akemann, W. Surface-enhanced Raman scattering. J. Phys. Condens. Matter 1992, 4, 1143–1212. [Google Scholar] [CrossRef]
- Baker, G.A.; Moore, D.S. Progress in plasmonic engineering of surface-enhanced Raman-scattering substrates toward ultra-trace analysis. Anal. Bioanal. Chem. 2005, 382, 1751. [Google Scholar] [CrossRef] [PubMed]
- Surface Texture Parameters, Zygo, Electronic Resource No. OMP-0514C 04/2013. Available online: http://www.zygo.com/library/papers/SurfText.pdf (accessed on 2 June 2016).
- Wang, N.; Burugapalli, K.; Song, W.; Halls, J.; Moussy, F.; Ray, A.; Zheng, Y. Electrospun fibro-porous polyurethane coatings for implantable glucose biosensors. Biomaterials 2013, 34, 888–901. [Google Scholar] [CrossRef] [PubMed]
- Wang, N.; Burugapalli, K.; Song, W.; Halls, J.; Moussy, F.; Zheng, Y.; Ma, Y.; Wu, Z.; Li, K. Tailored fibro-porous structure of electrospun polyurethane membranes, their size-dependent properties and trans-membrane glucose diffusion. J. Memb. Sci. 2013, 427, 207–217. [Google Scholar] [CrossRef] [PubMed]
- Wang, N.; Burugapalli, K.; Wijesuriya, S.; Far, M.Y.; Song, W.; Moussy, F.; Zheng, Y.; Ma, Y.; Wu, Z.; Li, K. Electrospun polyurethane-core and gelatin-shell coaxial fibre coatings for miniature implantable biosensors. Biofabrication 2014, 6, 015002. [Google Scholar] [CrossRef] [PubMed]
- Muniz-Miranda, M.; Gellini, C.; Innocenti, M. SERS Spectroscopy and Microscopy. In Raman Spectroscopy for Nanomaterials Characterization; Challa, S.S.R.K., Ed.; Springer: Heidelberg/Berlin, Germany, 2012; pp. 553–586. [Google Scholar]
- Muniz-Miranda, M.; Gellini, C.; Salvi, P.R.; Innocenti, M.; Pagliai, M.; Schettino, V. Fabrication of nanostructured silver substrates for surface-enhanced Raman spectroscopy. J. Nanopart. Res. 2011, 13, 5863–5871. [Google Scholar] [CrossRef]
- Goh, M.S.; Lee, Y.H.; Pedireddy, S.; Phang, I.Y.; Tjiu, W.W.; Tan, J.M.R. A Chemical Route to Increase Hot Spots on Silver Nanowires for Surface-Enhanced Raman Spectroscopy Application. Langmuir 2012, 28, 14441–14449. [Google Scholar] [CrossRef] [PubMed]
- Lowe, H.F.; Spindloe, C. White light interferometric profilometry of surface structured glass for high power laser microtargets; Chapter 7 in Laser Science and Development, Target Fabrication. In Central Laser Facility, Annual Report (RAL-TR-2007–025); Rutherford Appleton Laboratory: Didcot, UK, 2006/2007; pp. 249–252. [Google Scholar]
- Rolinski, E.; Konieczny, A.; Sharp, G. Nature of Surface Changes in Stamping Tools of Gray and Ductile Cast Iron During Gas and Plasma Nitrocarburizing. J. Mater. Eng. Perform. 2009, 18, 1052–1059. [Google Scholar] [CrossRef]
- Lai, Y.; Wang, J.; He, T.; Sun, S. Improved Surface Enhanced Raman Scattering for Nanostructured Silver on Porous Silicon for Ultrasensitive Determination of 2,4,6-Trinitrotoluene. Anal. Lett. 2014, 47, 833–842. [Google Scholar] [CrossRef]
- Jeanmaire, D.L.; Van Duyne, R.P. Surface raman spectroelectrochemistry: Part I. Heterocyclic, aromatic, and aliphatic amines adsorbed on the anodized silver electrode. J. Electroanal. Chem. Interfacial Electrochem. 1977, 84, 1–20. [Google Scholar] [CrossRef]
- Lu, Y.; Xue, G. Study of surface catalytic photochemical reaction by using conventional and Fourier transform surface enhanced Raman scattering. Appl. Surf. Sci. 1998, 125, 157–162. [Google Scholar] [CrossRef]
- Jiajia, M.; Jiafang, L.; Wuxia, L.; Qiang, L.; Changzhi, G. Hollow metallic pyramid plasmonic structures fabricated by direct laser writing and electron beam evaporation. Microelectr. Eng. 2013, 110, 307–310. [Google Scholar]
- Valley, N.; Greeneltch, N.; Van Duyne, R.P.; Schatz, G.C. A Look at the Origin and Magnitude of the Chemical Contribution to the Enhancement Mechanism of Surface-Enhanced Raman Spectroscopy (SERS): Theory and Experiment. J. Phys. Chem. Lett. 2013, 4, 2599–2604. [Google Scholar] [CrossRef]
- Li, H.; Hanson, C.; Fuchs, J.A.; Woodward, C.; Thomas, G.J. Determination of the pKa values of active-center cysteines, cysteines-32 and -35, in Escherichia coli thioredoxin by Raman spectroscopy. Biochemistry 1993, 32, 5800–5808. [Google Scholar] [CrossRef] [PubMed]
- Hommel, E.L.; Allen, H.C. The air-liquid interface of benzene, toluene, m-xylene, and mesitylene: A sum frequency, Raman, and infrared spectroscopic study. Analyst 2003, 128, 750–755. [Google Scholar] [CrossRef] [PubMed]
- Chen, J.; Yang, W.; Dick, K.; Deppert, K.; Xu, H.Q.; Samuelson, L.; Xu, H. Tip-enhanced Raman scattering of p-thiocresol molecules on individual gold nanoparticles. Appl. Phys. Lett. 2008, 92, 093110. [Google Scholar] [CrossRef]
- Sharma, B.; Fernanda Cardinal, M.; Kleinman, S.L.; Greeneltch, N.G.; Frontiera, R.R.; Blaber, M.G.; Schatz, G.C.; Van Duyne, R.P. High-performance SERS substrates: Advances and challenges. MRS Bull. 2013, 38, 615–624. [Google Scholar] [CrossRef]
- Zhang, N.; Liu, K.; Liu, Z.; Song, H.; Zeng, X.; Ji, D.; Cheney, A.; Jiang, S.; Gan, Q. Ultrabroadband Metasurface for Efficient Light Trapping and Localization: A Universal Surface-Enhanced Raman Spectroscopy Substrate for “All” Excitation Wavelengths. Adv. Mater. Interfaces 2015, 2, 1500142. [Google Scholar] [CrossRef]


| Rt (PV) (µm) | Rp (µm) | Rv (µm) | Rq (RMS) (µm) | Ra (µm) | (Rq−Ra)/Ra (%) | |
|---|---|---|---|---|---|---|
| Native | 11.15 ± 0.89 | 5.83 ± 0.64 | 5.31 ± 0.53 | 1.27 ± 0.17 | 0.95 ± 0.10 | 32.20 |
| 30 s NH4OH | 12.04 ± 1.15 | 5.99 ± 0.84 | 6.06 ± 0.67 | 1.02 ± 0.19 | 0.77 ± 0.15 | 31.90 |
| 10 s HNO3 | 14.63 ± 2.09 | 6.48 ± 1.01 | 8.15 ± 1.10 | 1.33 ± 0.27 | 1.03 ± 0.21 | 28.96 |
| 2 m HNO3 | 10.04 ± 0.59 | 4.97 ± 0.39 | 5.06 ± 0.23 | 1.23 ± 0.10 | 0.96 ± 0.09 | 27.51 |
| 30 s NH4OH + 10 s HNO3 | 13.09 ± 0.98 | 6.05 ± 0.58 | 7.03 ± 0.52 | 1.40 ± 0.30 | 1.05 ± 0.21 | 33.52 |
| 30 s NH4OH + 2 m HNO3 | 14.08 ± 1.92 | 5.98 ± 0.98 | 8.10 ± 1.10 | 1.95 ± 0.41 | 1.39 ± 0.30 | 40.08 |
| Rt (PV) (µm) | Rp (µm) | Rv (µm) | Rq (RMS) (µm) | Ra (µm) | (Rq−Ra)/Ra (%) | |
|---|---|---|---|---|---|---|
| Native | 9.59 ± 0.75 | 4.39 ± 0.25 | 5.20 ± 0.59 | 1.20 ± 0.11 | 0.93 ± 0.08 | 29.18 |
| 30 s NH4OH | 12.99 ± 1.33 | 7.12 ± 0.59 | 5.87 ± 0.93 | 1.53 ± 0.15 | 1.19 ± 0.12 | 28.62 |
| 10 s HNO3 | 14.79 ± 1.17 | 6.88 ± 0.97 | 7.90 ± 0.35 | 1.29 ± 0.04 | 1.00 ± 0.03 | 29.75 |
| 2 m HNO3 | 11.69 ± 1.94 | 6.02 ± 1.33 | 5.67 ± 0.80 | 1.35 ± 0.23 | 1.07 ± 0.18 | 26.30 |
| 30 s NH4OH + 10 s HNO3 | 15.18 ± 1.55 | 7.23 ± 0.86 | 7.95 ± 0.89 | 1.58 ± 0.19 | 1.19 ± 0.14 | 32.66 |
| 30 s NH4OH + 2 m HNO3 | 12.69 ± 0.48 | 5.67 ± 0.40 | 7.02 ± 0.25 | 1.40 ± 0.11 | 1.09 ± 0.08 | 29.11 |
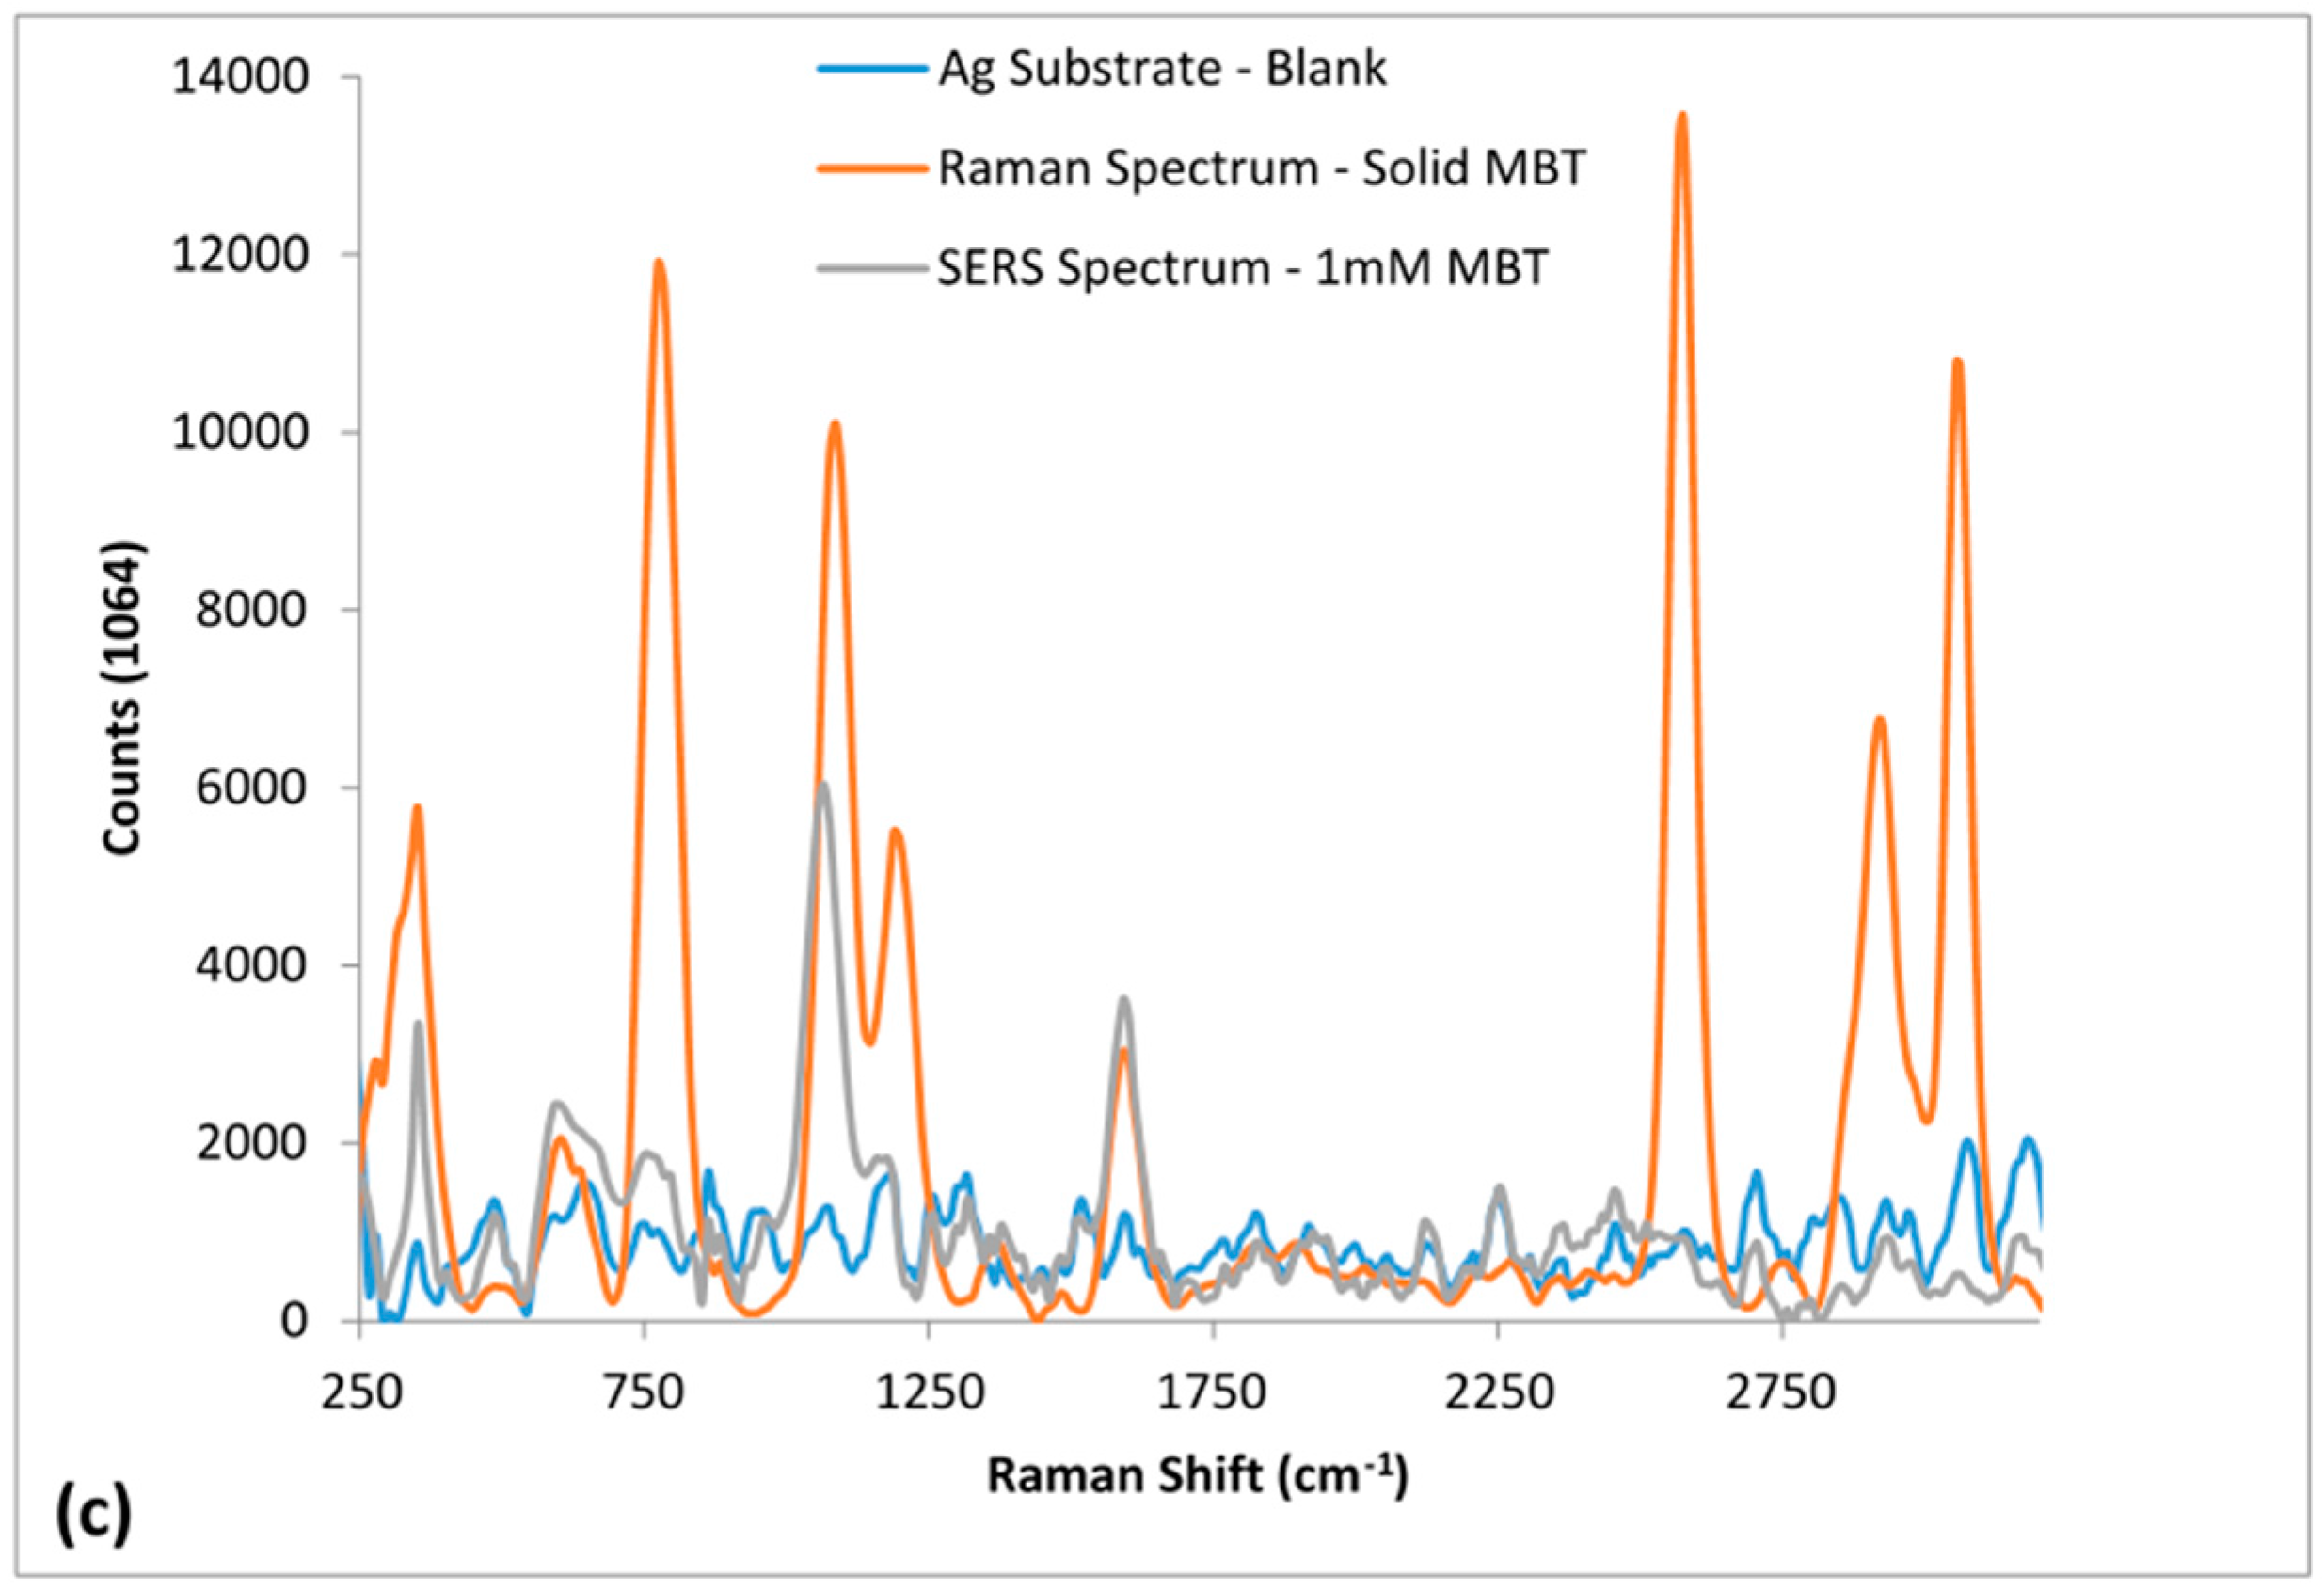
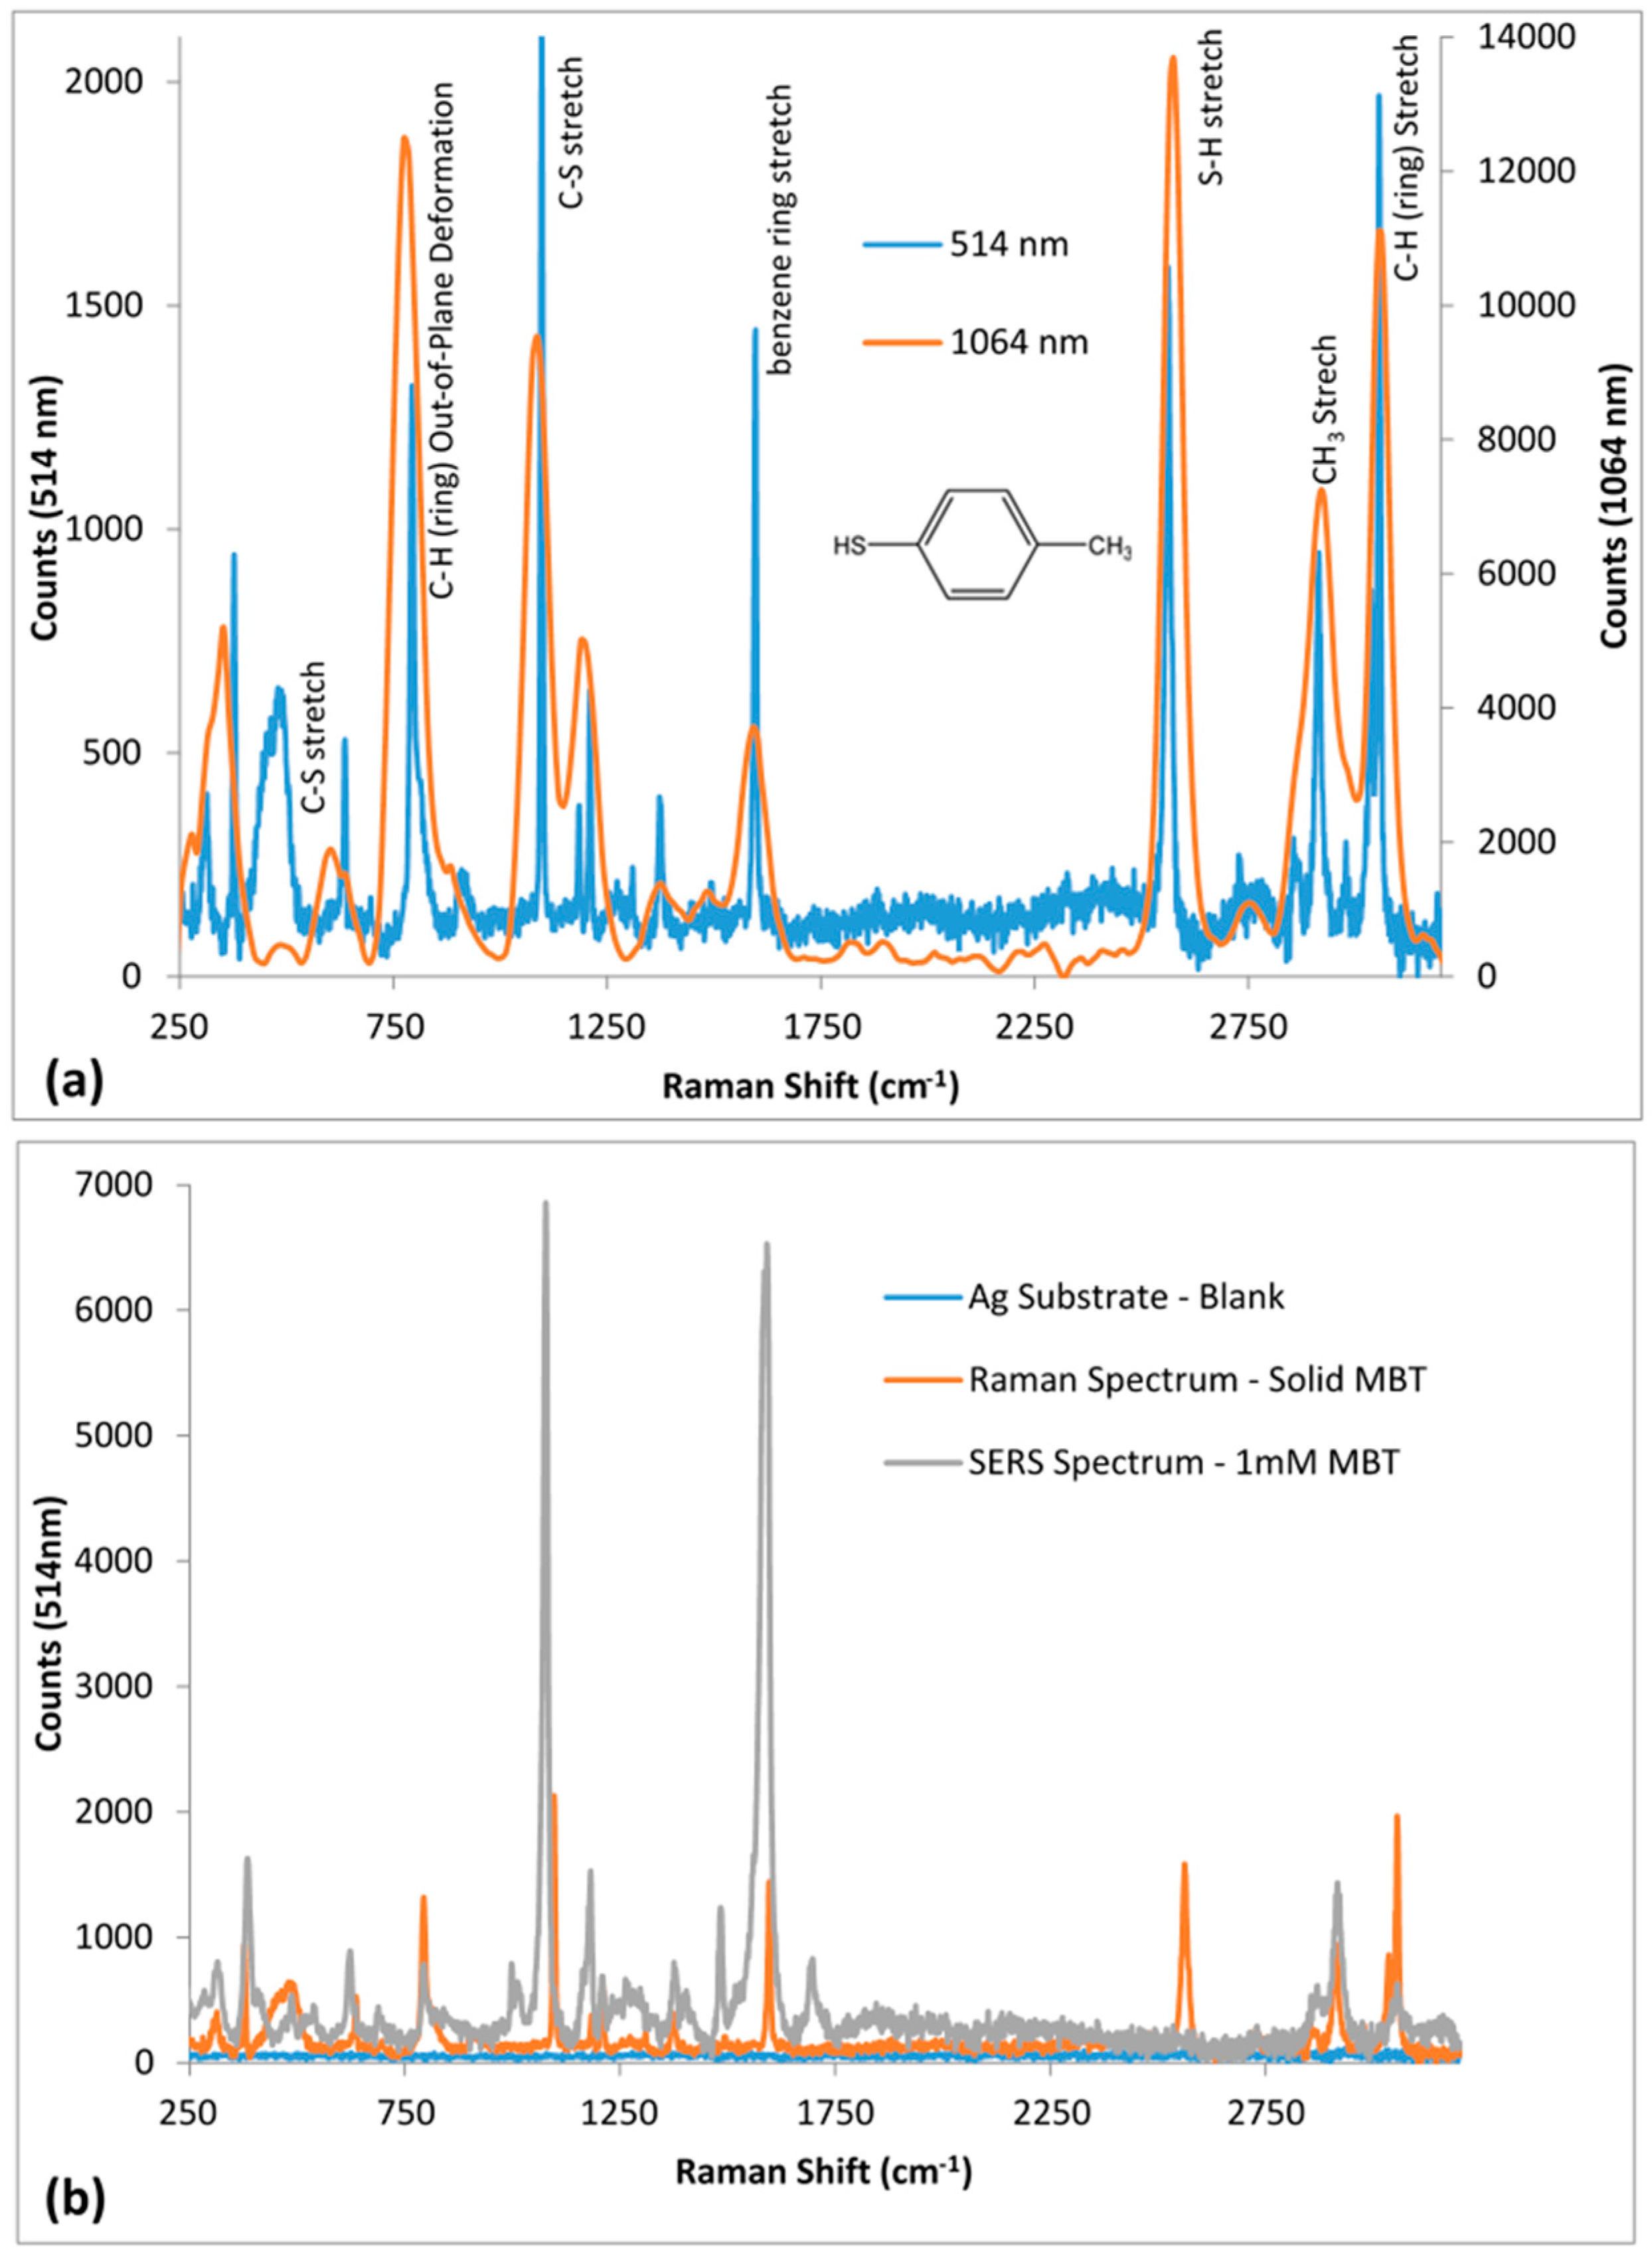
| 514 nm Raman Peaks (cm−1) | 1064 nm Raman Peaks (cm−1) | Peak Assignment | ||
|---|---|---|---|---|
| Raman Spectrum | SERS Spectrum | Raman Spectrum | SERS Spectrum | |
| 312 | 314 | τrCC [35] | ||
| 377 | 388 | 347 | 353 | δrCC [34,36] |
| 484 | γrCC [34,36] | |||
| 634 | 623 | 609 | 608 | υCS [34] |
| 794 | 791 | 781 | τrCH [34] | |
| 913 | 995, 1014 | γrCH [34] | ||
| 1097 | 1076 | 1085 | 1063 | υCS [34,35,36,37,38] |
| 1184 | 1180 | 1198 | υrCC [34] | |
| 1209 | 1258 | υrCC [35] | ||
| υCH3 [35] | ||||
| 1309, 1374 | 1377 | 1372 | υCH3 [34,35] | |
| 1591 | 1483, 1584 | 1592 | 1592 | υrCC [34,35,36,37,38] |
| 2562 | 2573 | υSH [34,39] | ||
| 2727 | 2739 | δCH3 [34,40] | ||
| 2855, 2914 | 2919 | 2918 | υsCH3 [34,40] | |
| 2978 | υasCH3 [34,40] | |||
| 3036, 3056 | 3059 | υrCH [34,40] | ||
| 1076 cm−1 | 1595 cm−1 | |||||||
|---|---|---|---|---|---|---|---|---|
| Non-Heated | Heated | Non-Heated | Heated | |||||
| AI Counts | EF × 105 | AI Counts | EF × 105 | AI Counts | EF × 105 | AI Counts | EF × 105 | |
| Native Ag Substrate | 1728 ± 629 | 3.3 | 1209 ± 901 | 2.3 | 1883 ± 779 | 5.3 | 1087 ± 957 | 3.0 |
| 30 s NH4OH | 2104 ± 266 | 4.0 | 933 ± 414 | 1.8 | 1630 ± 126 | 4.6 | 815 ± 283 | 2.3 |
| 10 s HNO3 | 3506 ± 446 | 6.6 | 2352 ± 330 | 4.5 | 3656 ± 584 | 10.2 | 1876 ± 357 | 5.2 |
| 2 m HNO3 | 1035 ± 336 | 2.0 | 1884 ± 337 | 3.6 | 4672 ± 622 | 13.1 | 1563 ± 362 | 4.4 |
| 30 s NH4OH + 10 s HNO3 | 5825 ± 849 | 11.0 | 2093 ± 549 | 4.0 | 6027 ± 989 | 16.9 | 3166 ± 964 | 8.9 |
| 30 s NH4OH + 2 m HNO3 | 1994 ± 495 | 3.8 | 434 ± 109 | 0.8 | 2257 ± 540 | 6.3 | 476 ± 92 | 1.3 |
© 2016 by the authors; licensee MDPI, Basel, Switzerland. This article is an open access article distributed under the terms and conditions of the Creative Commons Attribution (CC-BY) license (http://creativecommons.org/licenses/by/4.0/).
Share and Cite
Wijesuriya, S.; Burugapalli, K.; Mackay, R.; Ajaezi, G.C.; Balachandran, W. Chemically Roughened Solid Silver: A Simple, Robust and Broadband SERS Substrate. Sensors 2016, 16, 1742. https://doi.org/10.3390/s16101742
Wijesuriya S, Burugapalli K, Mackay R, Ajaezi GC, Balachandran W. Chemically Roughened Solid Silver: A Simple, Robust and Broadband SERS Substrate. Sensors. 2016; 16(10):1742. https://doi.org/10.3390/s16101742
Chicago/Turabian StyleWijesuriya, Shavini, Krishna Burugapalli, Ruth Mackay, Godwin Chukwuebuka Ajaezi, and Wamadeva Balachandran. 2016. "Chemically Roughened Solid Silver: A Simple, Robust and Broadband SERS Substrate" Sensors 16, no. 10: 1742. https://doi.org/10.3390/s16101742