1. Introduction
Quantum tunneling composites (QTC) exhibiting very strong piezoresistive [
1,
2,
3,
4,
5,
6] as well as thermoresistive [
7,
8,
9,
10,
11] sensory properties undergone extensive research in the last five years. The initial discovery and coining of the term was done [
12,
13,
14,
15,
16] and brought the interest of a wide range of researchers. Initial focus was targeted towards tactile sensors for the robots [
2,
17,
18,
19,
20,
21] which require very high sensitivity, but, later, the interest moved towards thermistors.
The temperature coefficient of resistivity (TCR) of QTC was shown to be orders of magnitude better than the platinum [
22], which is the industry baseline, and, for some cases, is as high as 10%–40%/K [
9,
23]. However, those materials with giant temperature coefficients exhibit extremely non-linear and non-consistent behavior and are hard to accurately model and reproduce.
Composites presented in this article differ from the above as they use the graphene nanoplatelets [
24,
25] among other fillers as a basis for production. Graphene quantum tunneling composites (GQTC) are synthesized using two stage high-power milling process [
26,
27,
28], and are characterized by the critical filler density of the percolation curve [
29]. GQTC can be characterized by smooth conductance space which is more accurate than QTC [
30] and can be successfully modelled by invertible equations, which enables them to be reliably used as sensors. The materials’ behavior is analyzed both when used as a static sensor which is not disturbed by any external processes, as well as when operating as an element of a friction node which disturbs the measurement by stochastic or chaotic processes occurring on the contact. The purpose of the research is to validate the materials for the application as piezoresistive and thermoresistive sensors operating both in perturbed and non-perturbed environments. In order to analyze these materials and their behavior, a special measuring station (called electrotribotester) was designed which allows measuring a wide range of parameters of the materials.
Although both piezo and thermoresistive properties are known and widely described in many papers on what contributes to achieve good sensor material, only few works analyze and discuss piezoresistivness and thermoresistiveness at the same time. Comprehensive published knowledge of both abovementioned features discovers a full spectrum of sensory applications that are possible. Moreover, many investigators deeply analyze tribological performance of graphene nanocomposites [
31,
32] and explore friction and wear influence on electrical conductivity [
33,
34]. Nonetheless, most of the published experiments’ shortcomings are a lack of analysis of prototype conditions and phenomenons such as an influence of dynamic electrical contact.
This study fills the gap between aforementioned extensive research and discuss electrical characteristics of exceptional piezo and thermoresistive material undergoing shear forces due to friction. This work can be considered unique, as no research specifically targeting practical applications could be found.
2. Preparation and Internal Structure of the GQTC
The sensory GQTC consists of three main components: insulating matrix such as resin, one or more semiconductive sensory fillers and graphene. The process consists of high power dry-milling of the filler powder (CuO from Sigma Aldrich, V2O5 from Avantor Performance Materials) milled for 5 h, which reduces the grain size to ~200 nm in diameter. Then, resulting powder is high power milled for 15 min with graphene nanoplatelets (from Graphene Supermarket). The resulting powder is mixed with polyester resin NH91LV (from Milar Sp. z o.o., Grodzisk Mazowiecki, Poland) and homogenized by using a triple roller mill. The resulting paste is formed into a sensor in a two-part polytetrafluoroethylene mold. The element is thermally set in a temperature of 220 °C for 3 h.
The CuO and V
2O
5 fillers were chosen as they are well known for their thermosresistive and piezoresistive properties [
35,
36,
37,
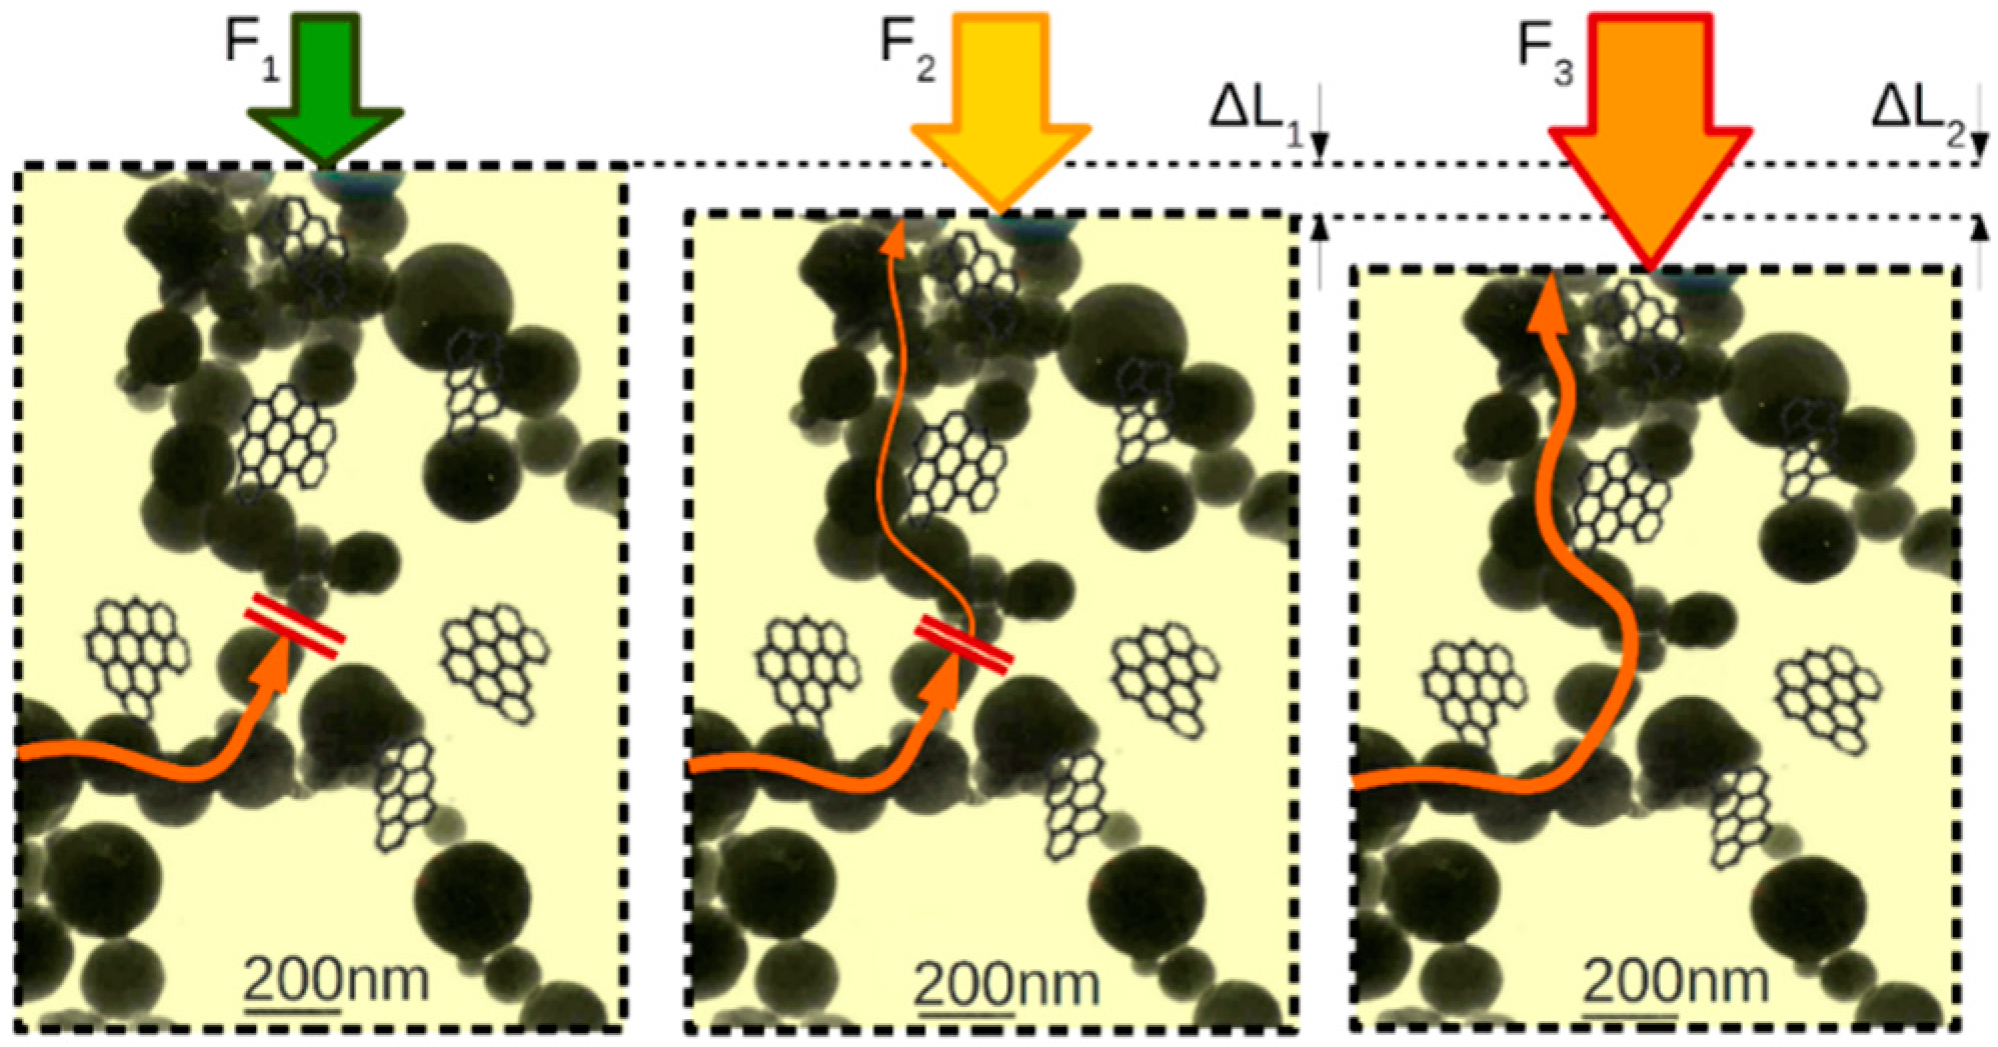
38]. The filler density is experimentally chosen to be close to, but below, the percolation threshold of two statistical contacts per grain. In such materials, even a small perturbation of the crystalline structure of the material significantly increases the probability of tunneling across the barrier of the insulating matrix. This process amplifies the sensory properties of the fillers, thanks to the change-induced statistical formation of conductive chains. Each barrier, within a potential conductive chain, can be in one of three states: no conductance, tunneling barrier (partial conductance), and contact (full conductance) (
Figure 1).
Figure 1.
Cartoon drawing depicting three states of conductive chain, changing due to elastic deformation of the structure: (left) No conductance; (middle) Tunneling barrier, partial conductance; (right) Contact and full conductance. Similar process of barrier thinning occurs with the increase of the temperature. Graphene nanoplatelets not to scale.
3. Experimental Design
The measuring station, called an electrotribotester, is a device which allows for measuring the changes in the conductivity of the GQTC sample when subjected to a range of temperatures, external pressures, tangential forces and wear. Such a device allows analysis of the material as a function of the standard parameters of a friction node (pressure, velocity, temperature: PvT), extending it with a range of related signals. The device can operate in two main modes:
static: performing measurements of conductivity, admittance, I-V curve as a function of temperature and pressure.
dynamic: subjecting the sample to the wear process, performing measurements of conductivity, admittance, I-V curve as well as temperature (shaft’s surface temperature measured by pyrometer and two thermocouples measuring the sample), pressure, vibrations (two 2D accelerometers), tangential force (the tensometer), rotational speed of the shaft as well as thickness of the sample as a function of time.
The goal of performing both static and dynamic measurements is to research the difference of material’s behavior when subjected to forces which alter the internal structure (internal stresses of the material) and contact conductance, and to test the applicability of the material as a sensor.
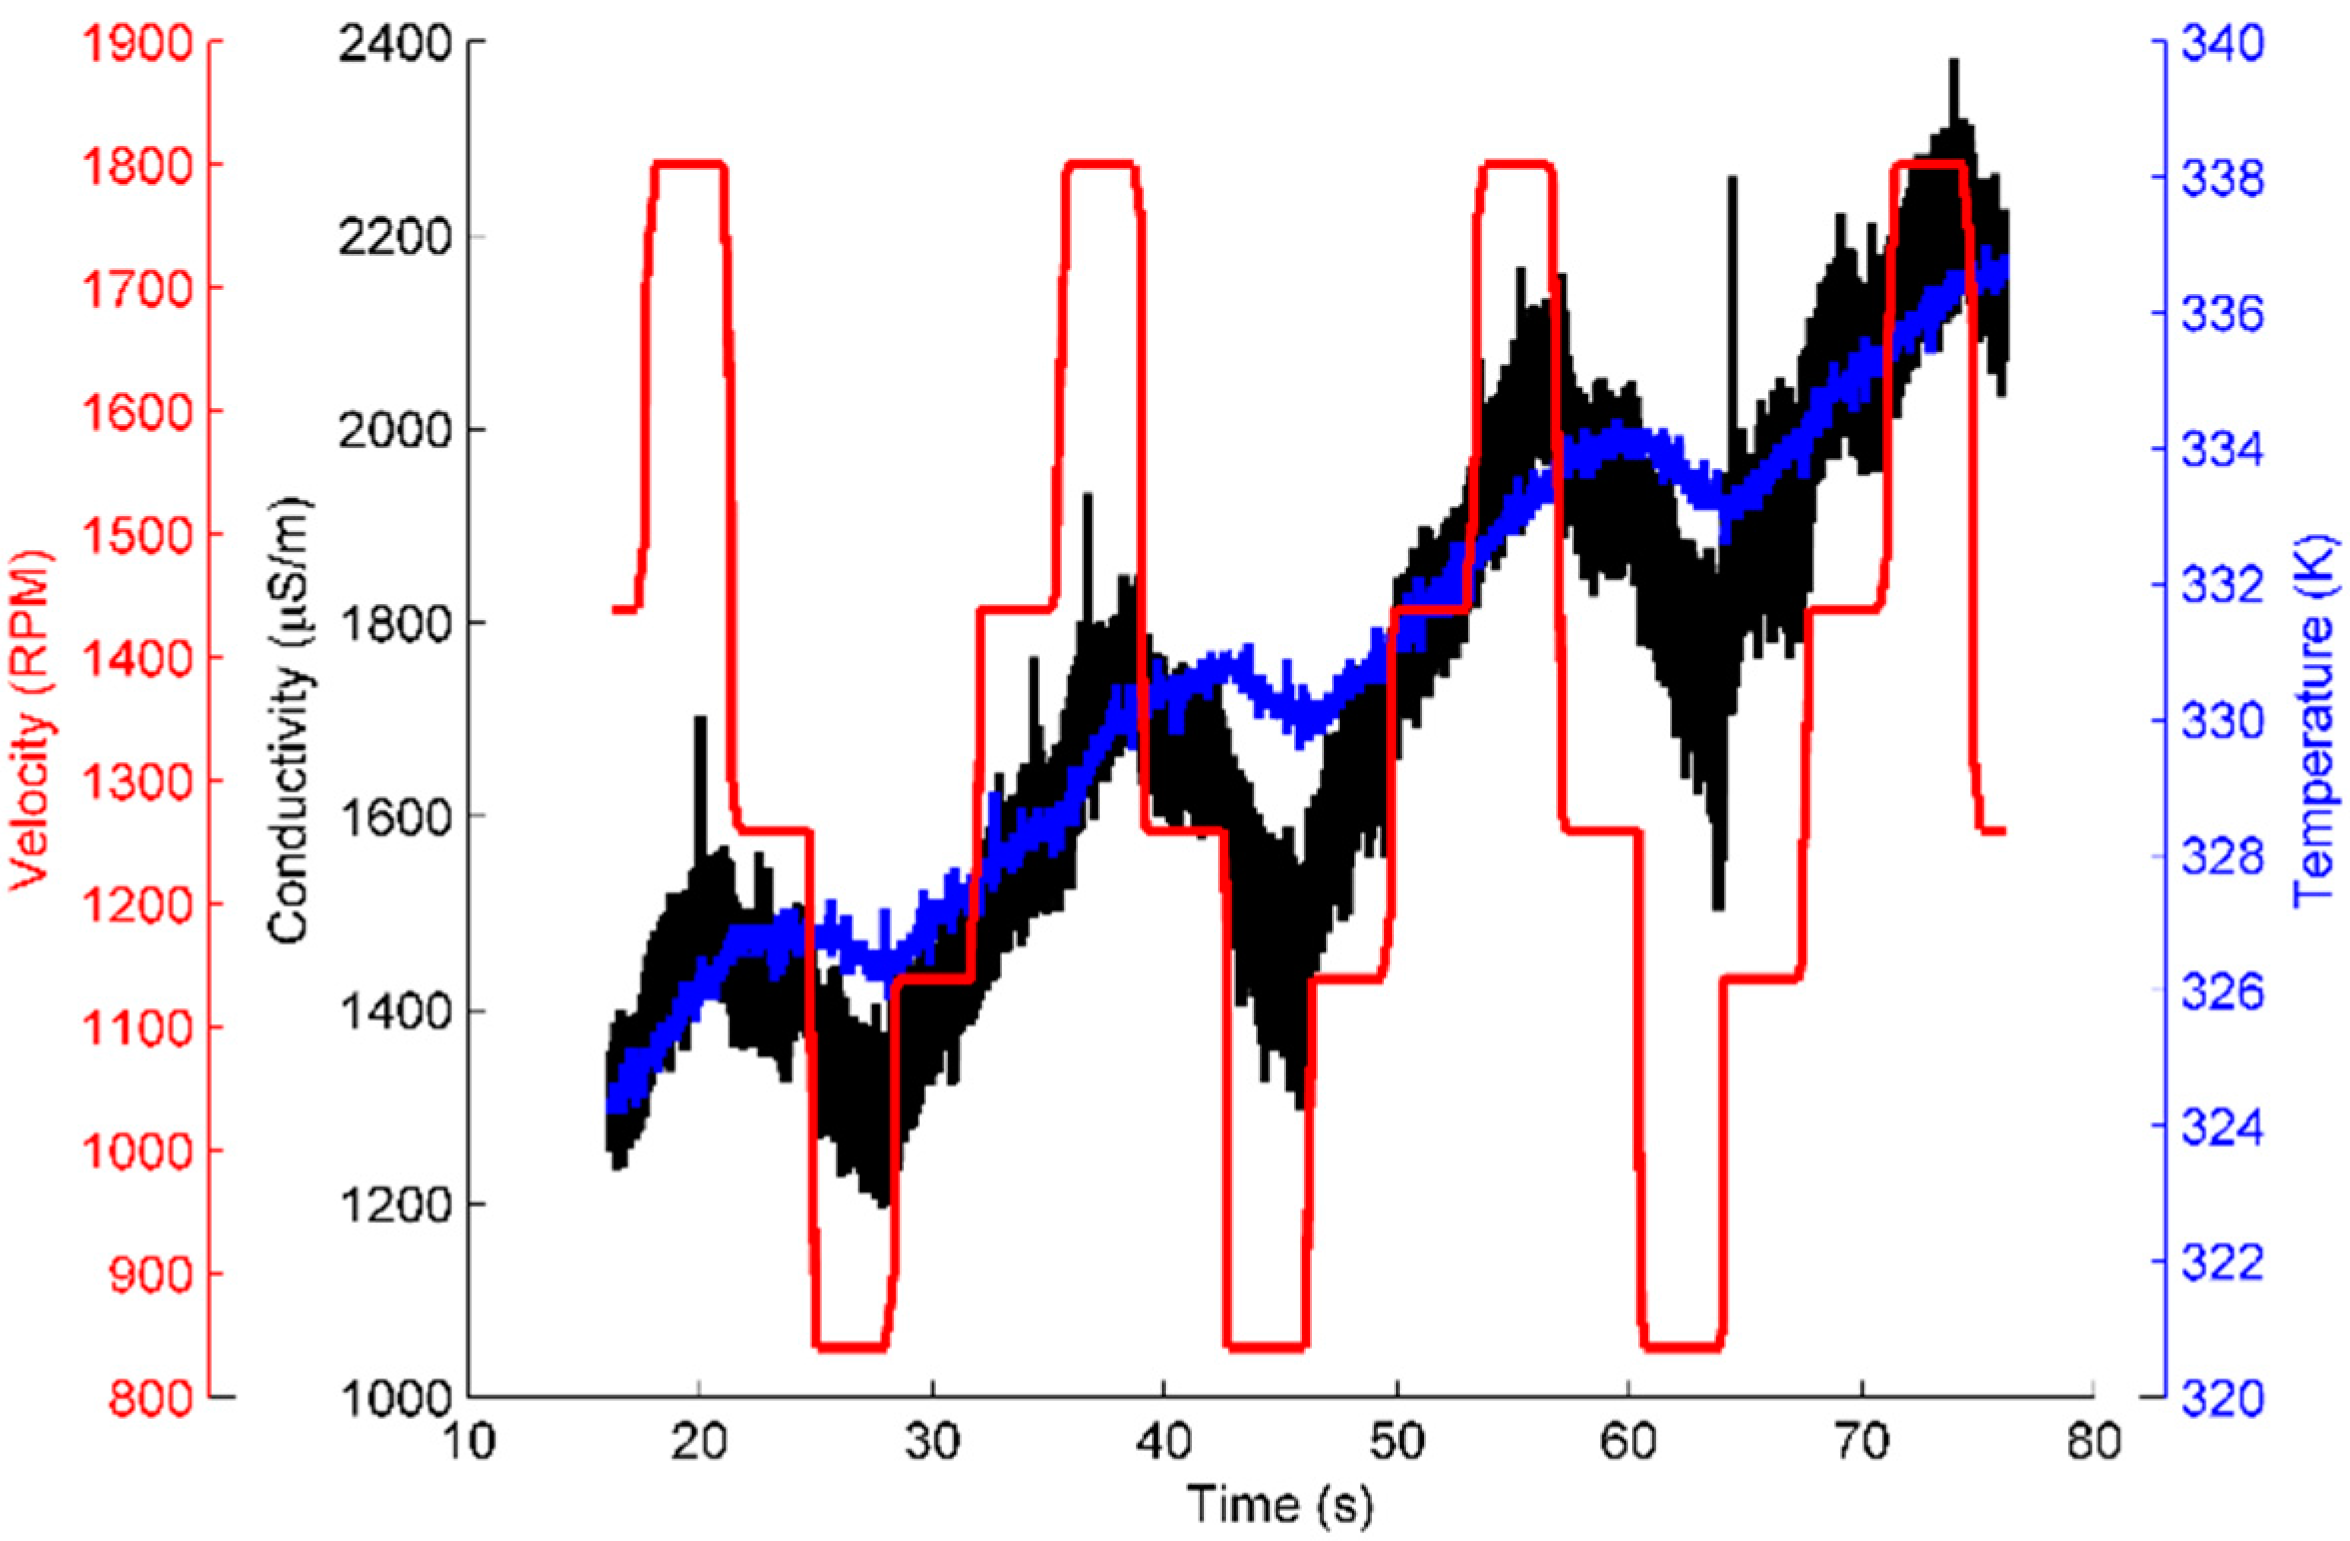
Figure 2 shows a strong correlation between conductivity, temperature and rotational velocity (which changes the tangential force caused by the friction): as the temperature rises, the conductivity rises. The relationship between the conductivity and rotational velocity can be most clearly seen for times from 65 to 75 s, where the conductance clearly changes in a step-like fashion, as the rotational velocity is. It should be noted that the conductivity changes lead changes in the temperature, which is due to temperature having a slower response time caused by the heat capacity of the material.
Figure 2.
An example of a dynamic measurement done on the electrotribotester, with measured conductivity, temperature and rotational velocity of the shaft causing the wear.
Figure 2.
An example of a dynamic measurement done on the electrotribotester, with measured conductivity, temperature and rotational velocity of the shaft causing the wear.
4. Analysis and Modelling of the Conductivity-PvT Space
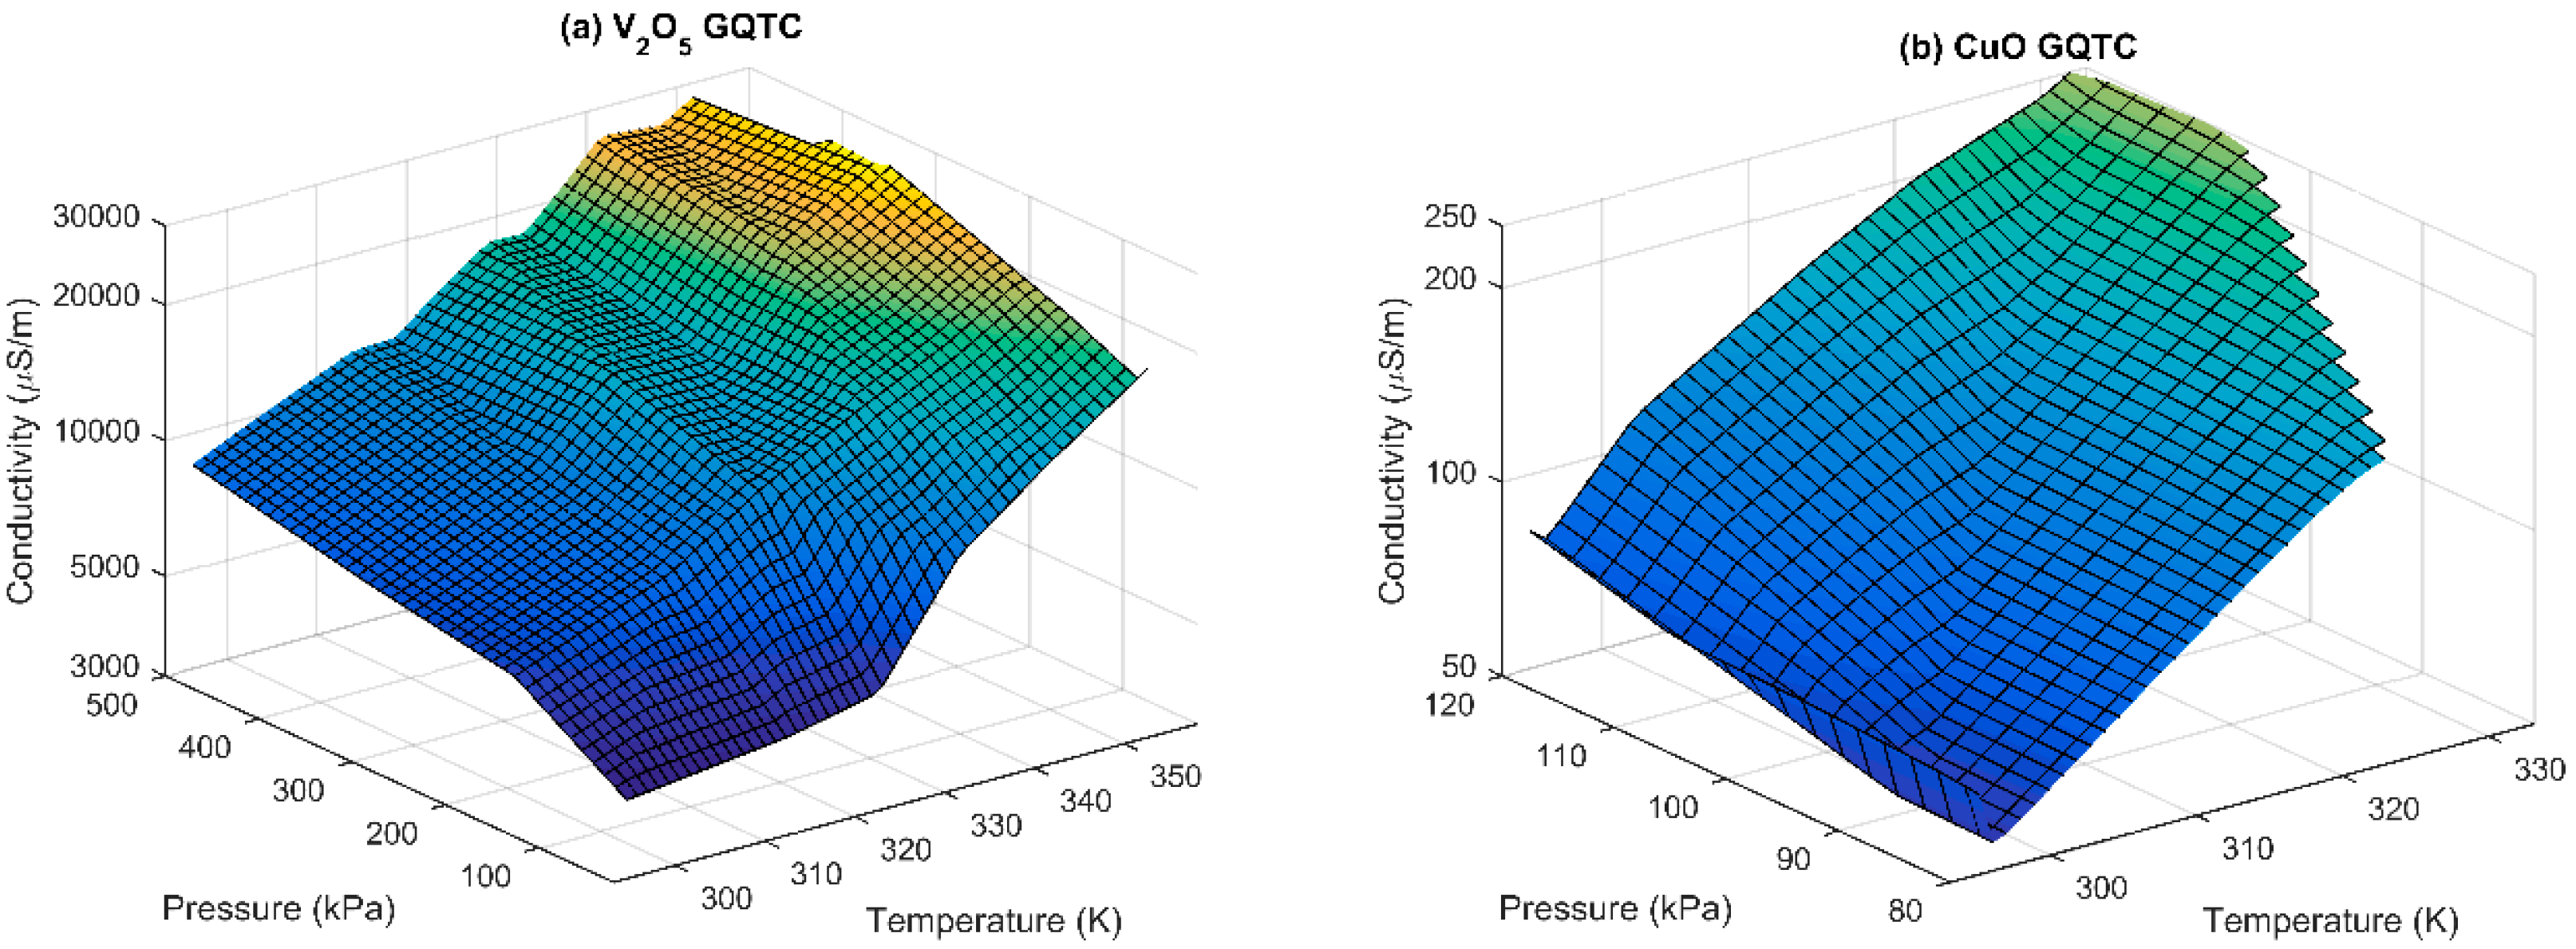
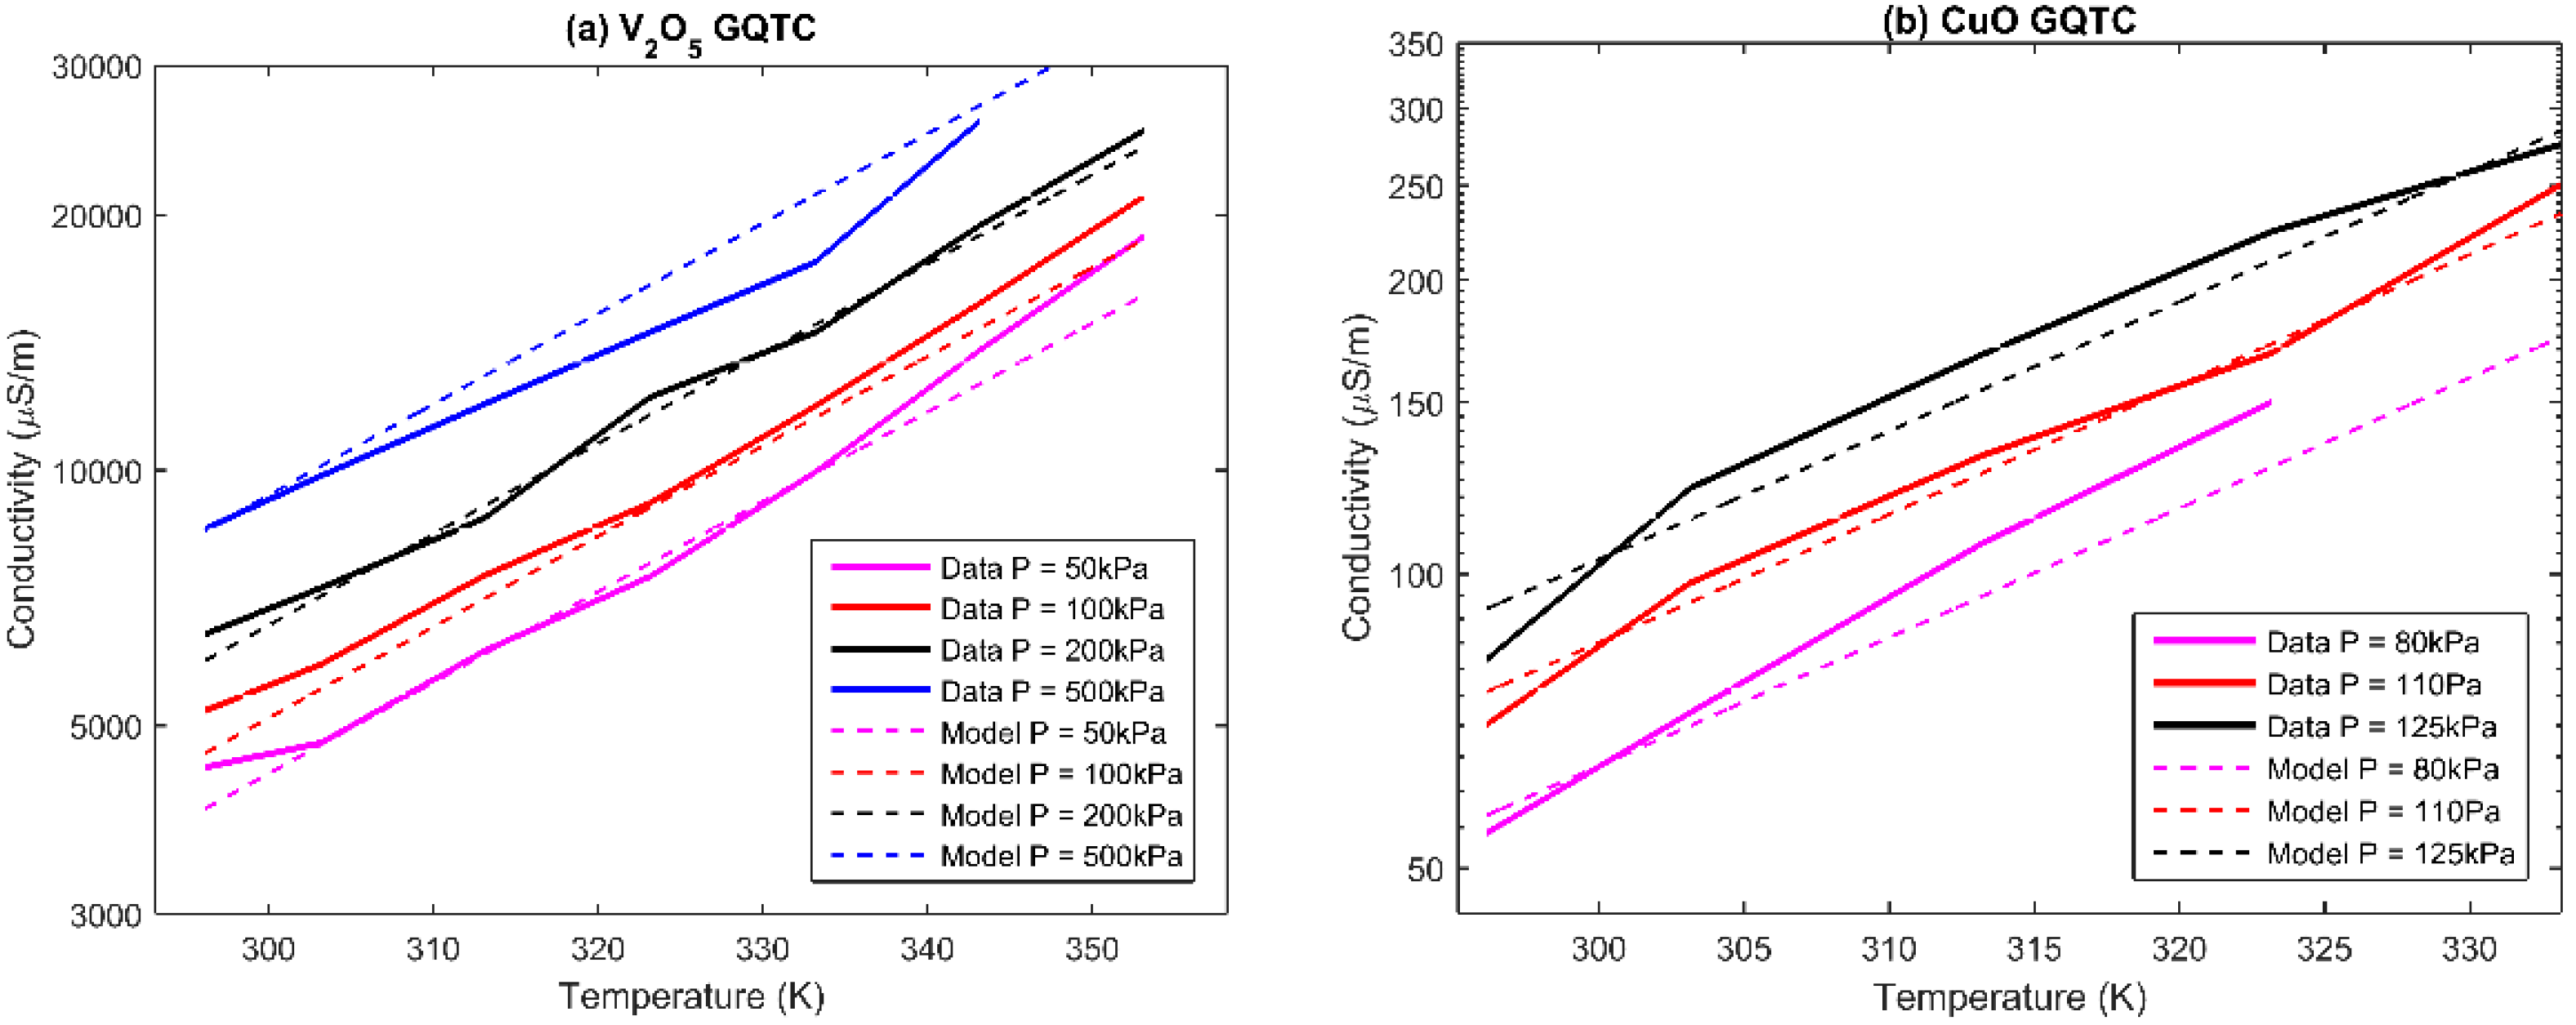
Due to the exponential trend of the process of forming of the conductivity chains, the data is analyzed in the logarithmic conductivity space. This transformation linearizes the space (
Figure 3), which makes the modelling of the data significantly simpler. Observed conductivity (in log space) of CuO and V
2O
5 GQTC is semi-linearly increasing both for the temperature and pressure.
Figure 3.
Observed (measured) conductivity σ(P,T) of (a) V2O5; and (b) CuO GQTC for static measurements.
Figure 3.
Observed (measured) conductivity σ(P,T) of (a) V2O5; and (b) CuO GQTC for static measurements.
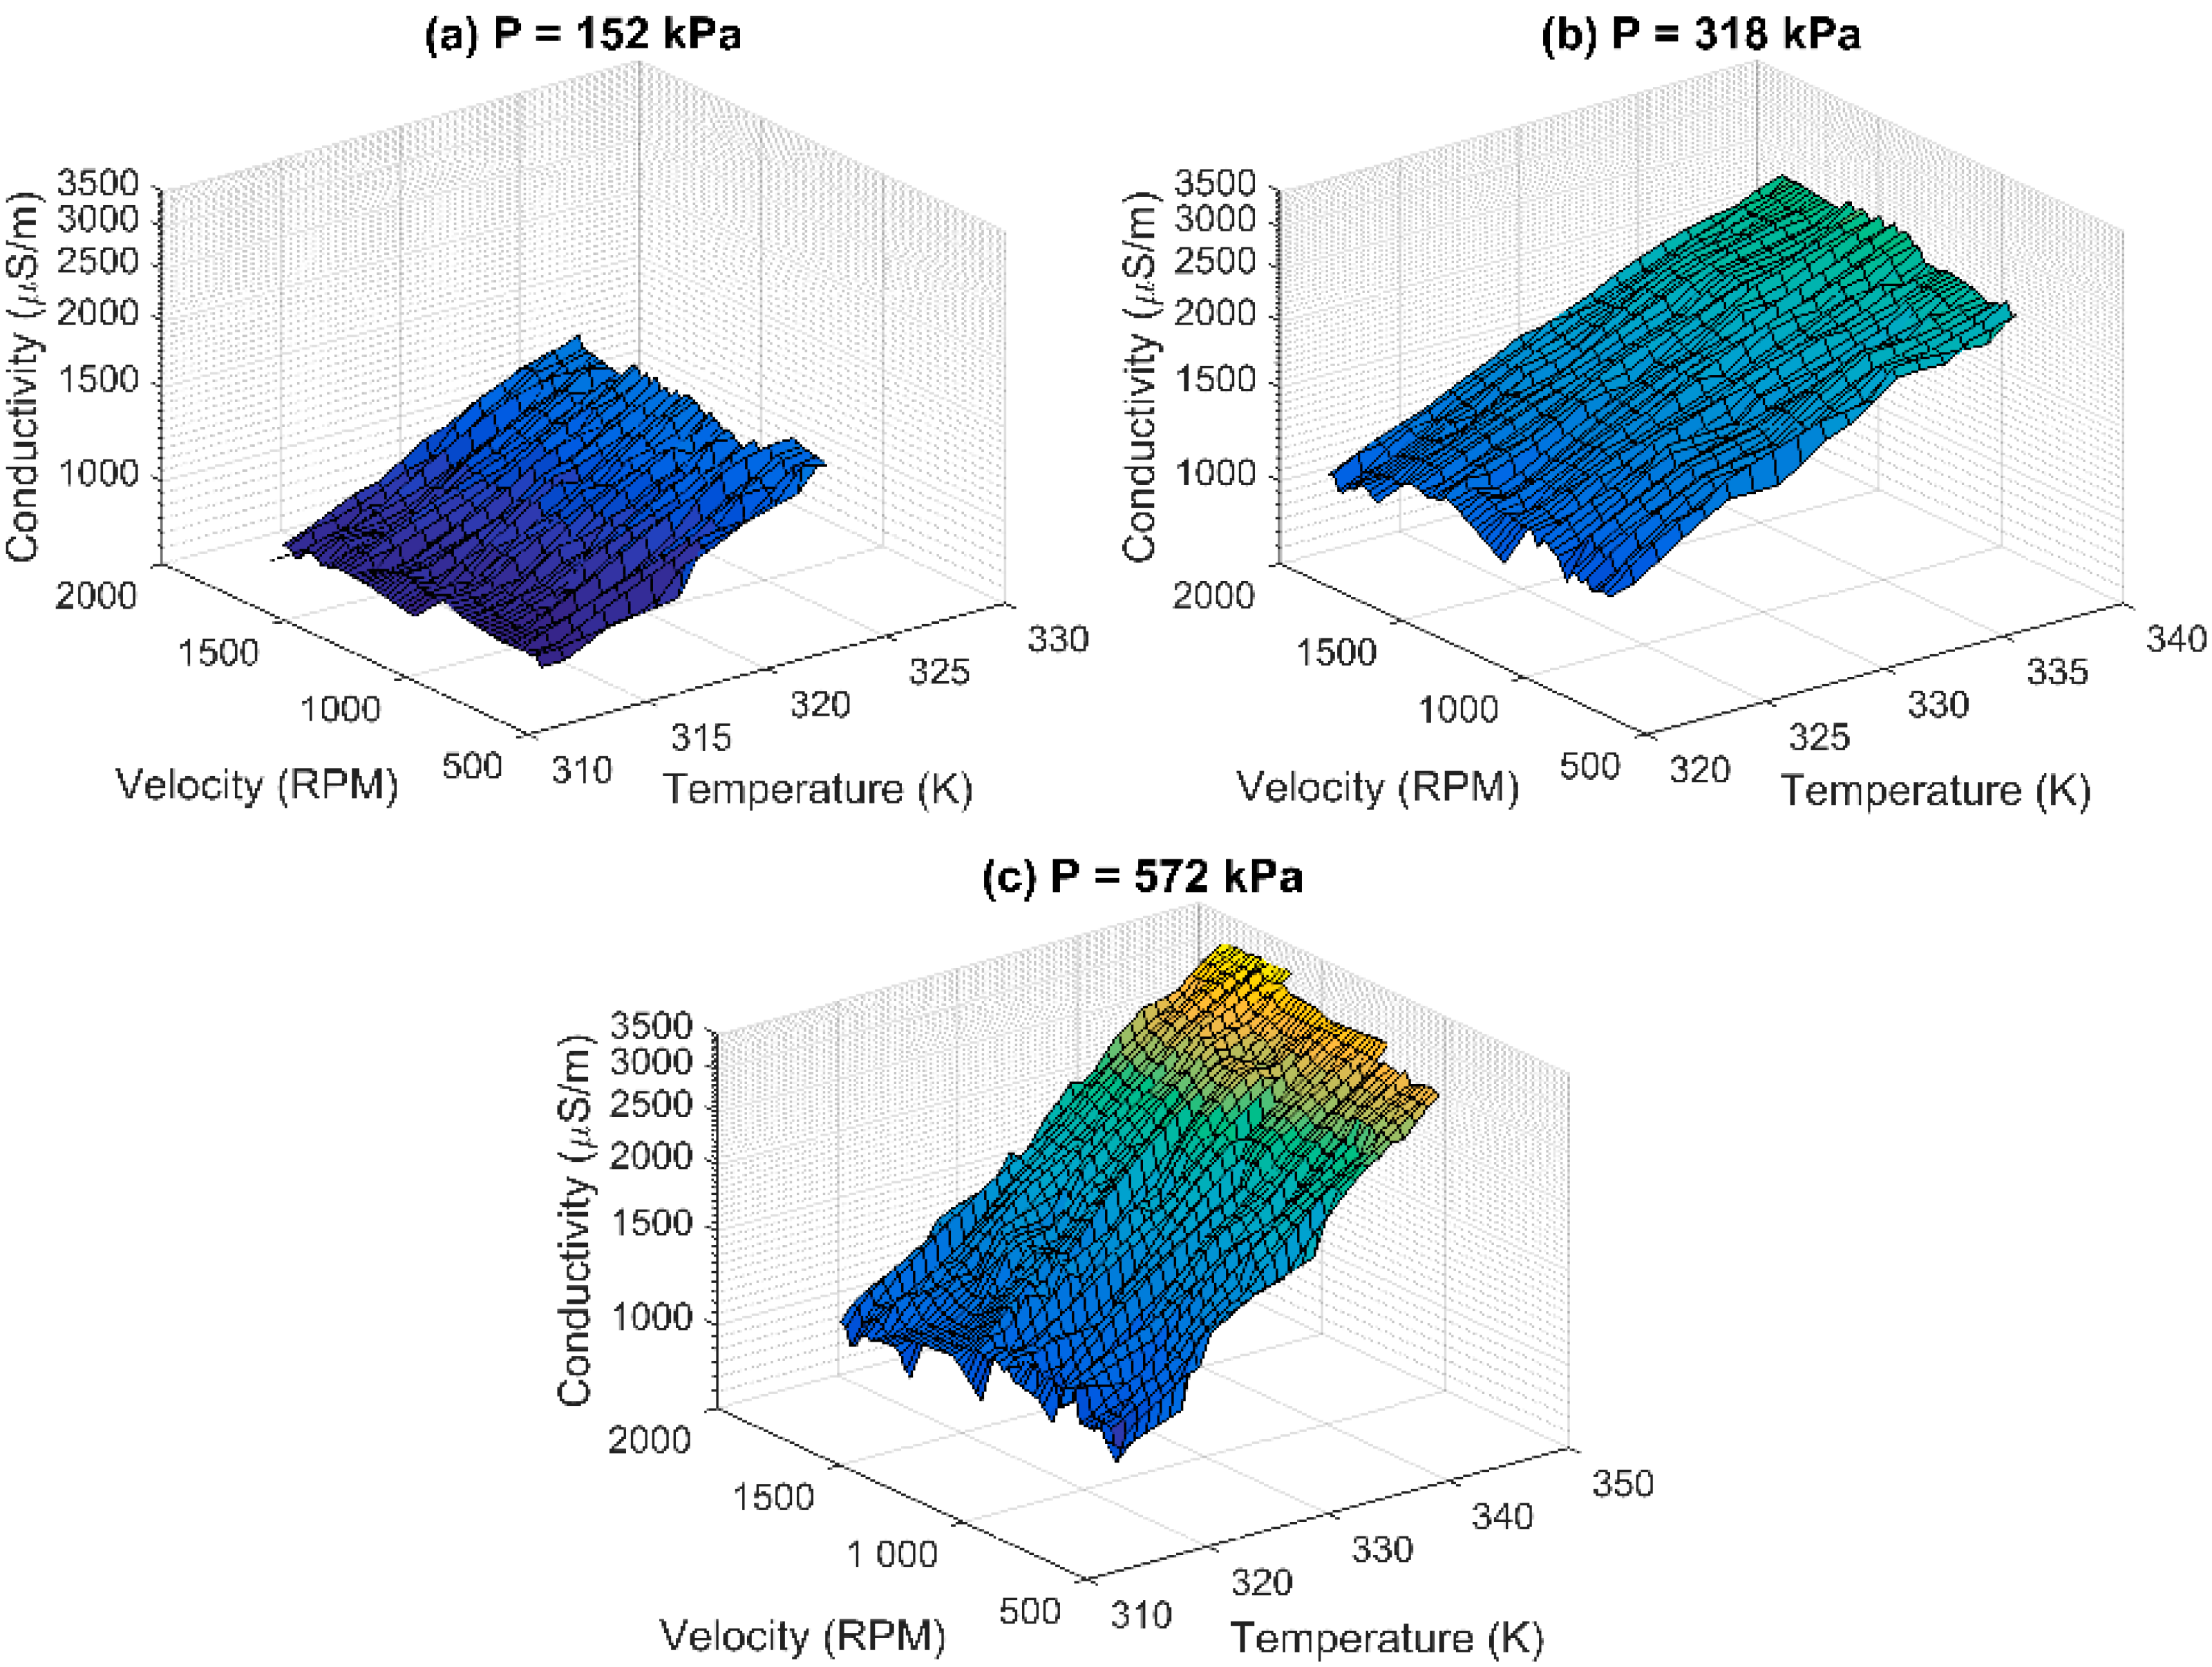
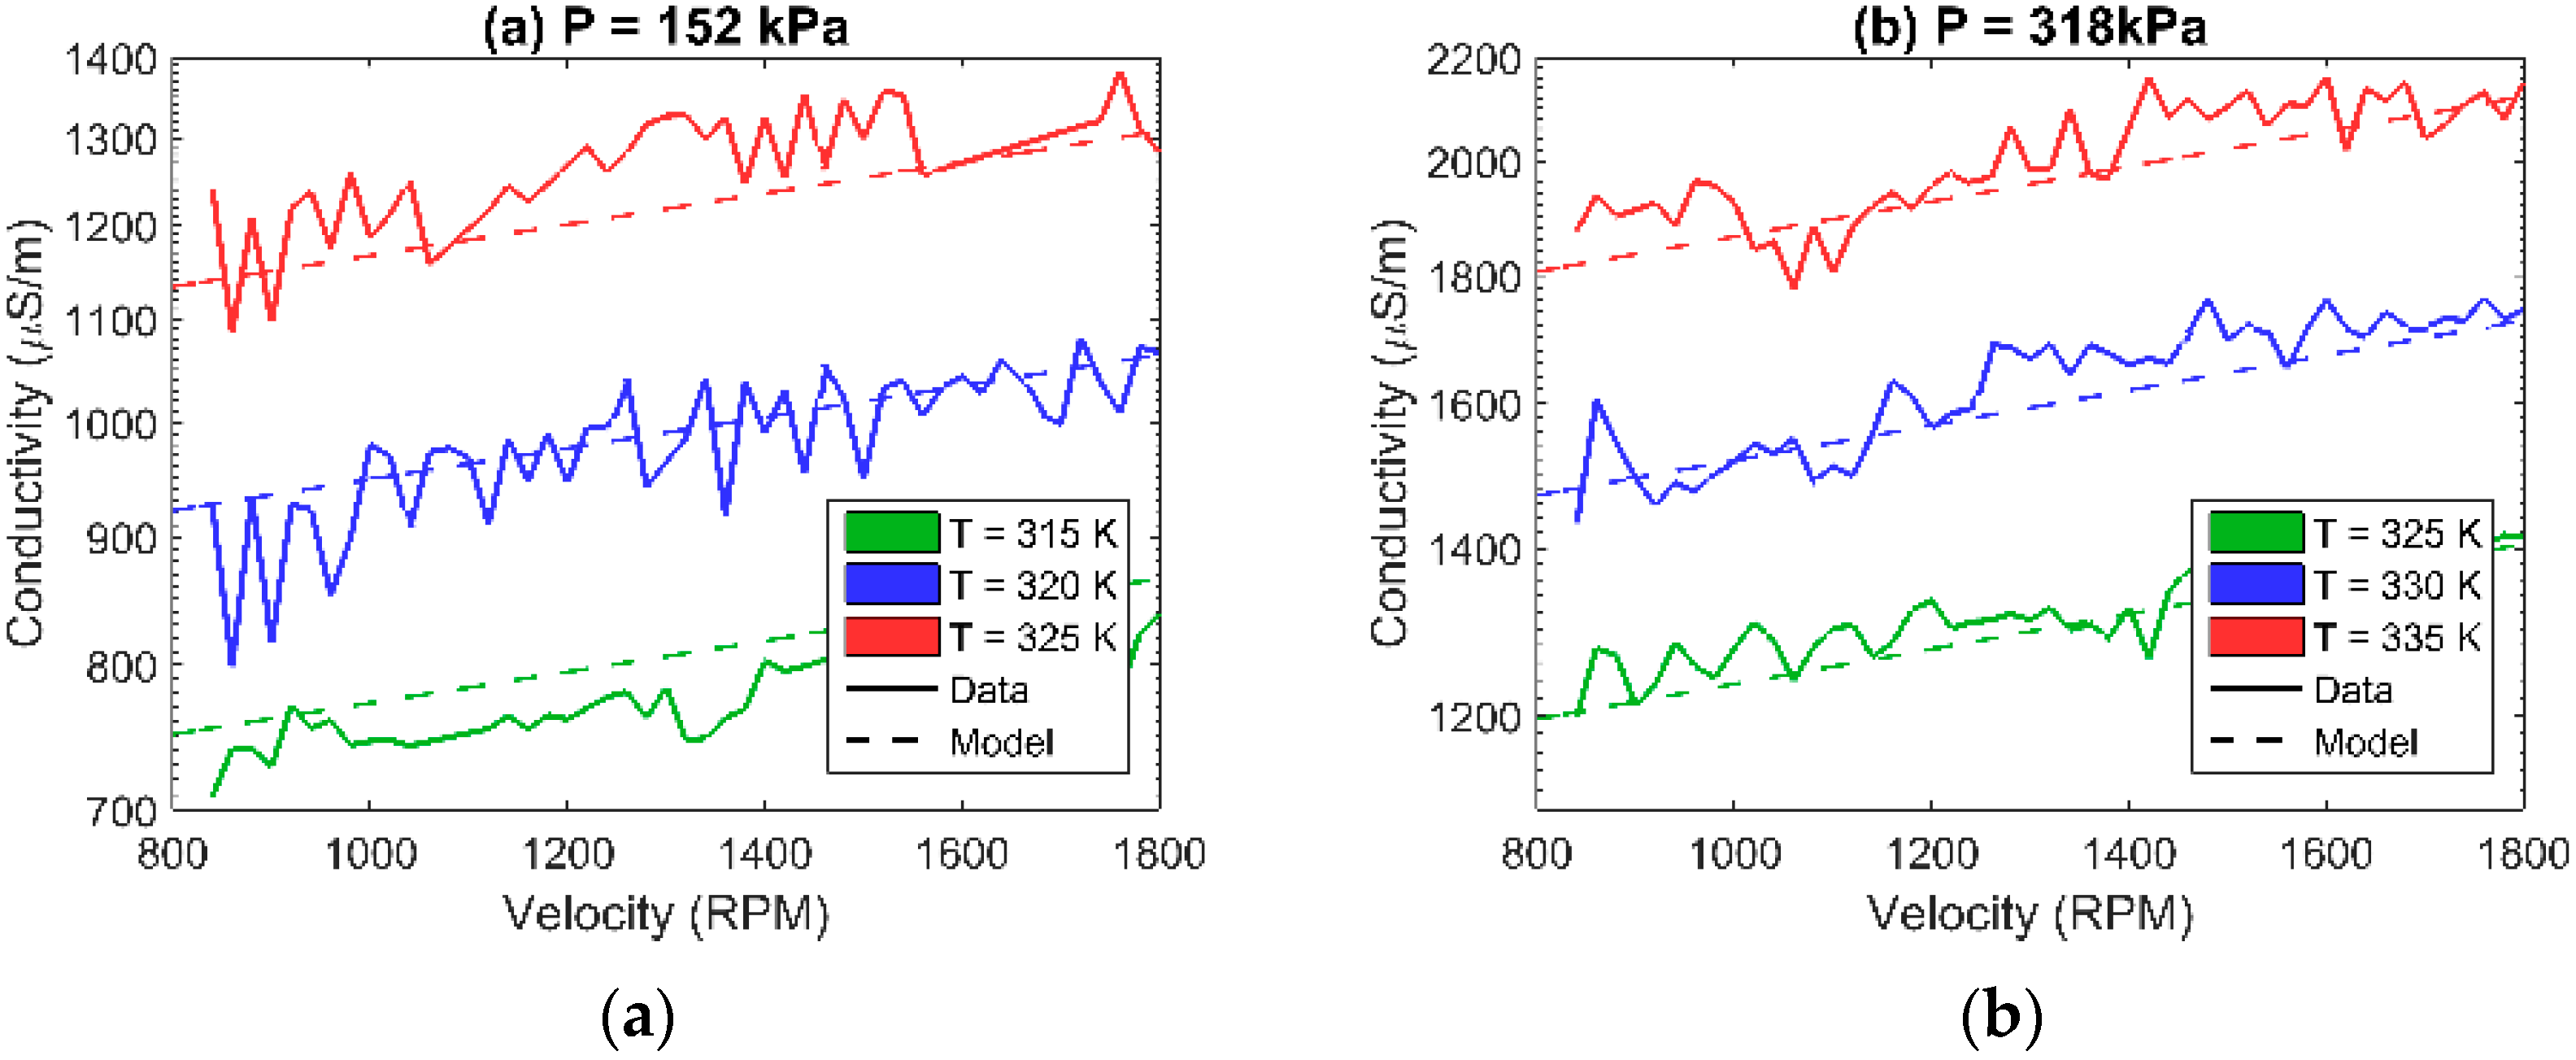
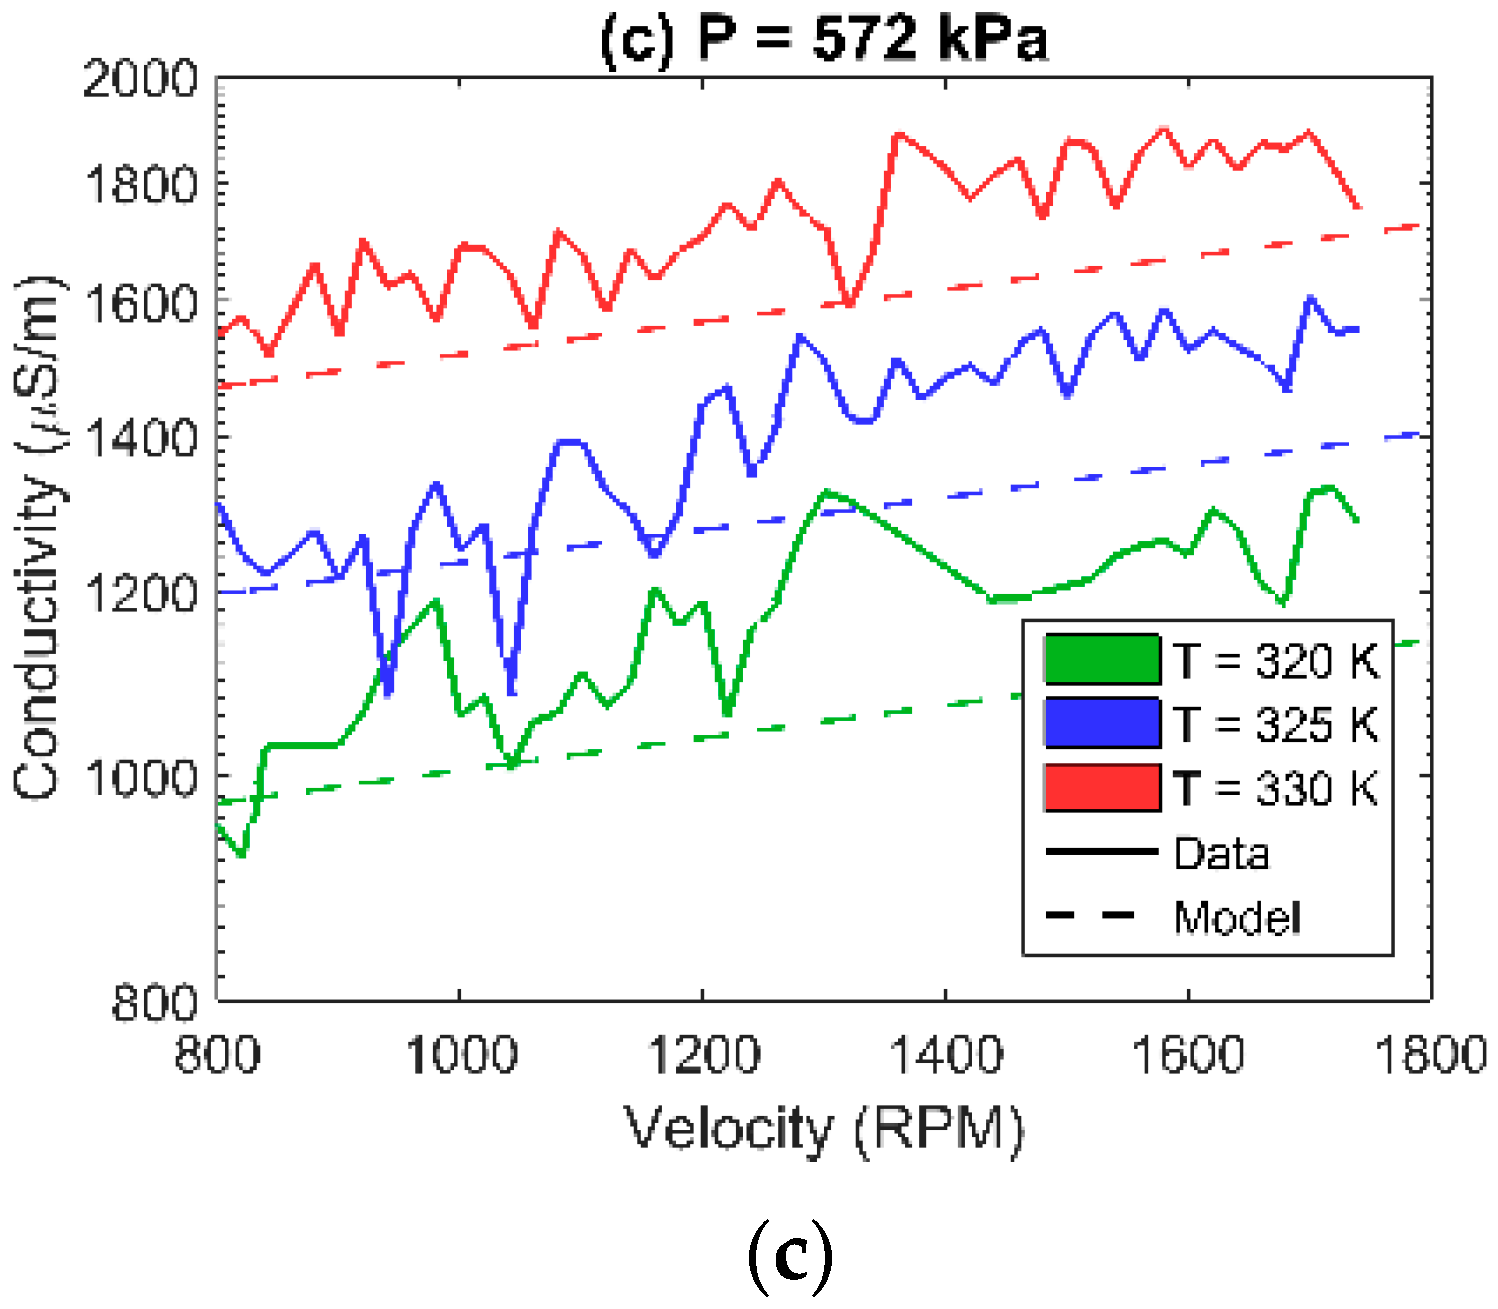
Due to the CuO GQTC having less fluctuations and acting more linearly in the σ(
P,T) space, it was chosen for dynamic analysis, when being subjected to wear and tear (
Figure 4). Changes in the rotational velocity cause changes in the friction force, which, in turn, causes elastic changes in the material thus impacting the thickness of the barriers, which affects the conductivity. Similarly, the material exhibits semi-linear behavior.
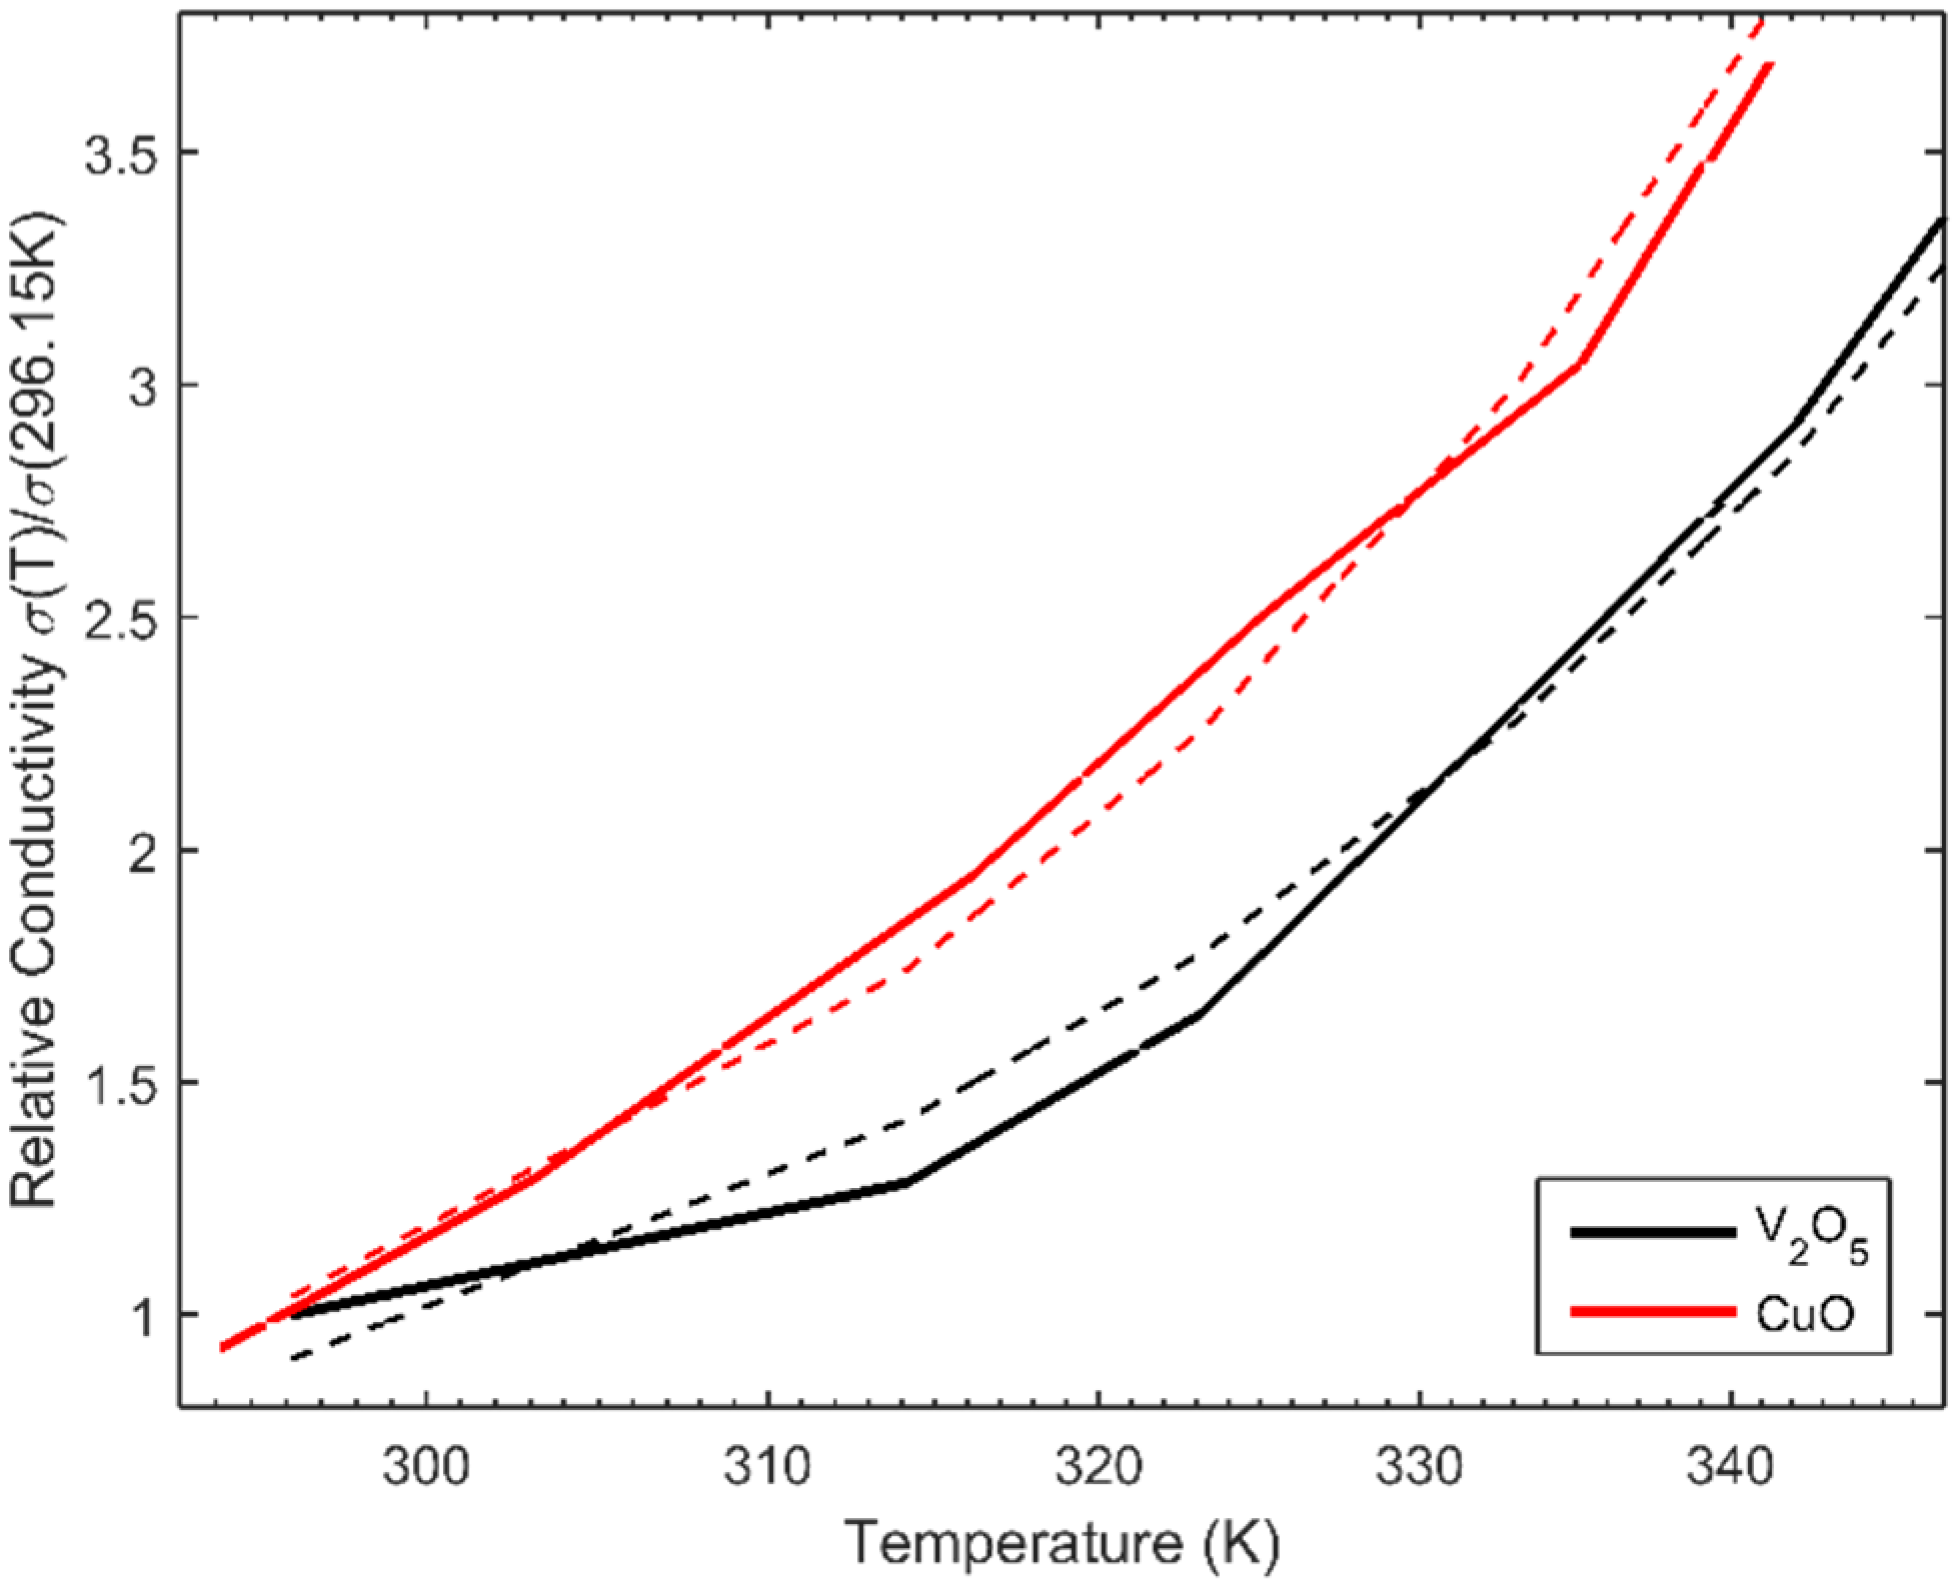
From the sensory perspective, both materials exhibit very good sensitivity, with the relative conductivity increasing ~3.5 fold over the change in temperature of ~50 K (
Figure 5).
Figure 4.
Observed (measured) conductivity σ(P,v,T) of CuO GQTC for dynamic measurements for (a) pressure P = 152 kPa; (b) pressure P = 318 kPa; and (c) pressure P = 572 kPa.
Figure 4.
Observed (measured) conductivity σ(P,v,T) of CuO GQTC for dynamic measurements for (a) pressure P = 152 kPa; (b) pressure P = 318 kPa; and (c) pressure P = 572 kPa.
Figure 5.
Comparison of the relative conductivity σ(T) for P = 124 kPa for both CuO and V2O5 GQTC.
Figure 5.
Comparison of the relative conductivity σ(T) for P = 124 kPa for both CuO and V2O5 GQTC.
The standart measure of sensitivity of a termistor is a temperature coefficient of resistance (TCR), which is expressed by the following formula:
For TCR, the values computed for
P = 124 kPa are shown in
Table 1.
Table 1.
Temperature coefficients of resistance (TCRs) of the composites.
Table 1.
Temperature coefficients of resistance (TCRs) of the composites.
| Composite | Dynamic/Static | TCR [%/K] |
|---|
| CuO | v = 0 | 1.7 |
| CuO | v ≠ 0 | 1.5 |
| V2O5 | v = 0 | 1.3 |
The nature of QTC materials allows obtaining very high TCR such as in [
2] where TCR ranges from 10%/K to 40%/K. However, in such materials, the resistivity is much less predictable, thus making them hard to use in sensors estimating precise temperature or pressure. Such giant resistivity changes are good for sensors with on/off type of characteristics. Our materials exhibit both very high TCR and very predictable resistance thus making them excellent for sensory application.
4.1. Implications of the Material’s Structure on the Modelling
Formation of the conductive chains, described in
Section 2 and depicted in
Figure 1, is an inherently sigmoidal process and is well researched and documented [
2,
39]. The resistivity of the composite is proportional to the area of a combined cross section of all the conductive chains.
where
is the cross section area of each of the conductive chains. As the conductive chains are formed with the probability, which is a sigmoid function of the filler density
, and the sum of area of the chains is the expected value of their probabilities, the resistivity will as well exhibit sigmoidal trends.
As the filler density
can be expressed as a statistical average distance between the grains, which is a function of parameters which modify the thickness of the barrier (in this case pressure, velocity and temperature), the final resistivity will be a sigmoidal function.
In cases when the process of interest is modelled in a part of the domain, the sigmoid function can be approximated by an exponential function. This approximation is used in many currently used, well documented models of sensing materials such the Steinhart–Hart model for the thermistor [
40]:
as well as models proposed for QTC materials such as the QTC resistivity [
9]:
where,
is the resistivity,
is the average distance between the conductive grains and
is the temperature of the composite.
4.2. Empirical Modelling of the Conductivity-PvT Space
The observed phenomena were approximated using an empirical model based on the knowledge described in the previous section. Empirical modelling partially based on physical knowledge and partially on numerical approximation is very useful for practical applications, as they can deliver very accurate estimations of the data as well as enabling inversion of the equations. The proposed general model for conductivity of GQTC is:
where:
σ is conductivity, but can be conductance, resistance or resistivity
pm is any parameter that σ depends on such as P, v, T
M is the dimensionality of the domain of the model (in case of PvT model, M = 3)
Q is the order of the Taylor series of the domain parameters
N is the order of the logarithmic series of σ
a and b are estimated parameters
s is the sign on the domain parameter, 1 for linear space, −1 for inverse space
This model is based on observation that the nonlinearity of the conductivity space σ can be expressed as a logarithmic series, and all the measured parameters p are approximated by a Taylor series. It should be noted that both models described by Equations (5) and (6) can be rewritten to be special cases or this generalized mode. In order to approximate the material’s conductance space σ(
P,v,T) of CuO and V
2O
5 GQTC sets
M = 3,
N = 1 and
s = 1, thus takes a form:
With optimal values of Q, R and S found by the penalized Stochastic Gradient Descent (SGD) estimator used to fit the model.
4.3. Modelling of the Static Data (v = 0)
As seen on the
Figure 3, the logarithm of the conductivity space is semi-linear, thus the Taylor series approximation can remain very short. For the V
2O
5 GQTC, the penalized SGD estimated the order of
Q = 2 and
S = 1, giving Equation (4) for σ(
P,T).
which gives approximation of 91.8% fit (calculated from obtained 8.2% Mean Average Percentage Error, MAPE), shown on
Figure 6a. For the CuO GQTC, the penalized SGD estimated the order of
Q = 1 and
S = 1, giving Equation (5) for σ(
P,T).
which gives approximation of 93.7% fit (
Figure 6b). It should be noted that the left hand side of the model is a plane, which means the CuO composite behaves close to the exponential.
Figure 6.
Observed and modelled conductivity of (a) the V2O5 composite; and (b) the CuO composite for static (zero velocity) measurements, modelled using σ(P,T) model.
Figure 6.
Observed and modelled conductivity of (a) the V2O5 composite; and (b) the CuO composite for static (zero velocity) measurements, modelled using σ(P,T) model.
4.4. Modelling of the Dynamic Data (at v ≠ 0)
For the dynamic data, the CuO GQTC model extends the domain with the velocity as a parameter. The penalized SGD estimated the order of
Q = 1,
R = 1 and
S = 1 or
Q = 1,
R =1 and
S = 2 as equivalently good. However, taking into account the simplicity of the model, the shorter model is chosen. The model σ(
P,v,T) takes a form of:
which gives a 95.4% fit. However, in the physical world, pressure and velocity are convolved, as both change the internal structure of the material. When taking this into consideration, the final model σ(
P,v,T) takes a form of:
which gives a 96.2% fit (
Figure 7).
Figure 7.
Observed and modelled conductivity of CuO GQTC for dynamic (non-zero velocity) measurements using σ(P,v,T) model for (a) pressure P = 152 kPa; (b) pressure P = 318kPa; and (c) pressure P = 572 kPa.
Figure 7.
Observed and modelled conductivity of CuO GQTC for dynamic (non-zero velocity) measurements using σ(P,v,T) model for (a) pressure P = 152 kPa; (b) pressure P = 318kPa; and (c) pressure P = 572 kPa.
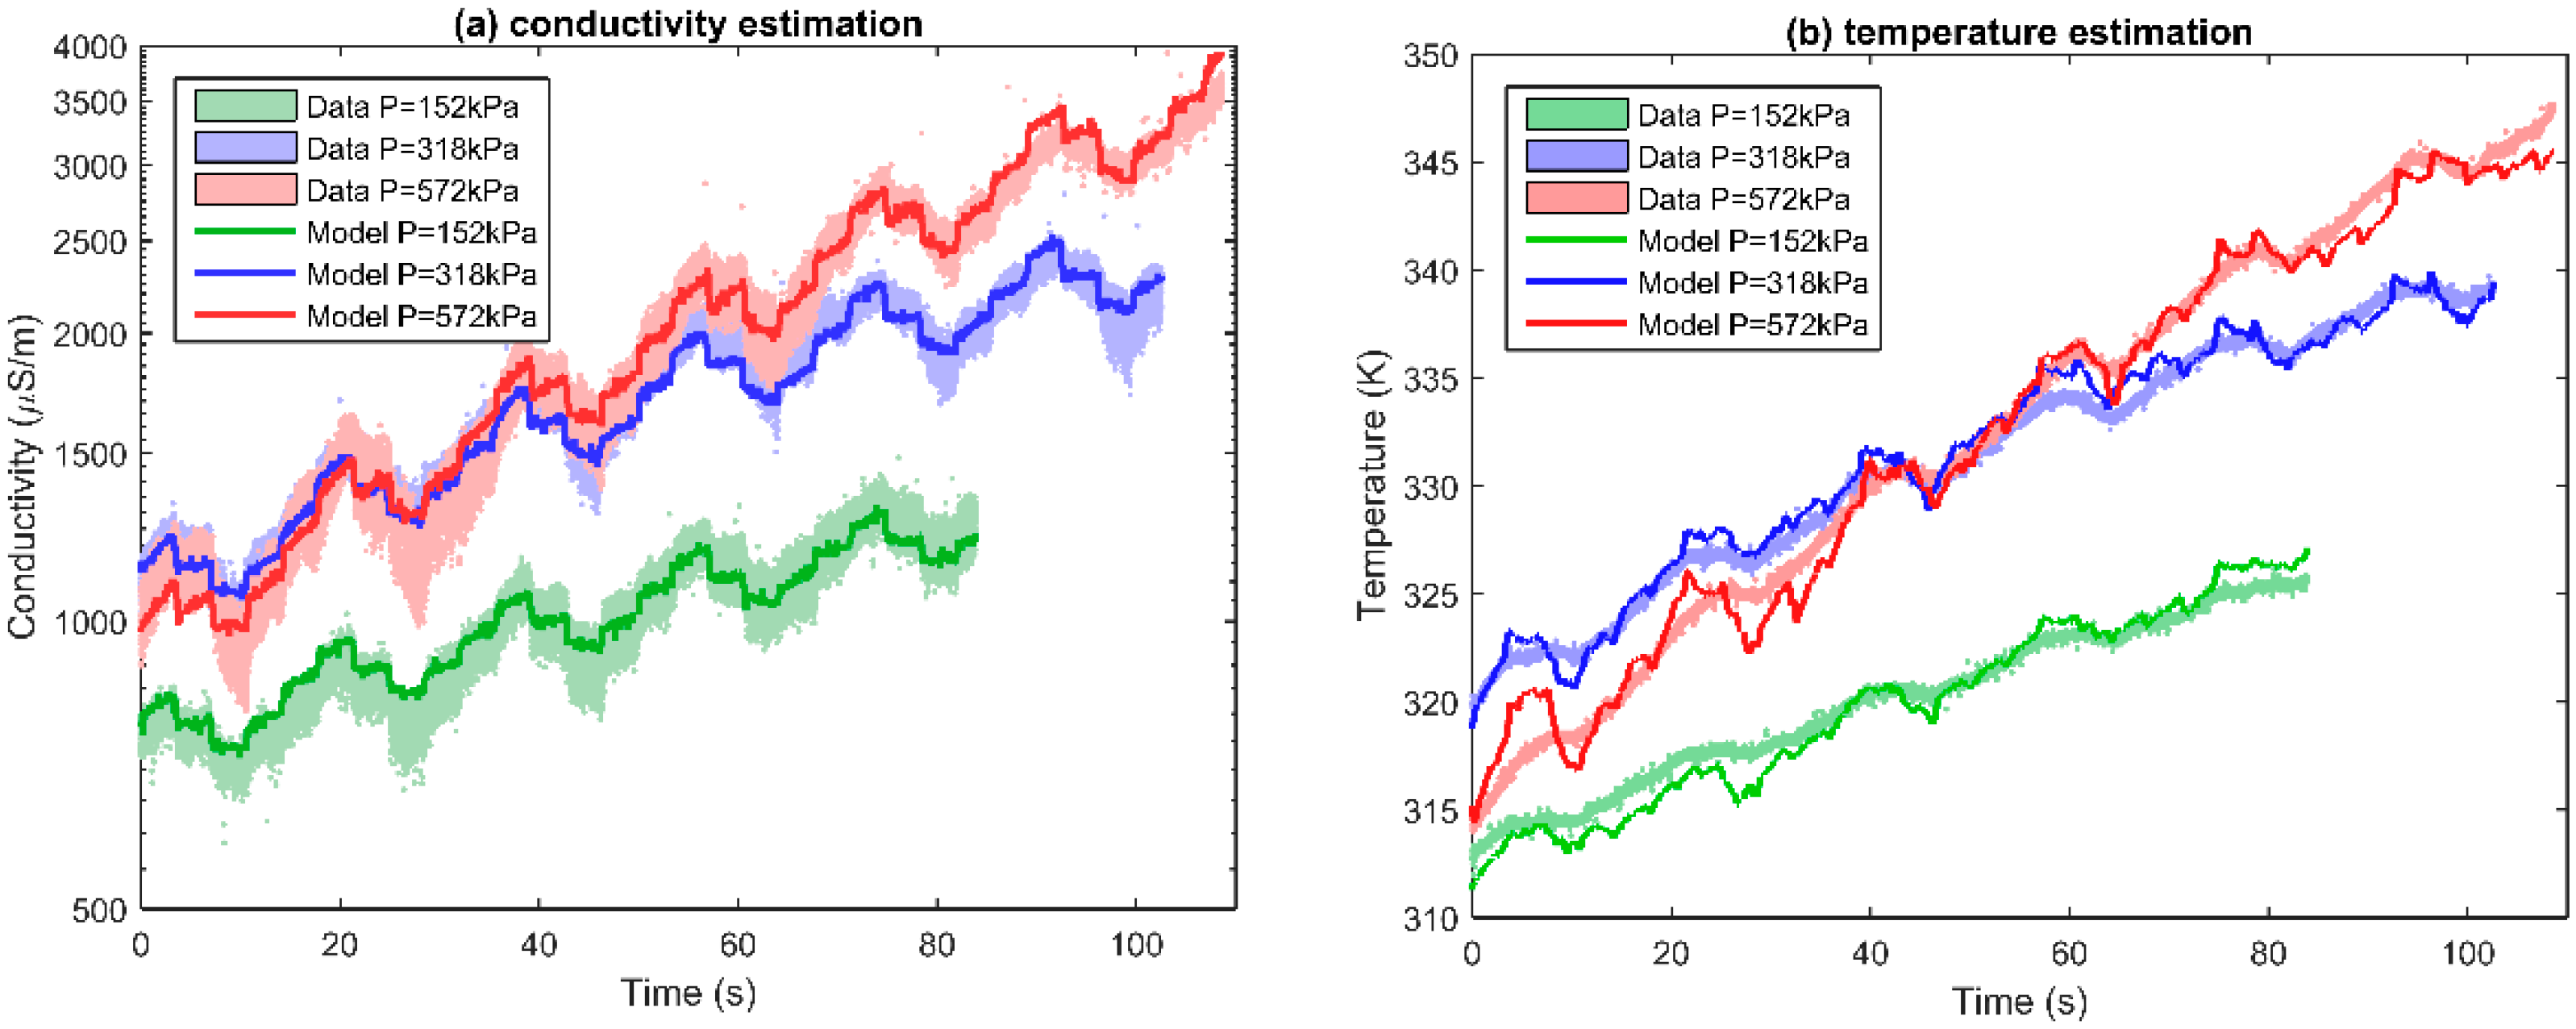
4.5. Real Time Estimation
Since the model has a relatively small error, it can be used to estimate the value of conductivity from the parameters (
Figure 8a). As the TCR of the CuO GQTC is high (1.5%/K), and the model can be analytically inverted, the material can be used as a temperature sensor with very high sensitivity and very fast response time (
Figure 8b). The model
T(
P,
v,σ) takes a form:
which gives a 98.5% fit.
Figure 8.
Model estimating (a) conductivity σ(P,v,T) for CuO GQTC; and (b) temperature T(P,v,σ) for CuO GQTC for the materials subjected wear in time domain.
Figure 8.
Model estimating (a) conductivity σ(P,v,T) for CuO GQTC; and (b) temperature T(P,v,σ) for CuO GQTC for the materials subjected wear in time domain.
It should be noted that results presented (
Figure 8b) are for the sensor which is subjected to the wear process while doing the measurement. The measured data, due to friction-induced vibrations, stick-slip and other wear related phenomena, has strong components distorting the signal. However, despite these difficult conditions, the temperature estimate is relatively close to the observed value, suggesting that the material can be successfully applied as a sensor in dynamic conditions.
5. Conclusions
Composites presented in this article have very good potential to be used in the real-time temperature and pressure sensors, as they have both good sensory properties as well as have easy to model conductivity space. Additionally, the materials have been tested and modelled in an environment with strong distorting signals such as vibrations, friction force and changing contact resistance. Thanks to the proposed model being invertible in respect to all the domain parameters, the same material can be used both as temperature and pressure sensor.
As the sensors produced from the material could operate when undergoing friction and stress, as well as it is possible to make the materials such that they can exhibit very good structural properties (such as low wear and low friction coefficient), it is envisioned that one could produce structural elements from these materials (e.g., bushing, cantilevers, etc.). Such elements could be used to self-diagnose its properties such as internal stress, temperature and others. This can be mostly applicable for MEMS, where having external sensors often is impossible due to the scale of the device, and having self-sensing elements could be the only practical way to obtain information about the state of the device itself.
Acknowledgments
Authors would like to thank Graphene Quantec, Krakow, Poland for providing the base materials used for the composites as well as the access to the laboratory equipment required for the research.
Author Contributions
The idea for the composites and design of their manufacturing process is attributed to Tadeusz Habdank Wojewodzki. The idea and design of the electrotribotester is attributed to Tadeusz Habdank Wojewodzki and Slawomir Zimowski. The production of the composites and performing of the measurements is attributed to Przemyslaw Cwik. The analysis and modelling of the data is attributed to Josef Habdank and Przemyslaw Cwik.
Conflicts of Interest
The authors declare no conflict of interest.
References
- Shen, G.; Zheng, H.Z. On the mechanism of piezoresistivity of carbon nanotube polymer composites. Polymer 2014, 55, 4136–4149. [Google Scholar]
- Huang, Y.; Xiang, B.; Ming, X.; Fu, X.; Ge, Y. Conductive mechanism research based on pressure-sensitive conductive composite material for flexible tactile sensing. In Proceedings of the 2008 IEEE International Conference of Information and Automation, Changsha, China, 20–23 June 2008.
- Wang, L.; Cheng, L. Piezoresistive effect of a carbon nanotube silicone-matrix composite. Carbon 2014, 71, 319–331. [Google Scholar] [CrossRef]
- Olivia-Aviles, A.I.; Aviles, F.; Seidel, G.D.; Sosa, V. On the contribution of carbon nanotube deformation to piezoresistivity of carbon nanotube/polymer composites. Compos. Part B 2013, 47, 200–206. [Google Scholar] [CrossRef]
- Tallman, T.; Wang, K.W. An arbitrary strains carbon nanotube composite piezoresistivity model for finite element integration. Appl. Phys. Lett. 2013, 102, 011909:1–011909:4. [Google Scholar] [CrossRef]
- Linartis, A.; Barons, I.; Knite, M. The dependence of piezoresistivity of elastomer/nanostructured carbon composites on dynamic mechanical load frequency. In Proceedings of the 2014 11th International Conference on Informatics in Control, Automation and Robotics (ICINCO), Vienna, Austria, 1–3 September 2014.
- Lasater, K.L.; Thostenson, E.T. In situ thermoresistive characterization of multifunctional composites of carbon nanotubes. Polymer 2012, 53, 5367–5374. [Google Scholar] [CrossRef]
- Zeng, Y.; Lu, G.; Wang, H.; Du, J.; Ying, Z.; Liu, C. Positive temperature coefficient thermistors based on carbon nanotube/polymer composites. Sci. Rep. 2014, 4, 6684:1–6684:7. [Google Scholar] [CrossRef] [PubMed]
- Fernandes, G.E.; Kim, J.H.; Sood, A.K.; Xu, J. Giant Temperature Coefficient of Resistance in Carbon Nanotube/Phase-Change Polymer Nanocomposites. Adv. Funct. Mater. 2013, 23, 4678–4683. [Google Scholar] [CrossRef]
- Pang, H.; Zhang, Y.-C.; Chen, T.; Zeng, B.-Q.; Li, Z.-M. Tunable positive temperature coefficient of resistivity in an electrically conducting polymer/graphene composite. Appl. Phys. Lett. 2010, 96, 251907:1–251907:3. [Google Scholar] [CrossRef]
- Joshi, G.M.; Deshmukh, K. Conjugated polymer/graphene oxide nanocomposite as thermistor. In Proceedings of the 59th DAE Solid State Physics Symposium 2014, Tamilnadu, India, 16–20 December 2014.
- Lantada, A.D.; Lafont, P.; Sanz, J.L.M.; Munoz-Guijosa, J.M.; Otero, J.E. Quantum tunnelling composites: Characterisation and modelling to promote their applications as sensors. Sens. Actuators A Phys. 2010, 164, 46–57. [Google Scholar] [CrossRef]
- Bloor, D.; Donnelly, K.; Hands, P.J.; Laughlin, P.; Lussey, D. A metal-polymer composite with unusual properties. J. Phys. D Appl. Phys. 2005, 38, 2851–2860. [Google Scholar] [CrossRef]
- Han, B.G.; Han, B.Z.; Yu, X. Experimental study on the contribution of the quantum tunneling effect to the improvement of the conductivity and piezoresistivity of a nickel powder-filled cement-based composite. Smart Mater. Struct. 2009, 18, 065007:1–065007:7. [Google Scholar] [CrossRef]
- Ausanioa, G.; Baronea, A.C.; Campanab, C.; Iannottia, V.; Luponiob, C.; Pepea, G.P.; Lanottea, L. Giant resistivity change induced by strain in a composite of conducting particles in an elastomer matrix. Sens. Actuators A Phys. 2006, 127, 56–62. [Google Scholar] [CrossRef]
- Vickery, J.L.; Patil, A.J.; Mann, S. Fabrication of Graphene-Polymer Nanocomposites with Higher-Order Three-Dimensional Architectures. Adv. Mater. 2009, 21, 2180–2184. [Google Scholar] [CrossRef]
- Stassi, S.; Canavesea, G.; Cosiansib, F.; Gaziaa, R.; Cocuzzaa, M. A Tactile Sensor Device Exploiting the Tunable Sensitivity of Copper-PDMS Piezoresistive Composite. In Proceedings of the 26th European Conference on Solid-State Transducers EUROSENSOR 2012, Krakow, Poland, 9–12 September 2012; pp. 659–663.
- Amarasinghe, Y.W.R.; Kulasekera, A.L.; Priyadarshana, T.G.P. Design and simulation of 1-DOF tactile sensor for gripping force measurement. In Proceedings of the 8th IEEE International Conference on Industrial and Information Systems (ICIIS), Peradeniya, Sri Lanka, 17–20 December 2013.
- Stassi, S.; Cauda, V.; Canavese, G.; Pirri, C.F. Flexible Tactile Sensing Based on Piezoresistive Composites: A Review. Sensors 2014, 14, 5296–5332. [Google Scholar] [CrossRef] [PubMed]
- Webb, A.J.; Szablewski, M.; Bloor, D.; Atkinson, D.; Graham, A.; Laughlin, P.; Lussey, D. A Multi-Component Nanocomposite Screen-Printed Ink with Non-Linear Touch Sensitive Electrical Conductivity. Nanotechnology 2013, 24. [Google Scholar] [CrossRef] [PubMed]
- Amarasinghe, Y.W.R.; Kulasekera, A.L.; Priyadarshana, T.G.P. Quantum tunneling composite (QTC) based tactile sensor array for dynamic pressure distribution measurement. In Proceedings of the 2013 Seventh International Conference on Sensing Technology (ICST), Wellington, New Zealand, 3–5 December 2013.
- Guo, J.; Tong, L.; Chen, L. Platinum Alloy Strain Gauge Materials Noble Metal Alloys for Static Strain Measurement at 900 °C. Platinum Met. Rev. 1997, 41, 24–32. [Google Scholar]
- Habdank-Wojewodzki, T.; Habdank, J.; Radawanski, M.; Pisarkiewicz, T. Admittance sensory properties of Graphene QTC modified with SiC. In Proceedings of the 6th symposium on carbon nanomaterials Carbonhagen 2015, Copenhagen, Denmark, 13–14 August 2015.
- Prazmowska, J.; Weselucha-Birczynska, A.; Habdank-Wojewodzki, T. Polymer micro-nanocomposites studied by Raman spectroscopy. In Proceedings of the Advanced Infrared and Raman Spectroscopy (AIRS 2012), Lochow, Poland, 16–18 November 2012.
- Weselucha-Birczynska, A.; Habdank-Wojewodzki, T. Raman spectroscopy of graphene-polymer nanocomposites. In Proceedings of the Advanced Infrared and Raman Spectroscopy (AIRS 2012), Lochow, Poland, 16–18 November 2012.
- Habdank, J.; Habdank-Wojewodzki, T. Method of production of a self-sensing elements for microelectromechanical systems based on Graphene nanocomposites. DA Patent PA 2011 00898, 17 November 2011. [Google Scholar]
- Habdank, J.; Habdank-Wojewodzki, T.; Radwanski, M. Application and electronic properties of Graphene Polymer Micronanocomposites. In Proceedings of the 4th symposium on carbon nanomaterials Carbonhagen 2013, Copenhagen, Denmark, 19–20 August 2013.
- Cwik, P.; Habdank, J.; Habdank-Wojewodzki, T.; Radawanski, M. Graphene Super Sensor: Application of Graphene CuO Polymer Micronanocomposites. In Proceedings of the 5th symposium on carbon nanomaterials Carbonhagen 2014, Copenhagen, Denmark, 21–22 August 2014.
- Abdala, A.A.; Macosko, C. Polymer-Graphene Nanocomposites: Effect of the Matrix and Processing Conditions. In Proceedings of the Nanotech Dubai 2013: Nano for Better Conference and Exhibition, Dubai, United Arab Emirates, 28–31 October 2013.
- Han, B.Z.; Han, B.G.; Zhou, D.C.; Wang, C.Y.; Jin, X. Nickel Powder Filled Piezoresistive Composites Based on Field Emission and Quantum Tunneling Effect. Rare Met. Mater. Eng. 2009, 38, 38–43. [Google Scholar]
- Shen, X.-J.; Pei, X.-Q.; Liu, Y.; Fu, S.-Y. Tribological performance of carbon nanotube–graphene oxide hybrid/epoxy composites. Compos. Part. B 2013, 47, 200–206. [Google Scholar] [CrossRef]
- Belmonte, B.; Ramirez, C.; Gonzalez-Julian, J.; Schneider, J.; Miranzo, P.; Osendi, M.I. The beneficial effect of graphene nanofillers on the tribological performance of ceramics. Carbon 2013, 61, 431–435. [Google Scholar] [CrossRef]
- Han, J.-H.; Zhang, H.; Chu, P.-F.; Imani, A.; Zhang, Z. Friction and wear of high electrical conductive carbon nanotube buckypaper/epoxy composites. Compos. Sci. Technol. 2015, 114, 1–10. [Google Scholar] [CrossRef]
- Seiner, H.; Sedlak, P.; Koller, M.; Landa, M.; Ramirez, C.; Osendi, M.I.; Belmonte, M. Anisotropic elastic moduli and internal friction of graphene nanoplatelets/silicon nitride composites. Compos. Sci. Technol. 2013, 75, 93–97. [Google Scholar] [CrossRef]
- Umadevi, P.; Nagendra, C.L.; Thutupalli, G.K.M. Structural, electrical and infrared optical-properties of Vanadium Pentoxide (V2O5) thick-film Thermistors. Sens. Actuators A Phys. 1993, 39, 59–69. [Google Scholar] [CrossRef]
- Kuznetsov, V.A.; Haneman, D. High Temperature coefficient of resistance in vanadium oxide diodes. Rev. Sci. Instrum. 1997, 68, 1518:1–1518:3. [Google Scholar] [CrossRef]
- Yuan, C.L.; Wu, X.F.; Liu, X.Y.; Huang, J.Y.; Li, B.; Liang, M.F.; Mo, C.G. Electrical Properties of CuO-Doped SrFe0.9Sn0.1O3-Delta Thick Film NTC Thermistors. J. Inorg. Mater. 2011, 26, 387–392. [Google Scholar] [CrossRef]
- Yadav, B.C.; Srivastava, R.; Singh, S.; Kumar, A.; Yadav, A.K. Temperature Sensors Based on Semiconducting Oxides: An Overview. Available online: http://arxiv.org/ftp/arxiv/papers/1205/1205.2712.pdf (accessed on 30 August 2015).
- Polymeric Conductive Composites & Quantum Tunneling Composite. Available online: http://www.nanolab.unimore.it/en/wp-content/uploads/2013/06/qtc_-background_reading_EN1.pdf (accessed on 8 December 2015).
- Steinhart, J.; Hart, S. Calibration curves for thermistors. Deep Sea Res. Oceanogr. Abstr. 1968, 15, 497–503. [Google Scholar] [CrossRef]
© 2016 by the authors; licensee MDPI, Basel, Switzerland. This article is an open access article distributed under the terms and conditions of the Creative Commons by Attribution (CC-BY) license (http://creativecommons.org/licenses/by/4.0/).


