
NDIR Gas Sensor for Spatial Monitoring of Carbon Dioxide Concentrations in Naturally Ventilated Livestock Buildings


Abstract
:1. Introduction
2. Material and Methods
2.1. Description of the Carbon Dioxide Measuring Devices
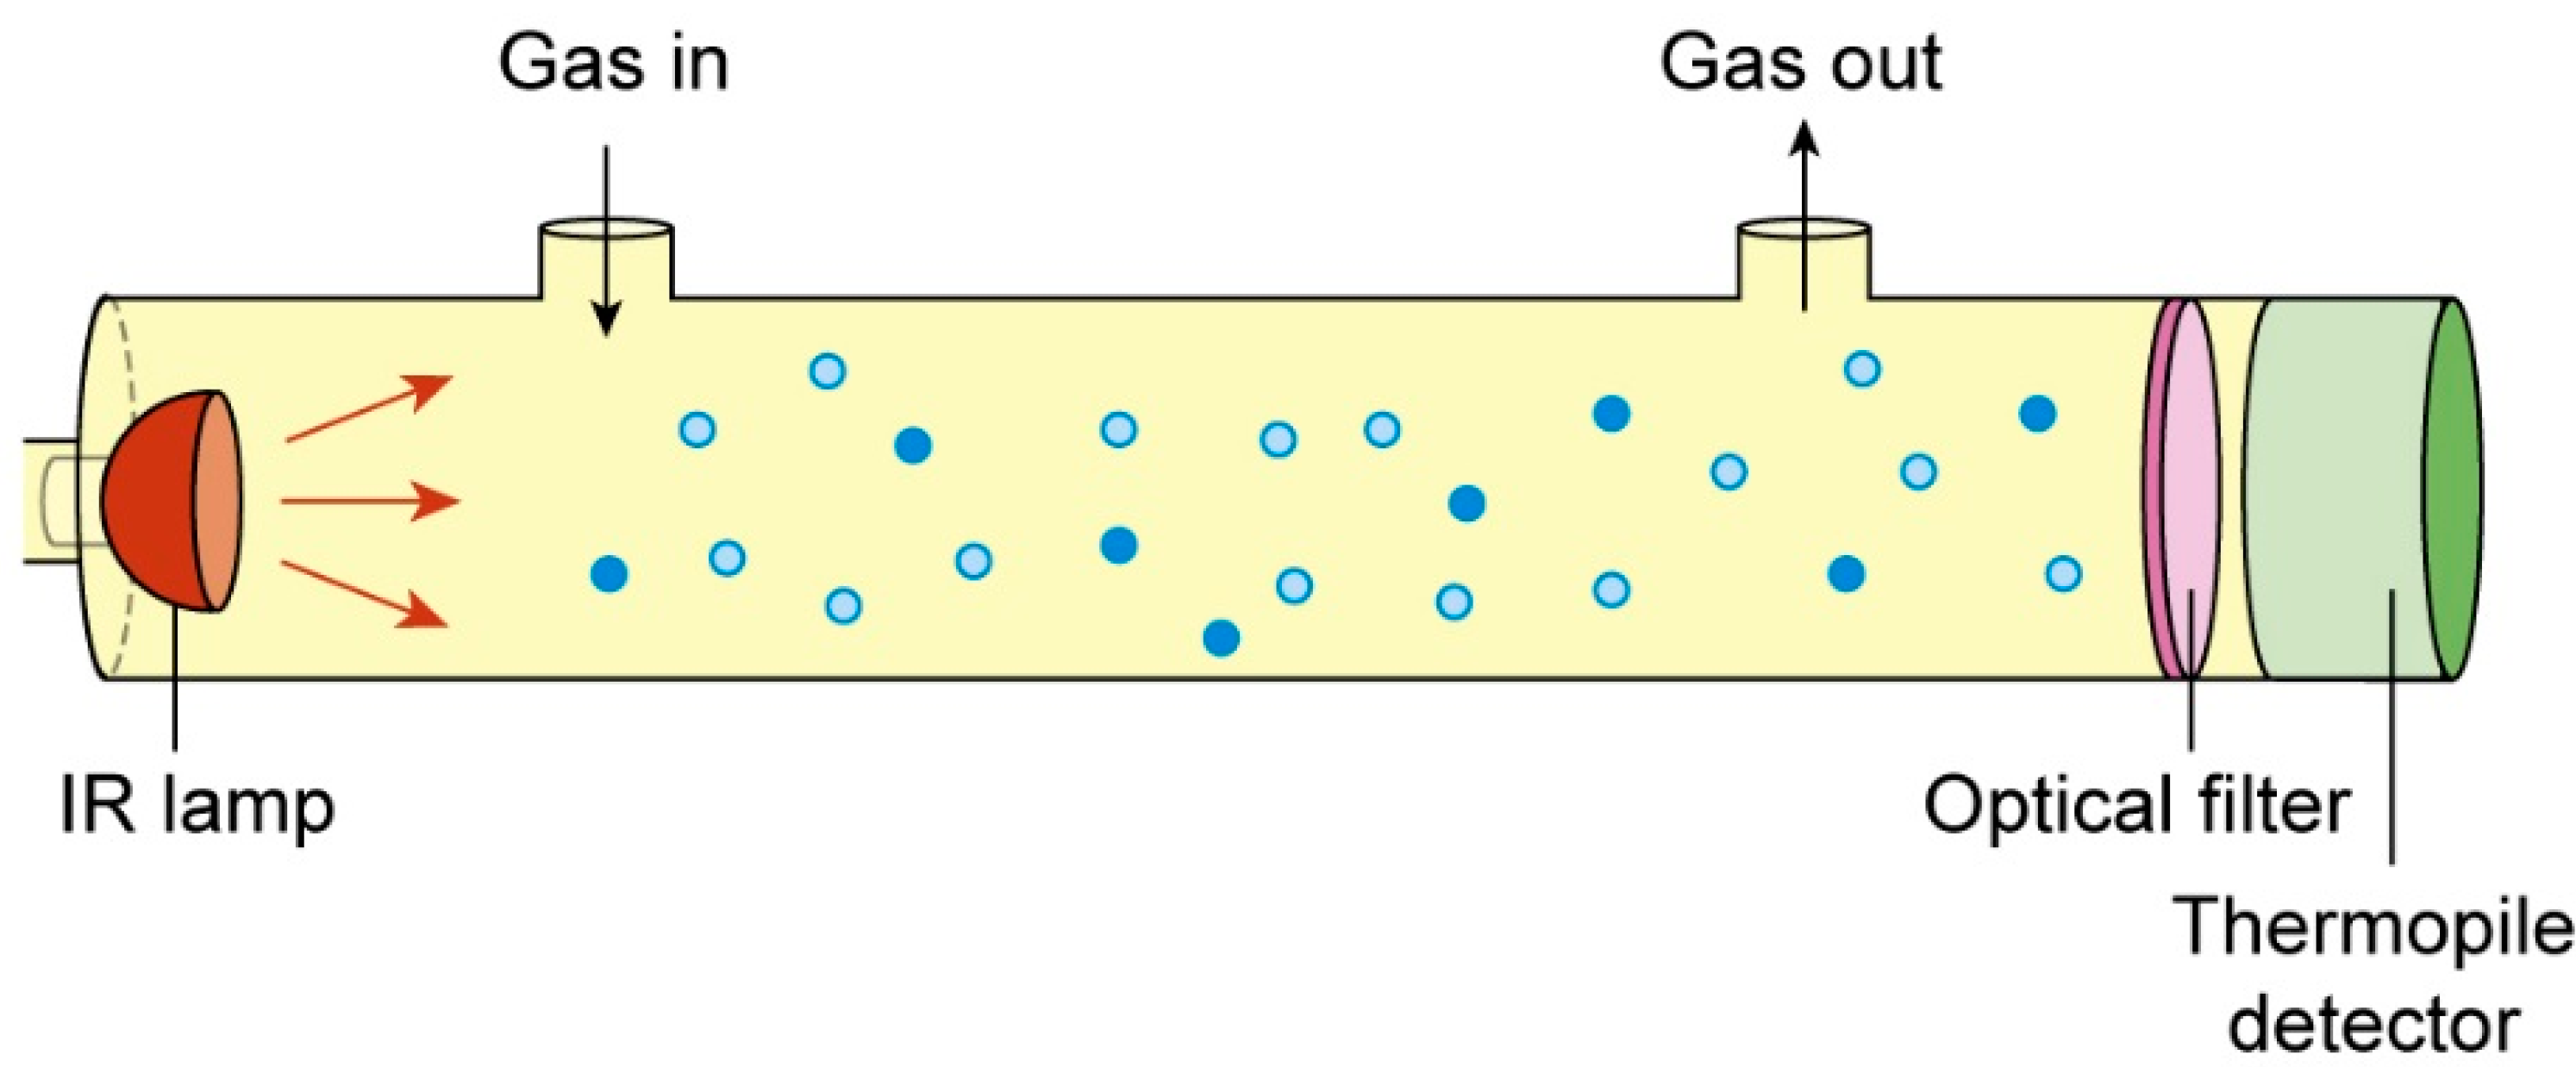
2.1.1. NDIR CO2 Gas Sensor
- I = light power intensity after absorption by CO2, measured at the detector (W·m−2);
- I0 = light power intensity at the source (W·m−2);
- k = absorption index of CO2 at 4.3 μm (dimensionless);
- l = length of the absorption path (cm);
- [CO2] = CO2 concentration to be measured (mol·dm−3).
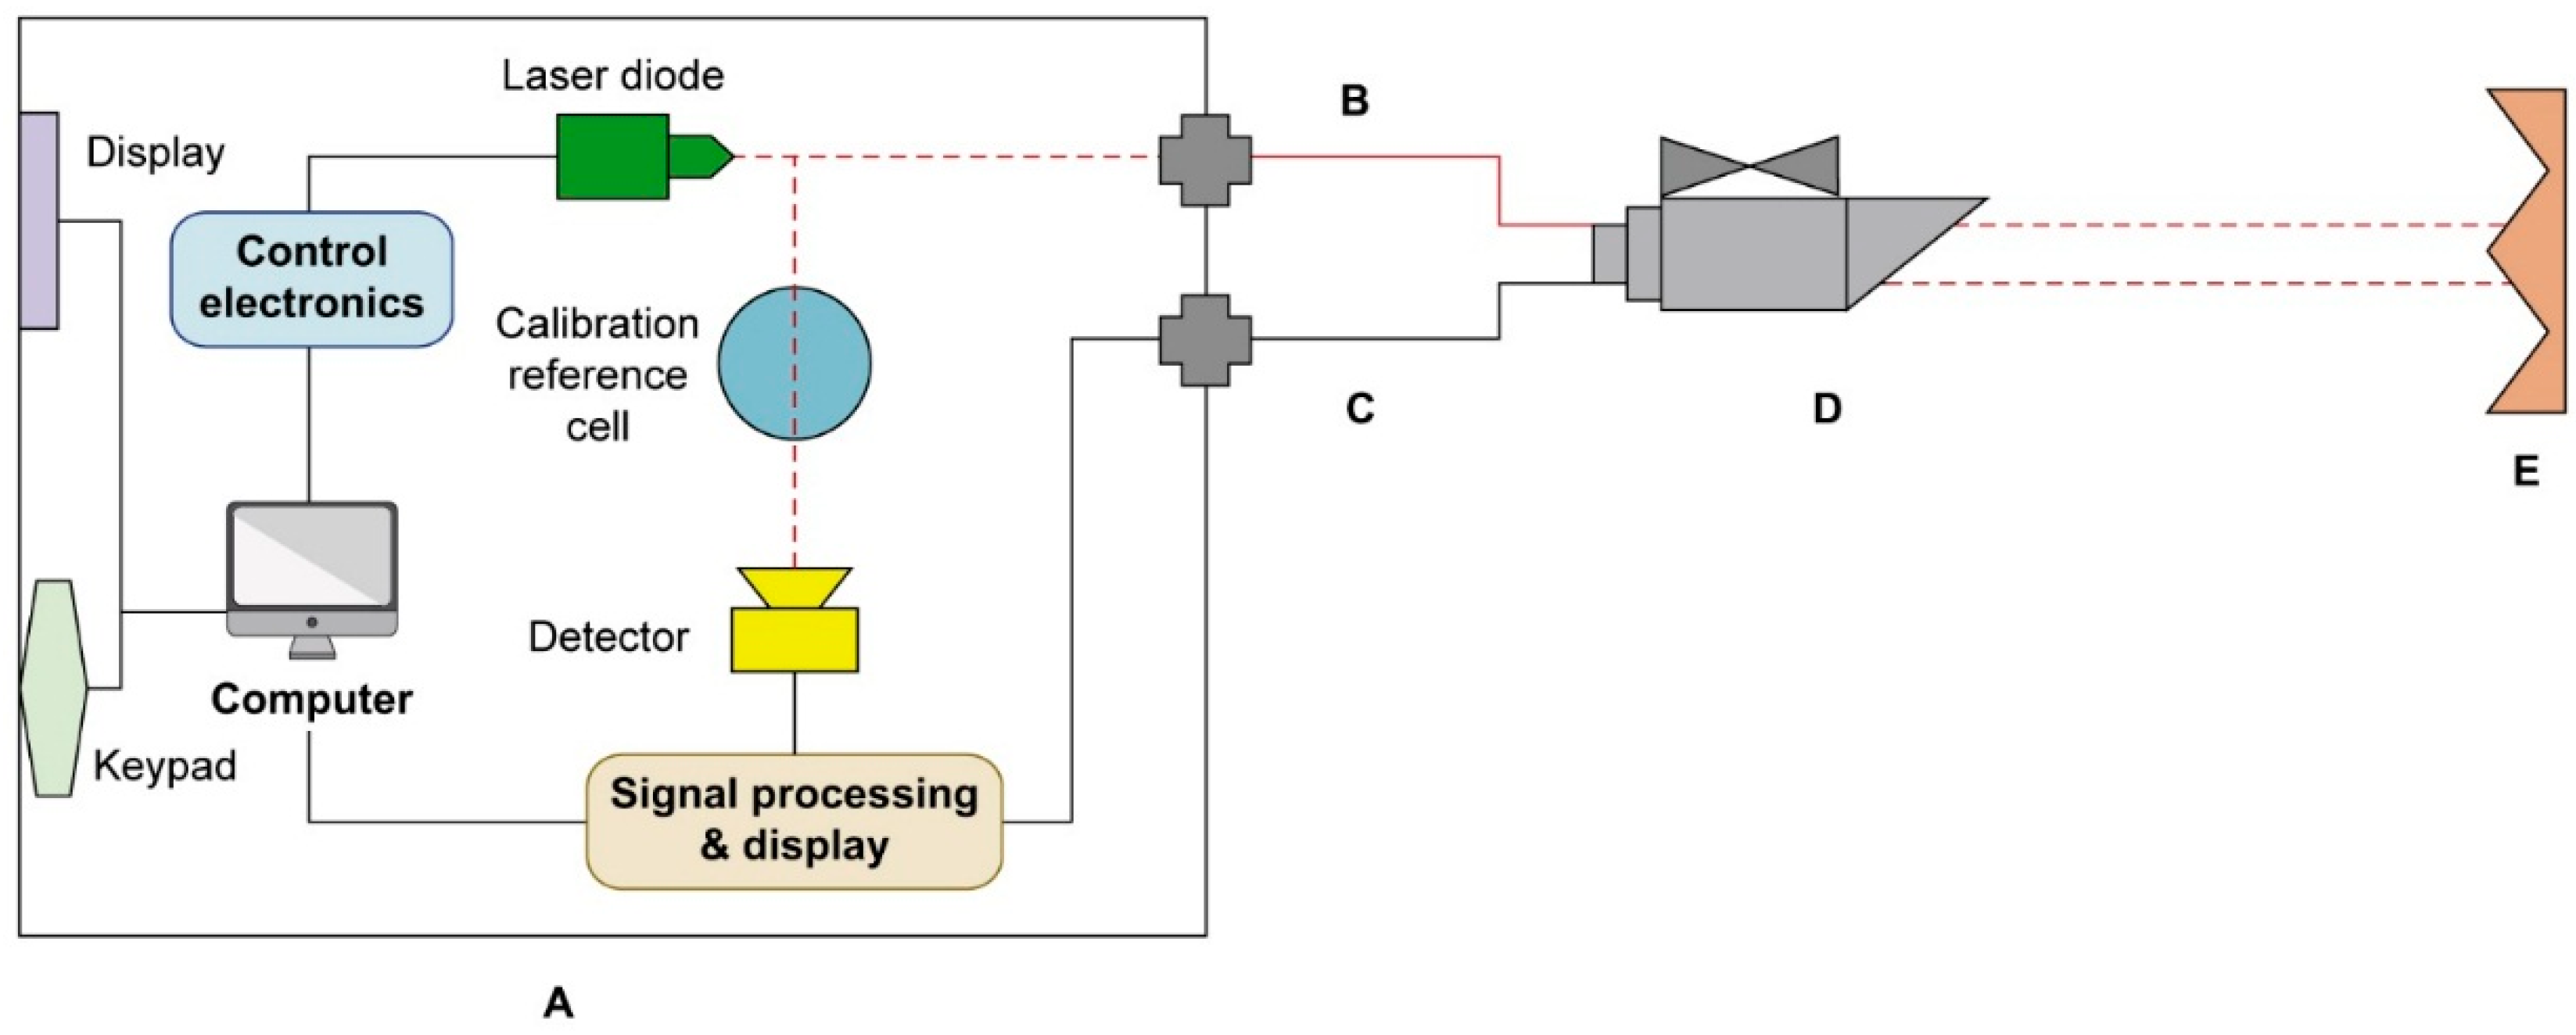
2.1.2. OP-Laser
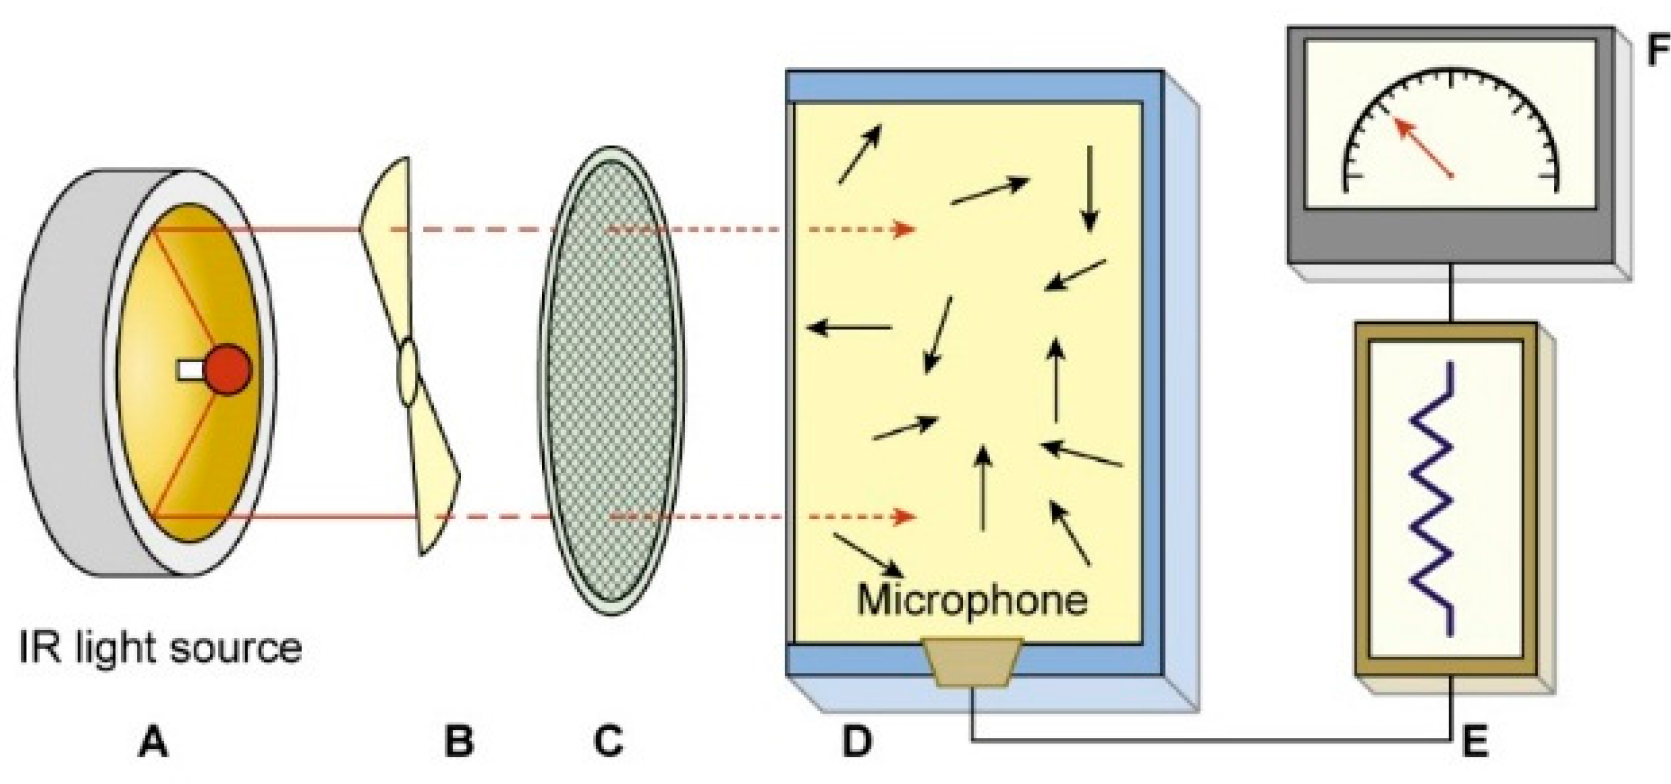
2.1.3. PAS Analyzer

| NDIR Sensor | OP-Laser | PAS Analyzer | |
|---|---|---|---|
| Operating principle | Non-Dispersive Infra-Red | Tunable Diode Laser Absorption Spectroscopy | Photoacoustic spectroscope |
| Target gas | CO2 only | CO2 only | CO2 and others |
| Tuned wavelength for detection of CO2 (µm) | 4.3 | 1.6 | 14.1 |
| Detection limit | 0.2 ppmv | 2000 ppm∙m | 1.5 ppmv |
| Accuracy | ±30 ppmv ± 2% | 500 ppm∙m | ±1% |
| Response time (T1/e) | 20 s (diffusion time) | 1 s (scan rate) | 25 s (for 1 gas, including flushing period and 5 s sampling integration time) |
| Operating temperature (°C) | 0 to +50 °C | −45 °C to +80 °C | −20 °C to +70 °C |
| Sensitivity to pressure 1 | 0.1% | Not determined | 0.5% |
| Type of calibration | Two-points calibration in the laboratory | Continuous self-calibration mechanism with a reference gas crystal cell | Two-points calibration at factory |
| Laboratory check of calibration with certified gas | Yes | Yes | Yes |
| Cross-compensation for water vapor | Not needed | Not needed | Yes |
| Cost per unit (€) 2 | 300 | 35,000 | 28,000 |
2.2. Laboratory Tests and Calibration of NDIR Sensors
- Ssp = sensitivity of the NDIR to change in static pressure (% of change in raw data per unit of pressure);
- Δraw = measured range of raw data (mV);
- Avgraw = average raw data value (mV);
- Δsp = measured range of pressure (hPa).
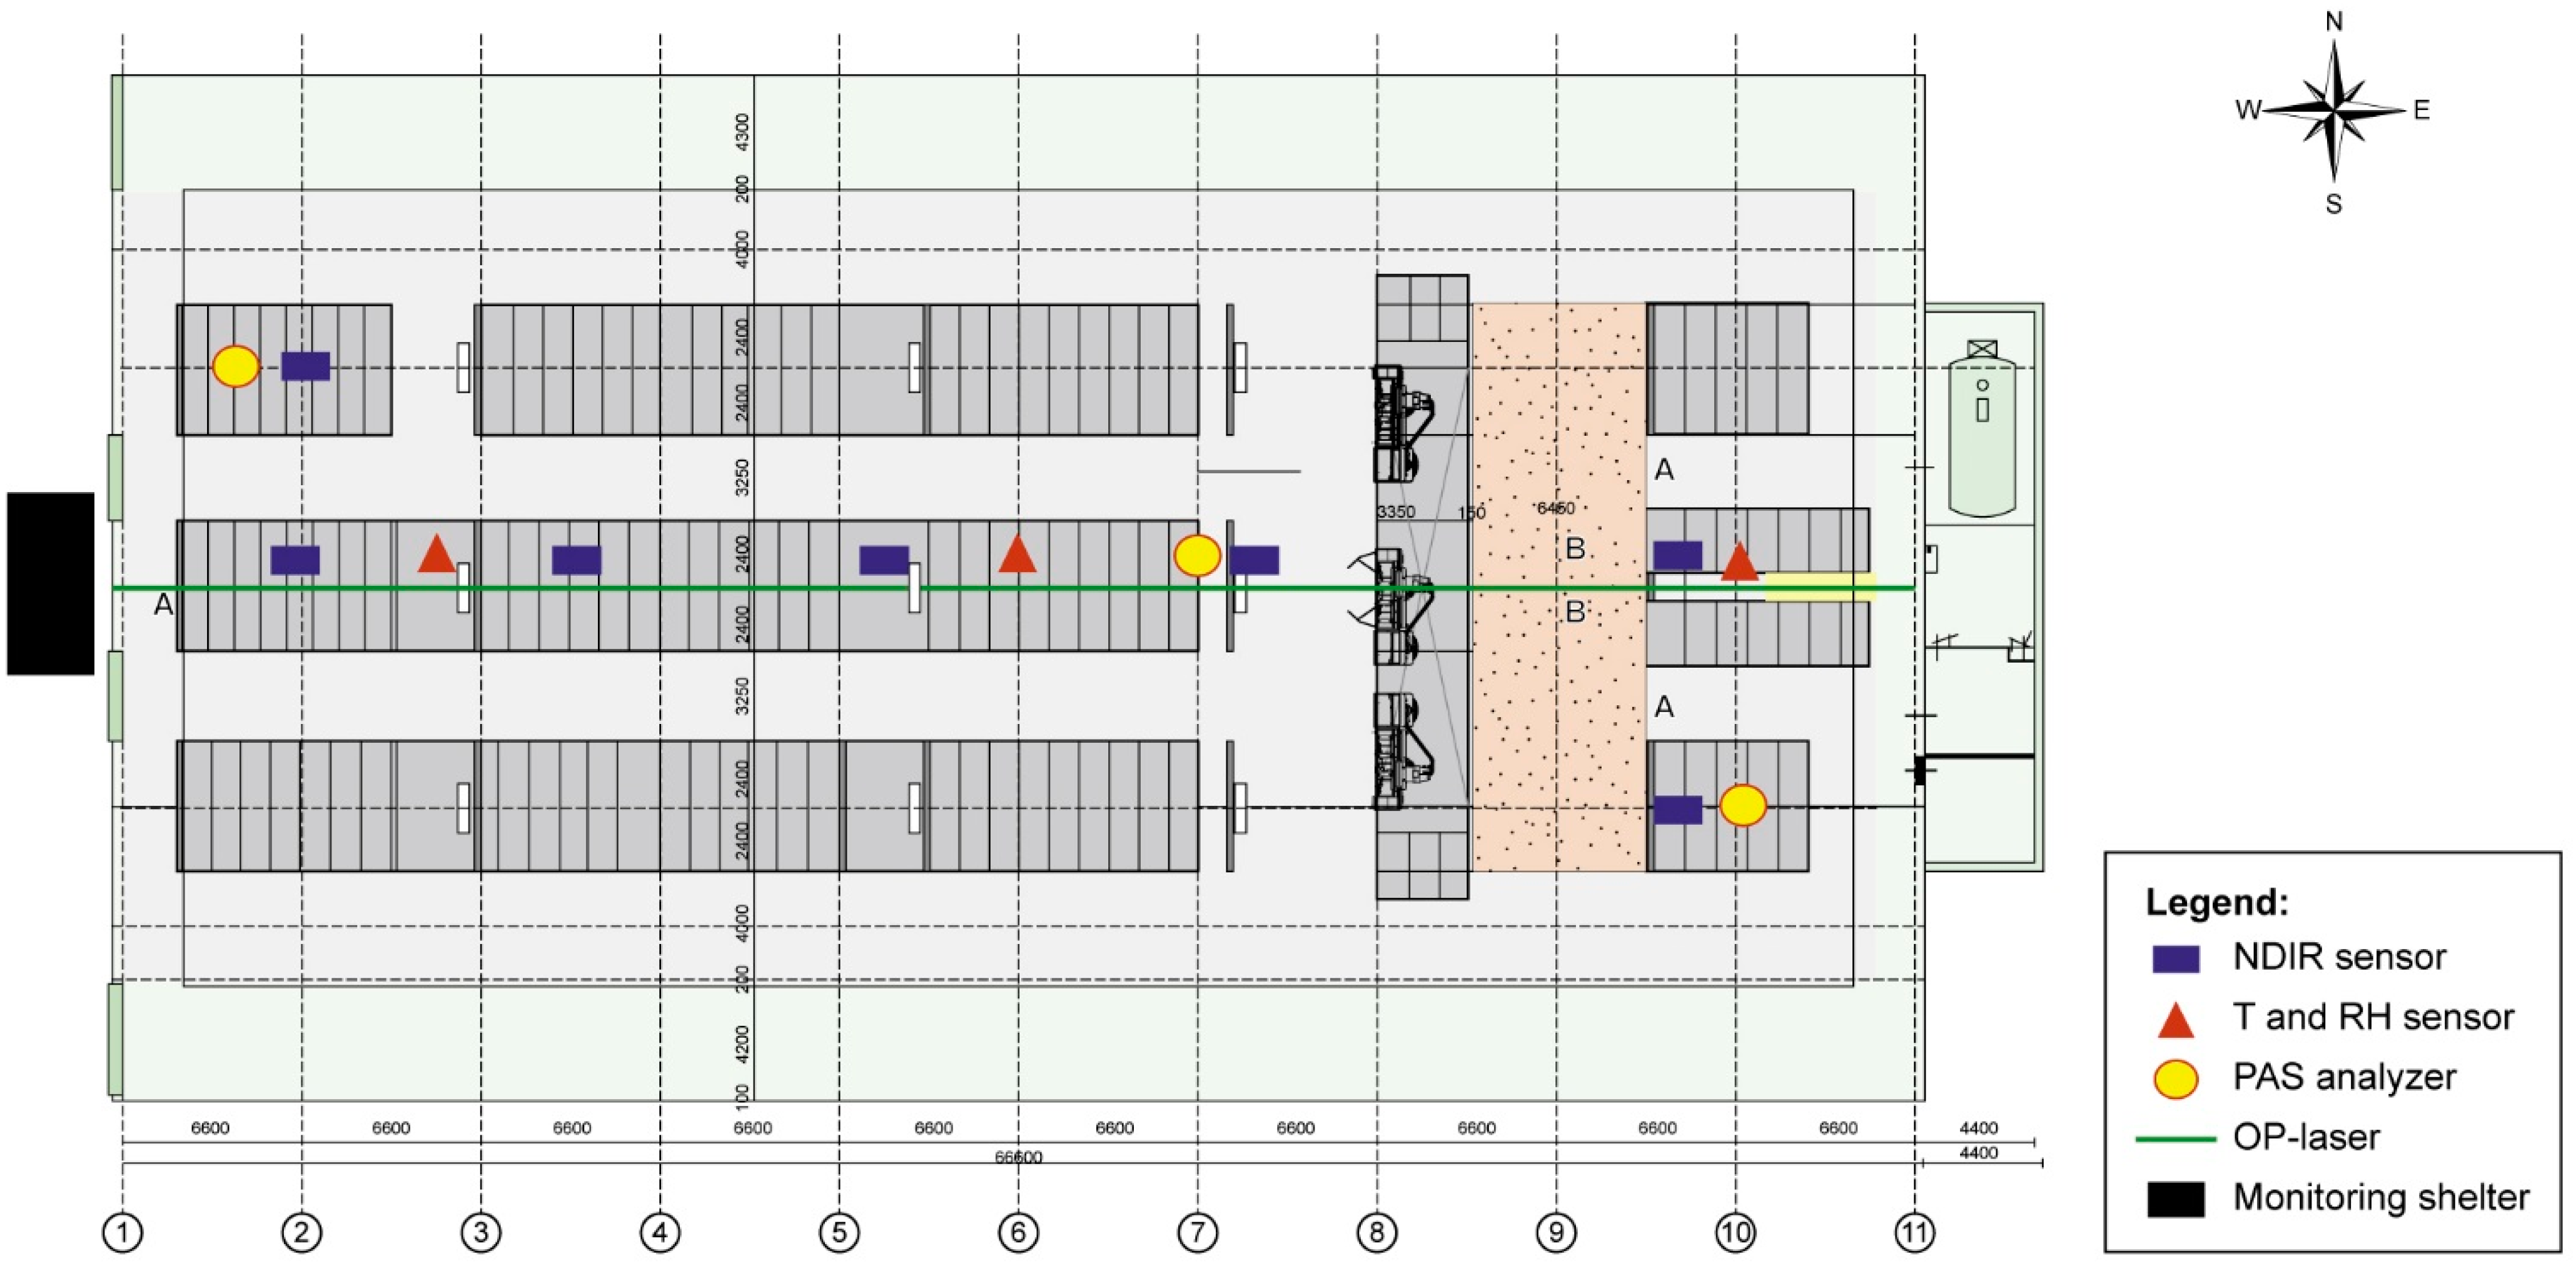
2.3. Description of the Livestock Barn
2.4. Field Experimental Setup and Data Collection Procedure
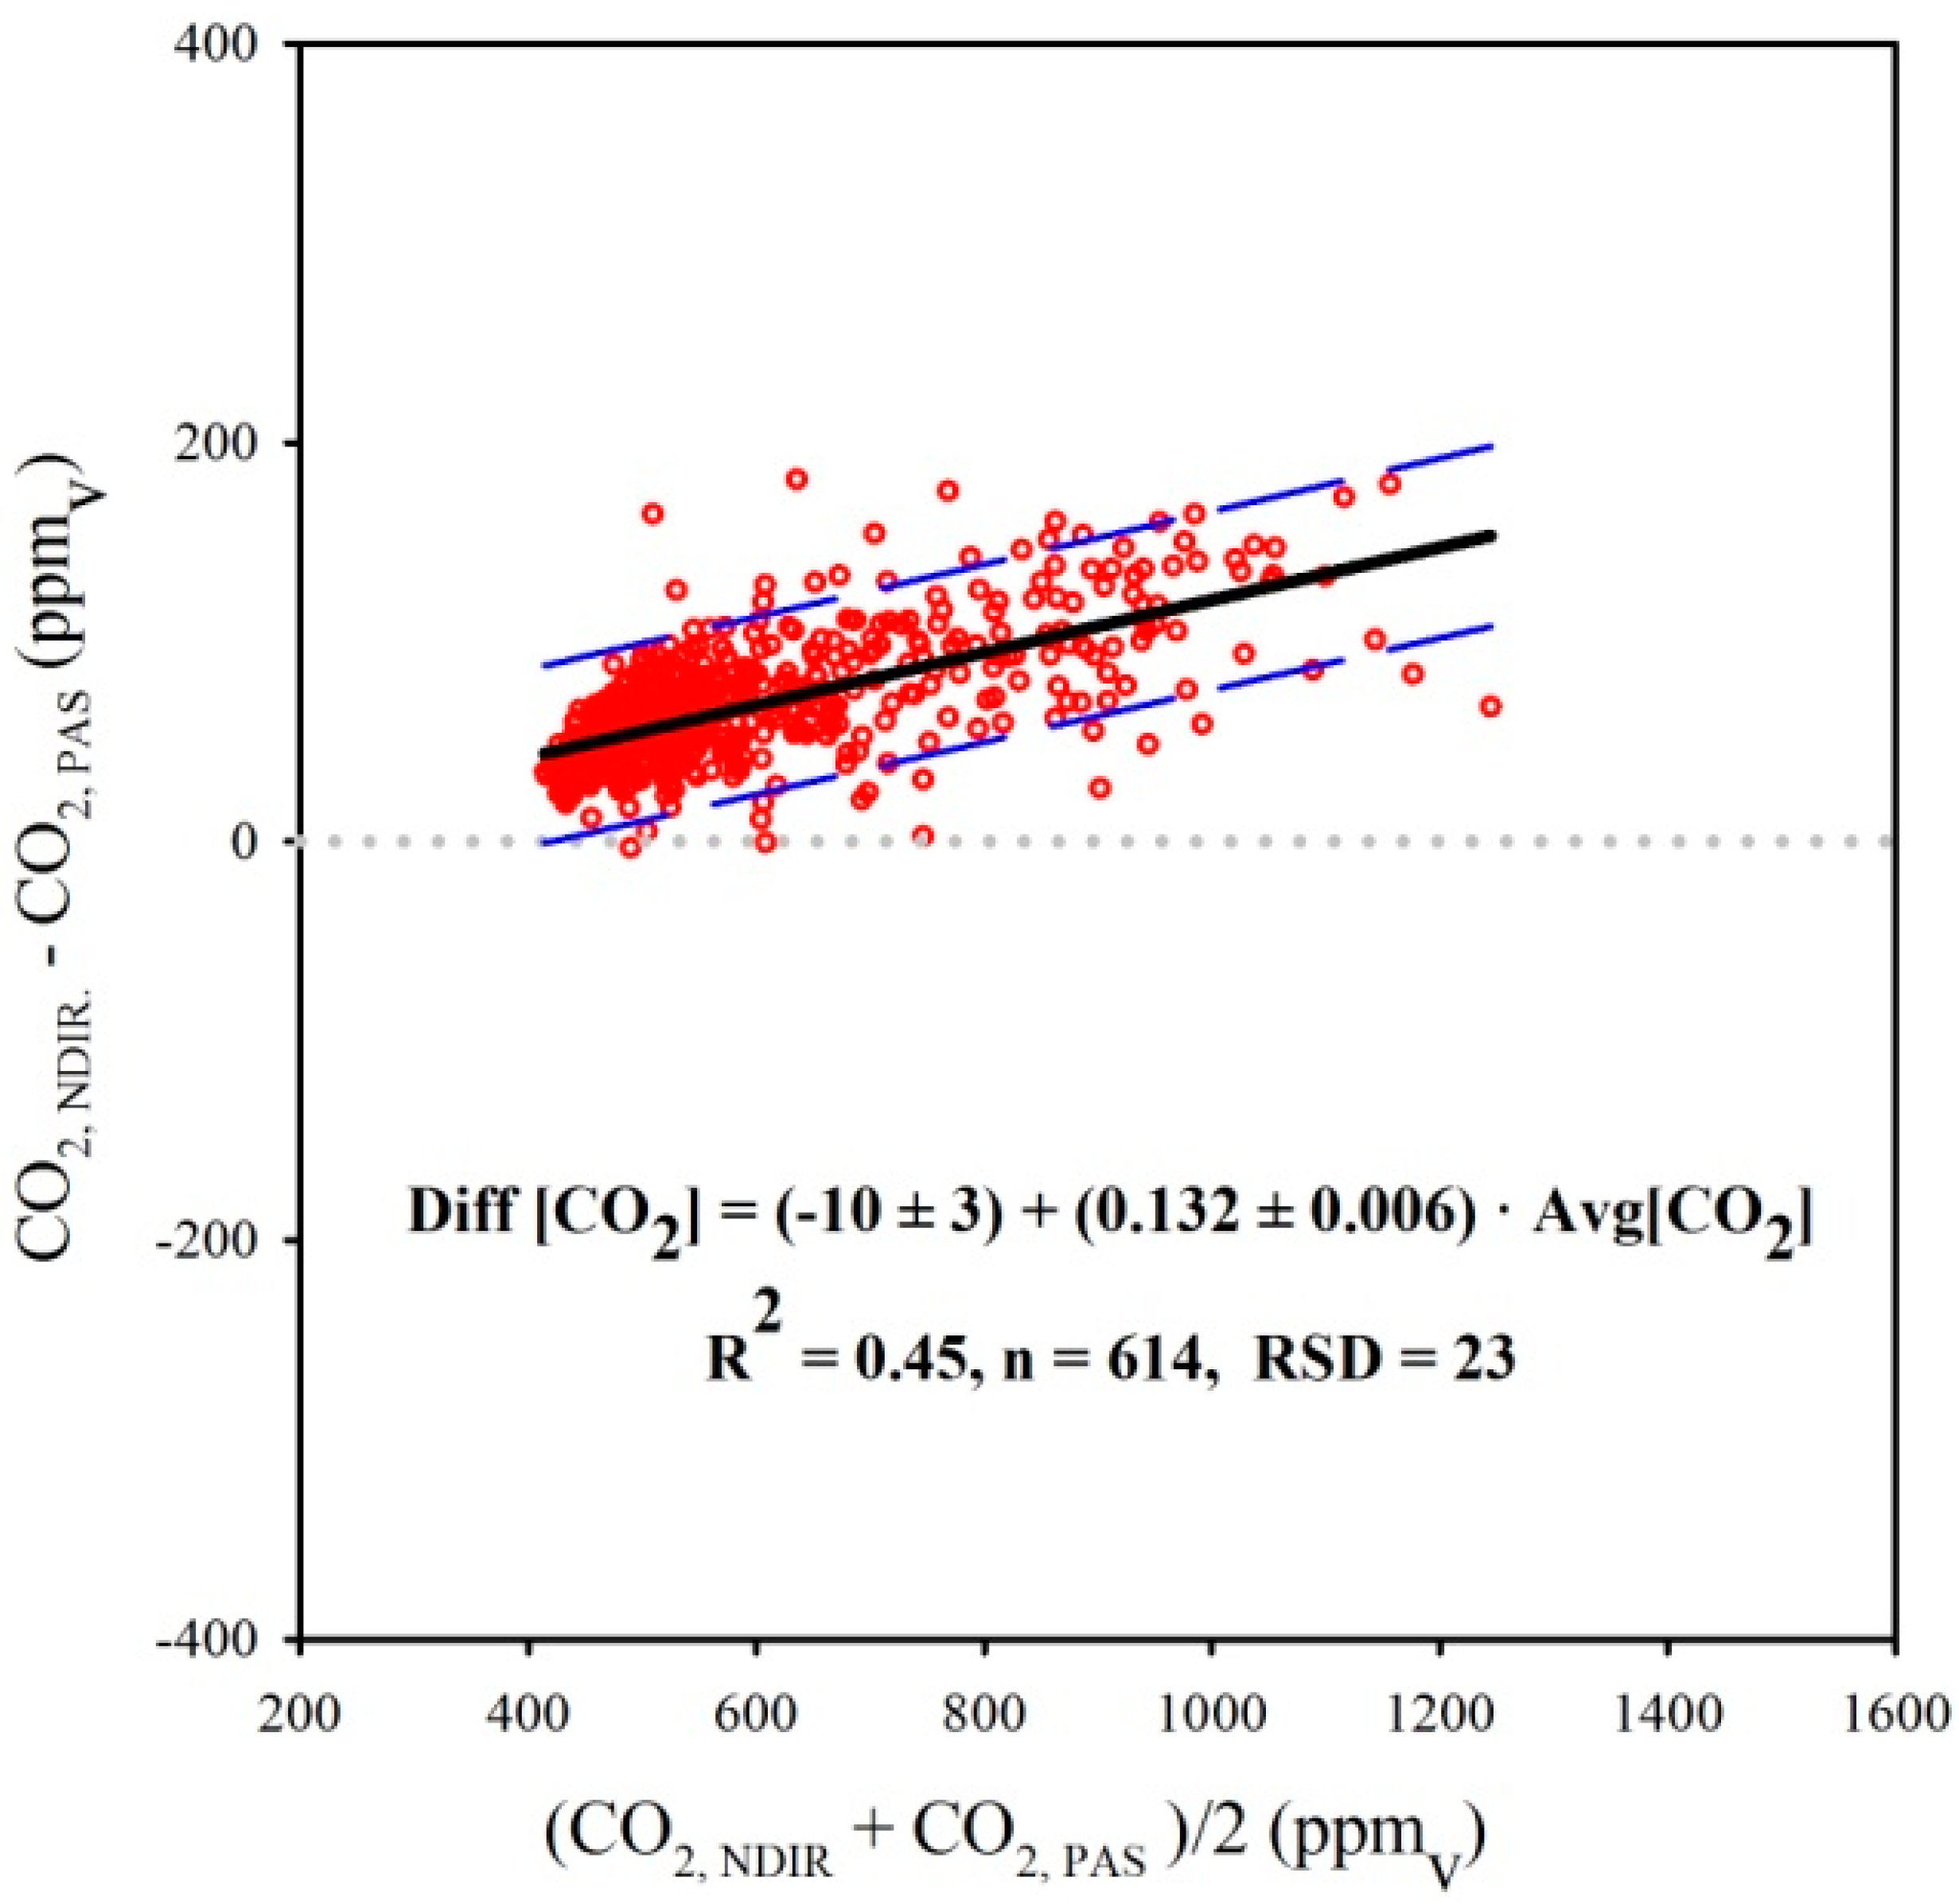
2.5. Analysis of Agreement between Laboratory and Field Comparison Methods
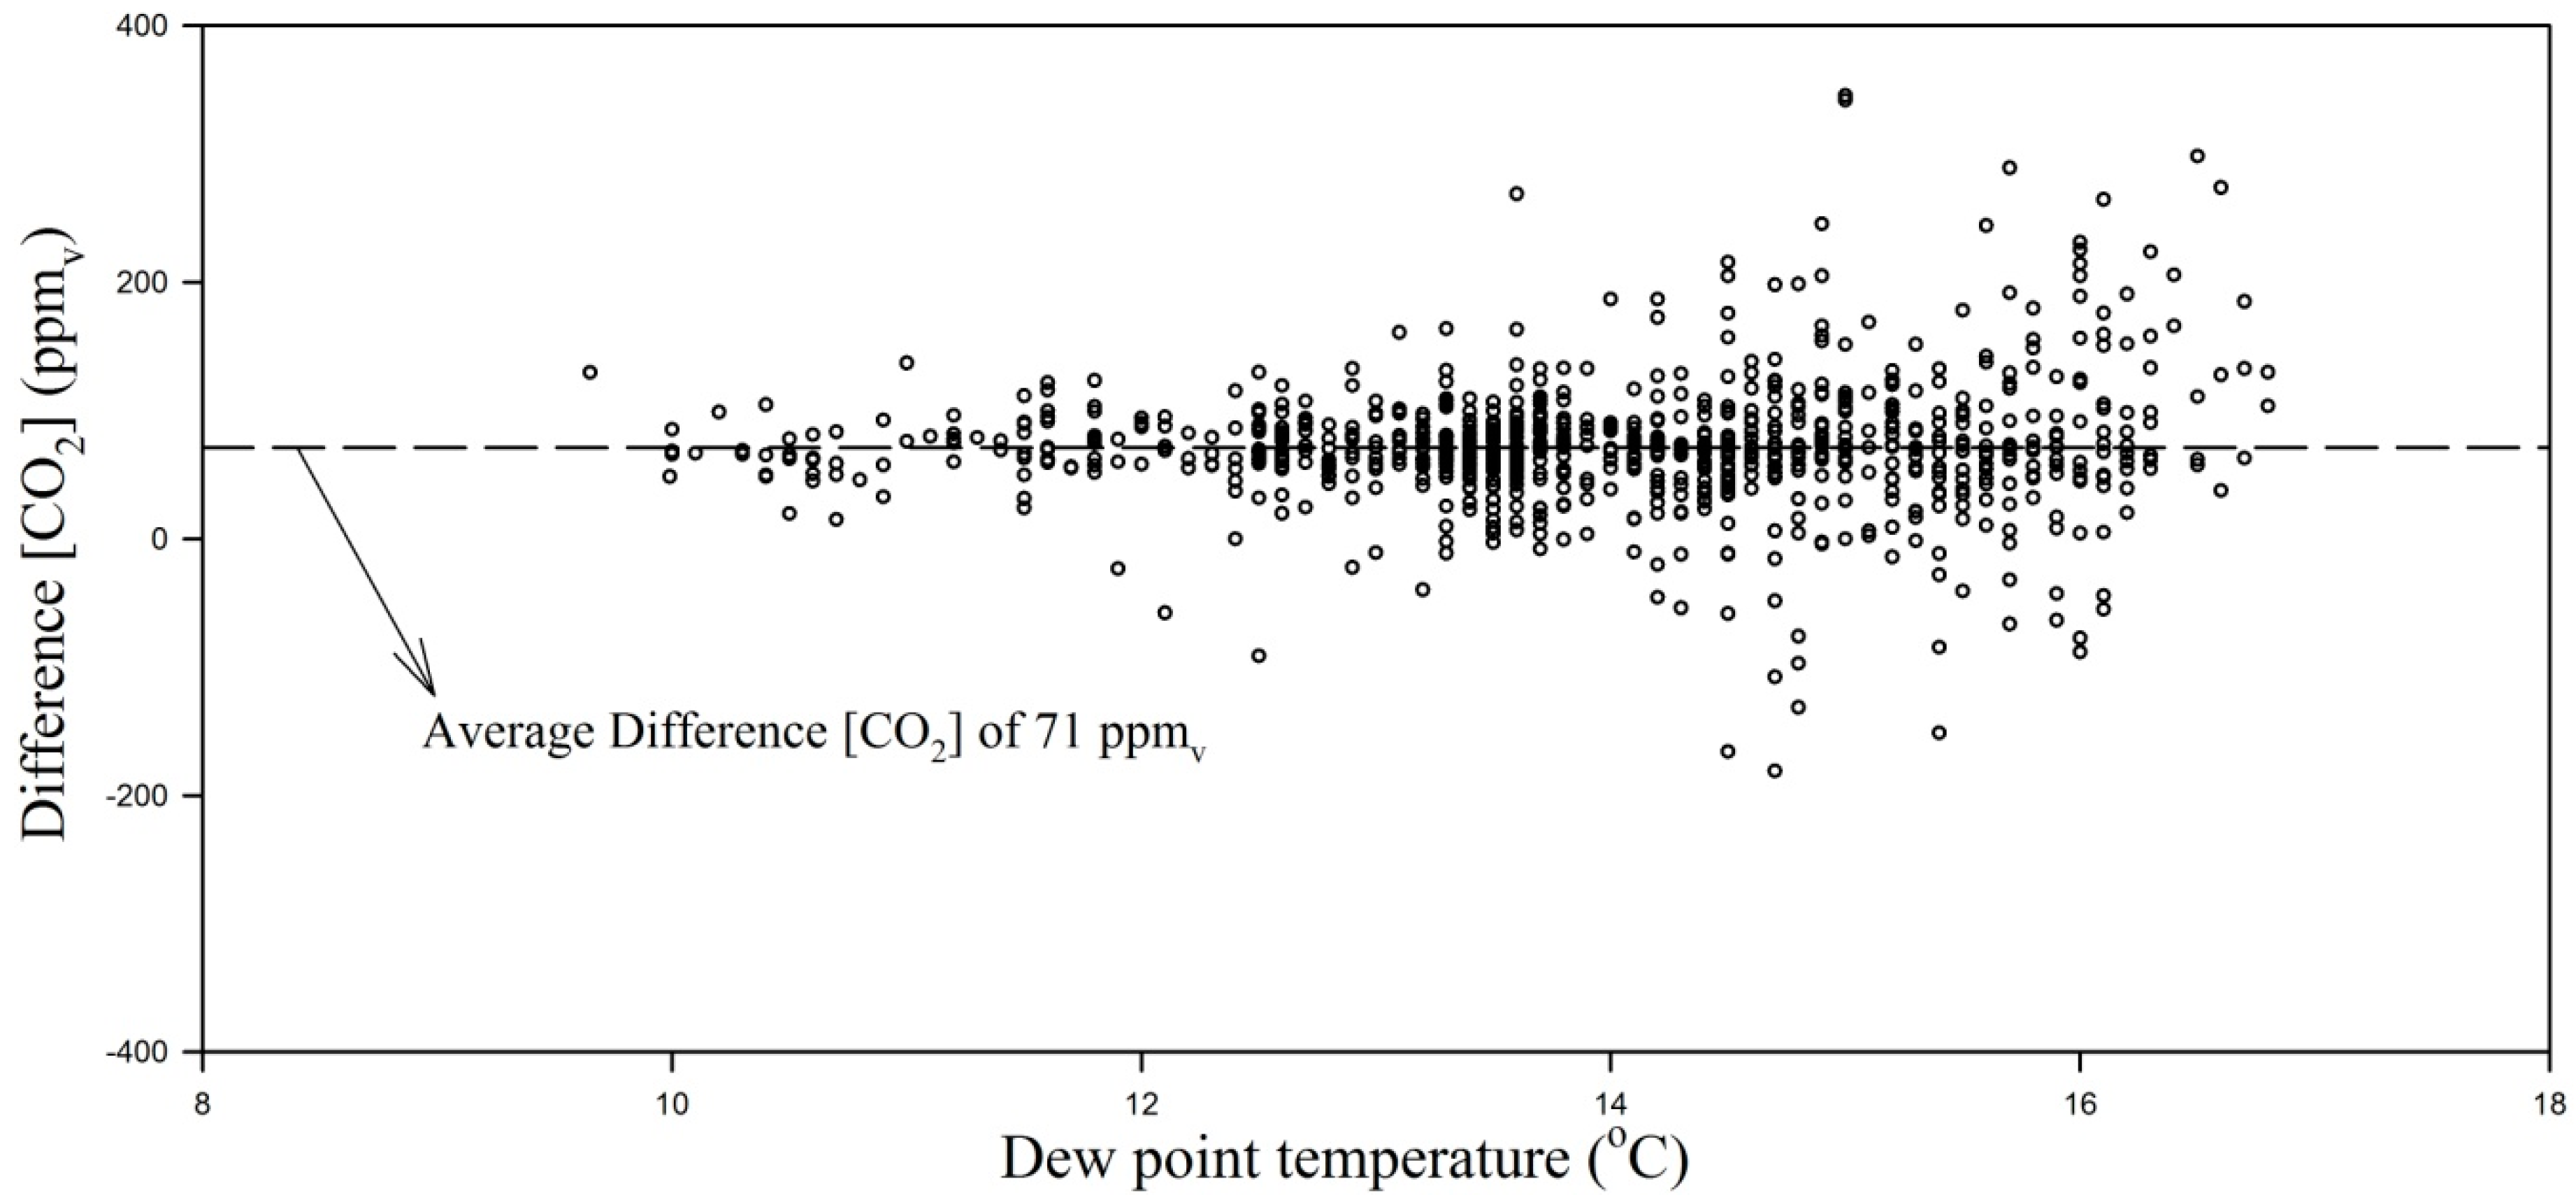
- Diff[CO2] = ([CO2]NDIR – [CO2]OP-laser or PAS), difference between CO2 concentrations obtained from the NDIR sensors and OP-laser or PAS analyzers, ppmv;
- βo = Y-intercept, a measure of systematic positive or negative bias, ppmv;
- β1 = Slope, a measure of non-systematic heterogeneous bias, non-dimensional;
- Avg[CO2] = ([CO2]NDIR + [CO2]OP-laser or PAS)/2; average between concentration measurements obtained from the NDIR sensors and OP-laser or PAS analyzers, ppmv.
3. Results and Discussion
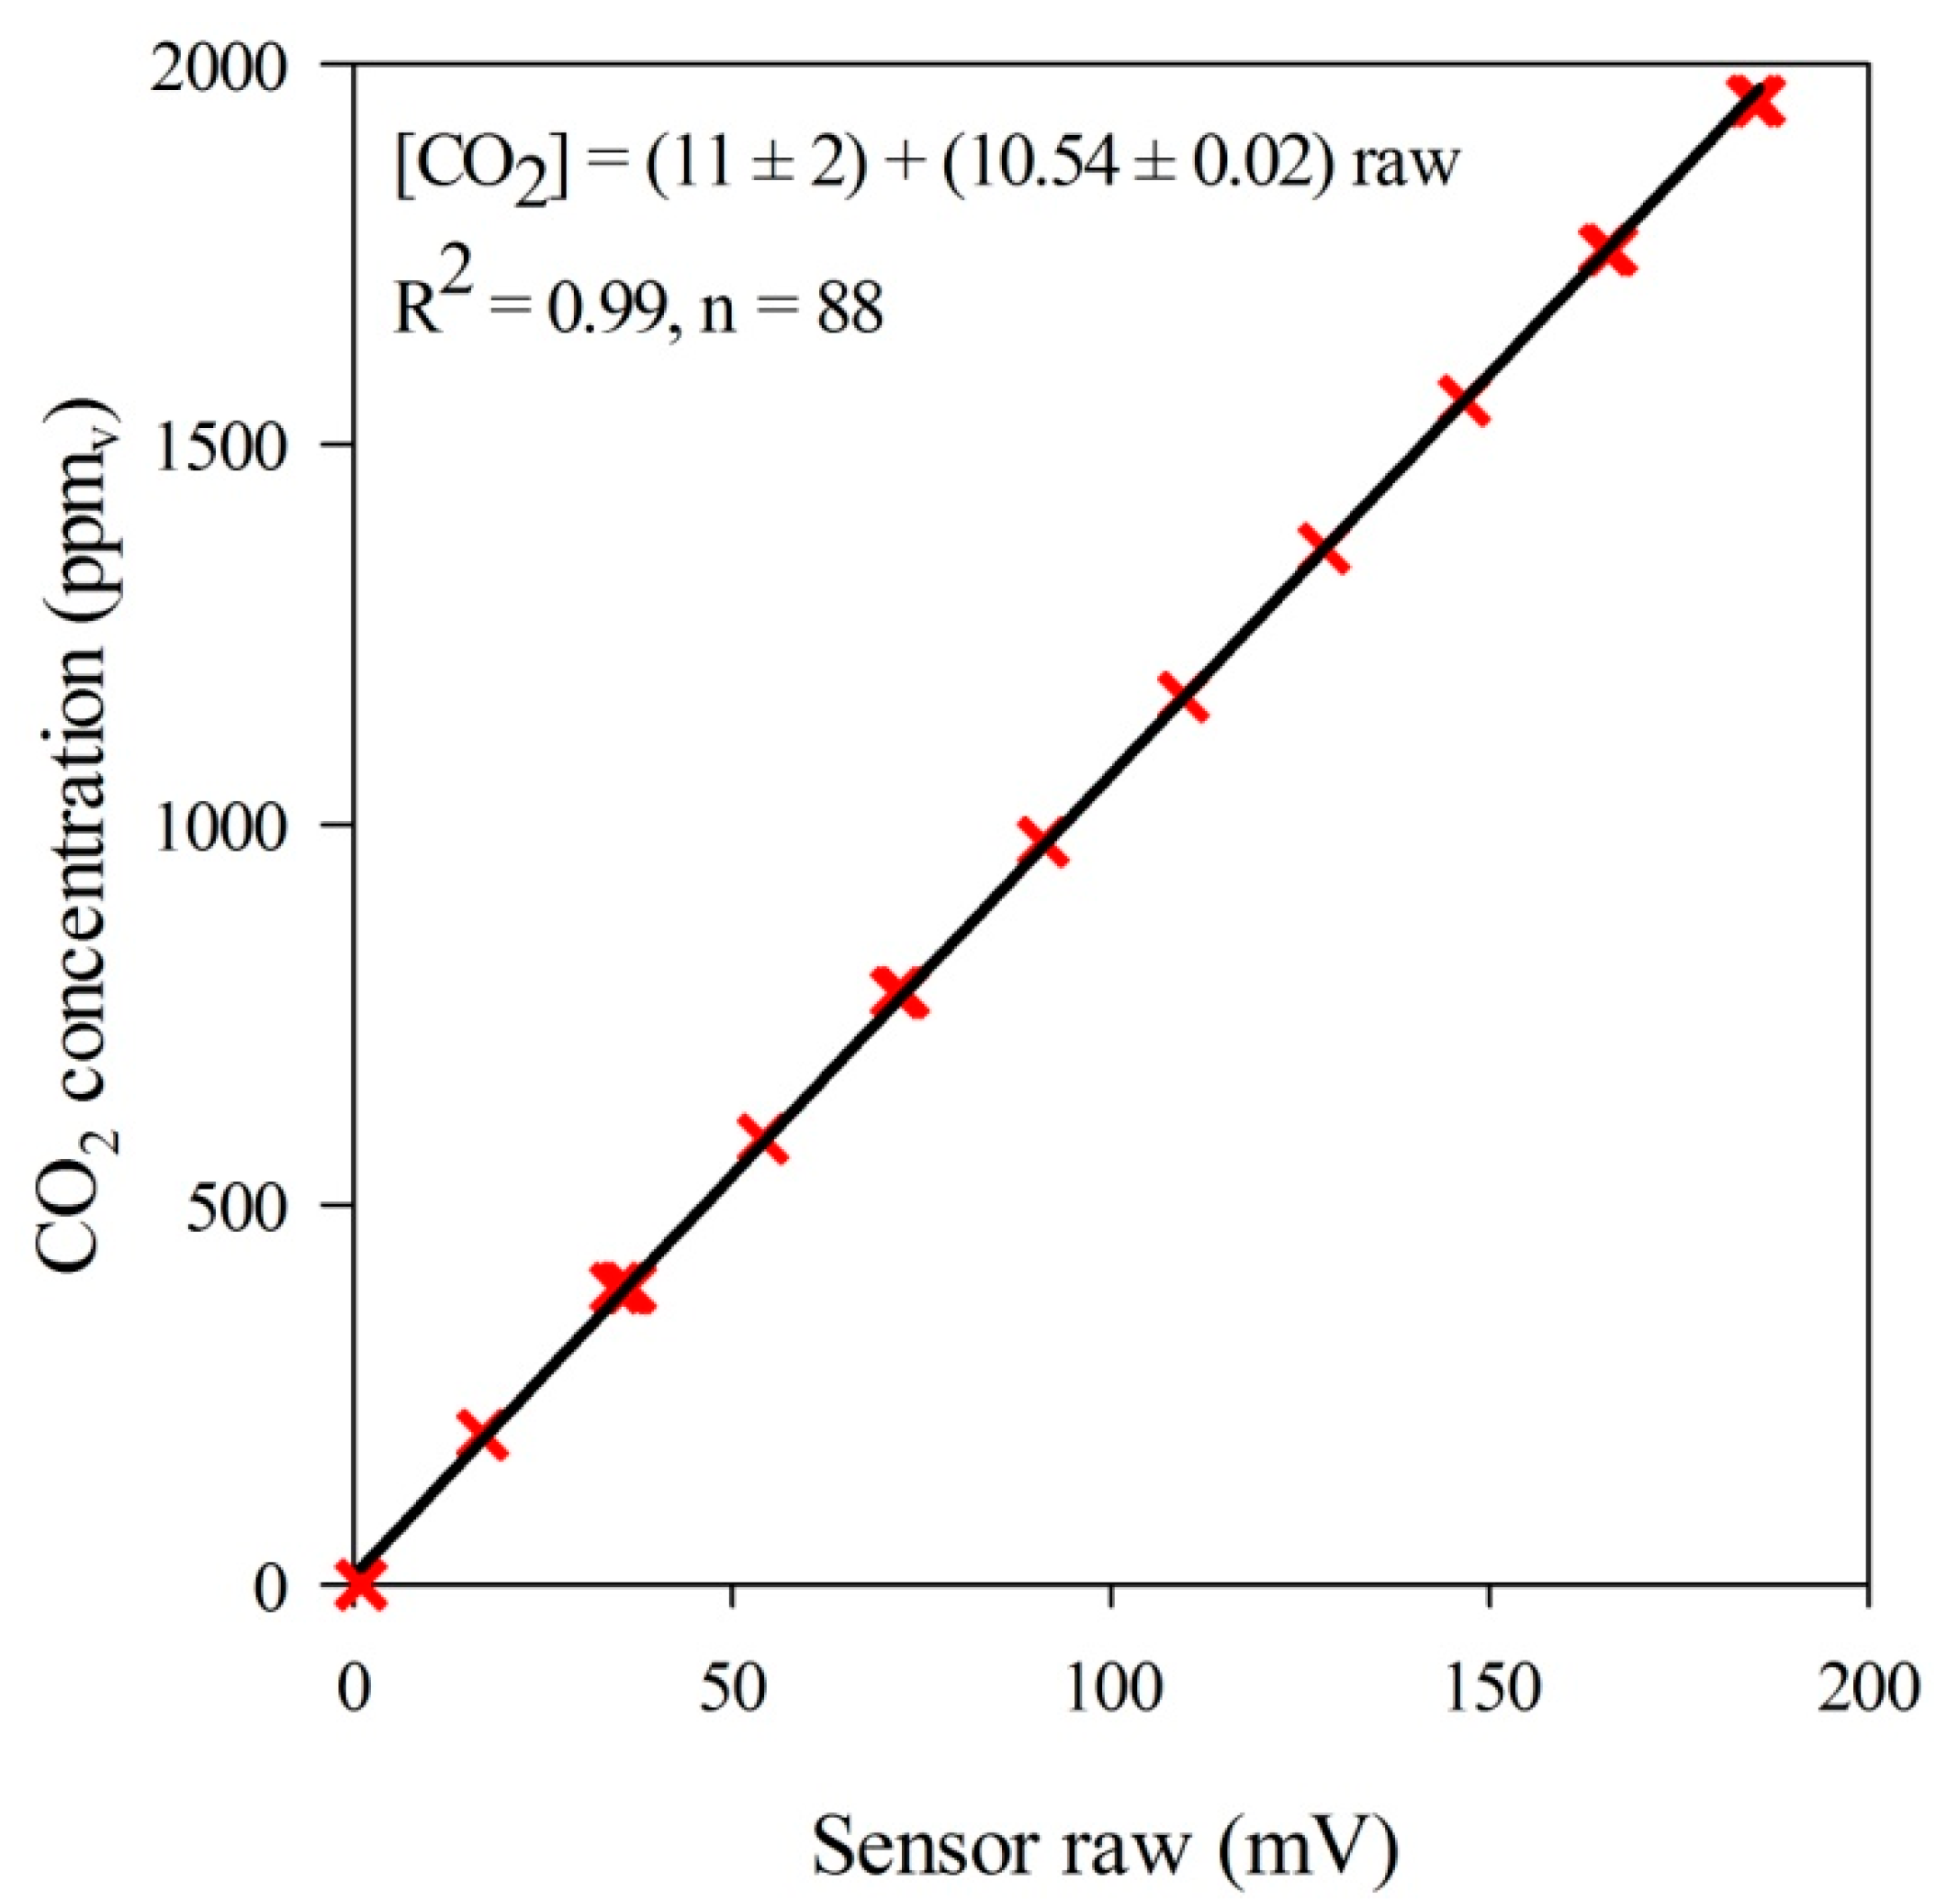
3.1. Laboratory Tests with the NDIR Sensors
| Sensor ID | a ± SE | b ± SE |
|---|---|---|
| 03062CE1 | −11 ±10 | 10.40 * ± 0.30 |
| 03062CD1 | −9 ± 7 | 10.40 * ± 0.20 |
| 03062CDF | −9 ± 8 | 10.40 * ± 0.20 |
| 0306281F | −9 ± 14 | 10.10 * ± 0.10 |
| 0305EFAB | −9 ± 8 | 10.06 * ± 0.06 |
| 0306820 | −10 ± 7 | 10.08 * ± 0.05 |
| 0306813 | −9.8 * ± 0.5 | 10.12 * ± 0.03 |
| 03062CE0 | −10 * ± 1 | 10.12 * ± 0.01 |
| 03062CD5 | −10 ± 6 | 10.13 * ± 0.04 |
| 030627C8 | −9 ± 7 | 10.13 * ± 0.05 |
| 0305DEF5 | −10.4 * ± 0.2 | 10.13 * ± 0.01 |
| 03062CD3 | −9.5 * ± 0.4 | 10.13 * ± 0.03 |
| 030627CA | −9.4 * ± 0.2 | 10.13 * ± 0.01 |
| 03062CD4 | −10 * ± 3 | 10.14 * ± 0.02 |
| 03062D34 | −11 * ± 7 | 10.61 * ± 0.03 |
| 030627CB | −10 * ± 3 | 10.13 * ± 0.02 |
| 03062C0 | −15 * ± 6 | 10.64 * ± 0.01 |
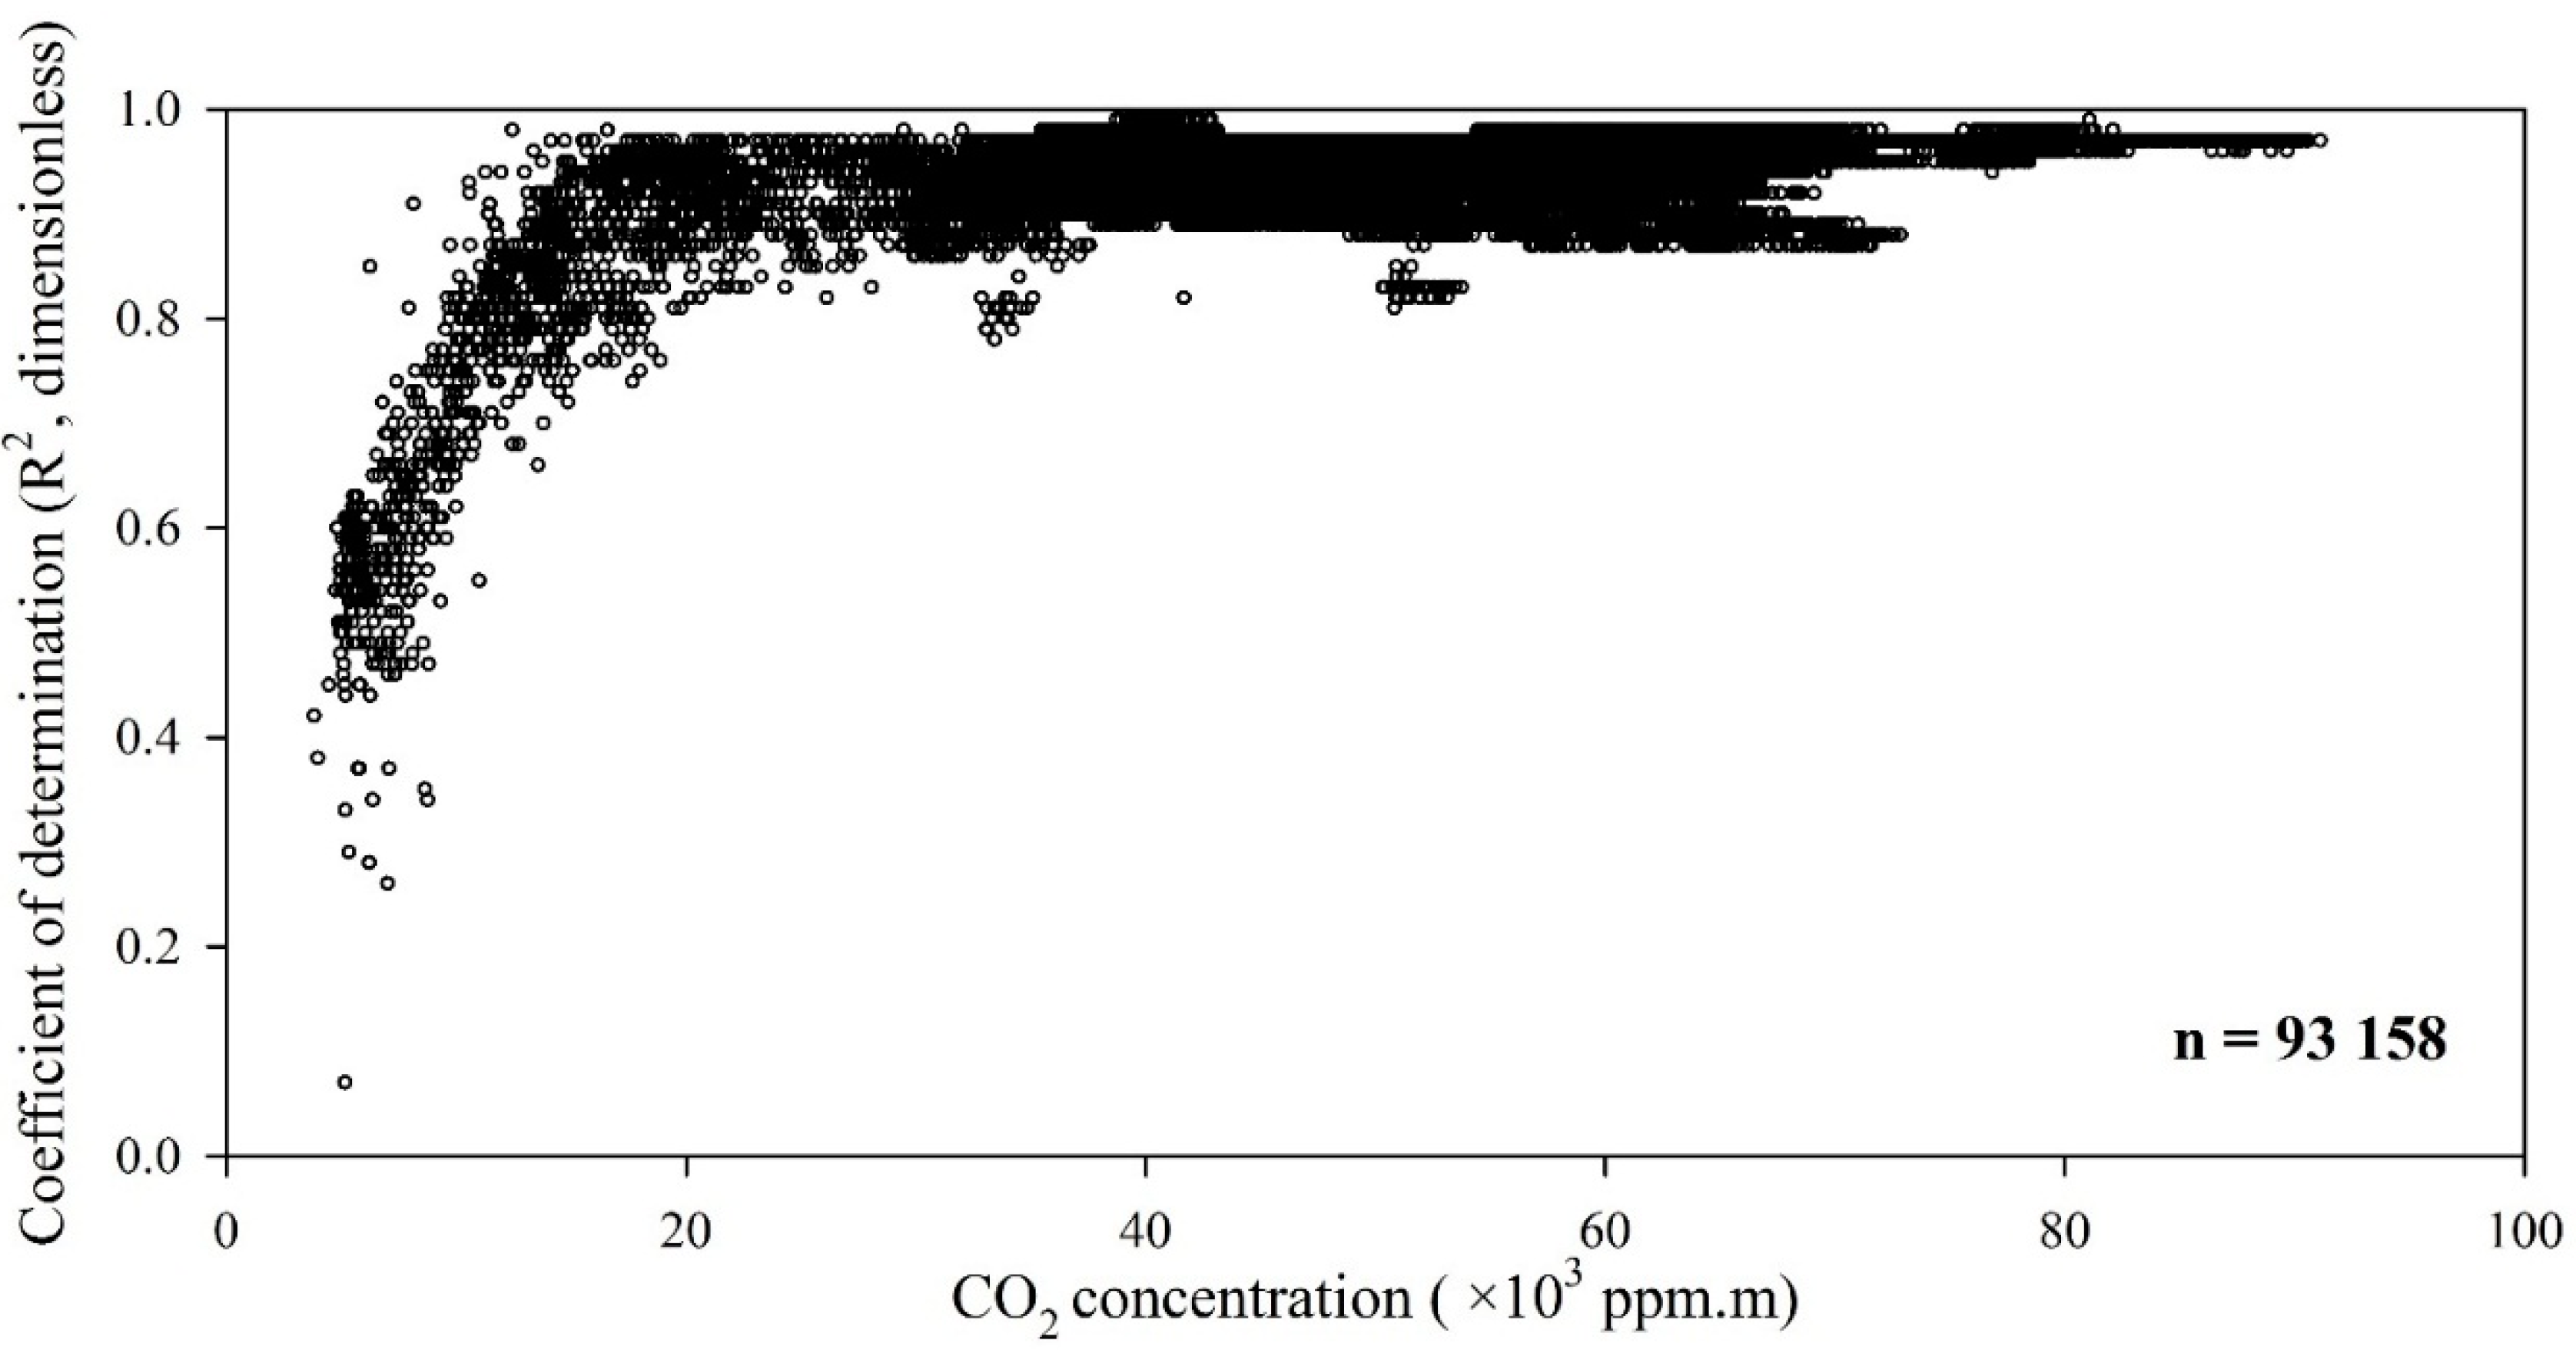
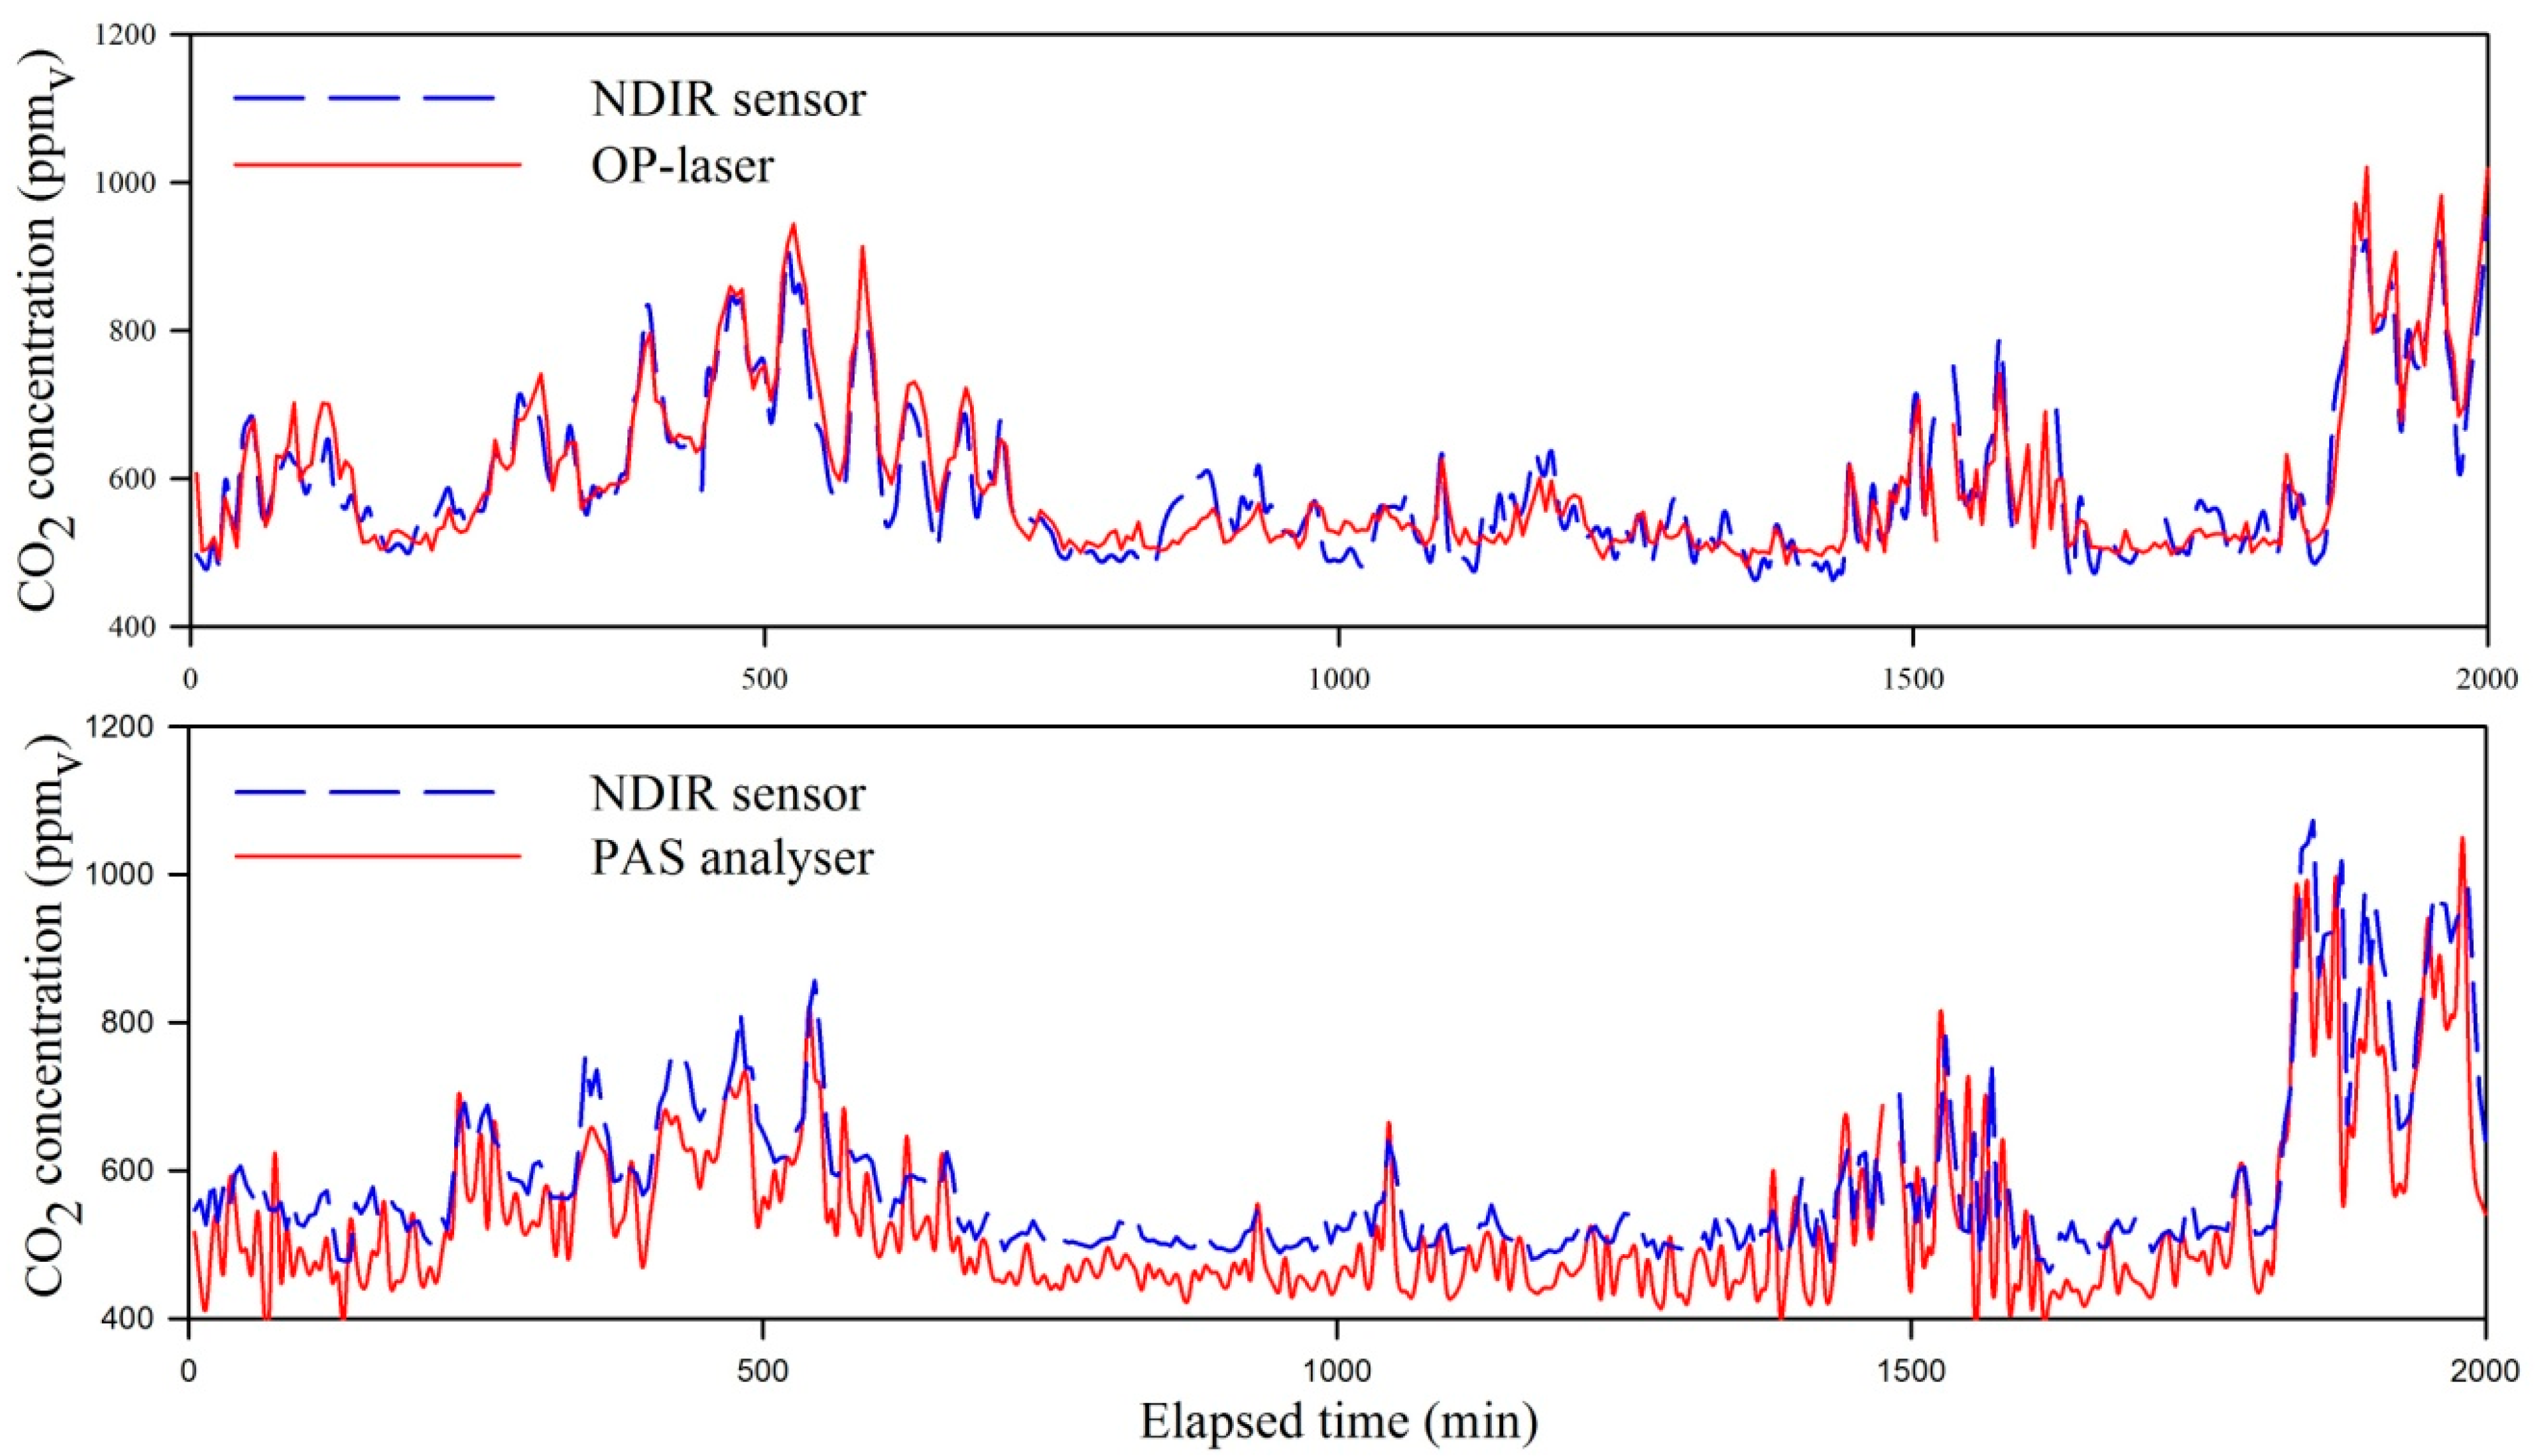
3.3. Analysis of Agreement of CO2 Data from NDIR Sensors against PAS and OP-Laser Data

4. Conclusions
- (1)
- The tested NDIR sensor presents a small variability between sensors of 5%, and a sensitivity to static pressure of 0.08% of the reading per each 1 hPa;
- (2)
- In order to represent the overall CO2 concentration of the dairy cow barn, the number of NDIR sensors to be accounted for average concentration calculation is dependent on barn length and on barn area occupation.
- (3)
- The NDIR CO2 sensors are suitable for multi-point monitoring of CO2 concentrations in NV livestock barns, and is a feasible alternative for the PAS and the OP-laser methods to monitor single-point or averaged spatial CO2 concentrations in livestock barns.
Acknowledgments
Author Contributions
Abbreviations
| NV | naturally ventilated |
| PAS | Photo-Acoustic Spectroscope |
| NDIR | Non-Dispersive Infra-Red |
| L | Length dimension |
| W | Width dimension |
| H | Height dimension |
| OP | Open-Path |
| PTFF | polytetrafluoroethylene |
Conflicts of Interest
References
- Ogink, N.W.M.; Mosquera, J.; Calvet, S.; Zhang, G. Methods for measuring gas emissions from naturally ventilated livestock buildings: Developments over the last decade and perspectives for improvement. Biosyst. Eng. 2013, 116, 297–308. [Google Scholar] [CrossRef]
- Feddes, J.J.R.; Leonard, J.J.; McQuitty, J.B. Carbon dioxide concentration as a measure of air exchange in animal housing. Can. Agric. Eng. 1984, 26, 53–56. [Google Scholar]
- Van Ouwerkerk, E.N.J.; Pedersen, S. Application of the carbon dioxide mass balance method to evaluate ventilation rate in livestock buildings. In Proceedings of the XII World Congress on Agricultural Engineering, Milan, Italy, 29 August–1 September 1994; pp. 516–529.
- Heber, A.J.; Ni, J.Q.; Haymore, B.L.; Duggirala, R.K.; Keener, K.M. Air quality and emission measurement methodology at swine finishing buildings. Trans. Am. Soc. Agric. Eng. 2001, 44, 1765–1778. [Google Scholar] [CrossRef]
- Blanes, V.; Pedersen, S. Ventilation flow in pig houses measured and calculated by carbon dioxide, moisture and heat balance equations. Biosyst. Eng. 2005, 92, 483–493. [Google Scholar] [CrossRef]
- Xin, H.; Burns, R.T.; Gates, R.S.; Overhults, D.; Earnest, J.W. Use of CO2 concentration difference or CO2 balance to assess ventilation rate of broiler houses. Trans. ASABE 2009, 52, 1353–1361. [Google Scholar] [CrossRef]
- Samer, M.; Berg, W.; Fiedler, M.; Von Bobrutzki, K.; Ammon, C.; Sanftleben, P.; Brunsch, R. A comparative study among H2O-balance, heat balance, CO2-balance and radioactive tracer gas technique for airflow rates measurement in naturally ventilated dairy barns. In Proceedings of the Ninth International Livestock Environment Symposium (ILES IX), Valencia, Spain, 8–12 July 2012; pp. 1–7.
- Mendes, L.B.; Tinôco, I.F.F.; Saraz, J.A.O.; Ogink, N.W.M.; Xin, H. A refined protocol for calculating ventilation rates of naturally ventilated broiler barns based on metabolic CO2 production. DYNA 2014, 81, 189–195. [Google Scholar] [CrossRef]
- Demmers, T.G.M.; Phillips, V.R.; Short, L.S.; Burgess, L.R.; Hoxey, R.P.; Wathes, C.M. SE—Structure and Environment: Validation of ventilation rate measurement methods and the ammonia emission from naturally ventilated dairy and beef buildings in the United Kingdom. J. Agric. Eng. Res. 2001, 79, 107–116. [Google Scholar] [CrossRef]
- Snell, H.G.J.; Seipelt, F.; Weghe, H.F.A. Van den Ventilation rates and gaseous emissions from naturally ventilated dairy houses. Biosyst. Eng. 2003, 86, 67–73. [Google Scholar] [CrossRef]
- Wu, W.; Zhang, G.; Takai, P. Ammonia and methane emissions from two naturally ventilated dairy cattle buildings and the influence of climatic factors on ammonia emissions. Atmos. Environ. 2012, 61, 232–243. [Google Scholar] [CrossRef]
- Kiwan, A.; Berg, W.; Fiedler, M.; Ammon, C.; Gläser, M.; Müller, H.J.; Brunsch, R. Air exchange rate measurements in naturally ventilated dairy buildings using the tracer gas decay method with 85Kr, compared to CO2 mass balance and discharge coefficient methods. Biosyst. Eng. 2013, 116, 286–296. [Google Scholar] [CrossRef]
- Pedersen, S.; Blanes-Vidal, V.; Joergensen, H.; Chwalibog, A.; Haeussermann, A.; Heetkamp, M.J.W.; Aarnink, A.J.A. Carbon dioxide production in animal houses: A literature review. Agric. Eng. Int. 2008, X, 1–19. [Google Scholar]
- CIGR. Animal Housing in Hot Climates—A multidisciplinary View; Danish Institute of Agricultural Sciences: Horsens, Denmark, 2006. [Google Scholar]
- Calvet, S.; Gates, R.S.; Zhang, G.; Estellés, F.; Ogink, N.W.M.; Pedersen, S.; Berckmans, D. Measuring gas emissions from livestock buildings: A review on uncertainty analysis and error sources. Biosyst. Eng. 2013, 116, 221–231. [Google Scholar] [CrossRef]
- Lefcourt, A.M. Some potential problems for measuring ammonia emissions from farm structures. Trans. ASABE 2002, 45, 1585–1591. [Google Scholar]
- Heber, A.J.; Ni, J.-Q.; Lim, T.T.; Tao, P.-C.; Schmidt, A.M.; Koziel, J.A.; Beasley, D.B.; Hoff, S.J.; Nicolai, R.E.; Jacobson, L.D.; Zhang, Y. Quality assured measurements of animal building emissions: Gas concentrations. J. Air Waste Manage. Assoc. 2006, 56, 1472–1483. [Google Scholar] [CrossRef]
- Hinz, T.; Linke, S. A comprehensive experimental study of aerial pollutants in and emissions from livestock buildings. Part 2: Results. J. Agric. Eng. Res. 1998, 70, 119–129. [Google Scholar] [CrossRef]
- Wheeler, E.; Casey, K.; Gates, R.S.; Xin, H.; Zajaczkowski, J.L.; Topper, P.A.; Liang, Y.; Pescatore, A.J. Ammonia emissions from twelve U.S.A. broiler chicken houses. Trans. ASAE 2006, 49, 1495–1502. [Google Scholar] [CrossRef]
- Topper, P.A.; Wheeler, E.F.; Zajaczkowski, J.L.; Gates, R.S.; Xin, H.; Liang, Y.; Casey, K. Ammonia emissions from two empty broiler houses with built-up litter. Trans. ASABE 2008, 51, 219–225. [Google Scholar] [CrossRef]
- Chepete, H.J.; Xin, H.; Mendes, L.B.; Li, H.; Bailey, T.B. Ammonia emission and performance of laying hens as affected by different dosages of Yucca schidigera in the diet. J. Appl. Poult. Res. 2012, 21, 522–530. [Google Scholar] [CrossRef]
- Mendes, L.B.; Xin, H.; Li, H. Ammonia emissions of pullets and laying hens as affected by stocking density and manure accumulation time. Trans. ASABE 2012, 55, 1067–1075. [Google Scholar] [CrossRef]
- Zhao, Y.; Pan, Y.; Rutherford, J.; Mitloehner, F.M. Estimation of the interference in Multi-Gas measurements using infrared photoacoustic analyzers. Atmosphere 2012, 3, 246–265. [Google Scholar] [CrossRef]
- Hassouna, M.; Robin, P.; Charpiot, A.; Edouard, N.; Méda, B. Infrared photoacoustic spectroscopy in animal houses: Effect of non-compensated interferences on ammonia, nitrous oxide and methane air concentrations. Biosyst. Eng. 2013, 114, 318–326. [Google Scholar] [CrossRef]
- Nicoloso, R.S.; Bayer, C.; Denega, G.L.; de Oliveira, P.A.V; Higarashi, M.M.; Corrêa, J.C.; Lopes, L.S. Gas chromatography and photoacoustic spectroscopy for the assessment of soil greenhouse gases emissions. Ciência Rural St. Maria 2013, 43, 262–269. [Google Scholar] [CrossRef]
- Griffith, D.W.T.; Leuning, R.; Denmead, O.T.; Jamie, I.M. Air–land exchanges of CO2, CH4 and N2O measured by FTIR spectrometry and micrometeorological techniques. Atmos. Environ. 2002, 36, 1833–1842. [Google Scholar] [CrossRef]
- Grutter, M. Multi-gas analysis of ambient air using FTIR spectroscopy over Mexico City. Atmosfera 2003, 16, 1–13. [Google Scholar]
- Hashmonay, R.A.; Yost, M.G.; Mamane, Y.; Benayahu, Y. Emission rate apportionment from fugitive sources using open-path FTIR and mathematical inversion. Atmos. Environ. 1999, 33, 735–743. [Google Scholar] [CrossRef]
- Eklund, B. Comparison of line– and point–source releases of tracer gases. Atmos. Environ. 1999, 33, 1065–1071. [Google Scholar] [CrossRef]
- Piccot, S.D.; Masemore, S.S.; Ringler, E.S.; Srinivasan, S.; Kirchgessner, D.A.; Herget, W.F. Validation of a method for estimating pollution emission rates from area sources using open-path FTIR spectroscopy and dispersion modeling techniques. Air Waste 1994, 44, 271–279. [Google Scholar] [CrossRef]
- Yasuda, T.; Yonemura, S.; Tani, A. Comparison of the characteristics of small commercial NDIR CO2 sensor models and development of a portable CO2 measurement device. Sensors 2012, 12, 3641–3655. [Google Scholar] [CrossRef] [PubMed]
- Calvet, S.; Campelo, J.C.; Estellés, F.; Perles, A.; Mercado, R.; Serrano, J.J. Suitability evaluation of multipoint simultaneous CO2 sampling wireless sensors for livestock buildings. Sensors 2014, 14, 10479–10496. [Google Scholar] [CrossRef] [PubMed]
- Jäger, F.; Wagner, G.; Meijer, H.A.J.; Kerstel, E.R.T. Measuring δ13C of atmospheric air with non-dispersive infrared spectroscopy. Isotopes Environ. Health Stud. 2005, 41, 373–378. [Google Scholar] [CrossRef] [PubMed]
- Frodl, R.; Tille, T. A high-precision NDIR CO2 gas sensor for automotive applications. IEEE Sens. J. 2006, 6, 1697–1705. [Google Scholar] [CrossRef]
- Park, J.; Cho, H.; Yi, S. NDIR CO2 gas sensor with improved temperature compensation. Procedia Eng. 2010, 5, 303–306. [Google Scholar] [CrossRef]
- Mendes, L.B.; Edouard, N.; Ogink, N.W.M.; van Dooren, H.J.C.; Tinôco, I.F.F.; Mosquera, J. Spatial variability of mixing ratios of ammonia and tracer gases in a naturally ventilated dairy cow barn. Biosyst. Eng. 2015, 129, 360–369. [Google Scholar] [CrossRef]
- Altman, D.G.; Bland, J.M. Measurement in medicine: The analysis of method comparison studies. Statistician 1983, 32, 307–317. [Google Scholar] [CrossRef]
- Hodgkinson, J.; Smith, R.; Ho, W.O.; Saffell, J.R.; Tatam, R.P. Non-dispersive infra-red (NDIR) measurement of carbon dioxide at 4.2 μm in a compact and optically efficient sensor. Sens. Actuators B Chem. 2013, 186, 580–588. [Google Scholar] [CrossRef] [Green Version]
- SenseAir®. Technical Note: SenseAir® CO2 Sensors on Pressure Sensitivity, TN-025; Delsbo, Sweden, 2010. [Google Scholar]
- Chagunda, M.G.G.; Yan, T. Do methane measurements from a laser detector and an indirect open-circuit respiration calorimetric chamber agree sufficiently closely? Anim. Feed Sci. Technol. 2011, 165, 8–14. [Google Scholar] [CrossRef]
- Christensen, J. Optical Filters and their Use with the Type 1302 & Type 1306 Photoacoustic Gas Monitors; Brüel & Kjær: Nærum, Denmark, 1990. [Google Scholar]
- USEPA. Environmental Technology Verification Report: Photoacoustic Infrared Monitor, Innova AirTech Instruments Type 1312 Multi-Gas Monitor; US Environmental Protection Agency: Albuquerque, NM, USA, 1998.
- Miles, D.M.; Rowe, D.E.; Owens, P.R. Winter broiler litter gases and nitrogen compounds: Temporal and spatial trends. Atmos. Environ. 2008, 42, 3351–3363. [Google Scholar] [CrossRef]
© 2015 by the authors; licensee MDPI, Basel, Switzerland. This article is an open access article distributed under the terms and conditions of the Creative Commons Attribution license (http://creativecommons.org/licenses/by/4.0/).
Share and Cite
Mendes, L.B.; Ogink, N.W.M.; Edouard, N.; Van Dooren, H.J.C.; Tinôco, I.D.F.F.; Mosquera, J. NDIR Gas Sensor for Spatial Monitoring of Carbon Dioxide Concentrations in Naturally Ventilated Livestock Buildings. Sensors 2015, 15, 11239-11257. https://doi.org/10.3390/s150511239
Mendes LB, Ogink NWM, Edouard N, Van Dooren HJC, Tinôco IDFF, Mosquera J. NDIR Gas Sensor for Spatial Monitoring of Carbon Dioxide Concentrations in Naturally Ventilated Livestock Buildings. Sensors. 2015; 15(5):11239-11257. https://doi.org/10.3390/s150511239
Chicago/Turabian StyleMendes, Luciano B., Nico W. M. Ogink, Nadège Edouard, Hendrik Jan C. Van Dooren, Ilda De Fátima F. Tinôco, and Julio Mosquera. 2015. "NDIR Gas Sensor for Spatial Monitoring of Carbon Dioxide Concentrations in Naturally Ventilated Livestock Buildings" Sensors 15, no. 5: 11239-11257. https://doi.org/10.3390/s150511239